Determination of SoH of Lead-Acid Batteries by Electrochemical Impedance Spectroscopy
by
 , ,
, ,
Monika Kwiecien
1,* ,
,
Julia Badeda
2,
Moritz Huck
1,
Kuebra Komut
1,
Dilek Duman
1 and
Dirk Uwe Sauer
1,3,4,5
1
Chair for Electrochemical Energy Conversion and Storage Systems, Institute for Power Electronics and Electrical Drives (ISEA), RWTH Aachen University, Jägerstrasse 17-19, 52066 Aachen, Germany
2
BatterieIngenieure GmbH, Huettenstraße 5, 52068 Aachen, Germany
3
Institute for Power Generation and Storage Systems (PGS), E.ON ERC, RWTH Aachen University, Templergraben 55, 52062 Aachen, Germany
4
Jülich Aachen Research Alliance, JARA-Energy, Wilhelm-Johnen-Strasse, 52425 Jülich, Germany
5
Helmholtz Institute Münster (HI MS), IEK-12, Forschungszentrum Jülich, Jägerstrasse 17-19, 52066 Aachen, Germany
*
Author to whom correspondence should be addressed.
Appl. Sci. 2018, 8(6), 873; https://doi.org/10.3390/app8060873
Submission received: 28 April 2018
/
Revised: 18 May 2018
/
Accepted: 23 May 2018
/
Published: 25 May 2018
(This article belongs to the Special Issue Battery Management and State Estimation)
Abstract
:Featured Application
State-of-health estimation on lead-acid batteries with cycling load profile.
Abstract
The aging mechanisms of lead-acid batteries change the electrochemical characteristics. For example, sulfation influences the active surface area, and corrosion increases the resistance. Therefore, it is expected that the state of health (SoH) can be reflected through differentiable changes in the impedance of a lead-acid battery. However, for lead-acid batteries, no reliable SoH algorithm is available based on single impedance values or the spectrum. Additionally, the characteristic changes of the spectrum during aging are unknown. In this work, lead-acid test cells were aged under specific cycle regimes known as AK3.4, and periodic electrochemical impedance spectroscopy (EIS) measurements and capacity tests were conducted. It was examined that single impedance values increased linearly with capacity decay, but with varying slopes depending on the pre-history of the cell and measurement frequency of impedance. Thereby, possible reasons for ineffective SoH estimation were found. The spectra were fitted to an equivalent electrical circuit containing, besides other elements, an ohmic and a charge-transfer resistance of the negative electrode. The linear increase of the ohmic resistance and the charge-transfer resistance were characterized for the performed cyclic aging test. Results from chemical analysis confirmed the expected aging process and the correlation between capacity decay and impedance change. Furthermore, the positive influence of charging on the SoH could be detected via EIS. The results presented here show that SoH estimation using EIS can be a viable technique for lead-acid batteries.
1. Introduction
The share of lead-acid batteries in installed batteries is still the highest of all battery technologies [1]. However, the attention paid to lead-acid batteries will abate in mobile applications with the replacement of the combustion engine by electric motors. Stationary installations lead-acid batteries will remain attractive if the costs stay competitive with respect to the costs of lithium-ion batteries. Typical stationary applications are uninterruptible power supply (UPS) systems, in which the batteries are float-charged until their stored energy is required. New business models for UPS systems plan an additional utilization for grid stabilizations, where the battery is charged or discharged to equilibrate peaks in the grid [2]. With such a new task, UPS systems become more attractive. Thereby, the utilization will change from mostly fully charged to partially discharged and frequently cycled. Accurate predictions of the state of health (SoH) become more crucial for an unobstructed operation of storage systems with lead-acid batteries.
The direct measurement of capacity for SoH determination together with the required full-charge for at least 24h is time-consuming, and the storage system is unavailable for its actual task. Moreover, the test itself ages the battery.
Many methods for SoH estimation are based on impedance measurements at only one frequency. Huet et al. summarized these methods and rated them as inaccurate and contradictory, basically because impedance information at only one measurement frequency are not sufficient [3]. Contradictory statements were found about the correlation between impedance and capacity loss [4,5]. Dependencies of the impedance on state of charge (SoC), temperature, and current rate [3] further impede the SoH estimation.
The benefit of a spectrum is an accurate determination of the ohmic resistance and the characterization of electro-chemical processes, which is not possible with an impedance measured only at one frequency. It seems likely that changes in these electro-chemical processes due to aging are superiorly detectable within the spectrum. For the testing of lead-acid batteries, it is commen to use electro-chemical impedance spectroscopy (EIS) [6,7,8,9]. However, for SoH estimation EIS was intensively applied on other battery technologies such as lithium-ion batteries [10,11,12], but not yet on lead-acid batteries.
During EIS, the battery is stimulated with a sinusoidal current (galvanostatic method) or voltage (potentiostatic method) of a defined amplitude and different frequencies. Karden et al. recommend charge or discharging the lead-acid battery with a constant current and a limited SoC change of not more than 5% during EIS to obtain reproducable spectra [13]. This limits the possibly measured frequencies. However, the superimposed DC-current ensures the measurement of only the charge or discharge process and not both.
In lead-acid batteries, the main gradual aging processes can be classified as sulfation, corrosion, or shedding [14]. Sulfation describes the accumulation of sulfate crystals on the surface of the electrodes. The low conductivity of the crystals provokes local inactivity with consequently inaccessible parts of capacity [15]. Sulfate crystals are the product of the discharge reaction on both electrodes and are dissolved during the recharge process. In applications, in which the battery is in partial SoC, these crystals grow with diminishing solubility over time until the crystals cannot be further dissolved during the usual charging strategy. Due to the smaller surface area in comparison to the positive electrode, the negative electrode suffers more from sulfation [16].
Corrosion of the positive grid dominates the aging processes if the potential of the positive electrode and the temperature are permanently increased. With the corrosion, the cross-section area of the grid and the connection between the grid and the active mass, decrease [14]. This aging process reduces the efficiency of the battery. Shedding of the active mass occurs during deep cycling. As the active mass in lead-acid batteries is consumed during discharging and regenerates during charging, the porous structure rebuilds with every cycle. Parts of the active mass lose its connection to the electrode and are not available as capacity anymore. Specifically, the active mass of the positive electrode becomes weaker with deep cycling [14]. It is expected that, during these aging processes, the spectrum of the lead-acid battery changes, with a clear correlation to the capacity decay.
The question is of why contradictory statements were found about this correlation. One possible explanation is the variation of measurement conditions. Known dependencies of the impedance on temperature, SoC, and current are relatively easy to control. In this paper, the influence of previous charging and discharging events is analyzed. Furthermore, a shift of the time constants of the electro-chemical processes during aging is likely, and alters the frequencies at which certain processes are measured. A possible shift of the frequency, where the ohmic resistance is located, is investigated here.
Furthermore, for a valid interpretation of impedance spectra, their correct processing and their limits for SoH estimation have to be asserted. For the investigation of electro-chemical processes, the system has to be linear and time-invariant during the EIS. While the linearity can be provided by measurement settings, the time invariance needs to be verified after the measurement.
In this work, the limitations of impedance spectra for SoH estimation are determined. Therefore, lead-acid test cells were built based on two positive electrodes and one negative electrode. The test cells were aged with cycling profiles in partial SoC to force sulfation on the negative electrode. Regular check-ups, consisting of the measurement of residual capacity and EIS were performed. Afterward, the validity of the spectra was verified before they were fitted to an equivalent electrical circuit. The fitted values of the ohmic resistance and the charge-transfer process of the negative electrode are of interest, as it is expected that these values are affected the most by sulfation. At the end of the aging test, the magnitude of sulfation on the electrodes were determined by chemical analysis.
2. Materials and Methods
2.1. Lead-Acid Test Cells and Measurement Equipment
The lead-acid test cells consisted of one negative plate enclosed by two positive plates with separator bags. The plates and the separator bags were taken out of a commercial lead-acid starter-battery, wherein they were formatted by the manufacturer. Two lead wires (99% lead, 4 thickness) per plate were welded on the lug of the plates, one wire for the current flow and the other to measure the voltage. Shrink tubes around the wires prevented short circuits. With this 4-point measurement configuration, the measured impedance of the electrodes did not contain the impedance of the wires or the welding spot.
PVC boxes were used as test cell housing and were filled with 1250 mL of sulfuric acid with a density of 1.28 gcm-3 ± 0.02 g·cm. The nominal capacity of the test cells was 10 Ah, which is the nominal capacity of the commercial battery (70 Ah) reduced by the ratio of plates in the test cell and the commercial battery (8 negative and 7 positive plates). All capacity-dependent values are related to the nominal capacity of 10 Ah here. The current rates are given here as a multiple of the I rate, which is the current to discharge the nominal capacity within 20 h, here 0.5 A.
To avoid stratification of the acid during the aging tests, the cells were equipped with a mixing system, illustrated in Figure 1. The PVC box has two small side compartments and the main compartment containing the plates. The walls separating the compartments are perforated. The holes at the top and the bottom of the walls are open, while the other holes are closed. Air is pumped over a PVC tube into the left compartment. The ascending air bubbles transport the higher concentrated acid from the bottom of the compartment to the top. This movement of the acid provokes the suction of the acid from the bottom of the main compartment to the left compartment and generates a circulation of the acid in the test cell. This system mixed the whole volume within 15 min.
The test cells were equipped with a hydrogen reference electrode HydroFlex from Gaskatel for a pH range from −2 to 16, which is suitable for temperatures from -30 °C to 200 °C. With the reference electrode, the impedance of the negative electrode was measured separately from the impedance of whole cell. The acid-resistant temperature sensor AD590 from Digatron with a range of -30 °C to 100 °C and an accuracy of +-1 °C measures the acid temperature in a side compartment. The test cells were connected to a Digatron test rig (MCT 10-06-12 ME), which can set voltages between 0 and 6 V (±0.2% accuracy) and currents up to +-10 A. For EIS, the EISmeter of the company Digatron was used. The EISmeter has a measurement range from 0.3 to 3000 Ω with an accuracy of ±1% for the impedance amplitude and ±1 for the impedance phase shift. It stimulates the cell with a sinusoidal current and measures the voltage response. The current amplitude is controlled by the voltage response amplitude such that the voltage amplitude does not exceed a maximum value, which is set to 1.5 mV.
2.2. Measurements and Aging Tests
As an initial process, all test cells were fully charged via constant-current-constant-voltage charging (5I, 2.6 V) for 30h at 25 °C . After a pause of 4 h, the test cells were discharged with I until the voltage reached 1.8 V to determine a capacity value. The test cells were recharged afterward for 24 h with the same charging strategy followed by a second pause of 24 h. Subsequently, the SoC was set to 80% with I. After a 5h rest period, impedance spectra were measured with superimposed DC currents of ±4.5I, ±1.5I, ±8I, ±3I, ±1I, ±6I, and again ±4.5I at the end. The test cells were alternately discharged and charged with the denoted current rates by 5% of the nominal capacity. For every current rate, this cycle was performed twice. The EIS started after ±1% was charged or discharged. This method is described as a mini-cycle technique by Karden et al. [13] and was optimized by Budde-Meiwes et al. [17]. Impedance spectra were recorded with 8 frequencies per decade. The measurement started with the maximum frequency of 6 kHz and ended with the minimum frequency of 3 Hz for ±8I and 6mHz for ±1I. The measurement duration and therefore the number of frequencies were limited by the maximum SoC change of 5%. The measurement of impedance spectra was repeated for 40% and 0% SoC. The initial process is shown in Figure 2.
Two cycling tests were performed on the test cells. The first cycling aging test, named here hard AK3.4, is based on the cycling test AK3.4, which is a standard aging test for starter-batteries for micro-hybrid applications [18]. It produces hard sulfation on the negative electrode, which is the reason for the capacity decay. A minimum SoC of 50% was set for the cycling with −5I. One cycle started with 40min charging with I and a voltage limit of 2.4V and ended with 30min discharging with I. In total, 85 cycles were performed, which involved 15 charge and discharge cycles of full nominal capacity (full cycles equivalent (FCE)). After cycling, the residual capacity was discharged with I until 1.8 V was reached. This residual capacity was recharged again with a constant-current-constant-voltage charging (5I, 2.6 V). Subsequently, the cycling starts again. During the test no full charge of 24 h is performed to speed up the aging process, as a full charge would dissolve the sulfate crystals. Five hours after cycling and 5 h after recharging, EIS was performed in the same way as that of the initial process. With these EIS measurements recorded after different pre-histories (after cycling and after recharging), the dependency of impedance on the treatment of the cell could be analyzed. No defined SoC was set for the measurement of the impedance, as a full recharge would therefore be required.
Due to the fact that other research groups working with lead-acid batteries obtain impedance spectra without a superimposed DC-current [6,8,9,19], impedance spectra without a superimposed DC-current were additionally obtained for comparison. These spectra were recorded at the end of the 5 h rest periods after cycling and after charging. The spectra are difficult to interpret, so the results and the reason for the issue of not being interpretable are presented in Appendix A. The spectra without a superimposed DC-current are not considered further in the discussion.
A second version of the cycling test, named soft AK3.4 here, contains a frequently full charge of 24 h after the discharge of the residual capacity, followed by a pause of 24 h and a discharge phase to 80% SoC for EIS measurements.
Two test cells were used for the hard AK3.4 and soft AK3.4 aging tests, respectively. An overview of the aging tests, the corresponding aging processes, and the measured impedance spectra are given in Table 1.
The measured voltage, current, and temperature as well as all impedance spectra were provided in a Matlab file format.
2.3. Processing of Measurement Data
Impedance spectra are usable for analysis if the measured system was linear and time-invariant (LTI system). The time invariance can be checked with a method named zHit after completion of one spectrum. For this, the impedance amplitude at a defined frequency was calculated from the measured phase shift using Equation (1), with as arbitrary, but with a fixed impedance amplitude and with as a correction factor. The starting frequency for integration is selected arbitrarily out of the measured frequencies. At least two impedance values are required to verify the validity of one impedance value because of the derivative of the phase shift in the equation. More details on the zHit method are described in [20].
The calculated value was compared with the measured amplitude. If the amplitudes were different, the system was time-variant during the measurement, which can be induced by diffusion processes, for example, during the charging or discharging with a superimposed DC-current. The difference was never zero due to noise in the measurement, so a maximum difference of 0.15 mΩ as a validity limit was defined, and impedance values with greater differences were defined as invalid. This criterion is named as TI criterion here. The linearity of the impedance spectra could not be verified after the measurement. To ensure linearity, the amplitude of the sinusoidal voltage amplitude has to be as small as possible with an adequate signal-to-noise ratio. Here, an amplitude of 1.5 mV was used, which ensured linearity [21].
To ascertain the usability of impedance spectroscopy for the SoH detection, the impedance spectra were analyzed in two ways. First, the change of single impedance values at fixed frequencies during the aging test was analyzed to check if single impedance measurements were sufficient for diagnostic measurements. The impedance of the battery could be approximated with an equivalent electrical circuit (EEC) containing a resistance () in series to an induction L and an RC-element (resistance parallel to a capacitance C). Single frequency impedance measurements can determine the ohmic resistance of the battery [3]. For the determination of , the correct measurement frequency has to be as high as possible. Thereby, the second term in Equation (3) becomes infinitely small and the measured impedance should contain only the ohmic resistance and an inductive imaginary part (see Equation (2)). Either the imaginary part is determined and can be separated from the real part or the impedance value at lower frequencies, where the spectrum crosses the x-axis, has to be taken as . Here, the impedance amplitude at the point where the spectrum crosses the x-axis was extracted together with the corresponding measurement frequency. It is verified if the frequency varies during the aging tests and if it affects the SoH estimation using .
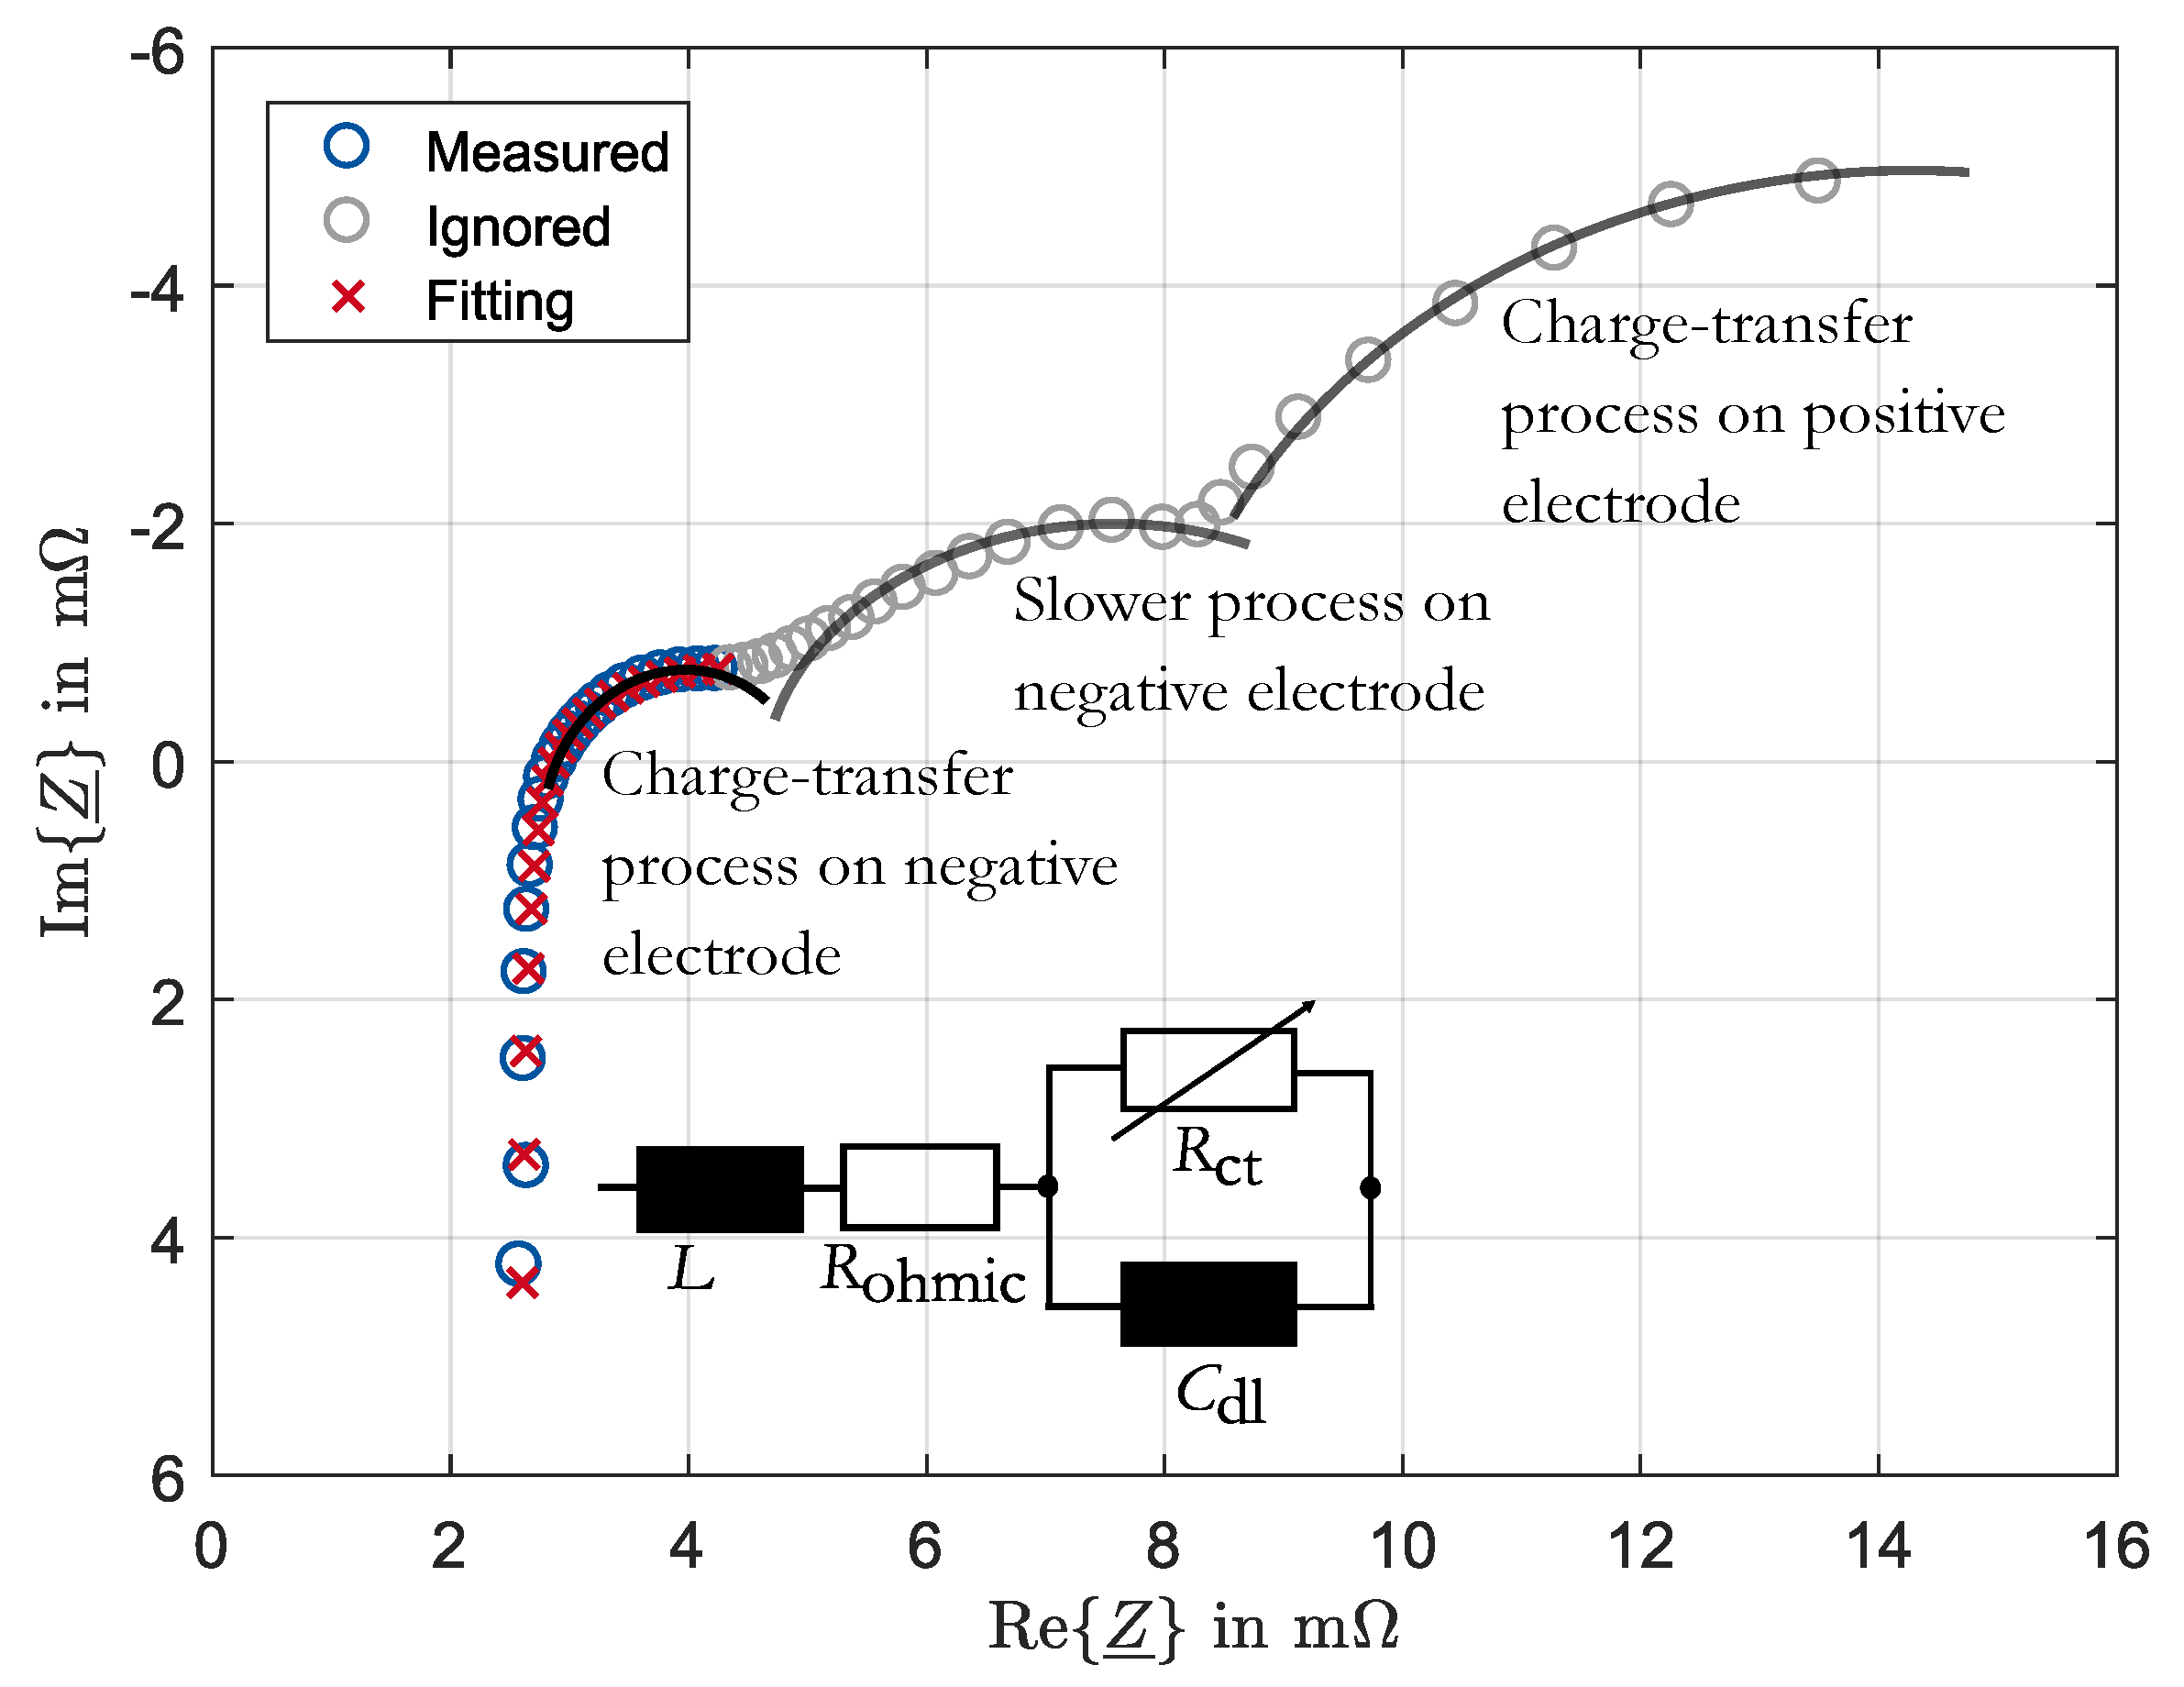
As a second method, the impedance spectra were fitted to an EEC with an inductance L, an ohmic resistance , and one RC-element connected in series. The impedance spectrum is illustrated as a Nyquist diagram, with the real part on the x-axis and the imaginary part on the y-axis. An example is shown in Figure 3. In this representation, the spectrum of lead-acid batteries appears as half-circles and tails at high and low frequencies, respectively. The high-frequent tail around 1 kHz has an inductive imaginary part and originates from the connections of the battery. At the point where the spectrum crosses the x-axis, the impedance has only a real part and approximately describes the ohmic resistance. The first half-circle after the tail toward decreasing frequency is the charge-transfer process at the negative electrode [9]. The second half-circle is explicitly visible, when the spectrum of the negative electrode is measured separately from the whole battery. The origin of this half-circle is unknown, but an adsorption process on the surface of the electrode is assumed [9,22]. The charge-transfer process at the positive electrode generates the third half-circle at frequencies below 100 mHz. This charge-transfer process is impaired by diffusion, when the half-circle turns into a tail [22].
The RC-element contains the charge-transfer resistance and the double-layer capacitance . The double-layer capacitance is modeled as constant-phase-element (CPE). This EEC describes only the part of impedance spectrum, which corresponds to the charge-transfer process of the negative electrode together with the ohmic resistance and inductance of the whole cell and was described by Thele [23]. The remaining impedance spectrum toward lower frequencies describes the unknown process on the negative electrode and the charge-transfer process on the positive electrode. This part is not further analyzed here, as most of the measurement points do not describe a LTI system, what is shown in the results section of this paper. Therefore, and because sulfation occurs mostly on the negative electrode, these points were ignored during the fitting processes. The fitting of an EEC allows a more accurate determination of . With the determination of , the change of the charge-transfer process—not only a single impedance value of an unknown electro-chemical process—can be analyzed. The impedance spectra recorded on the whole cell and not on the negative electrode were fitted, as the spectra of the negative electrode do not contain information of the ohmic resistance of the whole cell. An example of a fitted impedance spectrum and the ignored part of the spectrum with the EEC are shown in Figure 3.
As a fitting tool, a graphical user interface (GUI) was used, which was developed at our institute. It is implemented in Matlab to automatically fit impedance spectra and pulses to different EEC. The GUI is available as open source: https://github.com/HWitz/FittingGUI.
2.4. Chemical Analysis after Cyclic Aging
At the end of the cyclic aging tests, the test cells were disassembled and samples of the plates were taken to determine the amount of sulfur oxide () in the active mass. This determination was performed with an ICP-OES 725 from Varian. With this method, a distinction between the sulfur in the acid and in the lead sulfate in the active mass is not possible. To dissolute the acid in the active mass, the samples were stored in water for 24 h to flush out the acid. Afterward, the samples were air-dried for 12 days followed by an additional drying phase in a drying cupboard (50 °C, 7d ays). For the measurement, the sulfur oxide was dissolved from the samples with an aqua regia dissolution. Three samples were taken from every plate: from the top, middle, and bottom parts. In total, 9 samples per test cell were available.
3. Results
The results from the cycling tests—hard AK3.4 and soft AK3.4—are presented. The loss of residual capacity after cycling is the difference between the measured capacity at the beginning and the residual capacity measured during aging tests. The decay of over the full cycles equivalent (FCE) for all four test cells (TC) are presented in Figure 4. Additionally, the cell voltages measured at the end of the 5 h pauses after cycling and recharging are shown in the second graph of this figure. These open-circuit voltages (OCV) presented here are still superimposed by over-potentials, as the duration for the voltage to relax after charging or discharging required longer pauses for lead-acid batteries [24].
From the beginning of the aging test until 90 FCE, and of hard AK3.4 and of soft AK3.4 had similar rates of capacity decay. Toward the end of the aging test, the capacity of in the hard AK3.4 test decreased faster and ended at 0.94 Ah after 135 FCE, while the last capacity of in the hard AK3.4 test was at 2.84 Ah after 150 FCE. In both cases, the test was interrupted after the discharge voltage dropped below 1 V during cycling. in the soft AK3.4 test lost its capacity with the fastest rate. After 90 FCE, the residual capacity was 0.82 Ah, which is also when the voltage dropped below 1 V. It seems that in soft AK3.4 was not correctly reassembled, but results from this test cell are presented and discussed here. The aging test on in soft AK3.4 is still ongoing.
The SoC during the hard AK3.4 cycling test was not set periodicaly with a full charge of the test cells. Therefore, the SoC during the check-up can only be assumed with the observation of the OCV right before the impedance measurement after cycling and after recharging. In Figure 4, the OCV values differ between the test cells, which is caused by differences in acid concentration. The measured OCV values after recharging are higher than after cycling. This is caused by over-potentials from the charging phase rather than an increased SoC. Charging over-potentials can remain from hours to days in a lead-acid battery. This behavior has been analyzed by Pilatowicz et al. [24]. The OCV values measured after cycling might be superimposed by over-potentials as well. The OCV values of soft AK3.4 measured after cycling, compared with those of the hard AK3.4 test, indicate either a higher SoC or higher over-potentials. In hard AK3.4, the values decrease by at least 2 mV and at most 15 mV from the beginning to the end of the aging tests. This indicates an SoC drop during the test. It can be assumed that the decrease in measured is provoked not only by sulfation but also by the SoC decrease. In the test cells, the OCV changes only by 0.25 mV with an SoC change of 1%. Based on the measured OCV values and the OCV SoC relationship, the SoC of in hard AK3.4 would decrease by 60%, and the in hard AK3.4would decrease by 25%. These SoC changes are assumptions, as a correct SoC estimation using OCV would require significantly longer rest phases until the measured voltage no longer over-potentials [24].
During the soft AK3.4 test, the test cells were frequently recharged for 24 h, so that after charging the SoC could be set. The OCV values during soft AK3.4 varied, but they did not decrease continuously.
3.1. Validity of Impedance Spectra
The TI criterion for a valid impedance value was defined based on the difference between measured and calculated impedance amplitude using the zHit method. The maximum difference allowed here is 0.15 mΩ, which is around 5% of the smallest impedance amplitude measured on the test cells. For the analysis, only parts of the spectra can be considered, which fulfills this criterion, as only these parts describe a time-invariant system.
In Figure 5, impedance spectra are presented. They were recorded on during hard AK3.4 with discharging superimposed DC-currents after the first cycling phase of the aging test (after 15 FCE). In the Nyquist diagrams, the time-invariant impedance values are marked with squares. Additionally, the measured and calculated impedance amplitudes are shown together with their absolute difference. For superimposed discharge currents, all measured points pass the criterion at frequencies above 0.1 Hz. For I, impedance spectra were recorded only down to this frequency (see Section 2.2). The impedance values of lower frequencies do not correspond to a time-invariant system.
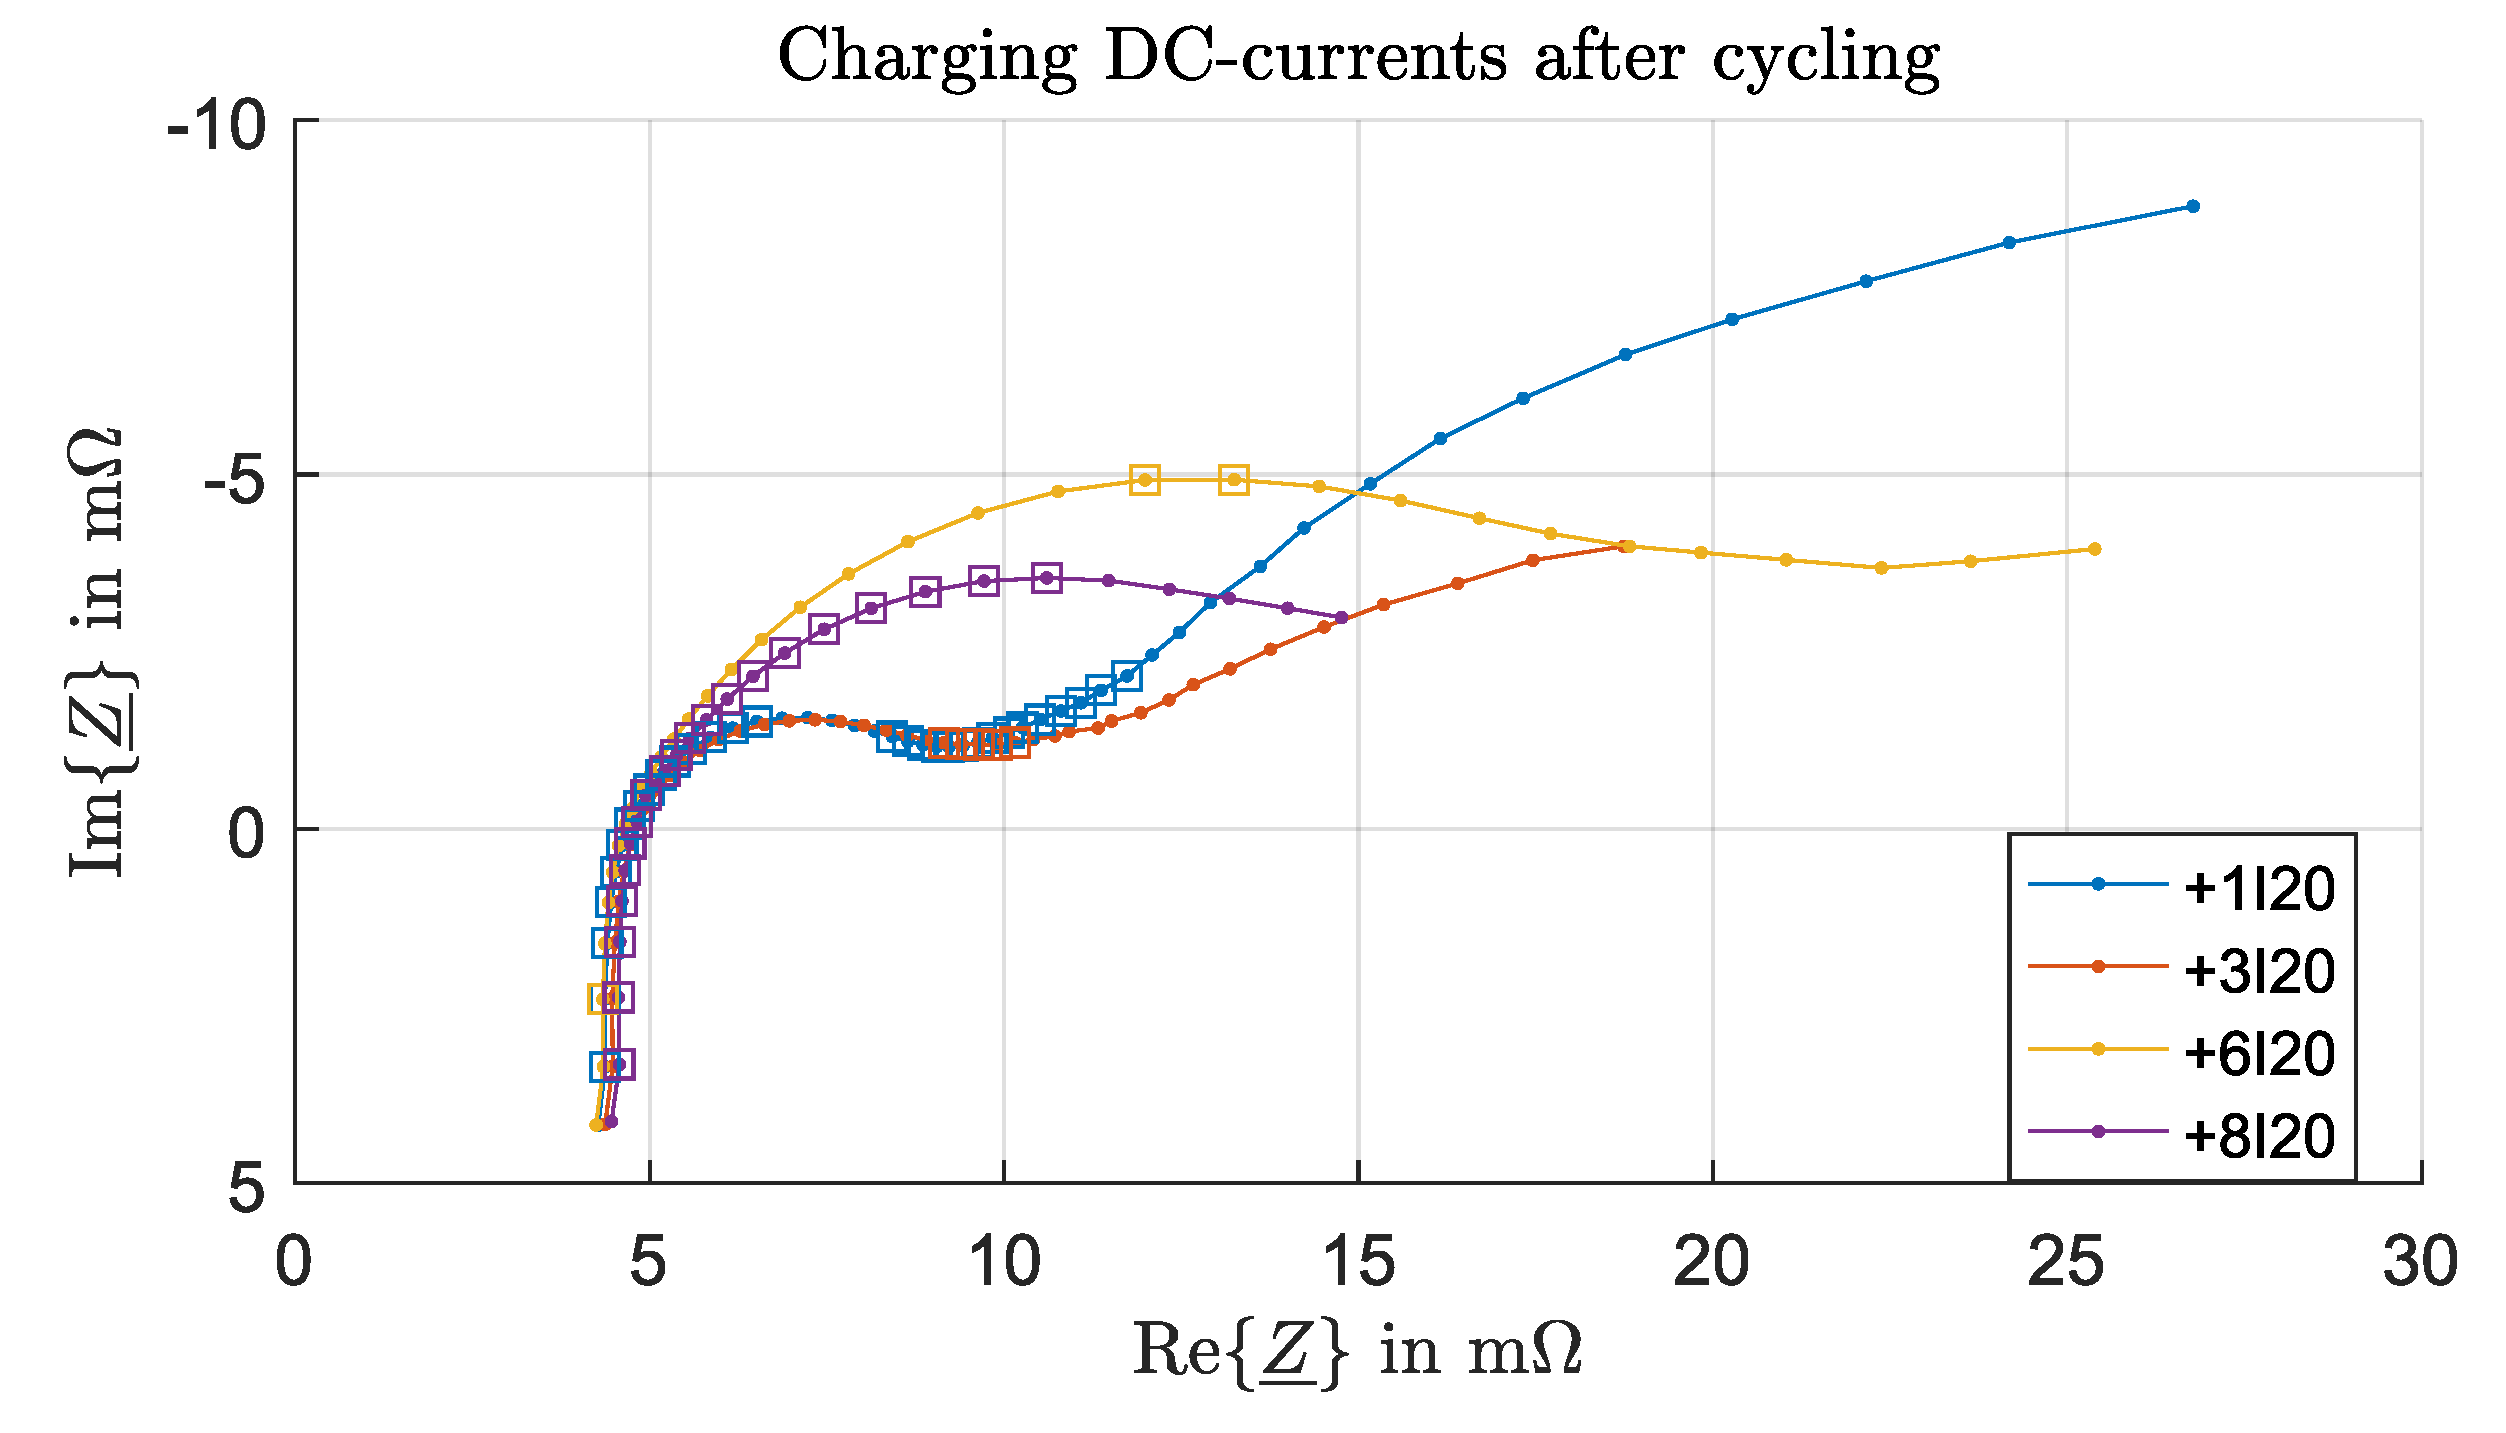
Figure 6 shows the impedance spectra with charging DC-currents. The same measurement points of the I spectrum are invalid as of the I spectrum. In the first I spectrum, points until 1 Hz are valid. The repeated I spectrum and the I spectrum recorded at the end of the check-up have invalid measurement points also at high frequencies around 100 Hz.
These observations can be made for the other test cells as well (presented as supplementary material). In general, it can be said that, for high charging currents, a significant part of the spectrum, which also comprises the negative electrode, is invalid. Toward smaller charging currents and discharging currents, this part of the negative electrode can be used for analysis. Mostvalues of the positive electrode spectrum part are invalid—regardless of which DC-current was used.
In Figure 7 and Figure 8, impedance spectra of aged in hard AK3.4 are presented, which were recorded after the cycling (graphs on the top) and after the recharging phase (graphs on the bottom) at the end of the aging test (120 FCE). All spectra with discharging DC-currents shown in these figures have enough valid points to analyze the ohmic resistance and the charge-transfer process of the negative electrode. In all spectra with charging DC-currents, compared with spectra with discharging DC-currents, independently of previous cycling or charging treatment, more points infringe on the TI criterion. Further noticeable is that the I spectrum has a higher number of valid measurement points than the I spectrum recorded after the cycling and charging phase. For all check-ups, it could be observed that, toward the end of the check-up, fewer points in the spectra with charging DC-current satisfy the TI criterion.
In the spectrum with I DC-current recorded after cycling, the first half-cycle is not fully visible. With this shape, the fitting of and does not provide a distinct result. Single spectra with I and I DC-current had a similar shape, so the spectra of these DC-currents could not be used for the entire aging test.
Spectra measured after recharging show a different shape than the spectra measured after cycling. The first half-cycle is larger and is lengthened toward greater values of . For high charging currents (I and I), the first half-cycle is not even visible, as the spectrum consists of a straight line. While most points of the spectra with a superimposed discharge DC-current correspond to an LTI system, only the spectrum with I of the spectra with charging DC-currents has a series of valid measurement points at high frequencies. For the other charging DC-currents with charging pre-history (Figure 8), not even the high-frequency part of the spectra fulfills the TI criterion. This could also be observed in single spectra with discharging DC-currents measured after recharging and to the end of the aging test.
All spectra recorded during soft AK3.4 at 80% SoC have a sufficiently large time-invariant part at the beginning of the aging test, independently of the DC-current. With progressing aging, test spectra recorded with charging DC-currents or after recharging have fewervalid data points. Spectra with small discharge currents, recorded after the cycling phase, have enough valid points in the first half cycle of the negative electrode throughout the aging tests (provided as supplementary material).
To summarize the observations, spectra with superimposed small discharge currents can be used for analysis, independently of the aging state. Spectra with superimposed charging currents can be used if they were recorded after cycling, with small DC-currents between I and I and at the beginning of the aging tests. Therefore, only the spectra with small discharge currents of I to I are further analyzed.
3.2. Single Impedance Values over Capacity Decay
In Figure 9, impedance spectra measured on and of hard AK3.4 are shown. They were measured with I DC-current and after 15–135 FCE. The spectra of the whole cell are on the left side, and the spectra of the negative electrode are on the right side. Only impedance values of frequencies between 6 kHz and 80 mHz are presented, as they fulfill the TI criterion. This part of the spectrum corresponds to the ohmic resistance and the negative electrode. Impedance values of the positive electrode are only present in the tail of the whole cell spectrum as a superposition with impedance values of the negative electrode.
For all spectra, an increase in in the high-frequency part is visible. The increase of the first half-cycle is well recognizable in the spectra of the negative electrode. For both test cells, the radius of the first half-cycle indicates a steeper increase toward the end of the aging test. Although the test cells had similar impedance spectra at the beginning of the aging test, the first half-cycle in the spectrum of is considerably larger than in the spectrum of . ended the aging test with a smaller capacity than .
Figure 10 shows single impedance values measured at all test cells after cycling and after charging phase (or at 80% SoC accordingly) over capacity loss . The first values after cycling phase and after charging for hard AK3.4 are from the check-up after 15 FCE and not from the initial impedance measurements. In the upper graph, the frequencies at which the impedance contains nearly onlya real part are given. This frequency increases with increasing capacity loss for all test cells and independently of the pre-history. The frequencies are defined by the EISmeter and have the discrete values of 336 Hz, 450 Hz, 600 Hz, 800 Hz, and 1067 Hz.
In the middle graph, the corresponding impedance amplitudes, at which the imaginary part is nearly zero, are plotted. The values with cycling pre-history are very similar during the aging test, while the values measured after charging have different trends depending on the aging test. The test cells in the soft AK3.4 test show a slower increase in the impedance than the test cells in the hard AK3.4 test.
In the lower graph, impedance amplitudes at fixedfrequencies of 0.1 Hz, 10 Hz, and 1 kHz are presented. The values of the same frequency change their location in the spectrum over the aging test, because the time constants of the processes change. This is shown in Section 3.3 for the charge-transfer process on the negative electrode. At 1 kHz, the impedance amplitudes measured after cycling have similar values. The maximum difference is 1.2 mΩ. For lower frequencies, the differences between the smallest and largest amplitude amount to 6 mΩ for 0.1 Hz and 3 mΩ for 10 Hz. With decreasing frequency, the variance increases, both for charging and cycling pre-history. The impedance amplitudes after charging in the hard AK3.4 test are all greater than the values from the soft AK3.4 test at 80% SoC.
The average increase rate of the impedance amplitude over capacity decay is given in Table 2. Further impedance values measured with I DC-current are provided as supplementary material as well as the corresponding increase rates. For high frequencies, the increase rate after the cycling phase between I and I is almost equal. The rates for all other conditions are different. Toward lower frequencies, the rates increase.
3.3. Variation of EEC Elements during Aging
In the following, the fitting results for the negative electrode are described. In Figure 11, the values of all test cells, both pre-histories and for I and I DC-currents, are shown.
The ohmic resistance of all test cells and pre-histories increases during the aging test. measured after the cycling of test cells in soft AK3.4 increases faster with -0.207 mΩ/Ah than the values measured at 80% SoC with -0.098 mΩ/Ah. The behavior of is current-independent.
values increase as well. The only difference of values between the different DC-currents is that the values decrease with increasing DC-current, which is known for the charge-transfer resistance [25].
The time constant of the negative electrode is the product of charge-transfer resistance and double-layer capacitance. For the test cells in the hard AK3.4 test, the measured values after charging show an initial increase before they decrease during the aging test, like all other curves. This initial increase can be also observed for . An explanation for this behavior could not be found. Furthermore, the time-constant values differ between the pre-histories (cycling and charging) during the whole hard AK3.4 aging test, while this is observed only at the end of the soft AK3.4 test. The time constants decrease at a rate of 0.24 ms/Ah during soft AK3.4 and, during hard AK3.4, at 2.1 ms/Ah after cycling and 2.9 ms/Ah after charging.
3.4. Determined Amount of Sulfur in Active Mass after Cyclic Aging
In Table 3, the rates of sulfur oxide measured in the positive and negative active mass of and after the hard AK3.4 test and of after the soft AK3.4 test are composed. The rates are given in % relative to the mass of the probes of 190 mg on average.
All positive plates have a relative amount of not more than 1.41%, whereas the amount of sulfur oxide in the negative plates is increasing from 1.35% and 9.94% at the top to 8.4% and 23.36% at the bottom. has more sulfur oxide in the negative active mass than of hard AK3.4 and of soft AK3.4 . Only the negative electrodes sulfated with an inhomogeneous distribution during both tests.
4. Discussion
Cycling aging tests were performed on lead-acid test cells to force sulfation. The chemically determined rates of sulfur oxide in the active mass confirmed the sulfation on the negative electrode. The rates of sulfur oxide increased from the top to the bottom of the electrode, even though the acid was mixed during the test. This indicates that the charging current that is meant to dissolve the lead sulfate crystals, compared with the previous discharging current, was smaller in the bottom. Due to the finite conductivity of the grid, the current density reduces to the bottom. The local current density defines the charge-transfer resistance. With increasing density the resistance decreases. This relation is asymmetric between charging and discharging direction with the maximum charge-transfer resistance at charging currents for the negative electrode [23]. Hence, the current density is smaller at the bottom during charging than during discharging, which favors sulfation in the bottom.
Three of the test cells aged with a similar capacity decay over . Two test cells finished the aging test with less than 1 Ah and with the largest impedance values, while one test cell had more than 2 Ah of capacity left with smaller corresponding impedance values. The cell in which the highest rate of sulfur oxide was measured had also the smallest residual capacity and the highest impedance values. The high rate of sulfur oxide indicates a high rate of accumulated lead sulfate crystals in the acitve mass, which increases the ohmic resistance of the active mass and reduces the available surface area for the charge-transfer process. Thus, the increased measured impedance is reasonable. The corresponding lower residual capacity is caused by the increased impedance, as the end-of-discharge voltage limit during the capacity check was reached earlier. These results indicate a good correlation between the measured impedance and the residual capacity.
However, previously found correlations between capacity decay and impedance change varied [3]. Possible influence factors such as varying temperature, SoC, and current rate during the check-up are known. The validity of the impedance values were verified here with the zHit method to analyze whether the invalidity might be an additional issue. Impedance spectra recorded with small superimposed discharge currents were valid over the whole measured frequency range, independently from the pre-history and during the complete aging tests. Thereby, these spectra are usable for SoH estimation.
For spectra with charging DC-currents, compared to those with discharging DC-currents, the number of valid points was in general smaller. Furthermore, these spectra lost more valid points from low frequencies toward high frequencies during the check-up process and the aging test. Even the charging pre-history reduced the validity significantly of spectra with charging DC-currents in comparison to the spectra with discharging pre-history. Impedance spectra recorded at the end of the aging test with charging DC-currents and with charging pre-history had no valid data points, even at the frequency range of the ohmic resistance.
An invalid impedance value indicates a system that is not in steady state during the measurement. At the beginning of the aging tests, slow diffusion changes the state of cells during EIS, such that only impedance values at low frequencies are affected. Toward the end of aging, a fast process in the cell falsified impedance values at frequencies above 100 Hz. It is assumed that a distinct inhomogeneous sulfation of negative electrode continuously changed the current distribution before and during EIS. With the presence of lead-sulfate crystals, the probability is higher that newly generated lead-sulfate accumulates on these crystals than the probability of the generation of new small crystals during discharging. During charging, more small crystals are dissolved than large crystals due to the smaller ratio of the surface area and the volume of large crystals [26]. During the aging test, large crystals accumulate at the bottom, so fewer small crystals are generated at the bottom than at the top during discharging. Therefore, the few small crystals at the bottom are dissolved very fast, so the amount of ions decreases quickly at the bottom, while the amount is still sufficient at the top of the electrode. With a low number of ions, the resistance of the charge-transfer process increases. This process moves from the bottom of the electrode to the top. This could be a reason for the permanent change of the state from the beginning of EIS to the end with consequently useless impedance spectra with charging DC-currents. For the discharge direction, the required in the acid is adequately available [27], so this effect is not present in the spectra with discharging DC-currents.
Single impedance values of different test cells increased at the same rate and had similar impedance values during aging, provided that pre-history, frequency, and DC-current were equal; otherwise, the rates varied. The most critical dependency here is the pre-history, as this is the less controllable factor in the field. The rates of change (see Table 2) measured after cycling were all greater than after charging. This effect was more distinct for lower frequencies, where electro-chemical processes are present.
An explanation for this observation is difficult to find considering only single impedance values. To which electro-chemical process the values correspond is unknown. The fitted parameters of the EEC, however, provide a better basis for finding an explanation, as they can be directly linked to an electro-chemical process. shows the same rate of increase for all pre-histories. Only at 80% SoC in the soft AK3.4 test is the increase slower. This is equal to the 1 kHz values. is also always smaller at 80% SoC compared with after cycling during soft AK3.4. Assuming a beneficial effect of the 24 h charging phase in soft AK3.4 in the form that large sulfate crystals were partly dissolved, the reduced sulfation provokes reduced resistances for the current flow and the charge-transfer process. This effect seems to disappear during cycling, as the resistances were increased after cycling. Furthermore, the aging tests ended with the voltage drop below 1 V during the cycling phase. The time-constant values determined during soft AK3.4 confirms the theory. They decrease with a smaller rate than during hard AK3.4. This indicates a slower decrease of the double-layer capacitance and therefore a slower sulfation. Only at the end of the soft AK3.4 aging test on does the time constant measured after cycling become equal to the values of hard AK3.4.
The fitted values of the hard AK3.4 test show a more complex behavior. The time-constant values after charging were greater than after cycling because of the increased values. They were also greater than during soft AK3.4, which indicates a larger double-layer capacitance. Maybe this is an effect of the shorter pause and missing discharge phase between the charging phase and EIS in hard AK3.4. The remaining ions from the charging phase in the acid near the electrode surface () might increase the double-layer capacitance but impede the charge-transfer process in the discharge direction.
measured after cycling dropped below 0.01 s for all test cells, when the aging test finished. At the same time, was twice as high as at the beginning. The values of increased continuously but were slower than . The ohmic resistance depends on the cross-section area of the grid, on the contact area between the grid and the active mass, on the average length and conductivity of the current path through the active mass, and finally on the contact surface between the active mass and electrolyte and the ionic conductivity of the electrolyte. It is assumed that only the average length of the current path through the active mas and conductivity of the active mass changed during aging, because of the accumulation of highlyresistive lead sulfate crystals in the active mass.
The charge-transfer resistance instead depends on the electro-chemically active surface area of the electrode and the current density [25]. The active surface area decreased as well because of the sulfate crystals; however, with decreasing surface area the local current density increased, which in turn reduced again.
No clear differences in the capacity decay between hard AK3.4 and soft AK3.4 could be observed here. However, based on the available data, it cannot be excluded that the test cells show a greater FCE in soft AK3.4. most likely had a defect, and did not reach the end of the test. In the fitted data, clear differences between the tests are visible.
Although all curves change linearly over capacity decay, the variation of the slopes makes it necessary to measure the impedance after the same pre-history, preferably after cycling. For every single application, it is necessary to verify whether this is possible. An algorithm can search for frequently appearing patternsduring operation to find good timing for measuring meaningful impedance values. However, the individual impedance change over capacity decay should be established for proper SoH estimation. Hence, capacity tests are indispensable but could be performed less often. Last but not least, the verification of time invariance has to be performed, for which at least two impedance measurements at different frequencies are compulsory.
An algorithm for SoH estimation does not necessarily have to fit an EEC to an impedance spectrum, as a linear correlation is present already for single impedance values. However, the distinction between and is only possible with the fitting of an EEC and can contain more distinct information about the type of aging. This will be analyzed in the future with impedance spectra recorded during corrosion tests. It is expected that only and neither nor are affected by corrosion.
5. Conclusions
The results presented here indicate a correlation between the measured impedance and the residual capacity. It is recommended that impedance spectra be recorded with small superimposed discharge currents in the range of I. These spectra were valid over the whole measured frequency range, independently from the pre-history and during the complete aging tests. In contrast, impedance spectra with charging DC-currents are mostly useless due to permanent change of the state during one full EIS measurement.
When pre-history, frequency, and DC-current were equal, single impedance values of different test cells increased congenerously with similar impedance values during aging. Thereby, the pre-history and frequency were found to havean additional influence on the correlation between capacity and impedance. If these parameters are kept constant during a check-up, single impedance values are sufficient for SoH estimation.
With the use of the whole spectrum, a slower decrease of the double-layer capacitance and therefore a slower sulfation during soft AK3.4 aging was observed, caused by regular 24 h re-charging. As a characteristic change of the spectrum during aging, it can be outlined, that measured after the cycling phase dropped below 0.01 s for all test cells, when the aging test finished. At the same time, was twice as high as at the beginning.
Supplementary Materials
The following are available online at https://www.mdpi.com/2076-3417/8/6/873/s1: All performed impedance spectra together with the current and voltage profiles of the aging tests as Matlab files; Figures S1 and S2: Impedance spectra measured on of soft AK3.4 with superimposed discharging and charging current after 15 FCE at the end of cycling phase and at 80%; Figures S3 and 4: Impedance spectra measured on of soft AK3.4 with superimposed discharging and charging current after 90 FCE at the end of cycling phase and at 80%; Table S1: The average slopes of impedance amplitude increase over capacity loss for different frequencies and states from I impedance spectra; Figure S5: Single impedance values of all test cells in hard AK3.4 and soft AK3.4 test recorded with I after cycling phase (left) and after charging (right). In the upper graph, the frequencies, at which the imaginary part of impedance is near zero, are plotted over capacity loss and in the middle graph the corresponding impedance amplitudes are given. In the lower graph, impedance amplitudes measured at 0.1 Hz, 10 Hz, and 1 kHz are presented. The data of different test cells are distinguishable by the marks and the different frequencies in the lower graph are distinguishable by the line color.
Author Contributions
M.K., J.B., M.H., and D.U.S. conceived and designed the experiments. M.K., K.K., and D.D. performed the experiments. M.K. analyzed the data and wrote the paper.
Acknowledgments
The underlying work was conducted within the project BSMS (EU-1-1-081) funded through the European EFRE program. Funds were received from the same program for covering the costs to publish in open access.
Conflicts of Interest
The authors declare no conflict of interest. The founding sponsors had no role in the design of the study; in the collection, analyses, or interpretation of data; in the writing of the manuscript; or in the decision to publish the results.
Abbreviations
The following abbreviations are used in this manuscript:
| SoH | state of health |
| SoC | state of charge |
| FCE | full equivalent cycles |
| EEC | equivalent electrical circuit |
| LTI | linear and time-invariant |
| TI | time-invariant |
Appendix A. Impedance Spectra without Superimposed DC-Current
Other research groups working with lead-acid batteries perform EIS without superimposed DC-currents [6,8,9,19]. Therefore, in addition to the presented impedance spectra recorded with superimposed DC-currents, impedance spectra during resting phases were recorded in the aging tests. During hard AK3.4, EIS measurements were performed at the end of the 5 h resting phases after cycling and after charging.
In Figure A1, the impedance spectra recorded during hard AK3.4 on are presented. The verification of the validity of the impedance values was positive for the first half-circle and a part of the following tail of all impedance spectra. However, the data points, which correspond to the charge-transfer process of the negative electrode, cannot be determined clearly in almost all spectra, as the first half-circle is not well recognizable in the spectra. The reason for this is the shape of the first half-circle, which turns into the tail at higher frequencies than in the spectra with superimposed DC-currents. Only for the spectra recorded after charging and at 90 FCE and higher does the shape of the half-circle allow for a clear determination of the data points corresponding to this process. The number of chosen data points for fitting affects the fitting results. In Figure A2, the spectrum of in hard AK3.4 recorded after the cycling phase (90 FCE) is shown three times. In every graph, the measured data points and the calculated impedance values of fitted EEC are presented. Different numbers of data points were used for fitting. In Table A1, the corresponding fitting results for , , and are presented.

Table A1.
The fitting results for , , and are presented. These correspond to the number of fitted data points presented in Figure A2.
Table A1.
The fitting results for , , and are presented. These correspond to the number of fitted data points presented in Figure A2.
| Numb. of Data Points | 20 | 23 | 27 |
|---|---|---|---|
| 3.31 mΩ | 3.21 mΩ | 3.19 mΩ | |
| 12.76 mΩ | 18.72 mΩ | 18.49 mΩ | |
| 0.53 s | 4.75 s | 4.63 s |
Figure A1.
The impedance spectra recorded without superimposed DC-currents during hard AK3.4 on are presented. On the left side, the spectra are shown, which were recorded during the resting phase after cycling. On the right side, the spectra recorded after charging are presented.
Figure A1.
The impedance spectra recorded without superimposed DC-currents during hard AK3.4 on are presented. On the left side, the spectra are shown, which were recorded during the resting phase after cycling. On the right side, the spectra recorded after charging are presented.

Figure A2.
The impedance spectrum of in hard AK3.4 recorded after the cycling phase (90 FCE) was fitted three times, always with a different number of data points.
Figure A2.
The impedance spectrum of in hard AK3.4 recorded after the cycling phase (90 FCE) was fitted three times, always with a different number of data points.

The determined values for differ by not more than 0.12 mΩ, while the difference in the values is 6 mΩ. All values are larger than the values determined from spectra with superimposed DC-currents. Additionally, the values for time constants are larger. With the use of three more data points, the determined time constant changes from 0.53 s to over 4 s.
Figure A3 shows the spectrum of the same test cell recorded after the charging phase (30 FCE). In Table A2, the corresponding fitting results are denoted.
Figure A3.
The impedance spectrum of in hard AK3.4 recorded after the charging phase (30 FCE) was fitted three times, always with a different number of data points.
Figure A3.
The impedance spectrum of in hard AK3.4 recorded after the charging phase (30 FCE) was fitted three times, always with a different number of data points.

Table A2.
The fitting results for , , and are presented. These correspond to the number of fitted data points presented in Figure A3.
Table A2.
The fitting results for , , and are presented. These correspond to the number of fitted data points presented in Figure A3.
| Numb. of Data Points | 22 | 25 | 26 |
|---|---|---|---|
| 2.78 mΩ | 2.83 mΩ | 2.87 mΩ | |
| 155.3 mΩ | 23.07 mΩ | 14.78 mΩ | |
| 100 s | 0.64 s | 0.18 s |
For the spectrum in Figure A3, the variations of the and values are even larger, although the variation in the number of data points is smaller. For 22 points, the value for reached the maximum fitting limit.
These examples depict the difficulty in the processing of the spectra recorded without superimposed DC-currents. The fitting of the EEC used here is not possible, as a correct number of data points could not be determined. The extension of the EEC to describe the whole recorded spectrum is also not a potential solution here, as none of the half-circles have an adequate shape to be used for distinct fitting. Therefore, these spectra were not further considered in this work, and EIS without superimposed DC-currents is not recommended for SoH estimation methods.
References
- Schmid, R.; Pillot, C. Introduction to energy storage with market analysis and outlook. AIP Conf. Proc. 2014, 1597, 3–13. [Google Scholar] [CrossRef]
- Badeda, J.; Kwiecien, M.; Schulte, D.; Ruwald, T.; Sauer, D.U. Adaptive battery steering and management system for the optimized operation of stationary battery energy storage systems in multi-use applications. In Proceedings of the 2017 IEEE International Telecommunications Energy Conference (INTELEC), Broadbeach, QLD, Australia, 22–26 Ocober 2017; IEEE: Piscataway, NJ, USA, 2017; pp. 287–293. [Google Scholar] [CrossRef]
- Huet, F. A review of impedance measurements for determination of the state-of-charge or state-of-health of secondary batteries. J. Power Sources 1998, 70, 59–69. [Google Scholar] [CrossRef]
- Feder, D.O.; Hlavac, M.J.; Mark, K.W. Evaluating the state-of-health of flooded and valve-regulated lead/acid batteries. A comparison of conductance testing with traditional methods. J. Power Sources 1993, 46, 391–415. [Google Scholar] [CrossRef]
- Misra, S.S.; Noveske, T.M.; Williamson, A.J. Maintenance and reliability of standby battery systems: Flooded vs. valve regulated lead acid battery. In Proceedings of the 16th International Telecommunications Energy Conference (INTELEC ’94), Vancouver, BC, Canada, 30 October–3 November 1994. [Google Scholar] [CrossRef]
- D’Alkaine, C.V.; Mengarda, P.; Impinnisi, P.R. Discharge mechanisms and electrochemical impedance spectroscopy measurements of single negative and positive lead-acid battery plates. J. Power Sources 2009, 191, 28–35. [Google Scholar] [CrossRef]
- Deperneta, D.; Ba, O.; Berthonc, A. Online impedance spectroscopy of lead acid batteries for storage management of a standalone power plant. J. Power Sources 2012, 219, 65–74. [Google Scholar] [CrossRef]
- Kirchev, A.; Delaille, A.; Karoui, F.; Perrin, M.; Lemaire, E.; Mattera, F. Studies of the pulse charge of lead-acid batteries for PV applications: Part III. Electrolyte concentration effects on the electrochemical performance of the positive plate. J. Power Sources 2008, 179, 808–818. [Google Scholar] [CrossRef]
- Kirchev, A.; Mattera, F.; Lemaire, E.; Dong, K. Studies of the pulse charge of lead-acid batteries for photovoltaic applications Part IV. Pulse charge of the negative plate. J. Power Sources 2009, 191, 82–90. [Google Scholar] [CrossRef]
- Tröltzsch, U.; Kanoun, O.; Tränkler, H.-R. Characterizing aging effects of lithium ion batteries by impedance spectroscopy. Electrochim. Acta 2006, 51, 1664–1672. [Google Scholar] [CrossRef]
- Zenati, A.; Desprez, P.H.; Razik, H. Estimation of the SOC and the SOH of li-ion batteries, by combining impedance measurements with the fuzzy logic inference. In Proceedings of the IECON 2010—36th Annual Conference on IEEE Industrial Electronics Society, Glendale, AZ, USA, 7–10 November 2010; IEEE: Piscataway, NJ, USA, 2010; pp. 1773–1778. [Google Scholar] [CrossRef]
- Galeotti, M.; Cinà, L.; Giammanco, C.; Cordiner, S.; Di Carlo, A. Performance analysis and SOH (state of health) evaluation of lithium polymer batteries through electrochemical impedance spectroscopy. Energy 2015, 89, 678–686. [Google Scholar] [CrossRef]
- Karden, E.; Buller, S.; Doncker, R.W. A method for measurement and interpretation of impedance spectra for industrial batteries. J. Power Sources 2000, 85, 72–78. [Google Scholar] [CrossRef]
- Ruetschi, P. Aging mechanisms and service life of lead–acid batteries. J. Power Sources 2004, 127, 33–44. [Google Scholar] [CrossRef]
- Sauer, D. U.; Karden, E.; Fricke, B.; Blanke, H.; Thele, M.; Bohlen, O.; Schiffer, J.; Gerschler, J.B.; Kaiser, R. Charging performance of automotive batteries—An underestimated factor influencing lifetime and reliable battery operation. J. Power Sources 2007, 168, 22–30. [Google Scholar] [CrossRef]
- Lam, L.T.; Haigh, N.P.; Phyland, C.G.; Urban, A.J. Failure mode of valve-regulated lead-acid batteries under high-rate partial-state-of-charge operation. J. Power Sources 2004, 133, 126–134. [Google Scholar] [CrossRef]
- Budde-Meiwes, H.; Kowal, J.; Sauer, D.U.; Karden, E. Influence of measurement procedure on quality of impedance spectra on lead–acid batteries. J. Power Sources 2011, 196, 10415–10423. [Google Scholar] [CrossRef]
- CENELEC CLC/TC 21X. Lead-Acid Starter Batteries—Part 6: Batteries for Micro-Cycle Applications (German Version); CENELEC: Brussels, Belgium, 2016. [Google Scholar]
- Salloux, K.; McHardy, J. Eliminating battery failure-two new leading indicators of battery health-a case study. In Proceedings of the 29th International Telecommunications Energy Conference (INTELEC 2007), Rome, Italy, 30 September–4 October 2007. [Google Scholar]
- Schiller, C.A.; Richter, F.; Gülzow, E.; Wagner, N. Validation and evaluation of electrochemical impedance spectra of systems with states that change with time. Phys. Chem. Chem. Phys. 2001, 3, 374–378. [Google Scholar] [CrossRef]
- Macdonald, J.R. Impedance Spectroscopy: Theory Experiment and Applications: Print Version Record; Wiley-Interscience a John Wiley & Sons Inc. Publication: Hoboken, NJ, USA, 2005; Chapter Fundamentals of Impedance Spectroscopy. [Google Scholar]
- Kowal, J. Spatially-Resolved Impedance of Nonlinear Inhomogeneous Devices: [Using the Example of Lead-Acid Batteries]; Chapter Devices with Inhomogeneous Impedance-Impedance Spectra; Shaker: Aachen, Germany, 2010; Volume Bd. 53. [Google Scholar]
- Thele, M. A contribution to the modelling of the charge acceptance of lead-acid batteries: Using frequency and time domain based concepts. In Aachener Beiträge des ISEA; Shaker: Aachen, Germany, 2008; Volume 50. [Google Scholar]
- Pilatowicz, G.; Budde-Meiwes, H.; Kowal, J.; Sarfert, C.; Schoch, E. Comprehensive study of relaxation behaviour of lead-acid batteries for state-of-charge estimation in automotive applications. In Proceedings of the 9th International Conference on Lead-Acid Batteries (LABAT), Albena, Bulgaria, 10–13 June 2014; Bulgarian Academy of Sciences (BAS): Sofia, Bulgaria, 2014. [Google Scholar]
- Berndt, D. Maintenance-free batteries: Based on aqueous electrolyte lead-acid, nickel/cadmium, nickel/metal hydride: A handbook of battery technology. In Electronic & Electrical Engineering Research Studies; Chapter Fundamentals-Electron Transfer; Research Studies Press: Baldock, Hertfordshire, UK, 2003; Volume 5. [Google Scholar]
- Perez, M. Gibbs-Thomson effects in phase transformations. Scr. Mater. 2005, 52, 709–712. [Google Scholar] [CrossRef]
- Danel, V.; Plichon, V. Study of Pb(II) in various H2O-H2SO4 mixtures by differential pulse polarography: Solubility of lead sulphate, diffusion coefficient of Pb(II) and half-wave potential of Pb(Hg)/Pb(II). Electrochim. Acta 1982, 27, 771–774. [Google Scholar] [CrossRef]
Figure 1.
On the left side, the lead-acid test cell in a PVC box is equipped with a reference electrode and a temperature sensor. Air is pumped into the left side compartment and the ascending air bubbles mix the acid. The electrodes are connected in a 4-point measurement configuration for EIS. On the right side, a schematic representation of connections with the testing apparatus is shown.

Figure 2.
The voltage, current, and temperature profile of the initial process performed on all test cells before the aging test.
Figure 2.
The voltage, current, and temperature profile of the initial process performed on all test cells before the aging test.

Figure 3.
Nyquist diagram of a measured impedance spectrum with a superimposed DC-current of −1.5I in blue and the fitting result in red using the EEC shown in the figure.
Figure 3.
Nyquist diagram of a measured impedance spectrum with a superimposed DC-current of −1.5I in blue and the fitting result in red using the EEC shown in the figure.

Figure 4.
The upper figure shows the residual capacity of the test cells in hard AK3.4 and soft AK3.4 aging tests over FCE. The capacities were measured after cycling with a discharge current of I until 1.8 V. The lower figure shows the OCV after cycling phase (blue) and after recharging (red) of the test cells over FCE.

Figure 5.
Impedance spectra measured on of hard AK3.4 at the end of the first cycling phase (after 15 FCE). Impedance spectra with discharging DC-currents are presented as a Nyquist diagram at the top. The impedance values, which pass the LTI criterion, are marked with squares. The impedance amplitudes measured and calculated with the zHit method are shown over the frequency at the bottom. The absolute difference between the amplitudes is presented as well with its own y-axis on the right side.

Figure 6.
Impedance spectra measured on of hard AK3.4 at the end of the first cycling phase (after 15 FCE) with charging DC-currents.
Figure 6.
Impedance spectra measured on of hard AK3.4 at the end of the first cycling phase (after 15 FCE) with charging DC-currents.


Figure 7.
Impedance spectra with discharging DC-currents measured on of hard AK3.4 after 120 FCE at the end of cycling phase and after recharging. The impedance values, which pass the LTI criterion, are marked with squares.
Figure 7.
Impedance spectra with discharging DC-currents measured on of hard AK3.4 after 120 FCE at the end of cycling phase and after recharging. The impedance values, which pass the LTI criterion, are marked with squares.

Figure 8.
Impedance spectra with charging DC-currents measured on of hard AK3.4 after 120 FCE at the end of cycling phase and after recharging.
Figure 8.
Impedance spectra with charging DC-currents measured on of hard AK3.4 after 120 FCE at the end of cycling phase and after recharging.


Figure 9.
Impedance spectra measured on and of hard AK3.4 with I after 15–135 FCE after the cycling phase. The spectra of the whole cell and the negative electrode are presented. The impedance spectra of the negative electrode are measured using the reference electrode. Impedance values, which do not fulfill TI criterion, have been removed.

Figure 10.
Single impedance values of all test cells in hard AK3.4 and soft AK3.4 test recorded with I after the cycling phase (left) and after charging (right). In the upper graph, the frequencies at which the imaginary part of impedance is near zero, are plotted over capacity loss . In the middle graph, the corresponding impedance amplitudes are given. In the lower graph, impedance amplitudes measured at 0.1 Hz, 10 Hz, and 1 kHz are presented. The data of different test cells are distinguishable by the marks and the different frequencies in the lower graph are distinguishable by the line color.

Figure 11.
The fitting results (, , and ) over of hard AK3.4 (h. AK) and soft AK3.4 (s. AK) for both pre-histories, after cycling (cyc) and after charging (CHA and 80%) measured with I and I. The test cells are distinguished by different marks and the pre-history by different colors.
Figure 11.
The fitting results (, , and ) over of hard AK3.4 (h. AK) and soft AK3.4 (s. AK) for both pre-histories, after cycling (cyc) and after charging (CHA and 80%) measured with I and I. The test cells are distinguished by different marks and the pre-history by different colors.

Table 1.
An overview of the performed aging tests, with information about the tests, the performed impedance spectra, and the used test cells.
Table 1.
An overview of the performed aging tests, with information about the tests, the performed impedance spectra, and the used test cells.
| Aging Test | Test Type | Aging Process | Modification | Impedance Spectra | No. of Test Cells |
|---|---|---|---|---|---|
| hard AK3.4 | Cycling test | Sulfation | No full-charge | After cycling, after re-charge with DC-currents | 2 |
| soft AK3.4 | Cycling test | Sulfation | With full-charge | After cycling, at 80% SoC with DC-currents | 2 |
Table 2.
The average slopes of impedance amplitude increase over capacity loss for different frequencies and states from I impedance spectra.
Table 2.
The average slopes of impedance amplitude increase over capacity loss for different frequencies and states from I impedance spectra.
| Frequencies | After Cycling | After Charging | 80% SoC |
|---|---|---|---|
| 0.275 mΩ/Ah | 0.203 mΩ/Ah | 0.115 mΩ/Ah | |
| 1 kHz | 0.284 mΩ/Ah | 0.204 mΩ/Ah | 0.112 mΩ/Ah |
| 10 Hz | 0.742 mΩ/Ah | 0.587 mΩ/Ah | 0.275 mΩ/Ah |
| 0.1 Hz | 0.947 mΩ/Ah | 0.399 mΩ/Ah | 0.438 mΩ/Ah |
Table 3.
Rates on sulfur oxide () of negative and positive electrodes at different positions in %.
| Electrode Position | TC1 Hard AK3.4 | TC2 Hard AK3.4 | TC1 Soft AK3.4 |
|---|---|---|---|
| Positive 1 top | 1.41 | 1.34 | 0.92 |
| Positive 1 middle | 1.21 | 1.10 | 0.88 |
| Positive 1 bottom | 1.11 | 0.93 | 0.92 |
| Positive 2 top | 0.97 | 1.30 | 0.85 |
| Positive 2 middle | 1.00 | 1.12 | 0.92 |
| Positive 2 bottom | 0.85 | 1.13 | 0.95 |
| Negative top | 8.95 | 1.35 | 9.94 |
| Negative middle | 12.51 | 6.18 | 8.17 |
| Negative bottom | 23.36 | 8.40 | 14.37 |
© 2018 by the authors. Licensee MDPI, Basel, Switzerland. This article is an open access article distributed under the terms and conditions of the Creative Commons Attribution (CC BY) license (http://creativecommons.org/licenses/by/4.0/).
Share and Cite
MDPI and ACS Style
Kwiecien, M.; Badeda, J.; Huck, M.; Komut, K.; Duman, D.; Sauer, D.U. Determination of SoH of Lead-Acid Batteries by Electrochemical Impedance Spectroscopy. Appl. Sci. 2018, 8, 873. https://doi.org/10.3390/app8060873
AMA Style
Kwiecien M, Badeda J, Huck M, Komut K, Duman D, Sauer DU. Determination of SoH of Lead-Acid Batteries by Electrochemical Impedance Spectroscopy. Applied Sciences. 2018; 8(6):873. https://doi.org/10.3390/app8060873
Chicago/Turabian StyleKwiecien, Monika, Julia Badeda, Moritz Huck, Kuebra Komut, Dilek Duman, and Dirk Uwe Sauer. 2018. "Determination of SoH of Lead-Acid Batteries by Electrochemical Impedance Spectroscopy" Applied Sciences 8, no. 6: 873. https://doi.org/10.3390/app8060873
Note that from the first issue of 2016, this journal uses article numbers instead of page numbers. See further details here.