New Procedure for Compacting Prismatic Specimens of Cement-Treated Base Materials
by
 , ,
, ,
Alaitz Linares-Unamunzaga
1 ,
,
Hernán Gonzalo-Orden
1,*,
Jesús Díaz Minguela
2 and
Heriberto Pérez-Acebo
3
1
Department of Civil Engineering, University of Burgos, c/Villadiego, s/n, 09001 Burgos, Spain
2
Spanish Institute of Cement and Its Applications (IECA), c/José Abascal, 53, 1º, 28003 Madrid, Spain
3
Mechanical Engineering Department, University of the Basque Country UPV/EHU, Pº Rafael Moreno Pitxitxi, 2, 48013 Bilbao, Spain
*
Author to whom correspondence should be addressed.
Appl. Sci. 2018, 8(6), 970; https://doi.org/10.3390/app8060970
Submission received: 23 May 2018
/
Revised: 7 June 2018
/
Accepted: 9 June 2018
/
Published: 13 June 2018
(This article belongs to the Section Materials Science and Engineering)
Abstract
:Understanding the long-term behaviour of cement-treated base materials is a key factor to improve its design and obtain environmentally friendly pavement base materials. Their characterization requires manufacturing prismatic specimens. However, various authors highlight the absence of standardized test methods for fabricating beams in the field and laboratory, which is not an easy task because it depends on the qualification and experience of the testing team. The aim of this paper is to present a new device and procedure for compacting prismatic specimens of cement-treated base materials. In this research, it was used for compacting soil-cement to simulate its performance as a road base material. This device employs elements that are generally available in a concrete laboratory test, such as a vibrating table or prismatic moulds. Once the procedure was established, and in order to verify its suitability, flexural and compressive strength tests were carried out. Results showed that the values obtained were consistent with this material and, despite the heterogeneity of the material, specimens from the same batch provided similar results and, hence, validated the compaction process. This new compacting procedure can improve understanding of the long-term performance of cement-treated materials from flexural and fatigue tests.
1. Introduction
Soil-cement is a mix of gravels, sands or soils with low plasticity, a small percentage of cement, water and additives, which is subsequently compacted and cured [1,2,3,4]. This mixture is applied as a road base/sub-base where the aggregates used can be found in the right-of-way of the road or can totally or partially come from a recycling method, such as crushed concrete and crushed masonry [3,4,5,6,7,8,9] in order to protect natural resources and reduce the environmental impact [5,10,11]. Additionally, this material is also deployed in railway infrastructures [12] and for building purposes, although in this case it tends to be reinforced with fibers [13,14,15].
With regard to the characteristics of soil-cement, these depend mainly on the quantity and type of fine aggregate of the soil, the amount of added cement and water, the mixing and compacting procedure, the curing process and the age of the compacted materials. The added cement reduces the plasticity and modifies the maximum dry density and the optimum moisture content of the mixture [1,16,17,18]. Additionally, the compressive strength of the soil-cement is directly proportional to the quantity of cement added to the mix. During its hydration, the cement covers the aggregate skeleton and adheres to it, filling the air cavities, reinforcing the union between particles and, consequently, improving the engineering properties and durability of the soil [19,20].
The first reference about adding cement to soil for improving its properties dates from 1915 in Sarasota, Florida, where a mixture of shells, sand and Portland cement was compacted, resulting in a soil stabilization for roads [16]. However, it was not until after World War II that this technique was used in France, Germany, Spain, Australia and South Africa for base and sub-base roads [16]. This procedure has the following advantages and disadvantages [2,16]:
- Environmental and economical advantages associated with the employment of soils coming from areas close to the outline of the road, decreasing the consumption of quarry aggregates and the necessity of landfills and, hence, reducing emissions to the atmosphere.
- Technical advantages related to the high resistance of the material, which allows the prolonging of pavement life and a reduction in maintenance costs.
- As disadvantage, it must be underlined that this technique requires precision when carrying it out. Variations in the layer thickness, cement percentage or density modify its properties. Moreover, it needs a pre-cracking process to increase the material life.
Nevertheless, the main problem of this technique is knowing its long-term performance during its life cycle. From the review of literature about cement-treated materials, it can be concluded that the unconfined compressive strength (UCS) is a useful index for determining the initial quality of the cement-treated material. However, it is essential to determine the resistance to tensile stresses generated by cyclic loads in the base of the layer, which can fatigue the material [2,19,21,22,23,24].
The test that best represents the long-term performance of the cement-treated layers under traffic loads is the four points flexural beam test [25,26,27,28,29,30]. Nonetheless, the main problems of this test are the cost and the difficulty of manufacturing the required prismatic specimens with an acceptable density. Reeder, et al. [31] highlight that there is limited information available on the flexural strength of cement-treated base materials due to the difficulty of obtaining specimens from actual projects and because there is an absence of a standardized test method for the specimens’ fabrication. Moreover, the American Society for Testing and Materials (ASTM) standard for making and curing soil-cement compression and flexure test specimens in the laboratory [32] underlines that manufacturing prismatic specimens is not an easy task because it depends on the qualification and experience of the testing team. Therefore, in general, the flexural strength (FS) is estimated from other indirect tests, such as the UCS or the indirect tensile strength (ITS) [19,33,34,35].
This research shows a new procedure for manufacturing prismatic specimens to characterize their FS with the four points flexural beam test, by means of a process that can be implemented with various cement-treated materials. This technique was developed at the University of Burgos (Spain) in order to be specifically applied for testing cement treated bases such as road base/sub-base pavements [28,36,37,38,39]. Previous research proposed various alternatives for compacting this kind of specimen by applying different static loads or beating the material [27,32,40]. In this proposal, the material is vibrated to better simulate the work procedure in the field, where vibrator rollers are employed [41].
The article is organized as follows. Section 2 presents the new compacting procedure. The material employed and the proposed methodology for verifying the adequacy of the new procedure are described in Section 3. In Section 4, the results of compacting with the new procedure and of the validation are shown and discussed. Finally, conclusions are drawn in Section 5.
2. Description of the Device and New Methodology for Compacting Prismatic Specimens of Cement-Treated Base Materials
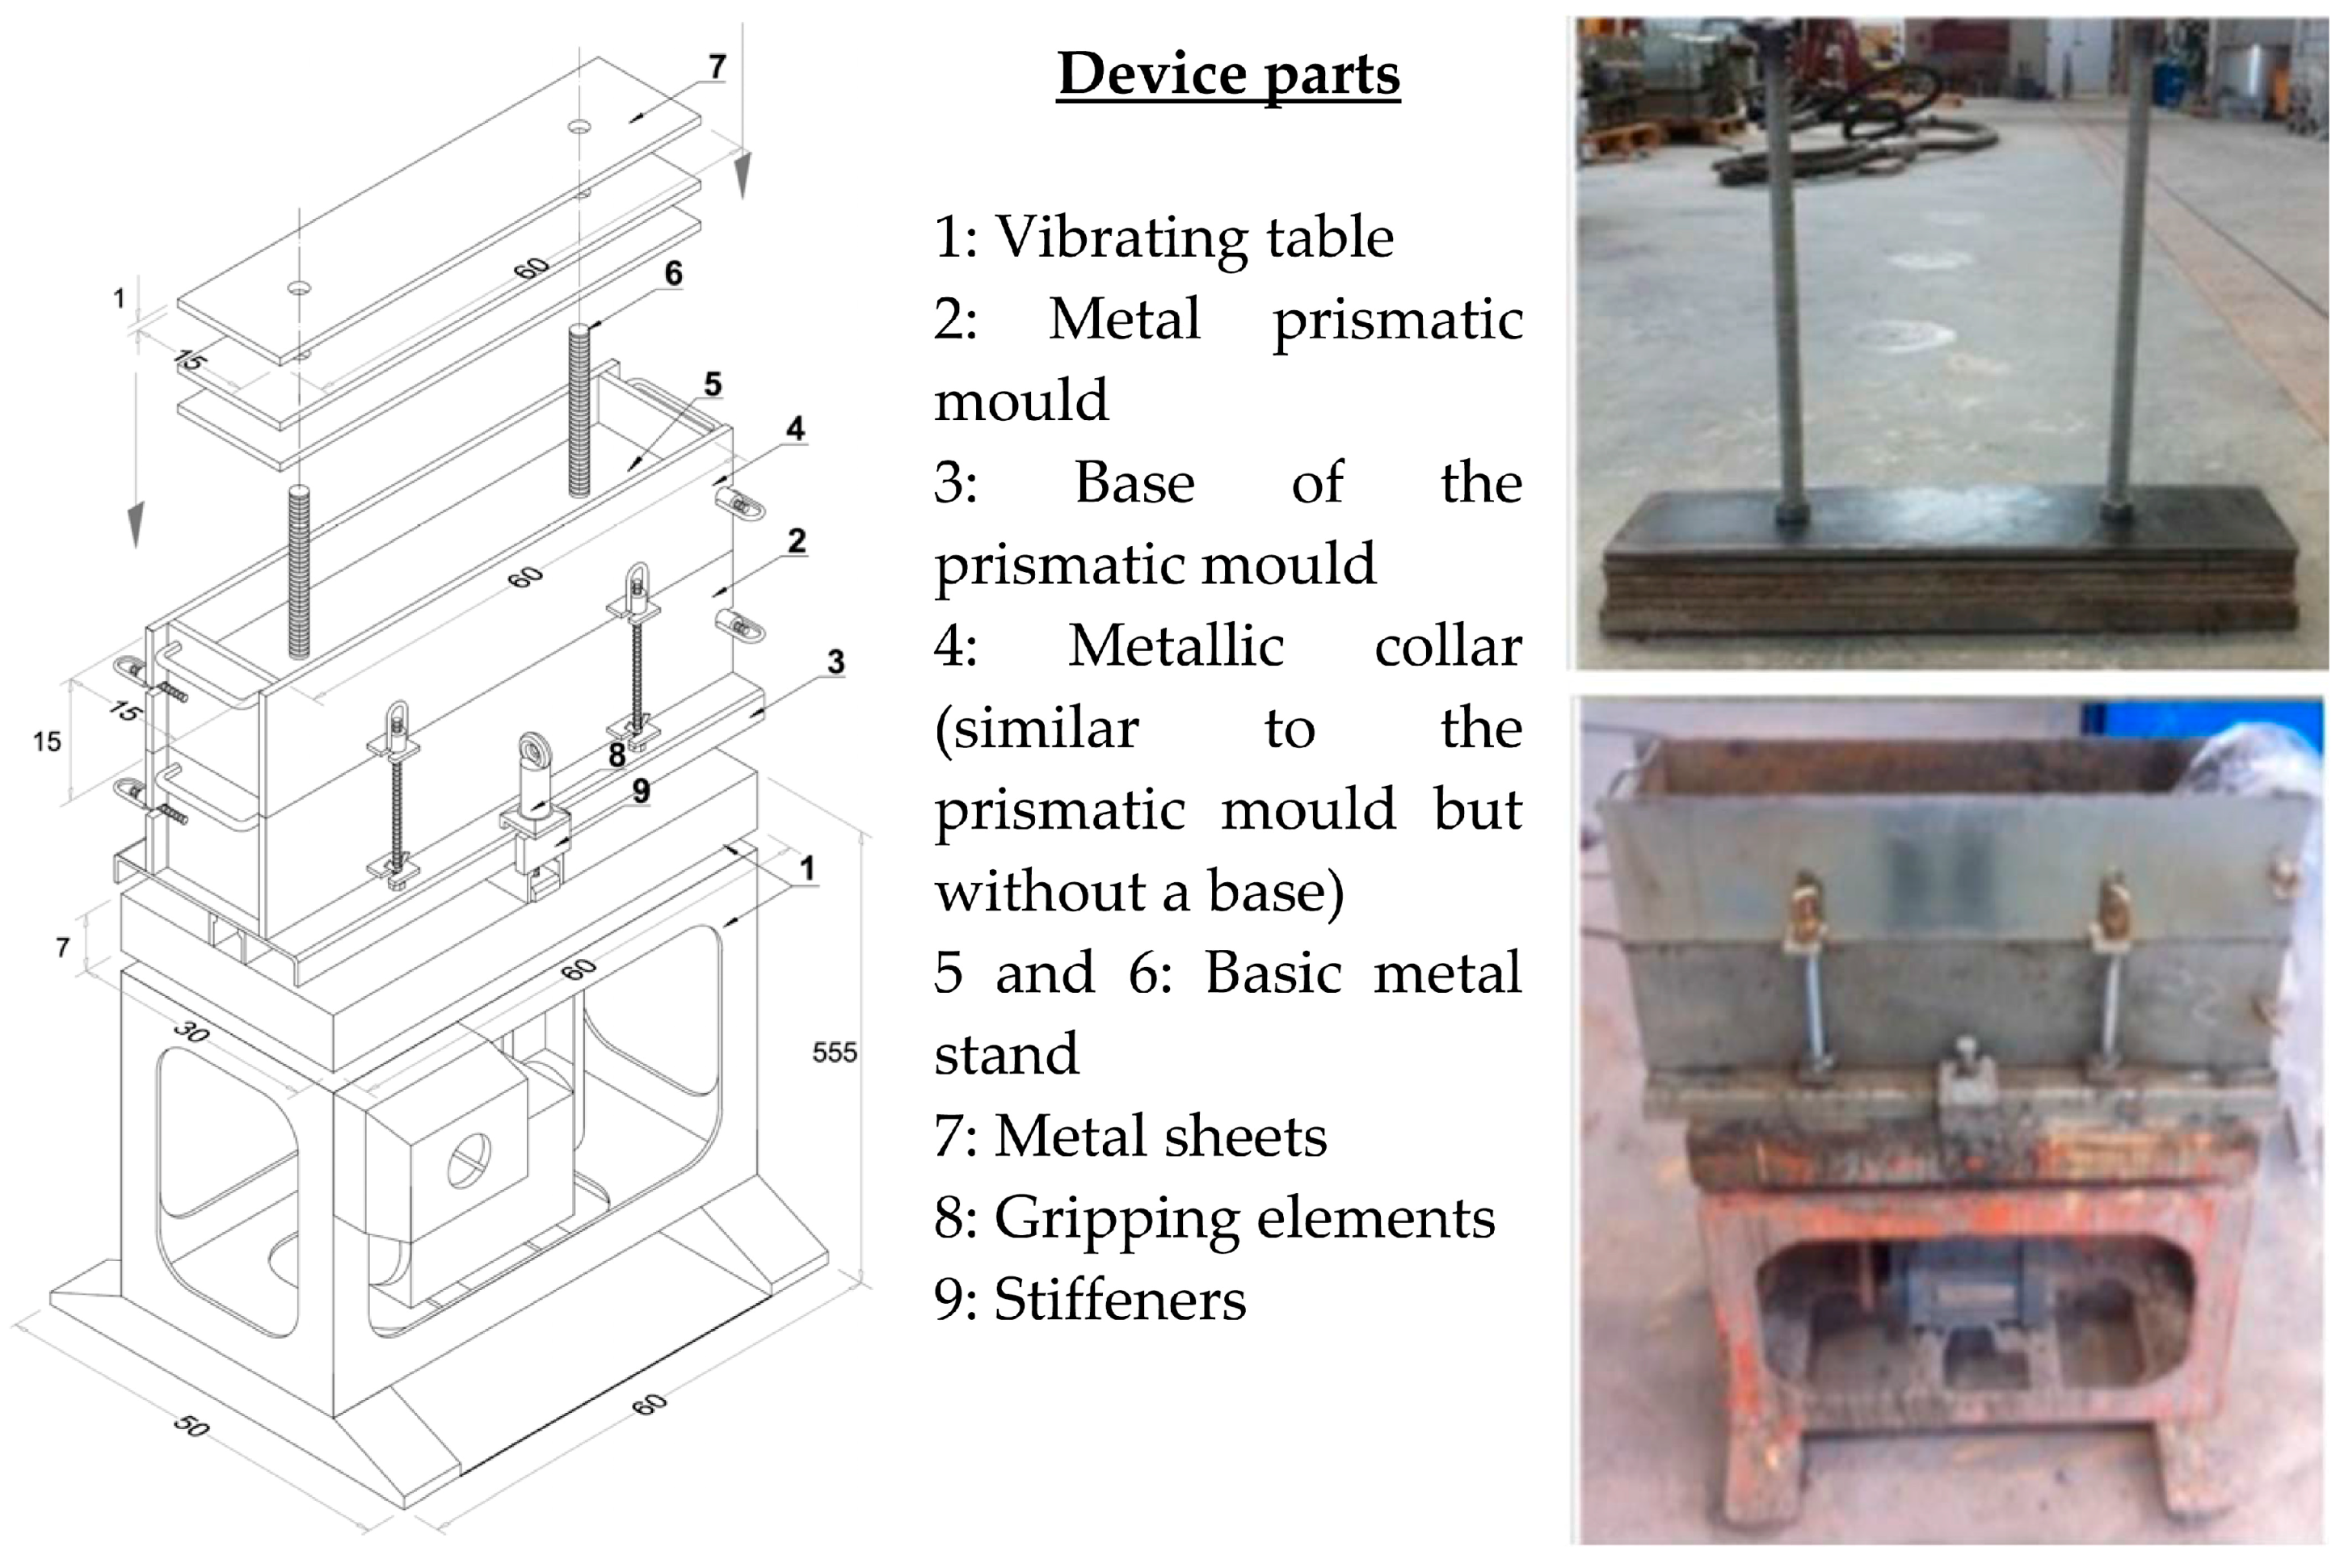
The device deployed for compacting prismatic specimens is shown in Figure 1.
It consists of a basic metal stand (element 5 and 6 of Figure 1), to which a varying number of metal sheets can be added (element 7 of Figure 1) to achieve the previously established maximum density.
The confinement of the specimens is carried out by a metal prismatic mould (element 2 of Figure 1). To this element, a collar is attached, in order to guide the metal stand during the compaction of the last layer of the material when manufacturing the specimen. The base of the prismatic mould (element 3 in Figure 1) is linked to a vibrating table (element 1) by means of a metal gripping element (element 8) and stiffeners (element 9). The vibrating table provides a vibration with a frequency of 40 Hz (2400 rpm).
One of the advantages of this procedure is that the majority of its elements are commonly employed in a concrete testing laboratory, such as a vibrating table (and its fixing elements) and the mould for manufacturing specimens. As non-standard elements, it needs the stand and the metal sheets. The stand is formed from a 20 mm-thick steel sheet to which 2 bars of 20 mm in diameter and 50 mm long are attached. Metal sheets can be obtained from a 10 mm thick sheet.
Seven steps are followed to manufacture prismatic specimens:
- Fixing the entire device. It is necessary to fix the removable base of the metallic mould to the vibrating table by means of the metal gripping elements and stiffeners. The metal stand that takes the metal sheets is guided by means of a metallic collar.
- Preparation of the mould, extension of the first layer of material, and compaction. In order to avoid adherence of the material to the mould, it is necessary to apply a mould-release agent in the interior faces of the mould. Depending on the maximum aggregate size, specimens can be manufactured in 2 or 3 layers, depending on the compaction of the material. As a general rule, the solution with the minimum number of layers that allow achieving the maximum dry density required in the standards will be selected. After spreading the first layer of material, the metal stand is placed above it with 3 or 4 metallic sheets. The vibration table is switched on and the vibration is transmitted for 15 or 20 s.
- Extension and compaction of the second layer. After the first layer is vibrated, the metal stand and the metal sheets are extracted and the second layer is spread over the first one, which is already compacted. Once again, the stand and the sheets are placed over the material and this layer is vibrated for the same period as in the first layer.
- Extension and compaction of the third layer. In case a third layer is needed in order to obtain the required compaction density, a third layer is spread over the previous ones and is vibrated for the same period as in step 2.
- Extraction of the stand, dismantling the collar, and finishing the specimen. After the compaction of the last layer, the metal stand is extracted, the metallic collar is dismantled and excess material in the specimen is removed by means of a scraper.
- Removing the mould from the vibrating table. The mould is uncoupled from the gripping elements and stiffeners and the metal mould is removed from the vibrating table.
- Determination of the dry density of the manufactured specimen. The metal mould, containing the humid compacted mixture, is weighed and the dry density of the sample is calculated.
Finally, the compaction process is validated by means of the density obtained. If the required maximum dry density is not achieved, the specimen is discarded and a new specimen would be manufactured from the first step, increasing the weight of the stand by adding more sheets, increasing the vibration time by 5 s or carrying out these two actions together. The complete procedure for achieving the required density is shown in Figure 1. As can be observed, this procedure offers a standardized method for specimen fabrication where the qualification and experience of the testing team is not a critical factor.
Finally, and after 24 h of manufacturing the specimens, the perimeter formwork of the metal mould is removed, and the specimens are left on the metallic base for 7 days before retiring the base in order to avoid damage during manipulation at early age, when the resistance is low.
Hence, the proposed compacting procedure is iterative, where the number of sheets and the time of vibration that are needed are determined experimentally for each material.
When the required density is obtained, the UCS at 7 days is measured to verify that this requirement is fulfilled (step 4 of the Figure 2). The UCS test can be carried out in two ways: over the entire specimen (with dimensions 15 × 15 × 60 cm3) or after dividing it in two parts and conducting a UCS test over each part.
Lastly, it must be stated that the device and procedure can also be deployed with other prismatic dimensions and aggregate size, as long as the geometric dimensions of the standards are respected.
3. Material Employed and Proposed Methodology for Verification of the Procedure
3.1. Description of Material Employed
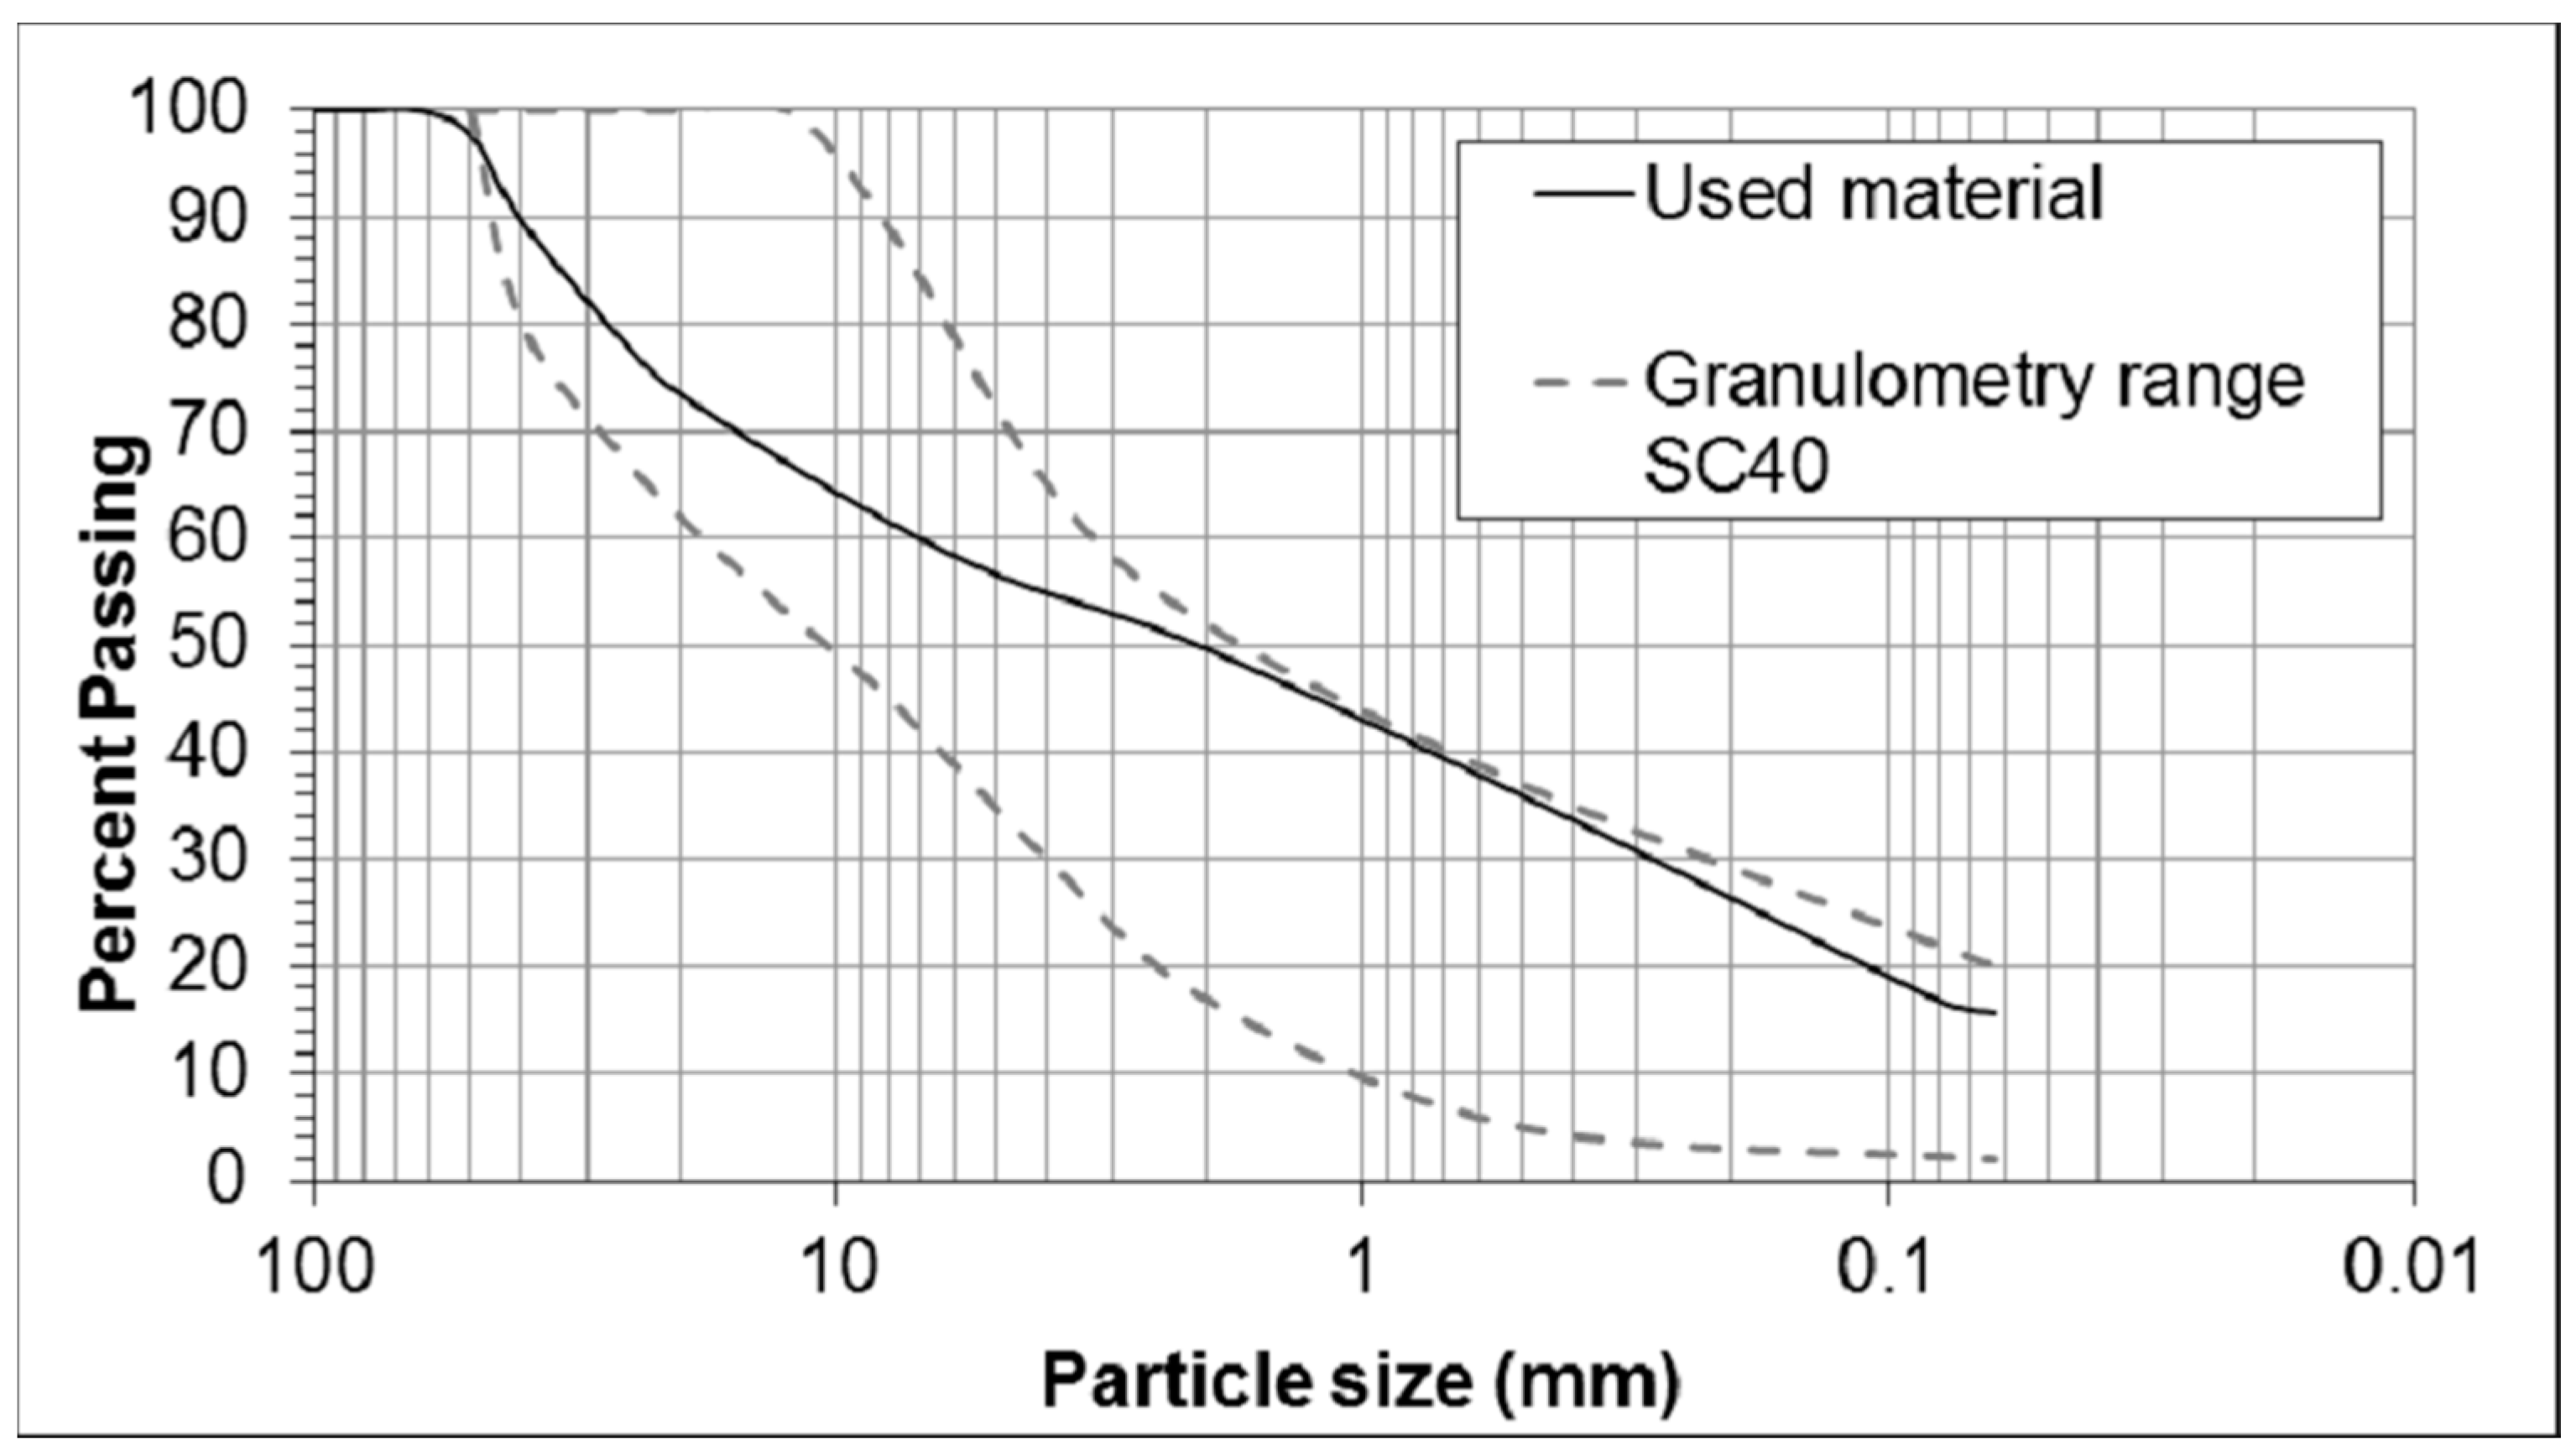
The soil comes from a borrow pit in the milestone 16 + 400 of the C-627 road, in the province of Burgos (Spain). Figure 3 shows the granulometry of the material according to the Spanish Association for Standardization and Certification (AENOR) [42] and the granulometry range for the soil-cement with a maximum aggregate size of 40 mm, designed as SC40, according to the Spanish regulations on soil-cement [43]. The material has not plasticity [44] and the sand equivalent test gives a value of 20 [45]. The material can be classified as SP-SM following the unified soil classification system (USCS) [46]. The soil has no organic material [47] or soluble sulphate [48]. The maximum aggregate size is limited to 40 mm.
The cement used is CEM IV B/V 32.5 N. It is Pozzolan cement, with a low quantity of clinker and a high quantity of additions, widely used in roads for soil stabilization and for soil-cement. This type was selected instead of others, like CEM II, because part of the clinker is substituted by fly ash, obtaining a cement that has a lower manufacturing energy and that employs industrial byproducts and hence, is an environmentally friendly material. Moreover, CEM II achieves a higher strength at 7 days, but at medium and long-term CEM II and CEM IV achieved similar strengths. Specifically, the main properties of the cement used in this research are displayed in Table 1.
Determining the optimum amount of cement, the moisture content, the maximum dry density and the minimum compressive strength at 7 days are key factors of any soil-cement manufacturing process. This is a common step in any cement-treated base material production when an unknown material is employed, generally referred to as establishing the work formula for the soil employed.
The determination of the maximum dry density and the optimum moisture content was carried out with cylindrical samples following the modified Proctor test defined in the Spanish standard [49] whose prescriptions are very similar to those of the ASTM [50]. The amount of cement to be added must guarantee the minimum compressive strength at 7 days, according to the regulations of each country, as shown in Table 2.
For this research, a mixture containing 3.5% of cement was employed, which had a UCS at 7 days of 2.67 MPa, a maximum dry density of 2.18 g/cm3, and an optimum moisture content of 7.0%, as shown in Figure 4.
3.2. Methodology for Verifying the Proposed Compacting Procedure
Two experiments will be conducted. Firstly, a trial-error test was carried out to obtain the procedure to manufacture prismatic specimens with the required quality, according to Figure 2. This part explains the iterative process that determines the configuration of the number of necessary metal sheets in the stand above the material for producing the sample and vibration time needed. Results obtained for the described soil-cement during this experiment are described in Section 4.1.
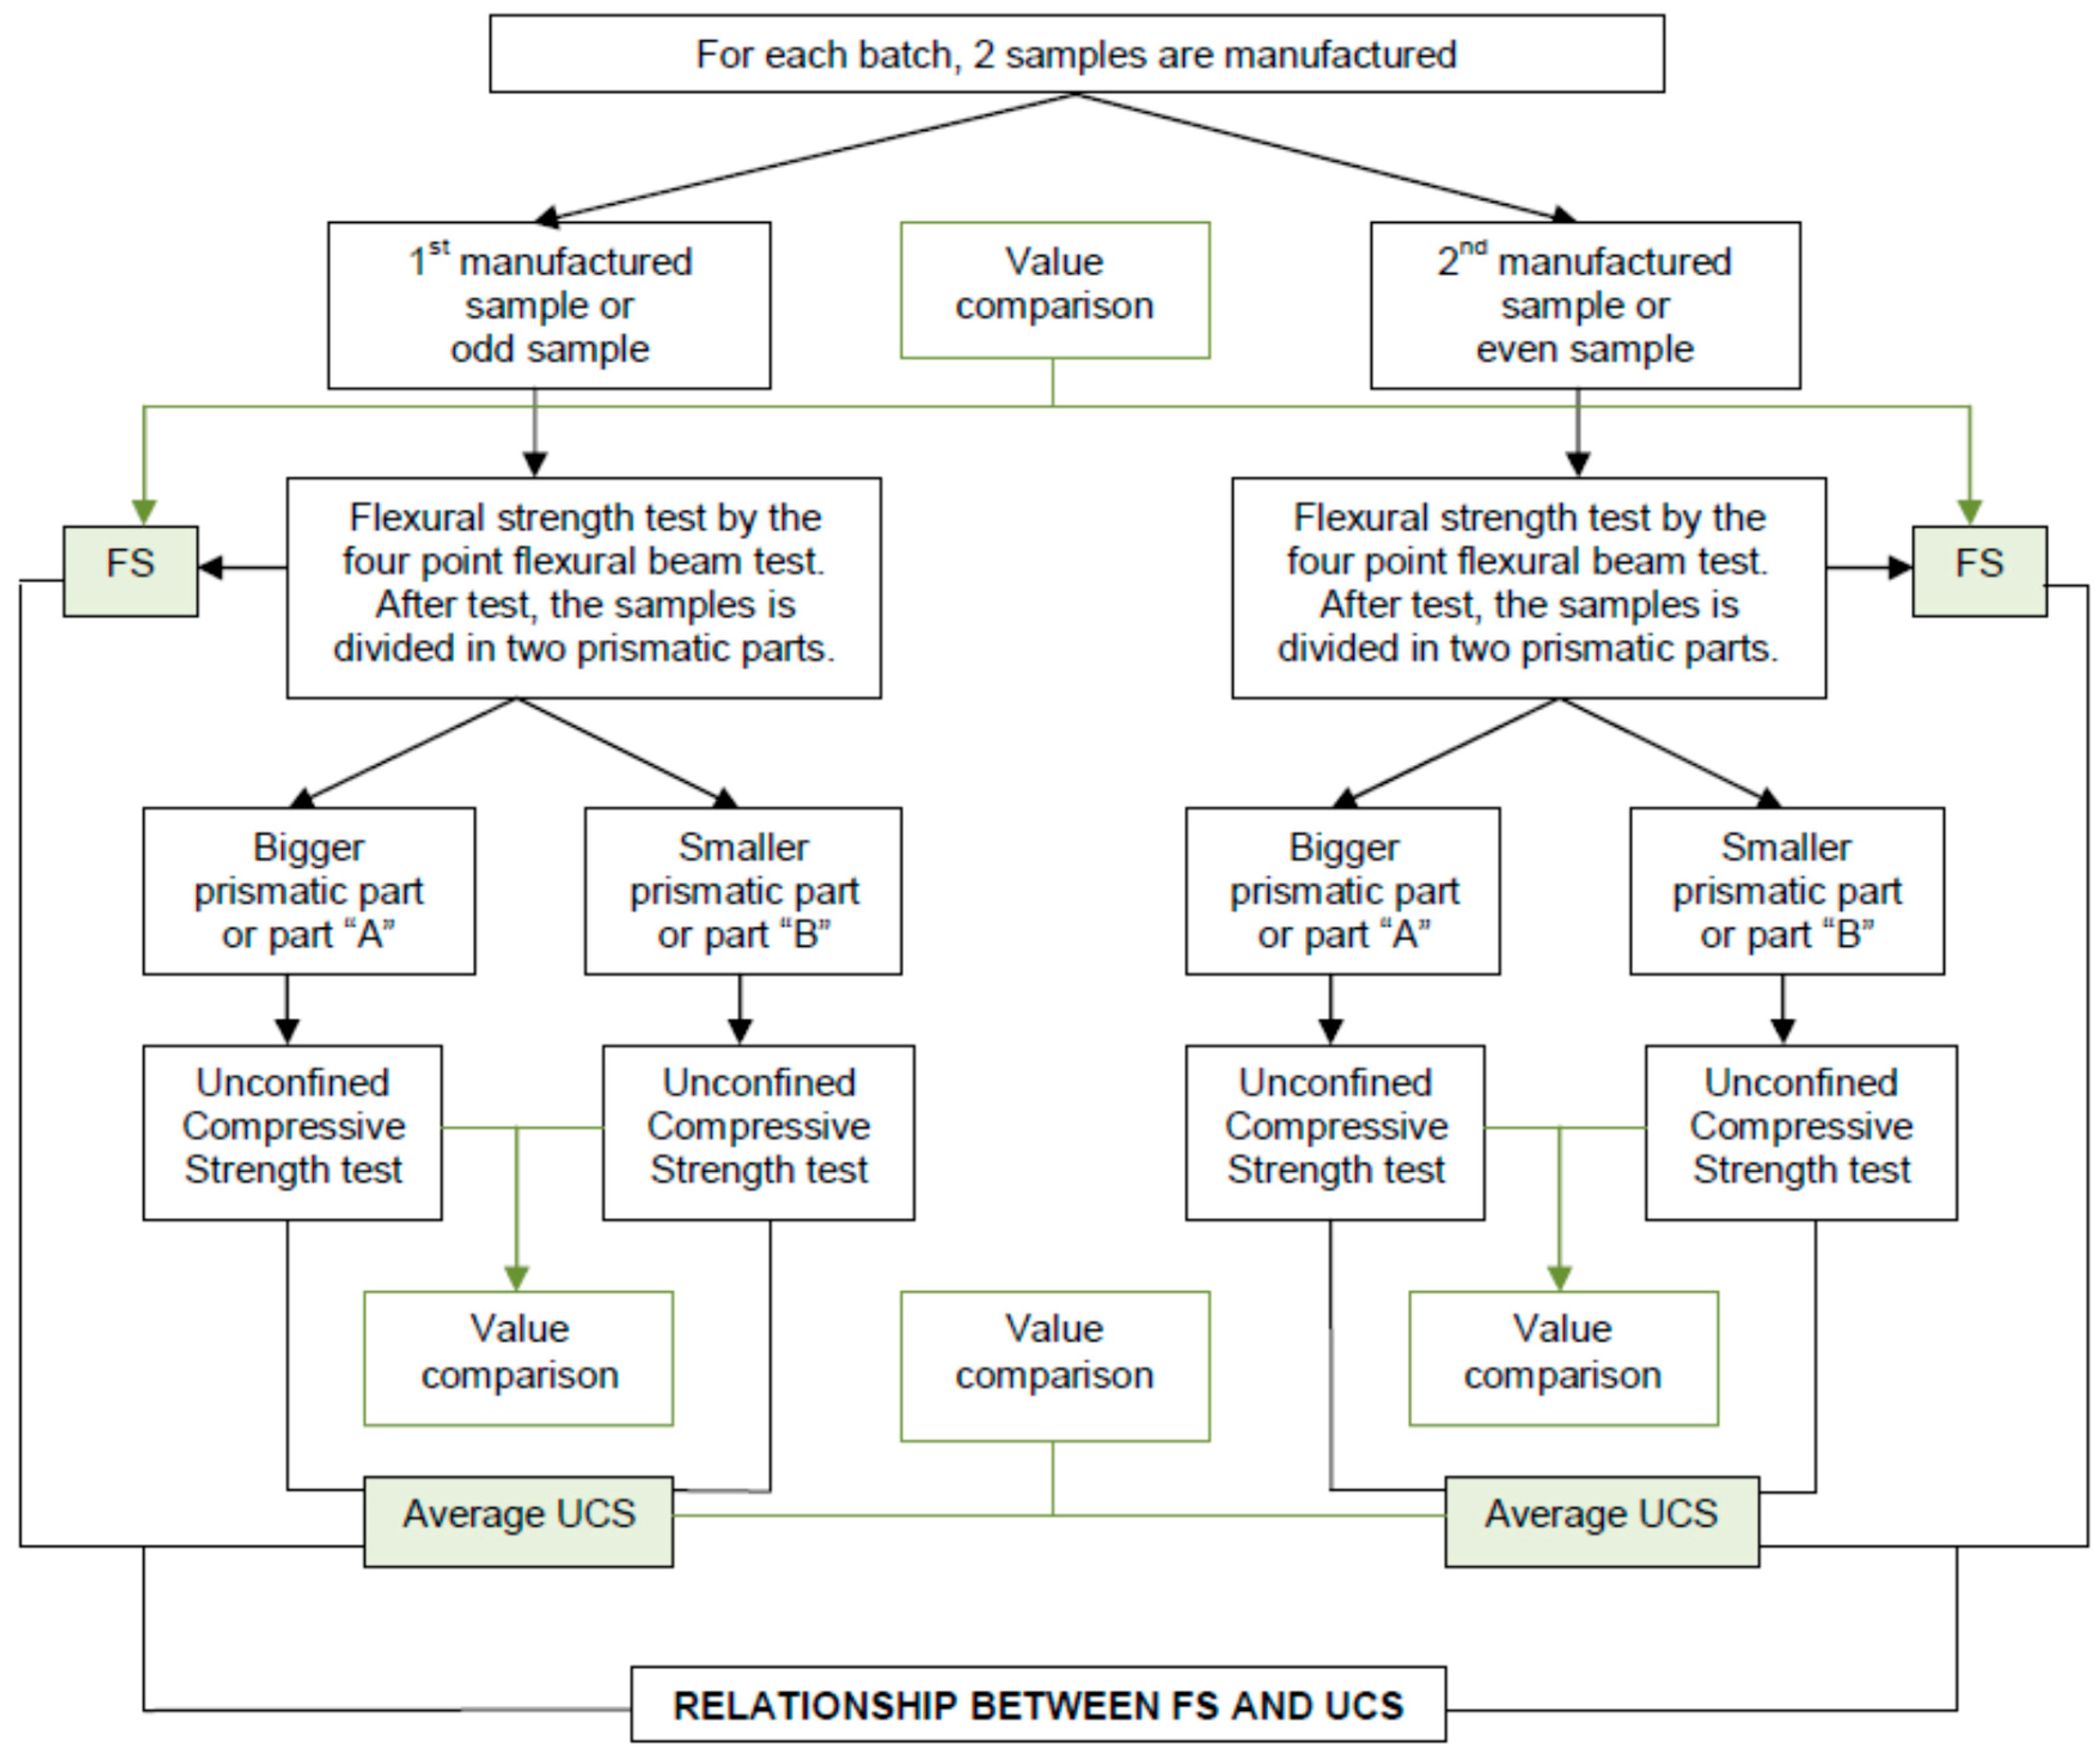
Secondly, with the aim of verifying the consistency of the proposed compaction procedure, a test program is established. The program comprises 10 batches of soil-cement with the characteristics described, called A to J, and from each batch, 2 prismatic samples (designed as 1 and 2) are obtained, with dimensions 60 × 15 × 15 cm. They are denoted as samples A1 to J2. The test program is shown in Figure 5.
The heterogeneity of the material leads to the appearence of small differences in the manufactured batches. Flexural strength (FS) tests at 90 days, with the four-point flexural beam test, are conducted for each of the 20 samples produced with the 10 batches. Additionally, UCS tests are applied to each of the parts in which the specimen previously tested is divided. These tests (FS at 90 days and UCS at 90 days) allow for checking of the homogeneity of the compaction process for both samples made in the same batch, as long as the differences between modified Proctor densities of those samples from the same batch is below 3%. Furthermore, it also allows for checking of the homogeneity of the compaction procedure in the specimen itself, observing if both parts, obtained after FS test, have similar compressive strength.
Briefly, the goal of the test program is to check that both specimens from the same batch provide the expected results, and also similar values, confirming the suitability of the prismatic sample compaction procedure.
4. Results and Discussion
4.1. Results from the Compaction Procedure (First Experiment)
The Spanish standard [56] for concrete is followed to determine the size of the prismatic samples. For a maximum aggregate size of 40 mm, as specified for SC40, prismatic specimens with dimension 60 × 15 × 15 cm are chosen.
As indicated in Figure 2, the process started with production of prismatic samples, without cement and the moisture content determined in the modified Proctor test. The maximum number of compaction layers is based on the maximum aggregate size and the height of the metallic mould. In this research, 3 compaction layers were selected.
Without previous experience, 3 metallic sheet and 15 s of vibration for each layer can be used. Taking account of experience in the procedure, 4 prismatic samples, denoted as P1–P4, with a moisture content of 7% (determined from previous modified Proctor tests) and 4 metal sheets over the metal stand and 20 s of load application per layer were produced.
These initial four samples were manufactured increasing each time, order, load application time and number of sheets over the stand for the compaction. Table 3 show the values of the number of metal sheets, load application time in each layer, the number of necessary sheets for vibrating load application, and the density obtained in each case.
As observed in Table 3, in specimens P1–P4 the dry density values are below the required value (98% of the modified Proctor density, according to Spanish standards [43]). Moreover, from samples P2 and P4, it can be deducted that a higher vibrating time does not lead to a higher density, but to the decomposition of samples. Since the density of the specimen P3 is near the 98% of the modified Proctor density value, two more samples, P5 and P6 are manufactured with 3.5% of cement in weight so as to observe the influence on the density. In this case, obtained densities are regarded as valid and they are tested to know the UCS at 7 days.
Before performing the UCS tests [57], the samples are divided in two parts in order to have a contrast value for the UCS in each sample. Table 3 shows the results obtained.
Briefly, these specifications for the procedure with this material are adopted: three layers, with load applying time of 20 s and 5 metal sheets in the stand. With these specifications, UCS values are 15% greater than 2.1 MPa, the value required by the Spanish regulation [43].
Furthermore, densities obtained in the laboratory are similar to those required in real works. Therefore, laboratory conditions for this procedure do not imply manufacturing samples with better qualities. The proposed compacting procedure values achieved represented real compacting activities [41].
4.2. Results from Tests on the Manufactured Prismatic Samples
The 20 manufactured samples were stored in a curing room at 20 ± 2 °C and 35% relative humidity [58] for at least 90 days or longer until they are tested.
The properties that are compared to verify the characteristics similarity are the compaction density, the compaction grade difference between samples from the same batch, weight loss with regard to the manufacture, values in the four-point flexural beam test [59] with a load application velocity of 0.04 MPa/s [60], and CS with the two parts obtained after the FS test [57] with a load application velocity of 0.1 ± 0.001 MPa/s [61]. In the four-point flexural beam test, the Spanish standard [60] allows the choice of a constant increasing tension in the range 0.04–0.06 MPa/s. With the aim of avoiding the decomposition of the sample, 0.04 MPa/s is adopted, which guarantees that the load is applied in the slowest way and the final part of the test is programmed when a reduction of the strength of 5% is detected.
On the other hand, with regard to the two parts obtained after the FS test, the part with smaller dimensions was denoted as “A” and the one with bigger dimensions, “B”.
Any specimen couple with a difference over the 3% in the dry density will be discarded [39].
Table 4 shows the FS test results [59], dry density and for samples from the same batch, the density difference, for the 20 samples that composes the research.
As observed in Table 4, samples A1 and A2 obtained density values below those required [43]. These samples were selected as control samples, and the compaction layers were reduced from 3 to 2. They can be used for checking the initial hypothesis of similarity between FS of the odd sample (sample 1 in the batch) and even sample (sample 2 in the batch).
On the other hand, it can be observed that samples F1 and F2 have a density difference over the 3% and, hence, they were discarded for calculating the relation between FSodd and FSeven. Table 5 shows the results of the statistical analysis of the FS results.
As shown, samples have an average FS of 0.86 MPa, with a standard deviation of 0.09 MPa. Skewness and Kurtosis coefficients indicate that the result distribution follow a normal distribution. Therefore, despite the heterogeneity of the material, the compaction procedure allows similar values to be obtained.
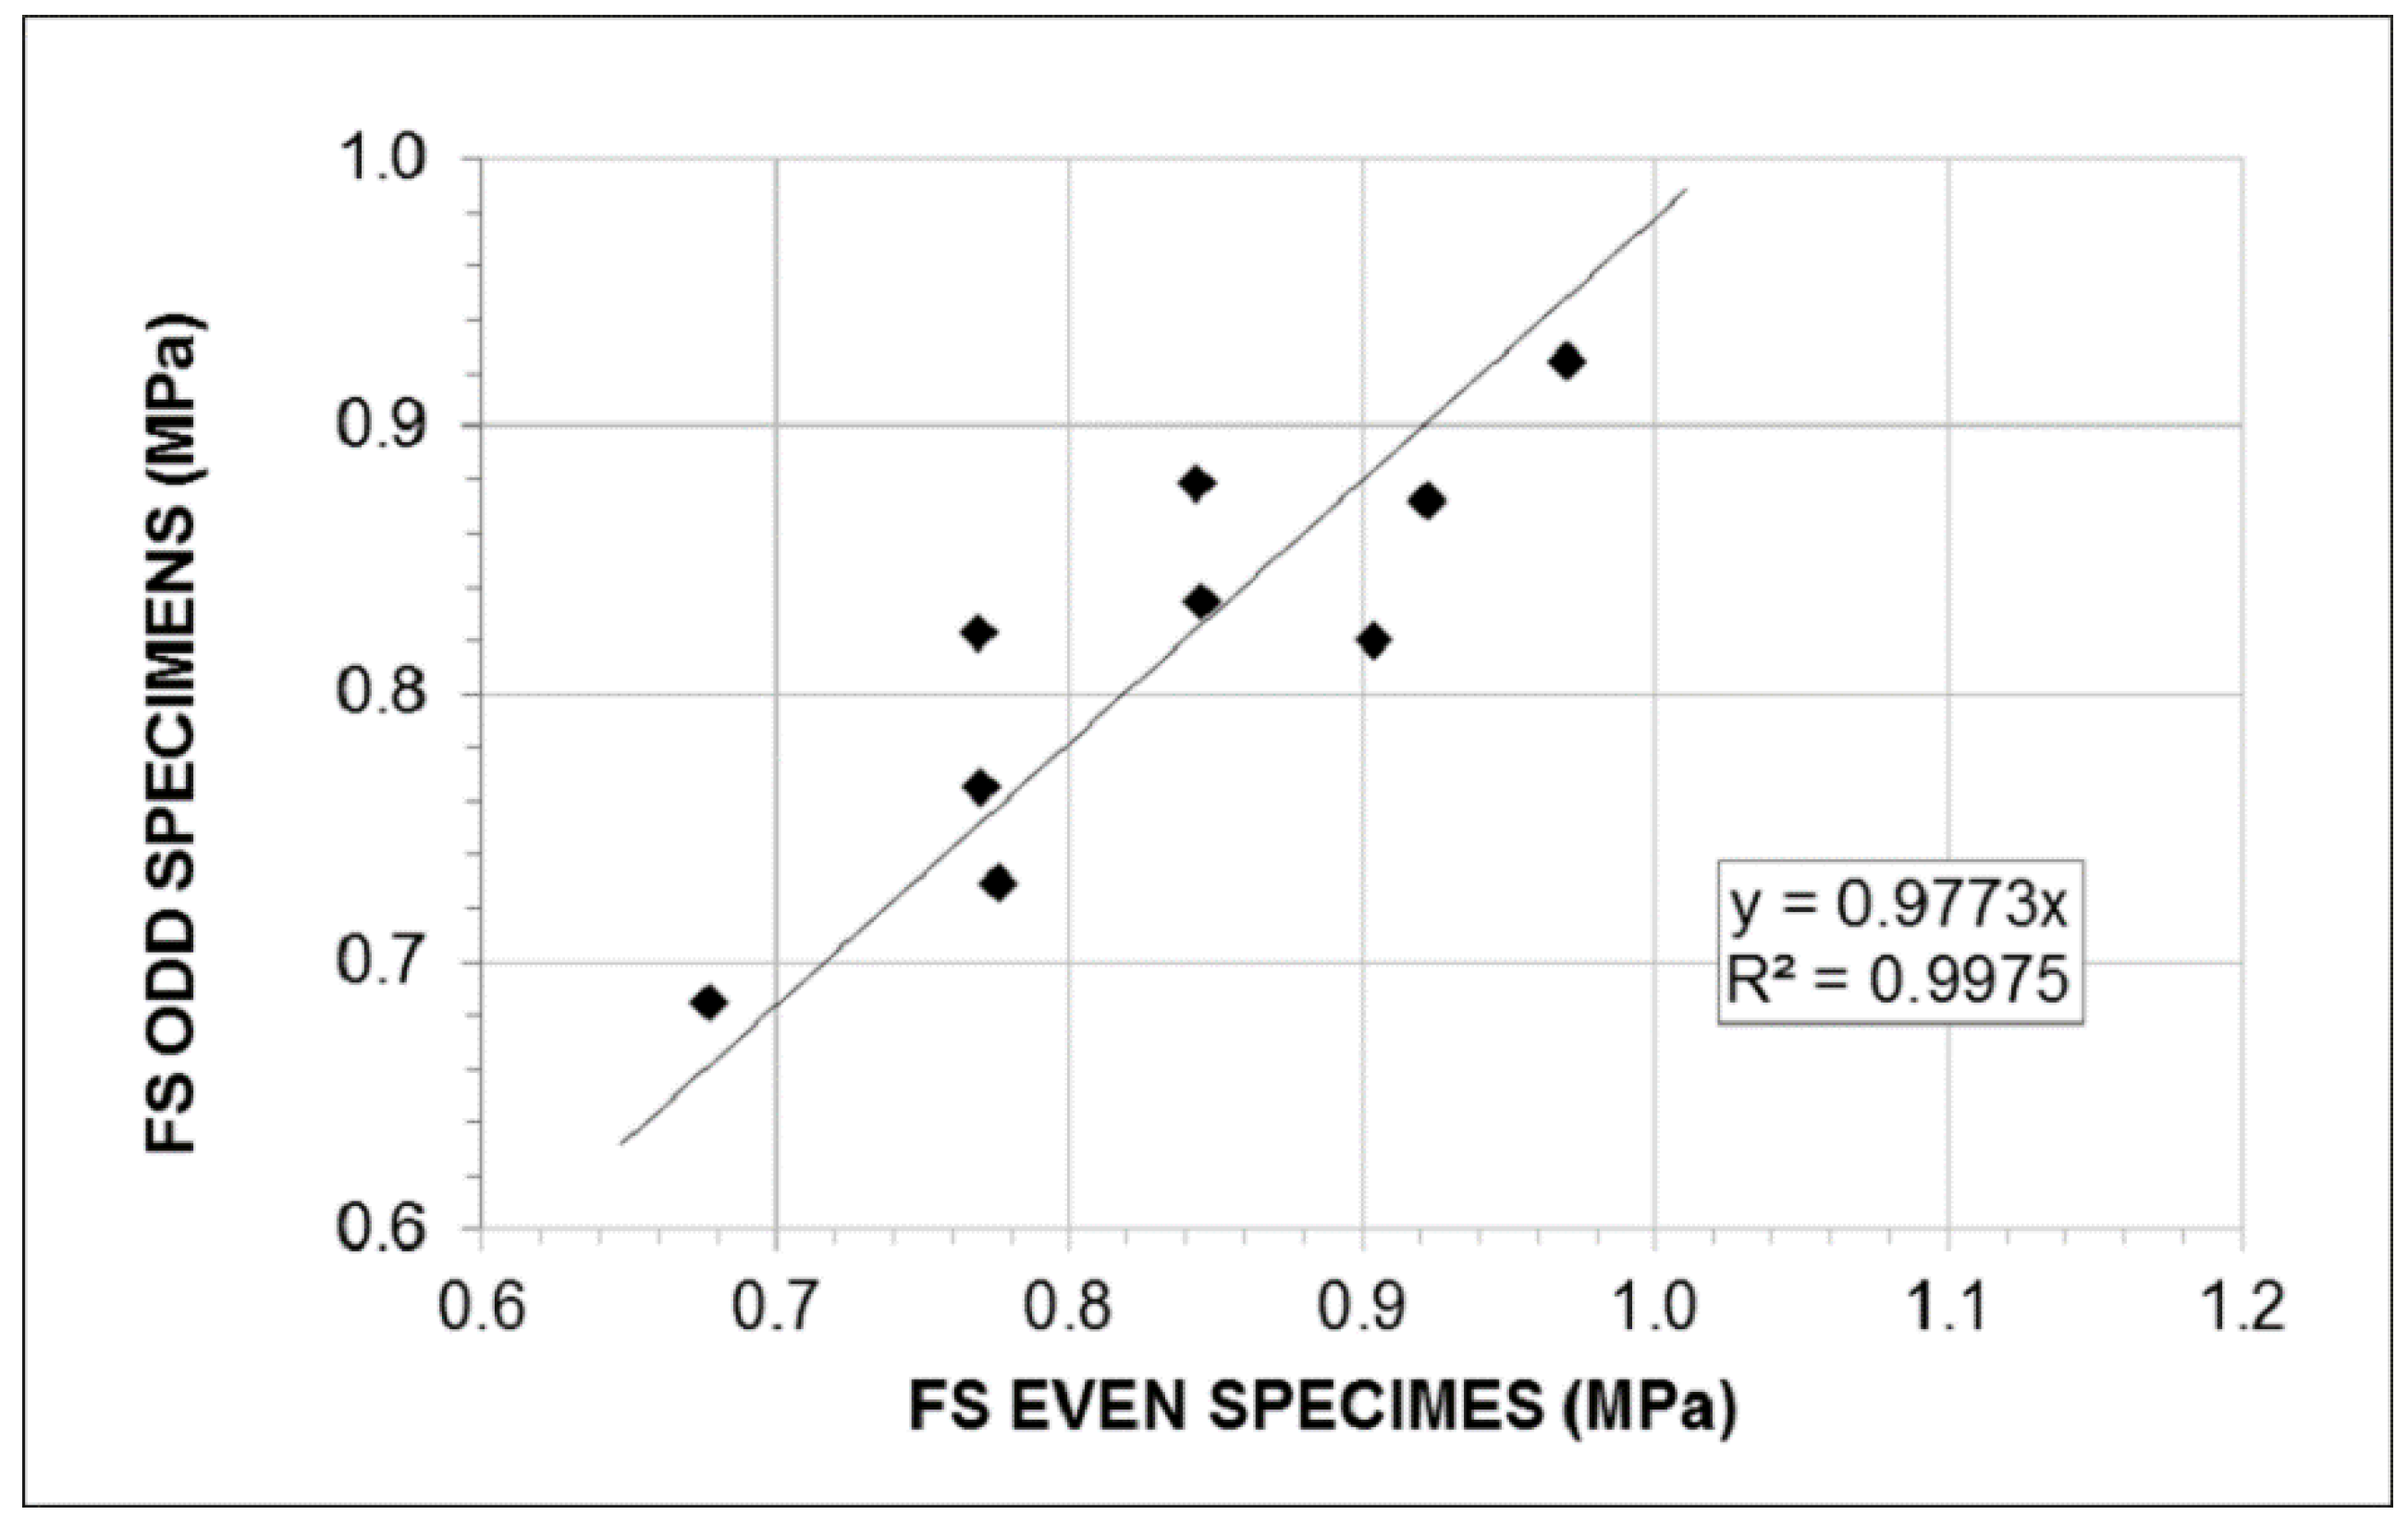
Figure 6 represents the relationships between FS values in odd and even samples of the same batch, modeled by a simple linear regression forced to go through the origin (without intercept). Table 6 shows a direct relationship between the long-term FS of the odd and even specimens of the same batch. Since the p-value of the t-test of the estimation of the slope is lower than 0.05, the hypothesis of null slope can be refused with 95% significance, which would imply that there is no relationship between specimens from the same batch.
As seen, the correlation coefficient is 0.99787, showing a strong relation between both variables, and, consequently, according to the determination coefficient, R2, the adjusted model would explain 99.75% of the variability of the FS. Analysis of variance (ANOVA) carried by the Fisher–Snedecor F-test reveals that FSodd influence FSeven with a 95% confidence level (p-value < 0.05). The estimated standard error shows that the standard deviation of the residuals is 0.0436 and the mean absolute error, which indicates the mean error value, is 0.0352. Since the lowest p-value of the Kolgomorov–Smirnov test is greater than 0.05, it can be assumed that the normal distribution of the residuals has a confidence level of 95%. The Durbin–Watson statistic reveals that there is no autocorrelation with residuals. In the residual graphs, no patterns have been observed.
Therefore, the analysis validates the proposed model of Figure 6, which points out that even samples have a very similar FS to odd ones.
Additionally, Table 7 shows the results of the UCS test [57] carried out on the parts obtained after performing the four-beam test, the dry density, the percentage of modified Proctor density, and, for each couple of parts from the same specimen, the average UCS.
As observed, the reduction of the density in specimens A1 and A2 also influences negatively the long-term UCS. Similar to the FS test, these samples were not considered when analyzing the UCS. However, they were taken into account in order to verify the initial hypothesis (similar characteristics in specimens manufactured from the same batch). There, since samples F1 and F2 have a difference in density of over 3%, they are not considered in the verification of the initial hypothesis. Nevertheless, they are taken into consideration when analyzing the stability of the UCS of the parts from the same specimen.
According to Table 8, the resulting parts have an average UCS of 4.38 MPa, with standard deviation of 0.43 MPa.
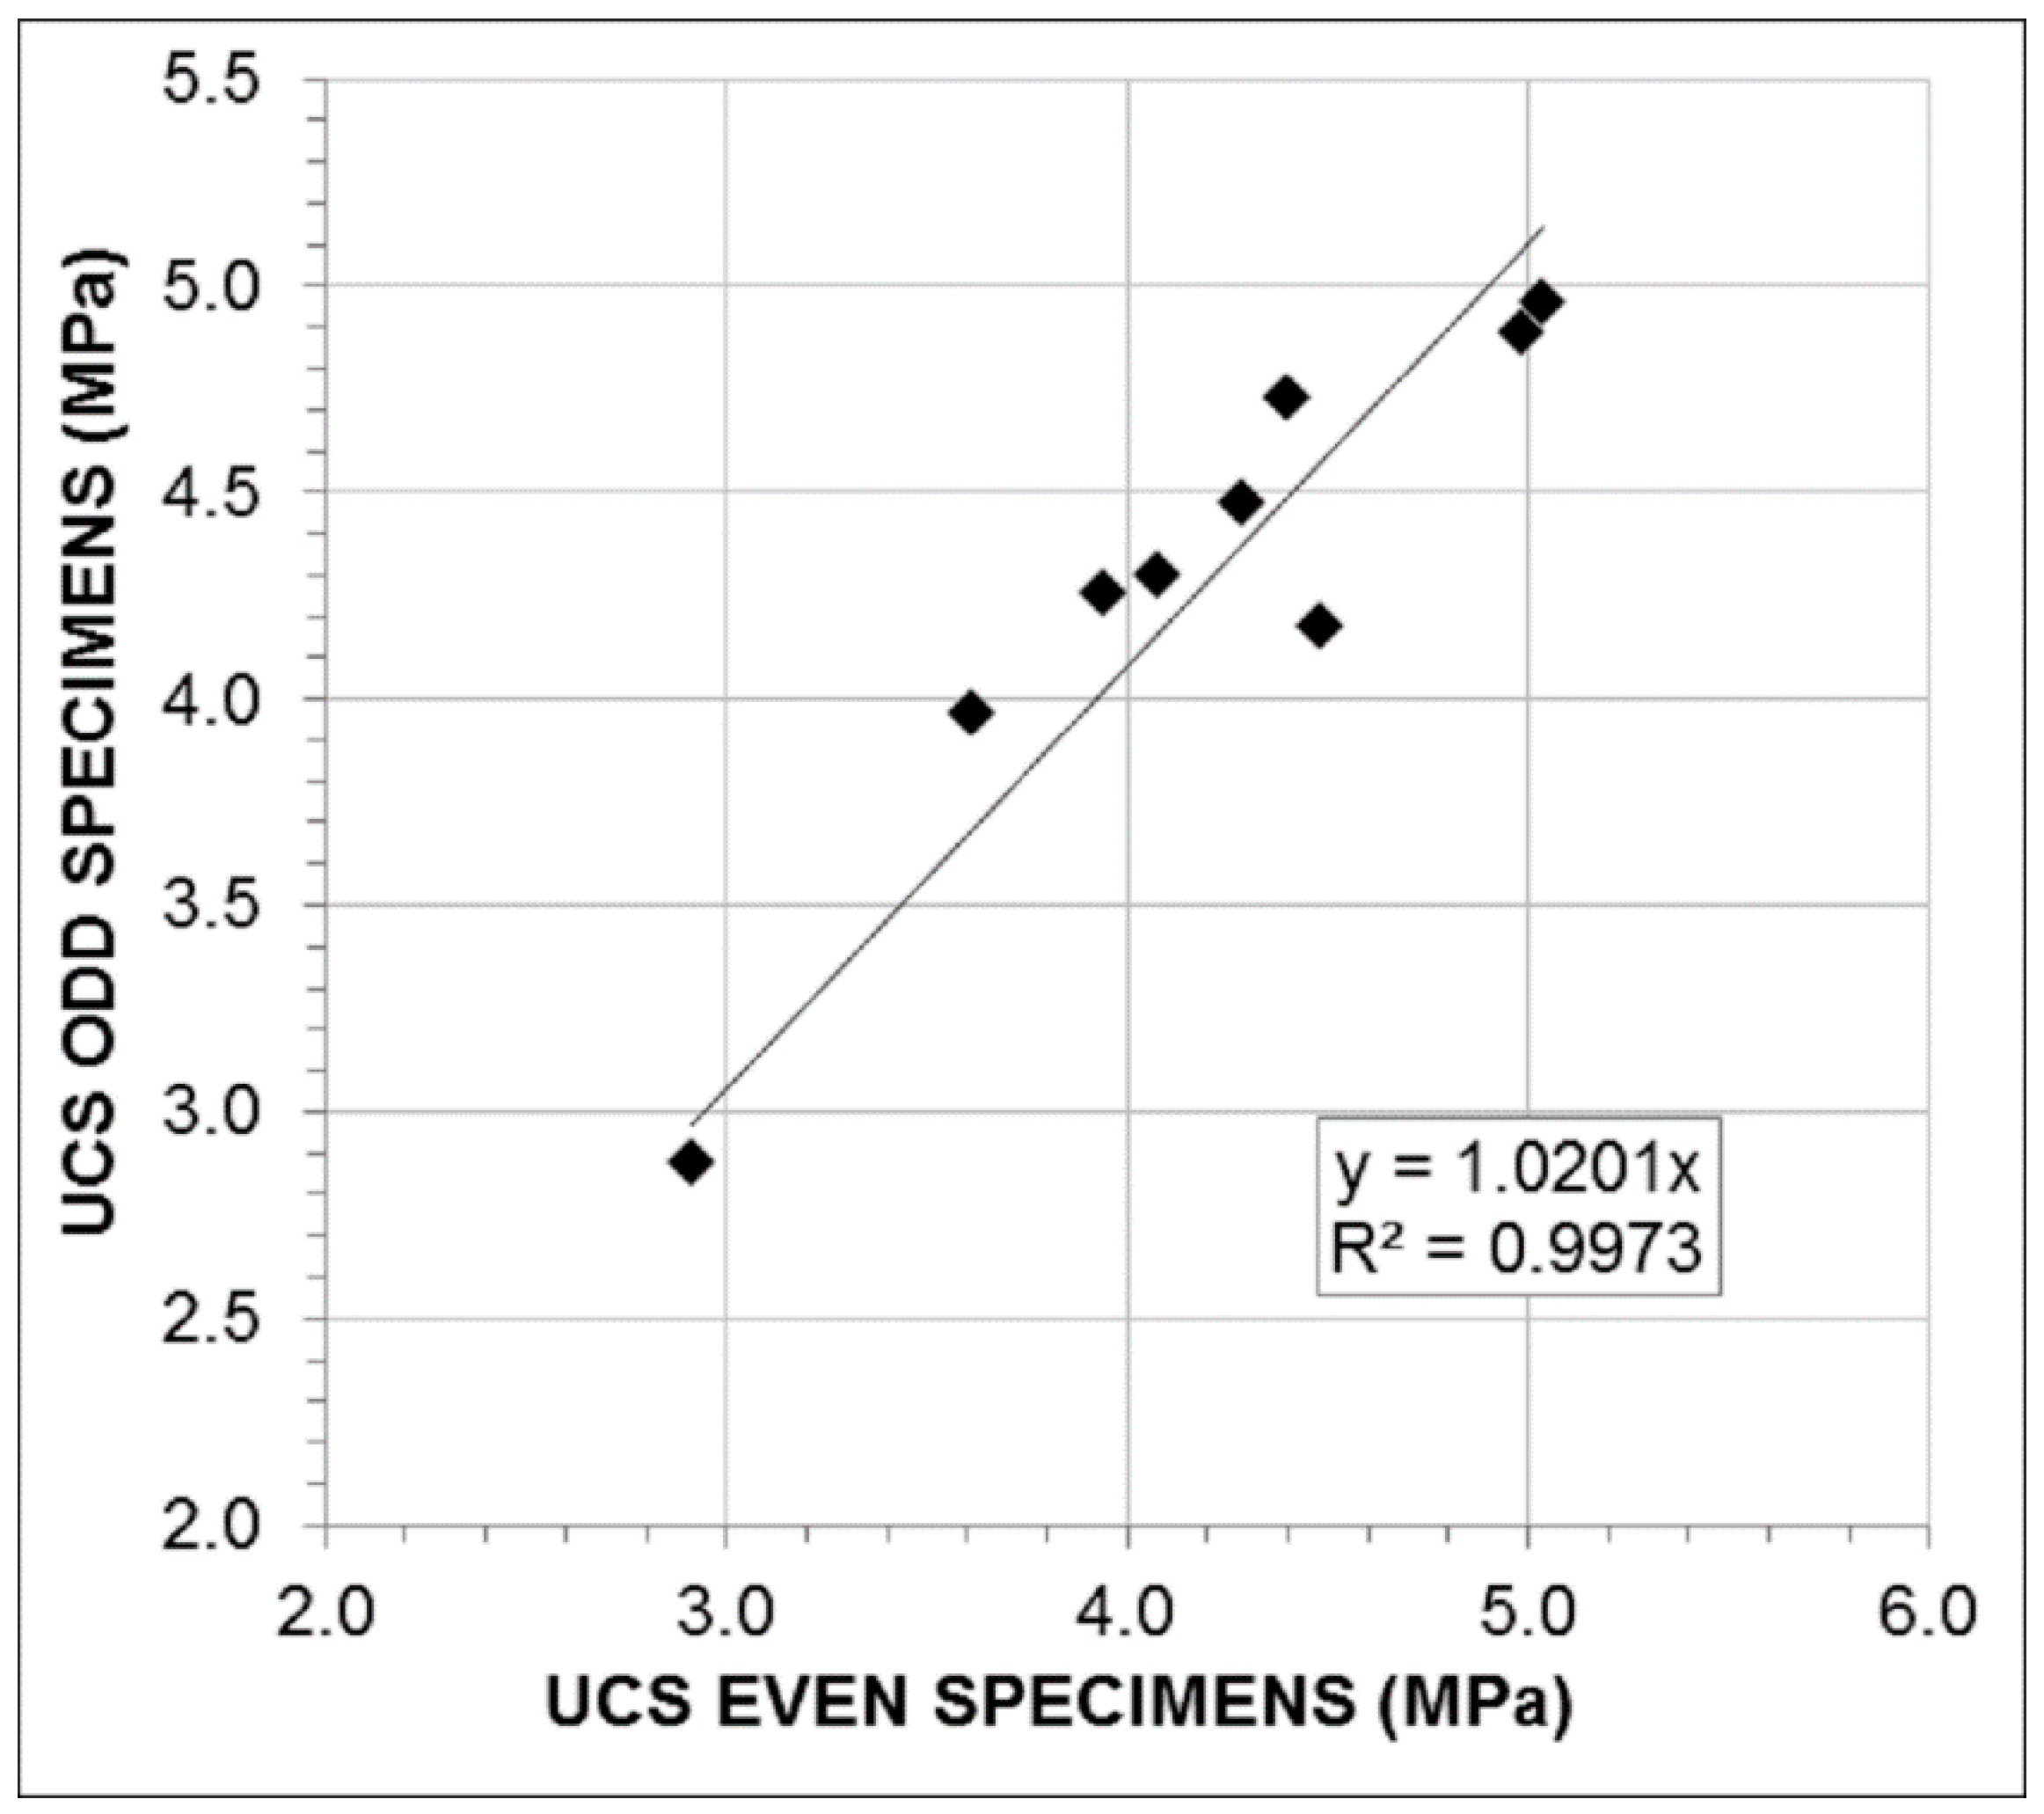
Figure 7 shows the relationship between the UCS mean values of prismatic parts A and B from the same batch.
As observed in Table 9, the p-value of the estimator of the slope indicates the existence of a direct and statistically significant relationship, with a 95% confidence level, for the long-term UCS between specimens from the same batch. The slope value shows that the even part has a greater UCS than the odd one.
ANOVA confirms that the UCS of the odd specimen has an influence on the UCS of the even specimen with a 95% confidence level (p-value < 0.05). With regard to the residuals, their normality and negative autocorrelation can be assumed with a 95% confidence level, and patterns were not detected in their observation. Therefore, the validity of the model proposed in Figure 6 was checked.
Figure 8 shows the relationship between UCS values obtained in the resulting prismatic parts from the first specimen of the batch (odd specimens) and in the second specimen of the batch (even specimens), i.e., the A and B parts from the divided sample in odd and even specimens are analyzed separately to verify the compaction grade and the reliability of the results. They are modeled by means of a simple linear regression, forced to pass through the origin, and their statistical analysis is resumed in Table 10.
Table 10 shows the direct relationship between the long-term UCS of the prismatic parts from the same specimen. Since the p-value of the estimation of the parameter of the slope, in both cases, is below 0.05, the null hypothesis of null slope can be rejected with a 95% confidence level, validating the relatively strong relationship between both variables. The value of the slope is very near to 1 and, hence, as could be expected, the UCS values of the prismatic parts are practically similar, but values obtained from bigger prismatic parts (B parts) are slightly greater. ANOVA reveals that the UCS of the A prismatic part has an influence on the UCS of the B prismatic parts, with a 95% confidence level (p-value < 0.05). As the lowest p-value in the Kolmogorov–Smirnov test is over 0.05, the normality of the residuals can be assumed with a 95% confidence level. No autocorrelation was detected in any of the cases. In both cases, no patterns were observed in the residual plots.
From both FS and UCS test results, it can be concluded that despite the heterogeneity of the material the compaction process allows specimens to be obtained with similar characteristics for the same batch since the relationship models between odd and even specimens have slopes very close to 1. On the other hand, within an individual sample, the proposed procedure allows a homogeneous internal distribution of the aggregates to be obtained, since both parts obtained after the FS test have very similar UCS values.
Therefore, the homogeneity of the results obtained and the density achieved make this method a suitable procedure for manufacturing prismatic samples of cement-treated base materials.
4.3. Comparison of the Long-Term Flexural Strength (FS) and Long-Term Unconfined Compressive Strength (UCS) Results with those Proposed by Other Authors
As for other materials that employ Portland cement, such as concrete [62], in soil-cement it is usual to correlate the long-term FS and the long-term UCS. This research, based on experimental data, obtained a mean value for FS at 90 days of 0.86 MPa, and a mean value for UCS at 90 days of 4.38 MPa. In Table 11, these figures were compared with those obtained from formulae proposed by other authors (Equations (1)–(4)) in order to verify the suitability of the compaction procedure explained.
FS = 0.2 × UCS
FS = 0.25 × UCS
UCS(28) = 0.6947 × UCS(7) + 2.0354
UCS(t) = UCS(28) × t/(2.5 + 0.9 × t)
The UCS(7) value of Table 3 was obtained by means of the UCS at 7 days of the samples P5 and P6 of Table 3. As observed, the FS estimations from the UCS values are very similar to those obtained experimentally. Therefore, as the modified Proctor densities, UCS at 7 days and long-term FS and UCS are adequate, the compaction device and procedure presented here are able to manufacture quality prismatic specimens. This iterative procedure is not only valid for the employed soil-cement mixture but for the flexural strength characterization by means of prismatic specimens of any cement-treated material.
5. Conclusions
The aim of this experimental research was to introduce a new compaction procedure of prismatic specimens for cement-treated materials (CTM). The study was performed with a soil-cement with 3.5% of cement in weight. In order to verify the suitability of the procedure, 10 batches were carried out and, from each one, an “odd” and an “even” sample were manufactured. Then, those specimens were tested with the FS test, associated with soil-cement performance to withstand the cyclic loads generated by traffic during their life-cycles, and with the UCS test, closely related to the quality of the produced soil-cement.
Based on the results, some conclusions for the material tested can be stated:
- The percentage of the modified Proctor density achieved is equal to or above 98%, which is established as the minimum for this material by the Spanish standard [43]. The particularity of the proposed iterative procedure is that, apart from being effective for this type of mixing (for the soil-cement), it is also useful for any kind of prismatic sample of cement-treated material.
- The improvement of the workability and compaction of the prismatic specimens could require the moisture content to be above that which the maximum dry density indicates, according to the modified Proctor compaction procedure. This conclusion could be extracted from the material employed but it would need a further analysis of the iterative process with a different material.
- Differences over 3% on the modified Proctor densities in specimens from the same batch leads to differences in the FS and UCS, which means they can be considered as dissimilar. Therefore, they must be rejected for tests that compare their results. This percentage could be used as a reference value for other CTM.
- The long-term FS and UCS results for this mixture were usual for this kind of base material (UCS around 4 MPa and FS around 0.9 MPa at 90 days). Hence, the validity of the experimental method presented here is confirmed.
Consequently, the suitability of a new procedure for manufacturing prismatic samples is verified and this could be adapted to different cement-treated base mixtures by varying the number of metallic sheets (over the stand) and vibrating time as a function of each material. Moreover, some devices like the vibrating table and moulds are commonly available in a typical testing laboratory. Non-standard elements, like the stand and sheets, do not require a high budget.
Initially, some trials must be performed to select the number of sheets and vibrating time. After a valid density is obtained, specimens are produced in a fast way.
Furthermore, the resulting samples are of high quality and, hence, the test results will be reliable and will improve knowledge of the CTM, especially in the long term, because this method facilitates the manufacture of specimens that can be tested in flexural and fatigue tests. This device and procedure offers a method suitable for introduction as a standard for the fabrication of specimens, where the qualification and experience of the testing team is not a critical factor.
Author Contributions
All the author have contributed in this work similarly.
Funding
This research was funded by the Education Council of the Castille and Leon Government of Spain (Junta de Castilla y León) grant number BU009A06 and UB 07/03.
Conflicts of Interest
The authors declare no conflict of interest.
References
- Bell, F.G. Engineering Treatment of Soils; E & FN Spon: London, UK, 1993. [Google Scholar]
- IECA-CEDEX. Manual de Firmes con Capas Tratadas con Cemento, 2nd ed.; Centro de Estudios y Experimentación de Obras Públicas (CEDEX): Madrid, France, 2003; p. 265. [Google Scholar]
- Disfani, M.M.; Arulrajah, A.; Haghighi, H.; Mohammadinia, A.; Horpibulsuk, S. Flexural beam fatigue strength evaluation of crushed brick as a supplementary material in cement stabilized recycled concrete aggregates. Constr. Build. Mater. 2014, 68, 667–676. [Google Scholar] [CrossRef]
- Hou, Y.; Ji, X.; Su, X. Mechanical properties and strength criteria of cement-stabilised recycled concrete aggregate. Int. J. Pavement Eng. 2017, 1–10. [Google Scholar] [CrossRef]
- Nunes, M.C.M.; Bridges, M.G.; Dawson, A.R. Assessment of secondary materials for pavement construction: Technical and environmental aspects. Waste Manag. 1996, 16, 87–96. [Google Scholar] [CrossRef]
- Poon, C.S.; Chan, D. Feasible use of recycled concrete aggregates and crushed clay brick as unbound road sub-base. Constr. Build. Mater. 2006, 20, 578–585. [Google Scholar] [CrossRef]
- Akbulut, H.; Gürer, C. Use of aggregates produced from marble quarry waste in asphalt pavements. Build. Environ. 2007, 42, 1921–1930. [Google Scholar] [CrossRef]
- Arulrajah, A.; Ali, M.M.Y.; Piratheepan, J.; Bo, M.W.M.A. Geotechnical Properties of Waste Excavation Rock in Pavement Subbase Applications. J. Mater. Civ. Eng. 2012, 24, 924–932. [Google Scholar] [CrossRef]
- Tahmoorian, F.; Samali, B.; Tam, V.; Yeaman, J. Evaluation of Mechanical Properties of Recycled Material for Utilization in Asphalt Mixtures. Appl. Sci. 2017, 7, 763. [Google Scholar] [CrossRef]
- Jullien, A.; Proust, C.; Martaud, T.; Rayssac, E.; Ropert, C. Variability in the environmental impacts of aggregate production. Resour. Conserv. Recycl. 2012, 62, 1–13. [Google Scholar] [CrossRef] [Green Version]
- Magnusson, S.; Lundberg, K.; Svedberg, B.; Knutsson, S. Sustainable management of excavated soil and rock in urban areas—A literature review. J. Clean. Prod. 2015, 93, 18–25. [Google Scholar] [CrossRef]
- Mathieu, P.; Pierre, H.; Olivier, C.; Thomas, L. Use of Treated Soils for Sustainable Rail Infrastructures. Procedia Soc. Behav. Sci. 2012, 48, 276–286. [Google Scholar] [CrossRef]
- Jayasinghe, C.; Mallawaarachchi, R.S. Flexural strength of compressed stabilized earth masonry materials. Mater. Des. 2009, 30, 3859–3868. [Google Scholar] [CrossRef]
- Aymerich, F.; Fenu, L.; Francesconi, L.; Meloni, P. Fracture behaviour of a fibre reinforced earthen material under static and impact flexural loading. Constr. Build. Mater. 2016, 109, 109–119. [Google Scholar] [CrossRef]
- Jayasinghe, C.; Fonseka, W.M.C.D.J.; Abeygunawardhene, Y.M. Load bearing properties of composite masonry constructed with recycled building demolition waste and cement stabilized rammed earth. Constr. Build. Mater. 2016, 102 Pt 1, 471–477. [Google Scholar] [CrossRef]
- Adaska, W.S. ACI Committee 230 1R-90. State-of-the-art report on soil-cement. Mater. J. 1997, 87, 395–417. [Google Scholar] [CrossRef]
- Baghini, M.S.; Ismail, A.; Firoozi, A.A. Physical and Mechanical Properties of Carboxylated Styrene-butadiene Emulsion Modified Portland Cement Used in Road Base Construction. J. Appl. Sci. 2016, 16, 344–358. [Google Scholar] [CrossRef]
- Lv, S.; Liu, C.; Lan, J.; Zhang, H.; Zheng, J.; You, Z. Fatigue Equation of Cement-Treated Aggregate Base Materials under a True Stress Ratio. Appl. Sci. 2018, 8, 691. [Google Scholar] [CrossRef]
- Ismail, A.; Baghini, M.S.; Karim, M.R.; Shokri, F.; Al-Mansob, R.A.; Firoozi, A.A.; Firoozi, A.A. Laboratory Investigation on the Strength Characteristics of Cement-Treated Base. AMM Appl. Mech. Mater. 2014, 507, 353–360. [Google Scholar] [CrossRef]
- Francois, A.; Ali, A.; Mehta, Y. Evaluating the impact of different types of stabilised bases on the overall performance of flexible pavements. Int. J. Pavement Eng. 2017, 1–9. [Google Scholar] [CrossRef]
- Brown, S.F. Design of pavements with lean-concrete bases. Transp. Res. Rec. 1979, 725, 51–58. [Google Scholar]
- Williams, R.I.T. Cement-Treated Pavements: Materials, Design and Construction; Elsevier Applied Science Publishers: London, UK, 1986; Volume XIX, 746p. [Google Scholar]
- Xuan, D.X.; Houben, L.J.M.; Molenaar, A.A.A.; Shui, Z.H. Mechanical properties of cement-treated aggregate material—A review. Mater. Des. 2012, 33, 496–502. [Google Scholar] [CrossRef]
- Papadopoulos, E.; Santamarina, J.C. Inverted base pavements: Construction and performance. Int. J. Pavement Eng. 2017, 1–7. [Google Scholar] [CrossRef]
- Kolias, S.; Williams, R.I.T. Cement-Bound Road Materials: Strength and Elastic Properties Measured in the Laboratory; Report SR 344; Transport and Road Research Laboratory: Crowthorne, UK, 1978. [Google Scholar]
- Otte, E. A structural Design Procedure for Cement-Treated Layers in Pavements; Faculty of Engineering, University of Pretoria: Pretoria, South Africa, 1978. [Google Scholar]
- Austroads. Publication No. AP–T101/08. The Development and Evaluation of Protocols for the Laboratory Characterisation of Cemented Materials; Austroads: Sydney, Australia, 2008. [Google Scholar]
- Díaz, J. El Estudio de Comportamiento de los Firmes Reciclados In Situ con Cemento. Ph.D. Thesis, Universidad de Burgos (España), Burgos, Spain, 2011. [Google Scholar]
- Han, Y.J.; Oh, S.K.; Kim, B. Effect of Load Transfer Section to Toughness for Steel Fiber-Reinforced Concrete. Appl. Sci. 2017, 7, 549. [Google Scholar] [CrossRef]
- Mansoor, J.; Shah, S.; Khan, M.; Sadiq, A.; Anwar, M.; Siddiq, M.; Ahmad, H. Analysis of Mechanical Properties of Self Compacted Concrete by Partial Replacement of Cement with Industrial Wastes under Elevated Temperature. Appl. Sci. 2018, 8, 364. [Google Scholar] [CrossRef]
- Reeder, G.D.; Harrington, D.; Ayers, M.E.; Adaska, W.S. Guide to Full-Depth Reclamation (FDR) with Cement; National Concrete Pavement Technology Center, Institute for Transportation of Iowa State University: Ames, IA, USA; Portland Cement Association: Washington, DC, USA, 2017. [Google Scholar]
- ASTM. D1632-17: Standard Practice for Making and Curing Soil-Cement Compression and Flexure Test Specimens in the Laboratory; American Society for Testing and Materials International (ASTM): West Conshohocken, PA, USA, 2017. [Google Scholar]
- Kersten, M.S. Soil Stabilization with Portland Cement; National Academy of Sciences-National Research Council: Washington, DC, USA, 1961. [Google Scholar]
- Thompson, M.R. Mechanistic Design Concepts for Stabilized Base Pavements; Department of Transportation Federal Highway Administration, University of Illinois: Champaign, IL, USA, 1986. [Google Scholar]
- Lim, S.; Zollinger, D.G. Estimation of the compressive strength and modulus of elasticity of cement-treated aggregate base materials. Transp. Res. Rec. 2003, 1837, 30–38. [Google Scholar] [CrossRef]
- Vicente, M.A.; González, D.C.; Gonzalo-Orden, H.; Linares, A. Procedimiento y Dispositivo para la Compactación de Probetas Prismáticas para la Caracterización de Materiales Granulares Tratados con Conglomerantes Hidráulicos Para su uso en Carreteras; Número de Publicación: 2394801; Oficina Española de Patentes y Marcas (OEPM): Madrid, Spain, 2014. [Google Scholar]
- Díaz, J.; Linares, A.; González, D.; Gonzalo-Orden, H. In situ pavement recycling with cement design. In Proceedings of the 4th European Pavement and Asset Management Conference (EPAM), Malmö, Sweden, 5–7 September 2012. [Google Scholar]
- Díaz, J.; Gonzalo-Orden, H.; González, D.; Linares, A. Behavior pavement recycling with cement. In Proceedings of the 12th International Symposium on Concrete Roads, Prague, Czech Republic, 23–26 September 2014. [Google Scholar]
- Linares, A. Metodología Para el Avance en la Caracterización del Suelocemento de Aplicación en Firmes Semirrígidos. Ph.D. Thesis, Universidad de Burgos, Burgos, Spain, 2015. [Google Scholar]
- Arnold, G.; Morkel, C.; Westhuizen, G. Development of Tensile Fatigue Criteria for Bound Materials; Research Report 463; NZ Transport Agency: Wellington, New Zealand, 2011.
- Bejan, S.; Pérez-Acebo, H. Modeling the Dynamic Interaction between a Vibratory-Compactor and Ground. Rom. J. Acoust. Vib. 2016, 12, 94–97. [Google Scholar]
- AENOR. Norma UNE 103.101 Análisis Granulométrico de Suelos por Tamizado; Asociación Española de Normalización y Certificación (AENOR): Madrid, Spain, 1995. [Google Scholar]
- MFOM. Pliego de Prescripciones Técnicas Generales para Obras de Carretera y Puentes (PG-3); Ministerio De Fomento: Madrid, Spain, 2015. [Google Scholar]
- ASTM. D4318-17: Standard Test Methods for Liquid Limit, Plastic Limit, and Plasticity Index of Soils; American Society for Testing and Materials International (ASTM): West Conshohocken, PA, USA, 2017. [Google Scholar]
- ASTM. D2419-14: Standard Test Method for Sand Equivalent Value of Soils and Fine Aggregate; American Society for Testing and Materials International (ASTM): West Conshohocken, PA, USA, 2014. [Google Scholar]
- ASTM. D2487-11: Standard Practice for Classification of Soils for Engineering Purposes (Unified Soil Classification System); American Society for Testing and Materials International (ASTM): West Conshohocken, PA, USA, 2011. [Google Scholar]
- ASTM. D2974-14: Standard Test Methods for Moisture, Ash, and Organic Matter of Peat and Other Organic Soils; American Society for Testing and Materials International (ASTM): West Conshohocken, PA, USA, 2014. [Google Scholar]
- ASTM. C1580-15: Standard Test Method for Water-Soluble Sulfate in Soil; American Society for Testing and Materials International (ASTM): West Conshohocken, PA, USA, USA, 2014. [Google Scholar]
- AENOR. UNE 103-501-94: Geotecnia: Ensayo de Compactación Proctor Modificado; Asociación Española de Normalización y Certificación (AENOR): Madrid, Spain, 1994. [Google Scholar]
- ASTM. D1557-12e1: Standard Test Methods for Laboratory Compaction Characteristics of Soil Using Modified Effort (56,000 ftlbf/ft3 (2700 kN-m/m3)); American Society for Testing and Materials International (ASTM): West Conshohocken, PA, USA, 2012. [Google Scholar]
- BS. BS-1924-1: Stabilized Materials for Civil Engineering Purposes. General Requirements, Sampling, Sample Preparation and Tests on Materials Before Stabilization; British Standards Institution: London, UK, 1990. [Google Scholar]
- TMR. Technical Standard MRTS08 Plant-Mixed Stabilised Pavements Using Cement or Cementitious Blends: Transport and Main Roads Specifications; Department of Transport and Main Roads: Spring Hill, Australia, 2010.
- CCANZ. IB-89. Cement Stabilisation; Cement and Concrete Association of New Zealand: Wellington, New Zealand, 2008. [Google Scholar]
- Molenaar, A.A.A. Road Materials-Part II: Soil Stabilization (Lecture CT4850); Delft University of Technology: Delft, The Netherlands, 1998. [Google Scholar]
- MOC. JTJ034-2000: Technical Specifications for Construction of Highway Road Bases; Ministry of Communications of the People’s Republic of China: Beijing, China, 2000.
- AENOR. UNE-EN 12390-1: Parte 1: Forma, Medidas y Otras Características; Asociación Española de Normalización y Certificación (AENOR): Madrid, Spain, 2013. [Google Scholar]
- ASTM. D1634-00: Standard Test Method for Compressive Strength of Soil-Cement Using Portions of Beams Broken in Flexure (Modified Cube Method) (Withdrawn 2015); American Society for Testing and Materials International (ASTM): West Conshohocken, PA, USA, 2006. [Google Scholar]
- AENOR. UNE-EN 12390-2. Parte 2: Fabricación y Curado de Probetas para Ensayos de Resistencia; Asociación Española de Normalización y Certificación (AENOR): Madrid, Spain, 2009. [Google Scholar]
- ASTM. D1635/D1635M-12: Standard Test Method for Flexural Strength of Soil-Cement Using Simple Beam with Third-Point Loading; American Society for Testing and Materials International (ASTM): West Conshohocken, PA, USA, 2012. [Google Scholar]
- AENOR. UNE-EN 12390-5. Parte 5: Resistencia a Flexión de Probetas; Asociación Española de Normalización y Certificación (AENOR): Madrid, Spain, 2009. [Google Scholar]
- CEDEX. Norma NLT-305/90. Resistencia a Compresión Simple de Materiales Tratados con Conglomerantes Hidráulicos; CEDEX, Dirección General de Carreteras, Ministerio de Fomento: Madrid, Spain, 1990. [Google Scholar]
- Hong, S. Influence of Curing Conditions on the Strength Properties of Polysulfide Polymer Concrete. Appl. Sci. 2017, 7, 833. [Google Scholar] [CrossRef]
Figure 1.
New device for compacting prismatic specimens. Units: cm.

Figure 2.
Diagram of the procedure to achieve the required density with the proposed compaction device.
Figure 2.
Diagram of the procedure to achieve the required density with the proposed compaction device.
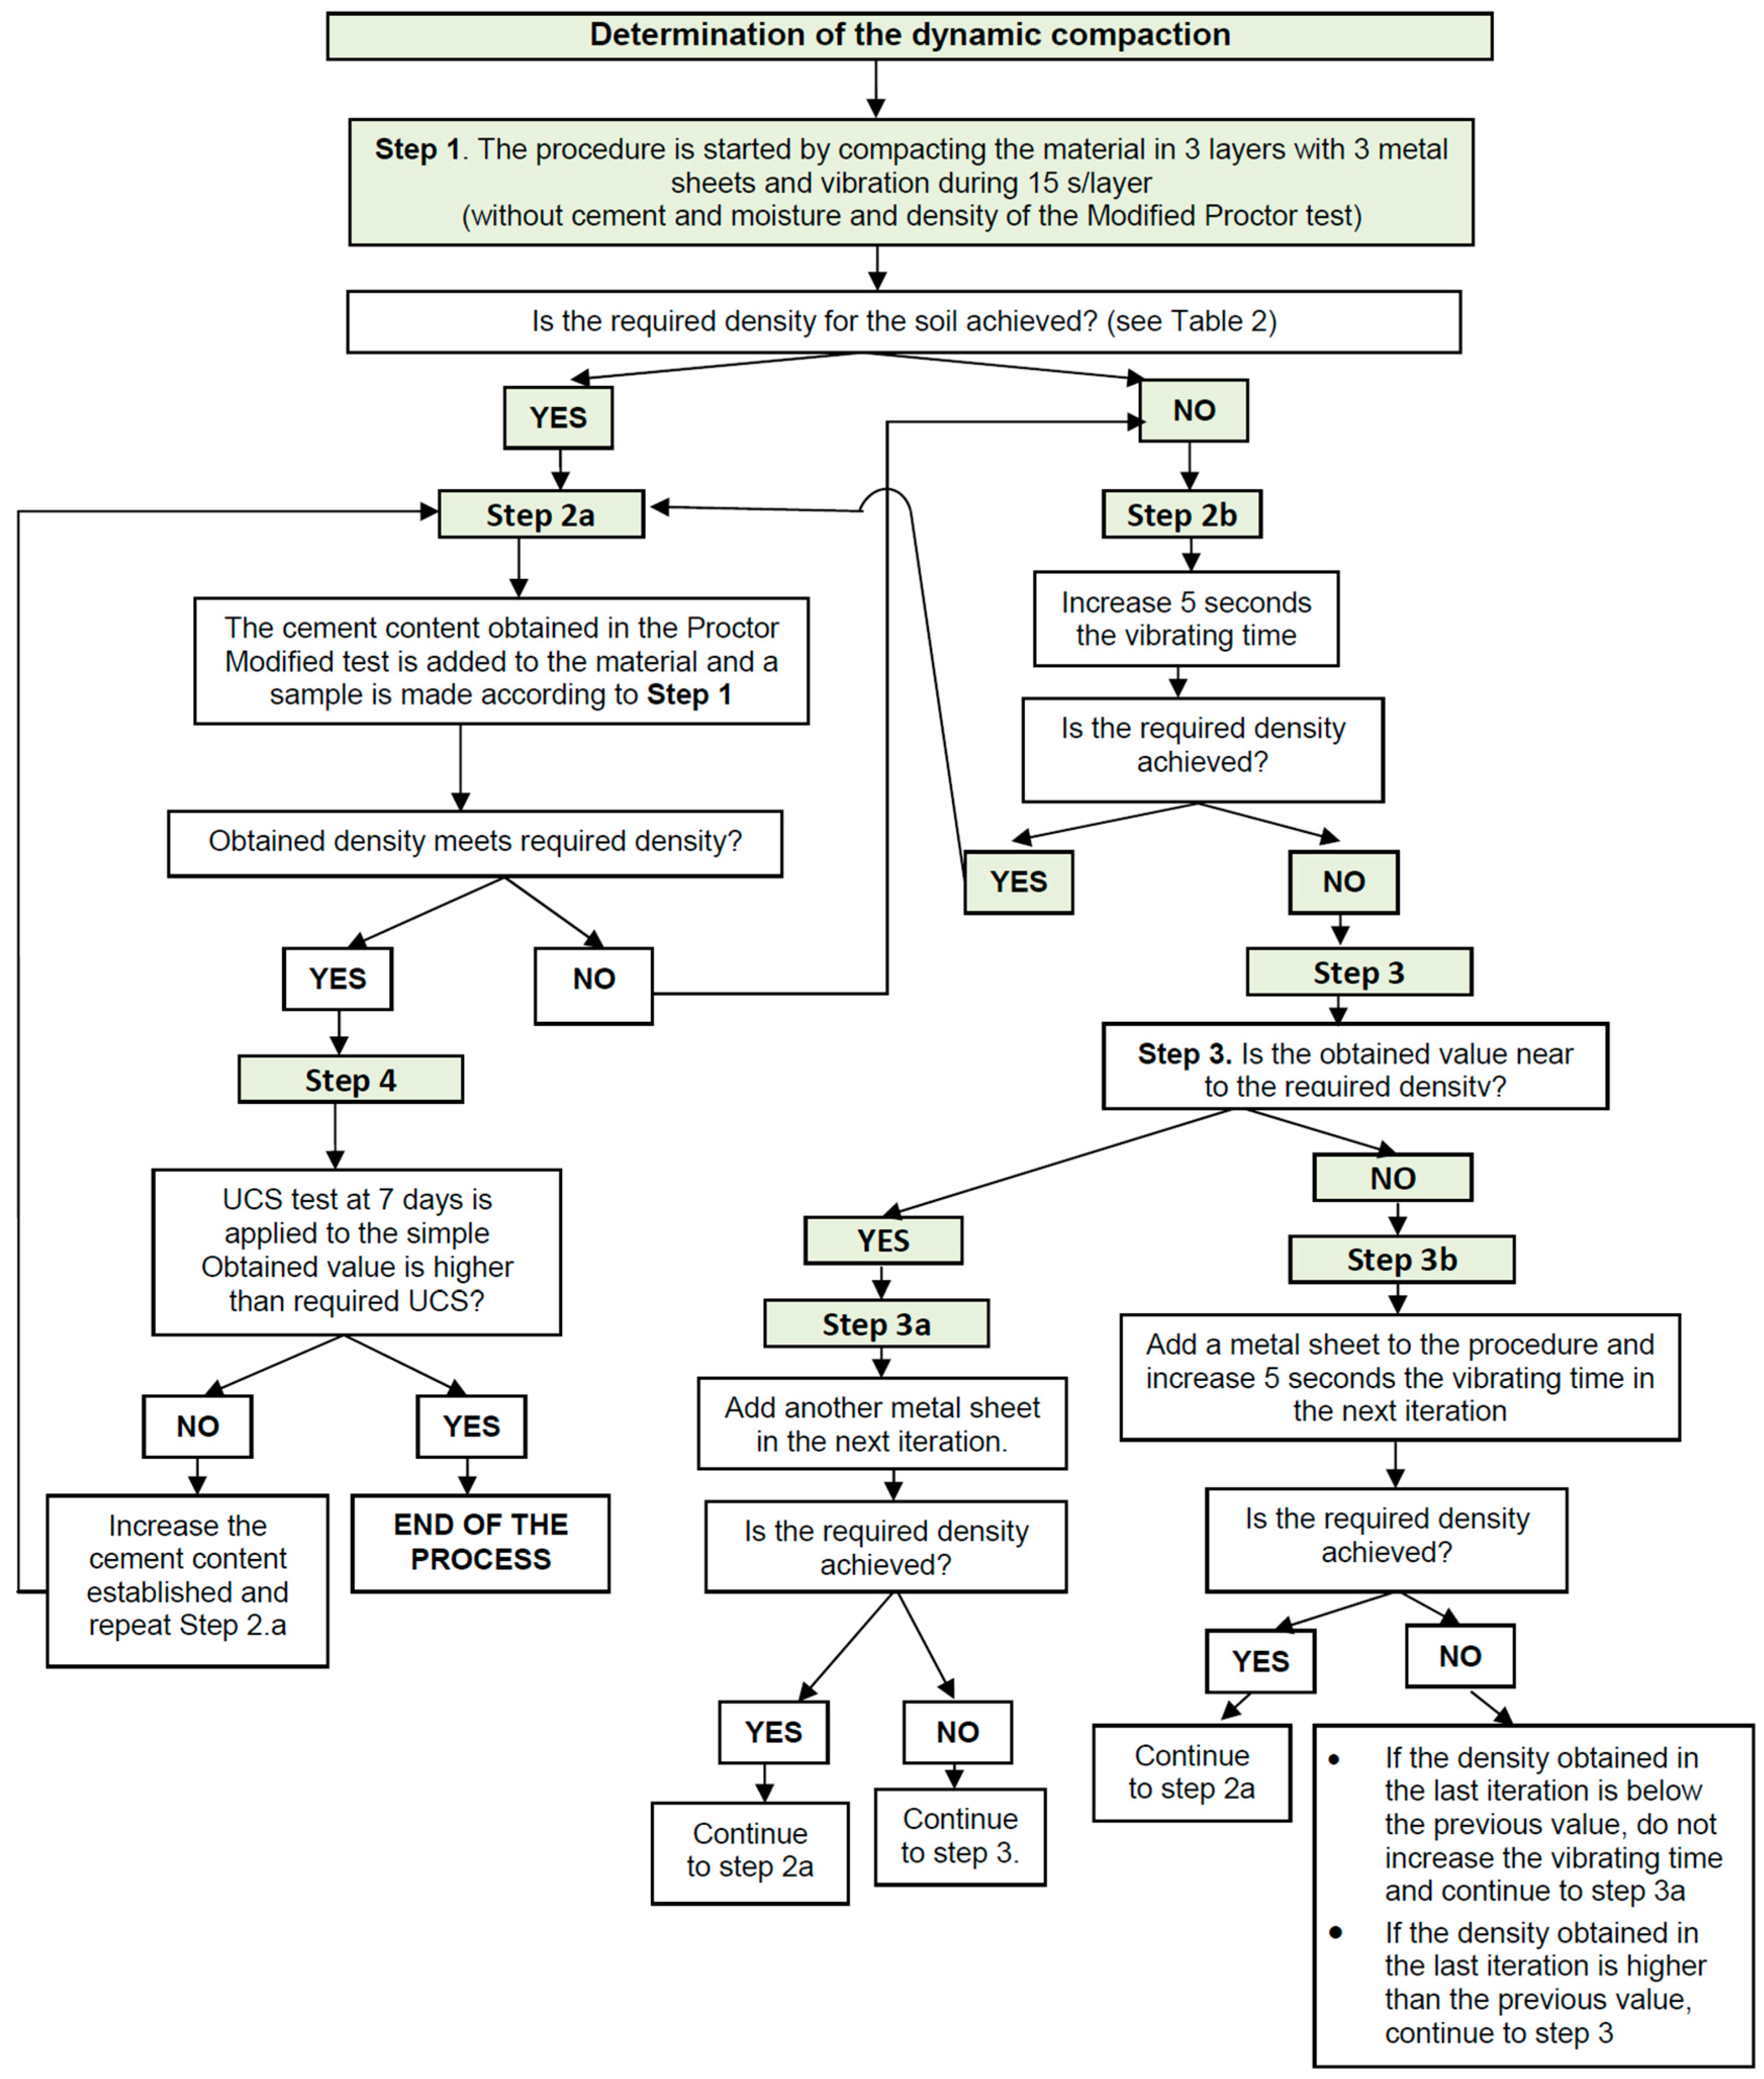
Figure 3.
Soil granulometry and granolumetry range for SC 40.

Figure 4.
Modified Proctor density of the soil-cement with a 3.5% content of cement.
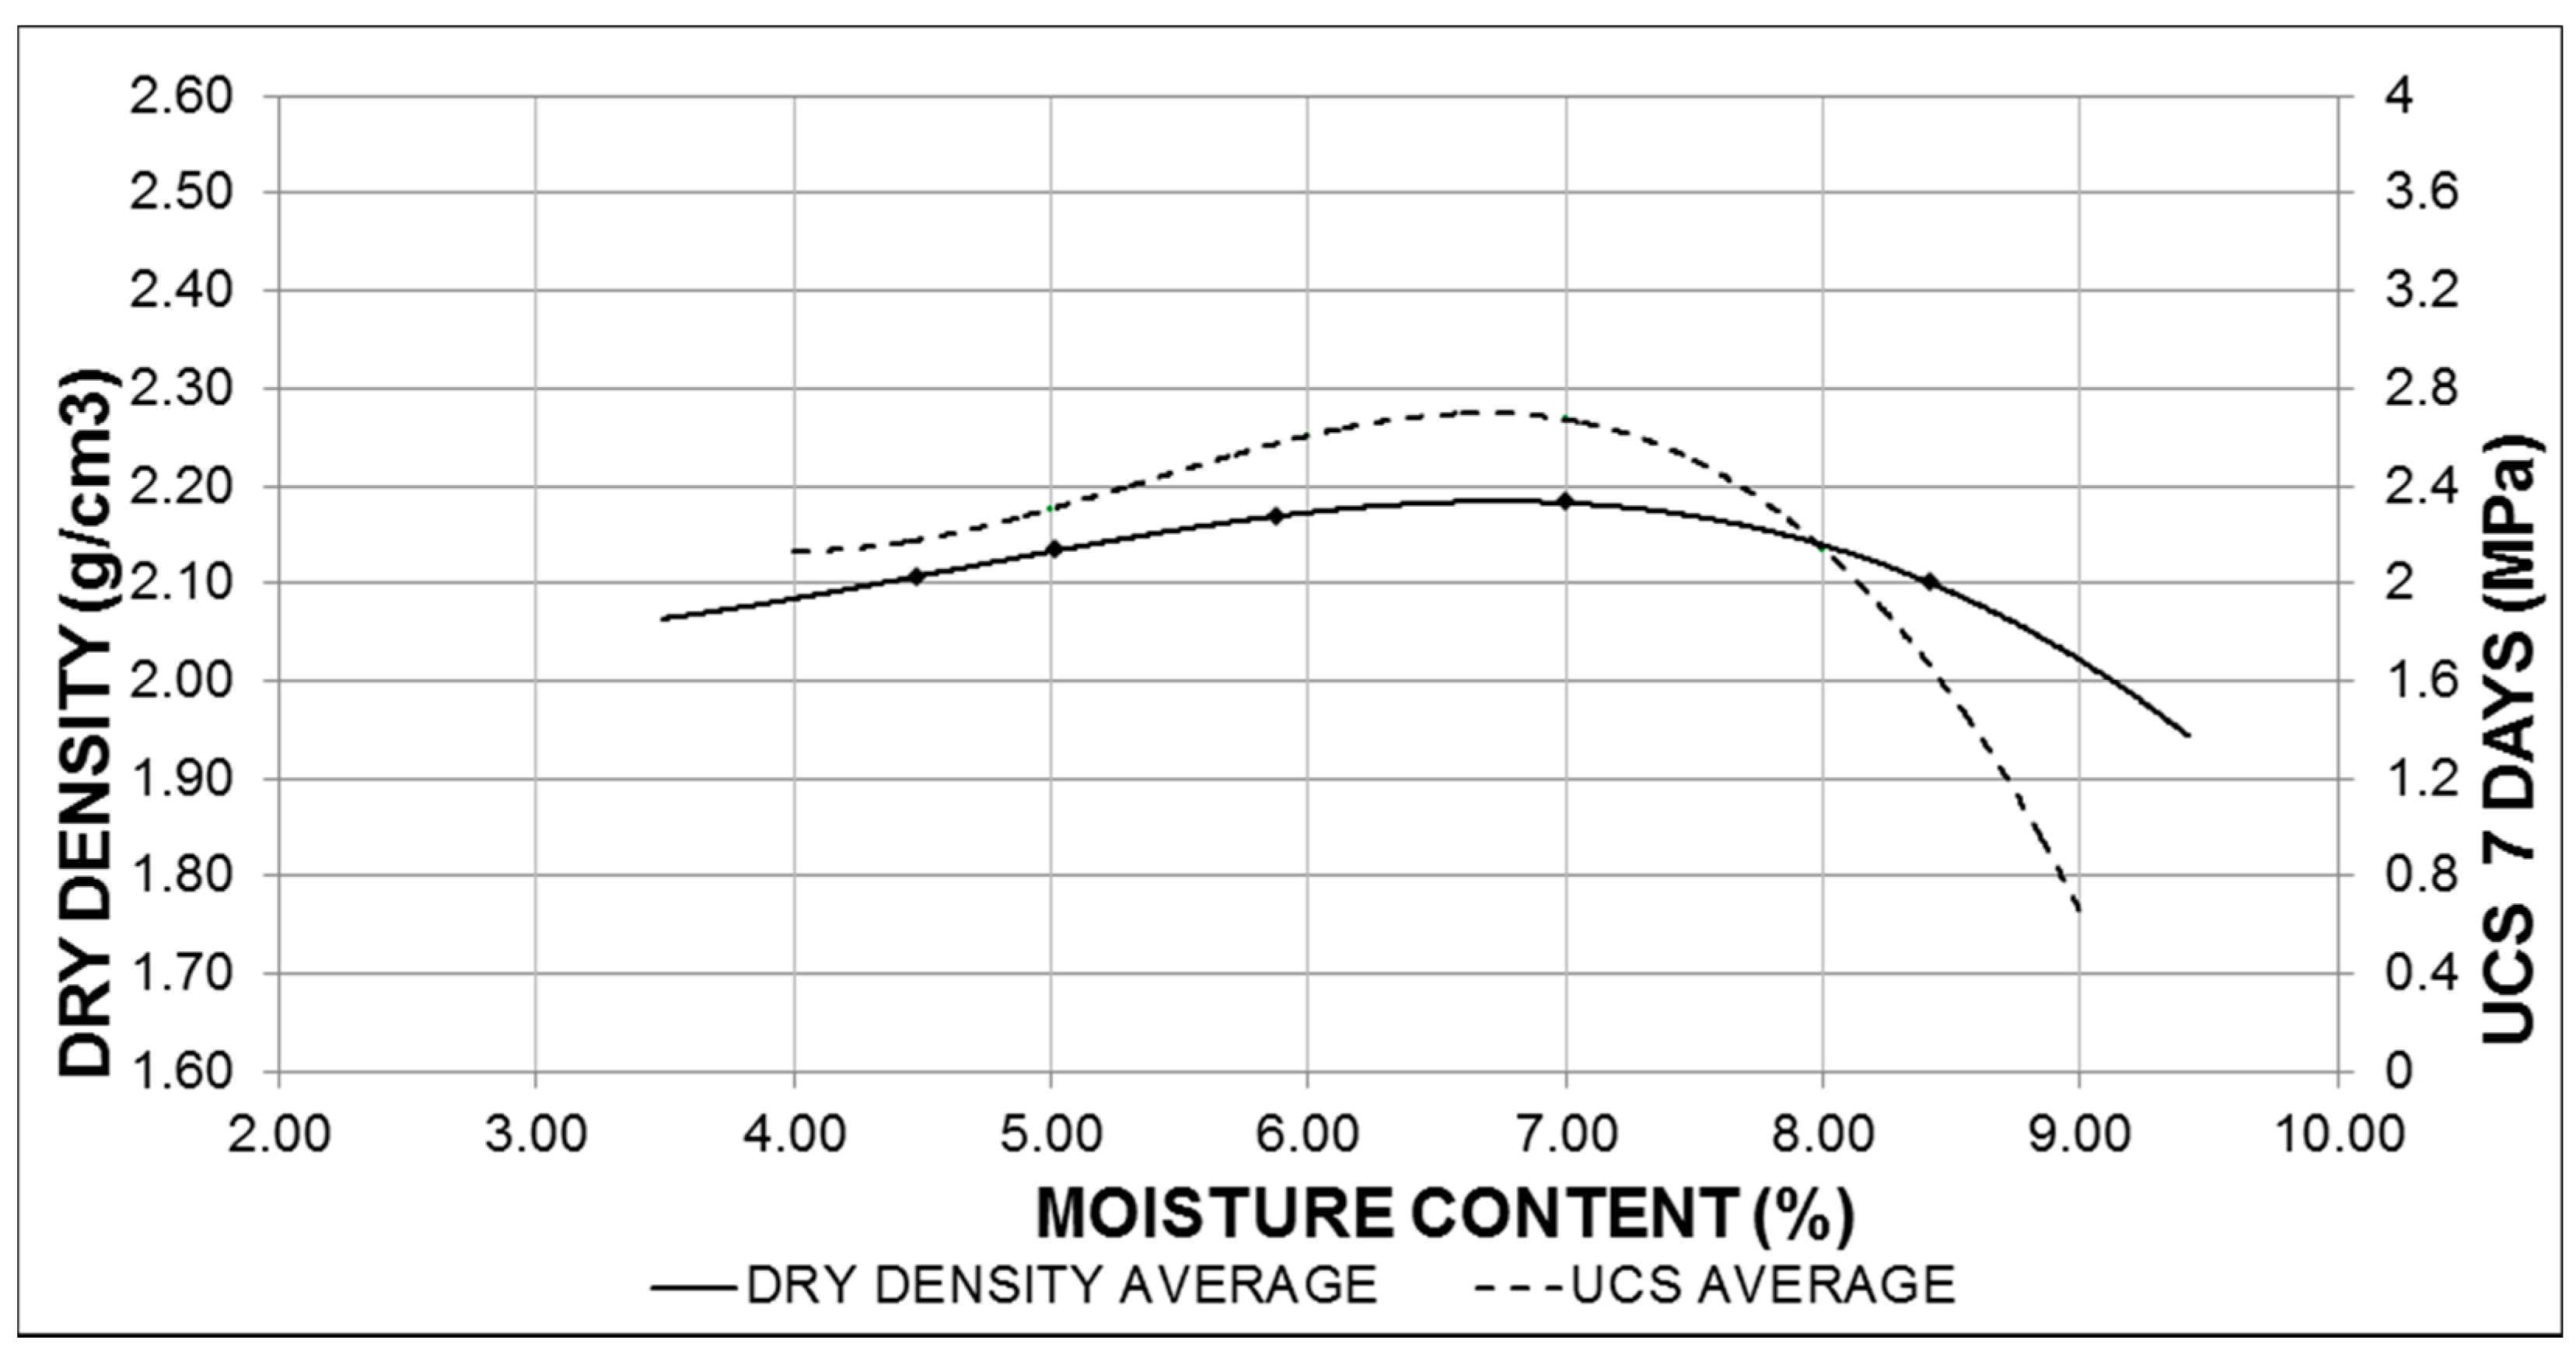
Figure 5.
Conducted test program for verifying the consistency of the proposed compaction procedure.
Figure 5.
Conducted test program for verifying the consistency of the proposed compaction procedure.

Figure 6.
Relationships between flexural strength of samples of the same batch.

Figure 7.
Relationships between mean UCS values from the same batch.

Figure 8.
Relationships between UCS of prismatic parts from the same specimen: (a) odd specimens; (b) even specimens.
Figure 8.
Relationships between UCS of prismatic parts from the same specimen: (a) odd specimens; (b) even specimens.


Table 1.
Properties of cement used.
| Main Standardized Component | Value | Cement Standardized Specifications | Value |
|---|---|---|---|
| Clinker (K) | 45–64% | Sulphate | ≤3.5% |
| Silica fumes (D) * | -- | Initial setting time | ≥75 min |
| Natural pozzolana (P) * | -- | Final setting time | ≤720 min |
| Calcined natural puzzolana (Q) * | -- | Expansion | ≤10 mm |
| Siliceous fly ash (V) * | 36–55% | UCS at 7 days | ≥16 MPa |
| Calcareous fly ash (W) * | -- | UCS at 28 days | 32.5 ≤ R ≤ 52.5 MPa |
| Minority components | 0–5% | Puzzolanicity | 8 to 15 days |
| Chlorides | ≤0.10% |
* In general, in cements CEM IV, the sum of (D), (P), (Q), (V) and (W) must be 36–55%.
Table 2.
Requirements specified in various countries for the unconfined compressive strength (UCS) of soil-cement.
Table 2.
Requirements specified in various countries for the unconfined compressive strength (UCS) of soil-cement.
| Country | UCS at 7 Days (MPa) |
|---|---|
| Spain [43] | 2.5/2.1 1 |
| United Kingdom [51] | CBM1: 2.5–4.5 |
| Australia [52] | ≤3 |
| New Zealand [53] | ≤3 |
| South Africa [54] | C2: 2–4 |
| China [55] | 3–5 |
1 For cements with a large amount of additions.
Table 3.
Dry density and UCS values of prismatic specimens with 7% moisture content.
| Sample | % Cement | Load Application Time (s) | Number of Metallic Sheets | Dry Density (g/cm3) | Modified Proctor Density (%) | UCS of Samples “A” (MPa) | UCS of Samples “B” (MPa) | Average UCS (MPa) |
|---|---|---|---|---|---|---|---|---|
| P1 | 0.0 | 20 | 4 | 2.103 | 96.48 | - | - | - |
| P2 | 0.0 | 25 | 4 | 2.057 | 94.38 | - | - | - |
| P3 | 0.0 | 20 | 5 | 2.099 | 96.28 | - | - | - |
| P4 | 0.0 | 25 | 5 | 2.089 | 95.84 | - | - | - |
| P5 | 3.5 | 20 | 5 | 2.135 | 97.94 | 2.361 | 2.451 | 2.406 |
| P6 | 3.5 | 20 | 5 | 2.139 | 98.13 | 2.733 | 2.655 | 2.694 |
Table 4.
Flexural strength (FS) results on prismatic samples at 90 days.
| Sample | Dry Density (g/cm3) | Modified Proctor Density (%) | FS (MPa) | Differences between Modified Proctor Densities in Samples of the Same Batch |
|---|---|---|---|---|
| A1 1 | 2.113 | 96.477 | 0.677 | 1.1 |
| A2 1 | 2.089 | 95.402 | 0.684 | |
| B1 | 2.163 | 98.753 | 0.845 | 0.4 |
| B2 | 2.172 | 99.195 | 0.835 | |
| C1 | 2.136 | 97.552 | 0.771 | 0.6 |
| C2 | 2.150 | 98.184 | 0.765 | |
| D1 | 2.196 | 100.270 | 0.844 | 1.3 |
| D2 | 2.225 | 101.598 | 0.879 | |
| E1 | 2.171 | 99.132 | 0.769 | 0.7 |
| E2 | 2.156 | 98.437 | 0.823 | |
| F1 | 2.286 | 104.380 | 1.112 | 6.4 |
| F2 | 2.146 | 97.994 | 0.940 | |
| G1 | 2.206 | 100.713 | 0.904 | 2.5 |
| G2 | 2.152 | 98.247 | 0.820 | |
| H1 | 2.219 | 101.345 | 0.923 | 0.8 |
| H2 | 2.203 | 100.586 | 0.872 | |
| I1 | 2.150 | 98.184 | 0.971 | 1.1 |
| I2 | 2.175 | 99.322 | 0.924 | |
| J1 | 2.160 | 98.626 | 0.776 | 0.8 |
| J2 | 2.142 | 97.804 | 0.729 |
1 Control samples: manufactured only with 2 compacting layers.
Table 5.
Statistical analysis of the flexural strength of samples from the same batch.
| Statistical Parameter | Value | Statistical Parameter | Value |
|---|---|---|---|
| Number | 18 | Minimum value | 0.729 |
| Average | 0.861 | Maximum value | 1.112 |
| Median | 0.8445 | Inferior Quartile | 0.776 |
| Variance | 0.0086 | Superior Quartile | 0.923 |
| Standard deviation | 0.0927 | Interquartile range | 0.147 |
| Standard error | 0.02186 | Skewness | 1.050 |
| Range | 0.383 | Kurtosis | 1.781 |
Table 6.
Statistical analysis of the relationship FSodd-FSeven.
| Statistical Parameter | Value |
|---|---|
| Independent term | 0 |
| Slope | 0.9773 (p-value < 0.05) |
| Correlation coefficient | 0.9987 |
| R2 | 0.9975 |
| Estimated standard error | 0.0436 |
| Mean error | 0.0352 |
| Variance analysis (Snedecor F-test) | 3164.74 (p-value < 0.05) |
| p-value of the Kolmogorov–Smirnov test for residuals | 0.9348 |
| Durbin–Watson statistical test | 1.4281 |
Table 7.
Long-term UCS test results on resulting prismatic parts.
| Sample | Dry Density (g/cm3) | Modified Proctor Density (%) | UCS in “A” Parts (MPa) | UCS in “B” Parts (MPa) | Average UCS (MPa) |
|---|---|---|---|---|---|
| A1 1 | 2.113 | 96.477 | 2.806 | 3.022 | 2.914 |
| A2 1 | 2.089 | 95.402 | 2.916 | 2.834 | 2.875 |
| B1 | 2.163 | 98.753 | 4.330 | 4.250 | 4.290 |
| B2 | 2.172 | 99.195 | 4.645 | 4.308 | 4.476 |
| C1 | 2.136 | 97.552 | 4.224 | 3.930 | 4.077 |
| C2 | 2.150 | 98.184 | 4.264 | 4.336 | 4.300 |
| D1 | 2.196 | 100.270 | 5.030 | 5.050 | 5.040 |
| D2 | 2.225 | 101.598 | 5.043 | 4.878 | 4.960 |
| E1 | 2.171 | 99.132 | 4.028 | 3.863 | 3.946 |
| E2 | 2.156 | 98.437 | 4.230 | 4.275 | 4.252 |
| F1 | 2.286 | 104.380 | 4.715 | 4.108 | 4.411 |
| F2 | 2.146 | 97.994 | 3.983 | 3.904 | 3.948 |
| G1 | 2.206 | 100.713 | 4.469 | 4.500 | 4.484 |
| G2 | 2.152 | 98.247 | 4.005 | 4.348 | 4.176 |
| H1 | 2.219 | 101.345 | 4.186 | 4.613 | 4.399 |
| H2 | 2.203 | 100.586 | 4.820 | 4.640 | 4.730 |
| I1 | 2.150 | 98.184 | 5.262 | 4.705 | 4.984 |
| I2 | 2.175 | 99.322 | 5.136 | 4.635 | 4.885 |
| J1 | 2.160 | 98.626 | 3.640 | 3.590 | 3.615 |
| J2 | 2.142 | 97.804 | 4.235 | 3.693 | 3.964 |
1 Control samples: manufactured only with 2 compacting layers.
Table 8.
UCS analysis of the resulting parts.
| Statistical Parameter | Value | Statistical Parameter | Value |
|---|---|---|---|
| Number | 36 | Minimum value | 3.590 |
| Average | 4.384 | Maximum value | 5.262 |
| Median | 4.319 | Inferior Quartile | 4.068 |
| Variance | 0.188 | Superior Quartile | 4.675 |
| Standard deviation | 0.434 | Interquartile range | 0.607 |
| Standard error | 0.072 | Skewness | 0.173 |
| Range | 1.607 | Kurtosis | −0.618 |
Table 9.
Statistical analysis of mean UCS values of parts A and B from the same batch at 90 days.
| Statistical Parameter | Value |
|---|---|
| Independent term | 0 |
| Slope | 1.0201 (p-value < 0.05) |
| Correlation coefficient | 0.9986 |
| R2 | 0.9973 |
| Estimated standard error | 0.2390 |
| Mean error | 0.2070 |
| Variance analysis (Snedecor F-test) | 2947.88 (p-value < 0.05) |
| p-value of the Kolmogorov–Smirnov test for residuals | 0.8695 |
| Durbin–Watson statistical test | 3.3542 |
Table 10.
Statistical analysis of the relationship between UCS of the prismatic parts from the same specimen.
Table 10.
Statistical analysis of the relationship between UCS of the prismatic parts from the same specimen.
| Statistical Parameter | Odd Specimens Value | Even Specimens Value |
|---|---|---|
| Independent term | 0 | 0 |
| Slope | 0.970 (p-value < 0.05) | 0.9643 (p-value < 0.05 |
| Correlation coefficient | 0.9976 | 0.9983 |
| R2 | 0.9951 | 0.9966 |
| Estimated standard error | 0.3098 | 0.2609 |
| Mean error | 0.2374 | 0.1894 |
| Variance analysis (Snedecor F-test) | 1829.74 (p-value < 0.05) | 2610.00 (p-value < 0.05) |
| p-value of the Kolmogorov–Smirnov test | 0.9928 | 0.9357 |
| Durbin–Watson statistical test | 2.4445 | 1.3253 |
Table 11.
FS and UCS values compared with other authors’ formulae 1.
| Author | Equation | Introduced Value | Estimated Value |
|---|---|---|---|
| Kersten [33] | (1) | UCS = 4.38 MPa | FS = 0.88 MPa |
| IECA-CEDEX [2] | (1) | UCS = 4.38 MPa | FS = 0.88 MPa |
| (2) | FS = 1.10 MPa | ||
| Lim and Zollinger [35] | (1) | UCS = 4.38 MPa | FS = 0.88 MPa |
| (2) | FS = 1.10 MPa | ||
| Linares [39] | (3) | UCS(7) = 2.55 MPa | UCS(28) = 3.81 MPa |
| Lim and Zollinger [35] | (4) | UCS(28) = 3.81 MPa | UCS(90) = 4.11 MPa |
1 Contrast values: FS at 90 days = 0.86 MPa; UCS at 90 days = 4.38 MPa.
© 2018 by the authors. Licensee MDPI, Basel, Switzerland. This article is an open access article distributed under the terms and conditions of the Creative Commons Attribution (CC BY) license (http://creativecommons.org/licenses/by/4.0/).
Share and Cite
MDPI and ACS Style
Linares-Unamunzaga, A.; Gonzalo-Orden, H.; Minguela, J.D.; Pérez-Acebo, H. New Procedure for Compacting Prismatic Specimens of Cement-Treated Base Materials. Appl. Sci. 2018, 8, 970. https://doi.org/10.3390/app8060970
AMA Style
Linares-Unamunzaga A, Gonzalo-Orden H, Minguela JD, Pérez-Acebo H. New Procedure for Compacting Prismatic Specimens of Cement-Treated Base Materials. Applied Sciences. 2018; 8(6):970. https://doi.org/10.3390/app8060970
Chicago/Turabian StyleLinares-Unamunzaga, Alaitz, Hernán Gonzalo-Orden, Jesús Díaz Minguela, and Heriberto Pérez-Acebo. 2018. "New Procedure for Compacting Prismatic Specimens of Cement-Treated Base Materials" Applied Sciences 8, no. 6: 970. https://doi.org/10.3390/app8060970
Note that from the first issue of 2016, this journal uses article numbers instead of page numbers. See further details here.