Comparing Deep Learning and Classical Machine Learning Approaches for Predicting Inpatient Violence Incidents from Clinical Text


1
Department of Information and Computing Sciences, Utrecht University, P.O. Box 80089, 3508 TB Utrecht, The Netherlands
2
Department of Psychiatry, University Medical Center Utrecht, P.O. Box 85500, 3508 GA Utrecht, The Netherlands
*
Author to whom correspondence should be addressed.
Appl. Sci. 2018, 8(6), 981; https://doi.org/10.3390/app8060981
Submission received: 7 May 2018
/
Revised: 6 June 2018
/
Accepted: 13 June 2018
/
Published: 15 June 2018
(This article belongs to the Special Issue Data Analytics in Smart Healthcare)
Abstract
:Machine learning techniques are increasingly being applied to clinical text that is already captured in the Electronic Health Record for the sake of delivering quality care. Applications for example include predicting patient outcomes, assessing risks, or performing diagnosis. In the past, good results have been obtained using classical techniques, such as bag-of-words features, in combination with statistical models. Recently however Deep Learning techniques, such as Word Embeddings and Recurrent Neural Networks, have shown to possibly have even greater potential. In this work, we apply several Deep Learning and classical machine learning techniques to the task of predicting violence incidents during psychiatric admission using clinical text that is already registered at the start of admission. For this purpose, we use a novel and previously unexplored dataset from the Psychiatry Department of the University Medical Center Utrecht in The Netherlands. Results show that predicting violence incidents with state-of-the-art performance is possible, and that using Deep Learning techniques provides a relatively small but consistent improvement in performance. We finally discuss the potential implication of our findings for the psychiatric practice.
1. Introduction
A majority of health care providers currently digitally stores data that has been captured for the sake of delivering care in an Electronic Health Record (EHR) [1,2]. Subsequently, health care providers have started exploring these historical datasets to improve the quality of their care [3,4]. Applying machine learning techniques to the various data that are gathered can, for instance, offer new insights into the etiology of disease, provide decision support to clinical professionals in the care process, aid in performing diagnosis, and improve the operations of a health care institution [5,6,7,8].
The structured data in a patient record (e.g., diagnosis, medication, lab measurements) are relatively straightforward to analyze using well-known and well-researched statistical methods, in practice however, a lot of information in EHR is captured in an unstructured free text form that is more difficult to analyze [9,10]. Despite this difficulty, the merits of utilizing clinical text for research purposes are currently being discovered in many areas of research, such as adverse event detection, phenotyping, and predictive analysis (e.g., [11,12,13,14]). These approaches use well established methods for classification of text like bag-of-words and n-grams for representing text, and Naive Bayes and Support Vector Machine models for classifying text.
Although good results have been obtained with these approaches, novel Deep Learning techniques, such as Word Embeddings and Recurrent Neural Networks, have emerged recently, challenging the superiority of these classical approaches. Recent advances have subsequently enabled applying Deep Learning techniques to Natural Language Processing (NLP) problems. Most notably, the introduction of the word2vec [15] and paragraph2vec [16] algorithms for learning representations of text have improved state-of-the-art results in several NLP tasks [17,18]. These Deep Learning techniques are currently also being applied to clinical text, for example by Suresh et al. [19] who included clinical text among other data types in predicting the effect of clinical interventions for Intensive Care Unit patients. Miotto et al. [20] introduced Deep Patient, a dense vector representation of a patient through time that is partially based on clinical text, based on which good predictions of developing several diseases can be made. Other approaches have focused on extracting medical concepts [21], Named Entity Recognition [22], or de-identification of medical text [23]. These approaches show that Deep Learning techniques applied to clinical text can yield state-of-the-art results in several cases. However, whether this generalizes to other clinical datasets, for example in different medical domains or in datasets with different sample sizes remains unclear.
In this work, we present a new case, comparing Deep Learning and classical machine learning techniques applied to classification of clinical text. We do so by performing an experimental evaluation of several techniques for representation and subsequent classification of text, applied to a novel and previously unused dataset from the Psychiatry Department of the University Medical Center Utrecht in The Netherlands. The task of this classification problem is to predict which patients will show violent behavior during their admission, based on clinical texts that are available at the start of their admission. Assessment of violence risk is a problem that causes a high burden for both patient and hospital staff. It has been described well in psychiatry literature, but has never been approached by applying machine learning techniques to EHR data.
Related Work
Applications of Deep Learning methods to the EHR are already numerous, both using structured data such as medication prescriptions, diagnosis and billing codes, and lab measurements, as well as using unstructured medical images. They are used for instance to perform information extraction, representation learning, prediction, phenotyping, and de-identification [24]. Gulshan et al. [25] applied a deep Convolutional Neural Network to detect diabetic retinopathy in images of the retina, showing that the judgment of licensed ophthalmologists can be matched, while Esteva et al. [26] used the same type of neural network to classify types of skin cancer with performance that matches that of board-certified dermatologists. Another approach by Lipton et al. [27] using Recurrent Neural Networks managed to diagnose the most common conditions in Intensive Care Unit patients better than several baselines using irregularly performed measurements. Hammerla et al. [28] applied Restricted Boltzmann Machines to data from wearable devices, outperforming other methods of monitoring the state of patients with Parkinson Disease. In addition, other different approaches applied to various types of structured clinical measurements exist (e.g., [29,30,31,32]).
Violence from patients directed at staff or other patients is seen in almost any psychiatric treatment facility. Iozzino [33] reports the prevalence of a violence incident happening during admission in 35 different facilities, which lies between 2% and 44%, averaging 17% over these different sites. Individual patient factors that are associated with violence risk, such as a history of substance abuse and a history of violent behavior are well described (e.g., [34,35,36,37,38]). Meta analyses, however, reveal that only a small amount of these factors is found to be robust when comparing the results of various studies on different populations [39,40]. The task of predicting the occurrence of violence incidents has been shown to be even more challenging, especially when no structured instruments are used [41]. Psychiatrists in training for example do not perform much better than random at this task with an Area Under Curve (AUC) of the Receiver Operator Curve of 0.52, while using a structured instrument improves the performance (AUC = 0.67) to the level of a trained psychiatrist (AUC = 0.71) [42]. A substantial proportion of health care professionals therefore makes use of risk assessment instruments [43], of which the Violence Risk Appraisal Guide [44], Structured Assessment of Violence Risk in Youth [45], and Historical Clinical Risk Management-20 [46] are most commonly used [47]. A meta study by Sing et al. [48] reports that the median predictive performance of these three instruments falls in a relatively narrow range between 0.70 and 0.74 AUC, showing that prediction of violence incidents is possible with moderately good results. There is however also a large variation in performance of these instruments over different sites [49]. It seems that the heterogeneity of psychiatric patient populations inhibits straightforward generalization of measuring instruments’ predictive performance to other treatment facilities. This has caused serious discussion, and sometimes even skepticism on the usability of these instruments in practice [50,51]. Given that these instruments are furthermore considered to be time-consuming and thus expensive [52], predicting violence incidents from clinical text that is already registered could be considered an important contribution to the field of personalized medicine [53]. In this work we therefore apply several machine learning techniques to this problem, in order to determine if prediction of violence incidents from EHR data is possible, and if so what Deep Learning or classical techniques should be applied.
2. Materials and Methods
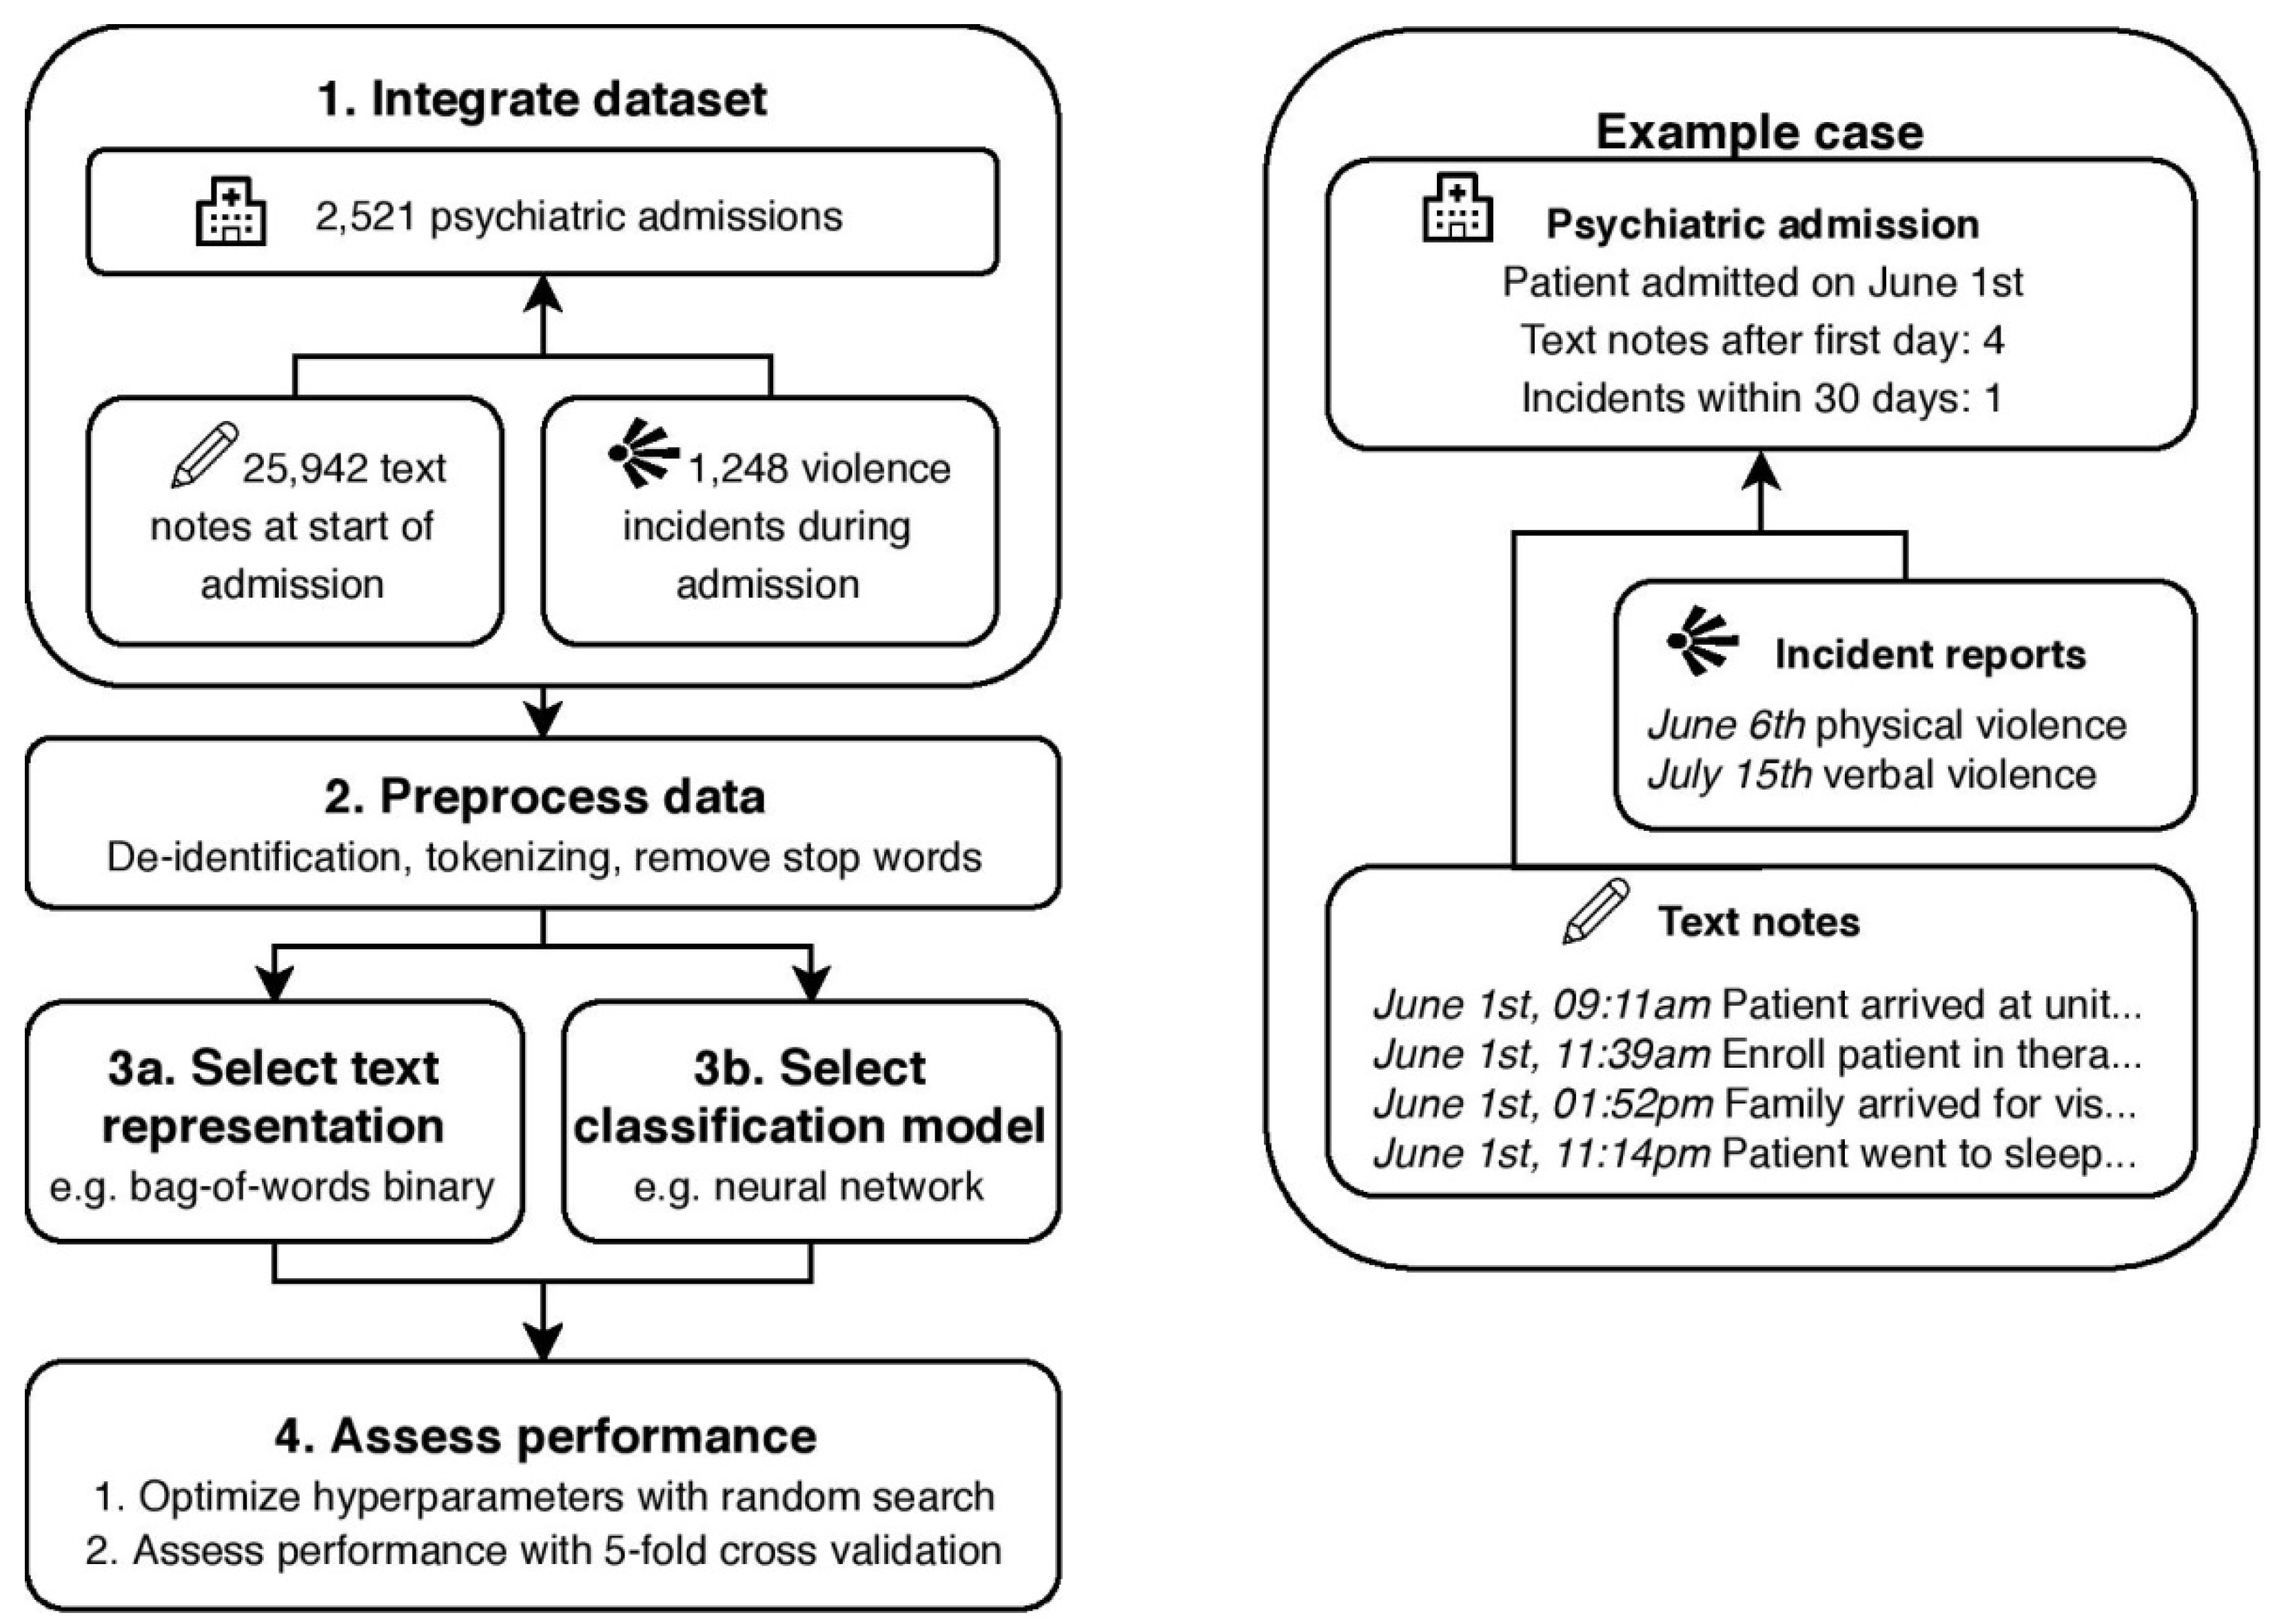
In this section, we describe the used dataset and operationalize the prediction objective, elaborate on the various Deep Learning and classical techniques that are applied to the prediction problem, and describe the experimental setup. An overview of the proposed dataset and method, along with an example case is visible in Figure 1.
2.1. Prediction Objective
A relevant dataset for the prediction task was obtained from the Psychiatry Department of the University Medical Center Utrecht (UMCU) in The Netherlands. This psychiatry department consist of six inpatient units, where patients with different medical histories are admitted, each with their own focus on different patient populations, diagnoses, and treatments. The department delivers secondary care to patients with severe but general psychiatric symptoms, and tertiary care to patients with more complex symptomatology or comorbidities, ensuring a diverse population. Admissions from all six units between 2013 and 2016 were included in the dataset, resulting in a total of 2521 admissions from 1796 unique patients, including readmissions and transfers between different units. In all six units, mandatory reporting of violence incidents by one of the health care professionals involved in the incident took place. Typically, these incidents concerned violence from patients directed at staff or at other patients, including both verbal and physical aggression. In the relevant time period, a total of 1267 violent incidents were reported. After excluding incidents that did not involve a patient that was admitted at the time of the incident (n = 19), for example incidents that involved visitors rather than the patient or incidents that happened after dismissal of a patient, a total of 1248 incidents remained. Some descriptive statistics of the dataset per unit can be found in Table 1.
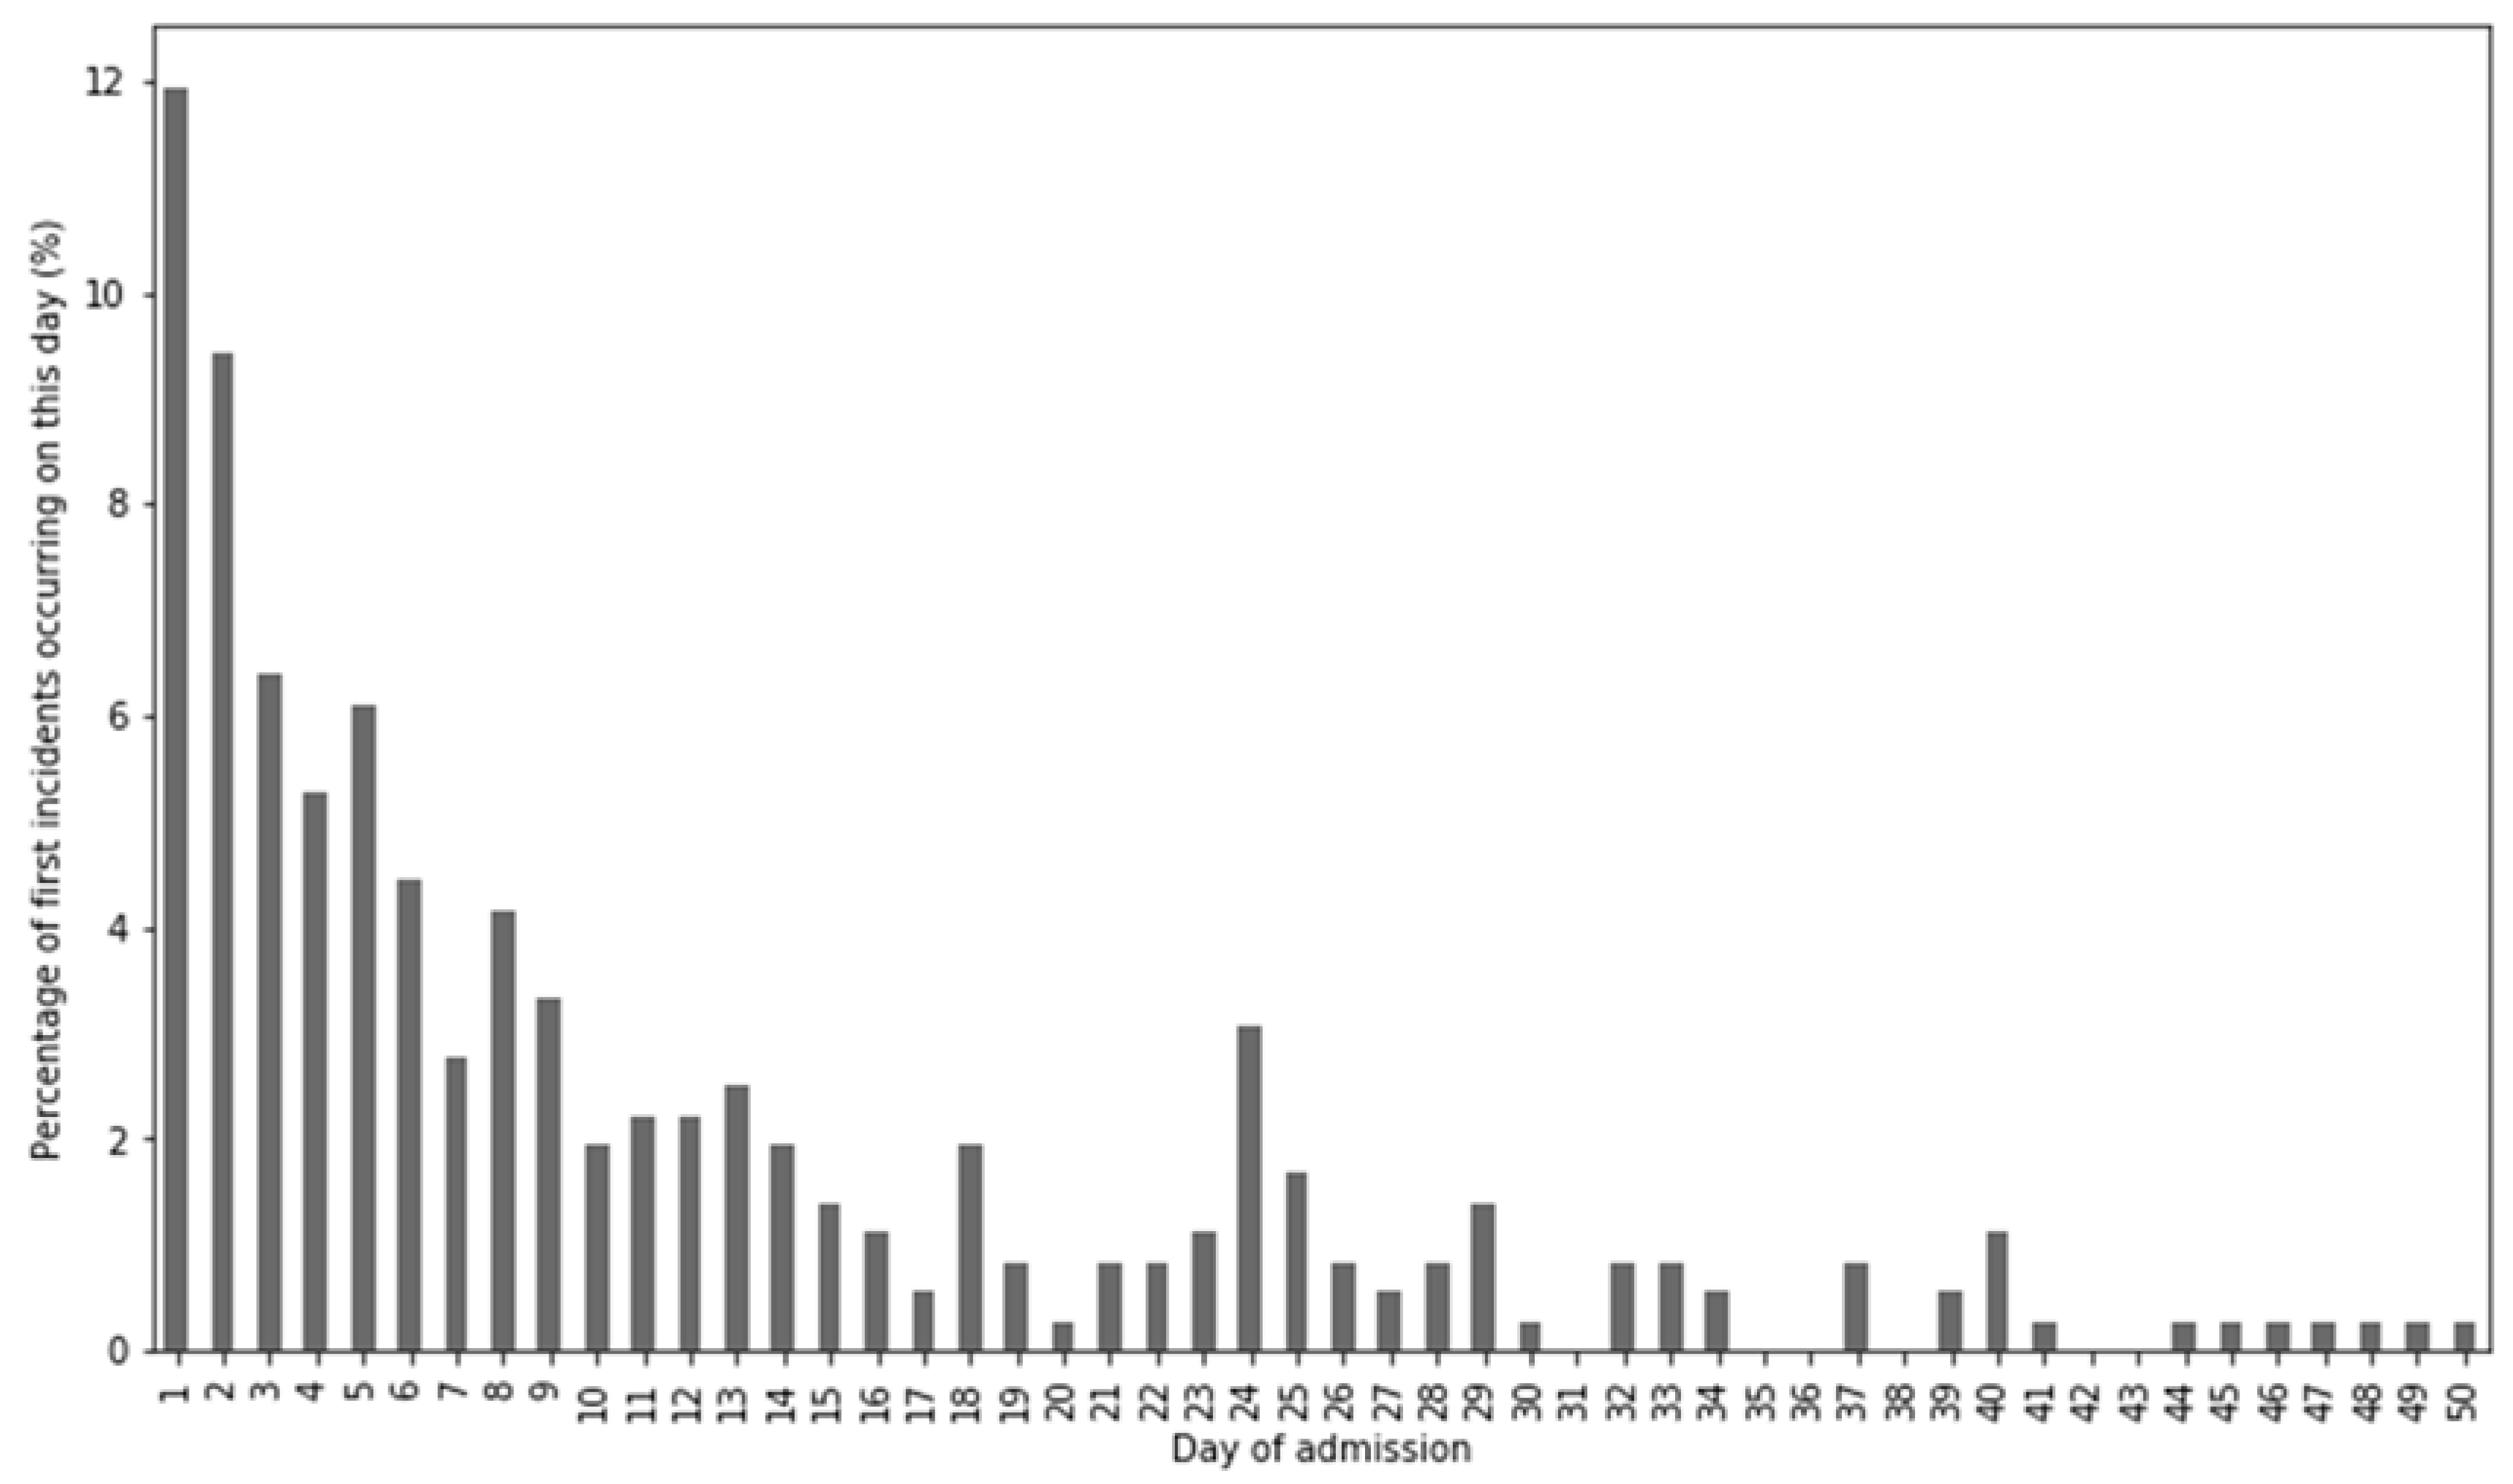
We define the prediction objective as follows: predict for which admissions a violence incident will occur in the first 30 days, based on clinical texts that were written up to and including the first day of admission. Since in many admissions, relevant information was not discovered and written down until the day of admission, especially in acute admissions, the prediction task did not include violence incidents on the day of admission. Although an number of incidents that was not negligible occurred on the day of admission, exploratory analysis showed that at that point in time, insufficient data was available to make a prediction. The interval of 30 days was furthermore chosen so that the prediction was specific, while the majority of incidents were included in the prediction, given that the mean duration of admission was 40.3 days. In total, 81.9% of incidents happened during the first 30 days of admission, and it could be verified in Figure 2 that the amount of incidents diminished over time. To be in line with literature on this topic, we will use the Area under Curve (AUC) of the Receiver Operator Curve to report the performance of the prediction.
2.2. Text Dataset
Much of the clinically relevant information was entered into the EHR in free text format, either by psychiatrists or nurses. These text entries typically contained between 100 and 500 words and were respectively referred to as doctor notes and nurse notes. The doctor note dataset comprised 11,067 notes at the start of admission, that mainly contained information, such as patient history, current treatment (e.g., types of medication and therapy), and changes therein. The nurse note dataset contained 14,875 notes at the start of admission that are written three times a day by trained nurses about all admitted patients, and typically reflected the current wellbeing and activities of a patient. The complete corpus of doctor and nurse notes (i.e., all notes written before, during or after admission) in the same time period was also made available, totaling 1,015,931 doctor and nurse notes combined. All notes are de-identified using the De-identification Method for Dutch Medical Text (DEDUCE) [54] before any other processing took place. The subset of notes that was available at the start of admission served as input for the prediction problem, while the entire corpus of notes were used to learn representations of text.
2.3. Text Representations
In order to apply classification models to these texts, a suitable numerical representation is needed. Below, we describe the representation techniques that we applied to the texts. Parameters and settings of these methods were selected based on available literature. In all representations, stop words as a single token were omitted, and where relevant the Natural Language Toolkit (NLTK) Dutch sentence tokenizer [55] was used to tokenize text. An overview of these text representations with the instantiations of their parameters is presented in Table 2.
First of all, the most common classical technique for representing text is a bag-of-words approach, where documents are represented as vectors of size equal to the dataset vocabulary, encoding the presence or absence of vocabulary terms. This technique that is used in many NLP and Information Retrieval (IR) applications represents documents or sentences as a multiset of their words, disregarding any grammar and word order. A possible addition to this is the use of n-grams, i.e., not only to incorporate single terms in the vocabulary, but also frequent sequences of n terms. Finally, multiplying the Term Frequency with the Inverse Document Frequency of a term, a technique usually referred to as tf-idf weighting, can be used to assess the relative importance of terms in a document. The performance of binary bag-of-words or bag-of-words with tf-idf weighting seems to be dependent on the type of data and type of modeling technique used [56]. Since tf-idf weighting in some cases has a benefit over binary weighting, we evaluated both representations. In both cases we added bi- and trigrams to the representation, which has been demonstrated to have a positive effect on performance, while adding higher order grams can deteriorate performance [57]. Most algorithms perform best with a number of features that is smaller than the number of examples, and using a vocabulary that is too large will lead to worse performance due to overfitting [58,59]. To balance between a representation that is too small or too large, which both has negative consequences for performance, we limited the vocabulary size to the 1000 most frequent terms.
One disadvantage of the bag-of-words approach is that information in documents is lost, such as the order of words and negations in a sentence. Moreover, the bag-of-words vectors represent these documents by counting the frequency of words, disregarding any meaning of words or similarity between them. Recent advances in Deep Learning have been able to mitigate this problem, most notably by the introduction of the word2vec algorithm by Mikolov et al. [15], allowing representation of text as a dense vector in a high dimensional space. The word2vec algorithm that learns embeddings for words was later extended with the paragraph2vec algorithm [16] that allows representation of arbitrary-length sequences of words. We used the word2vec and the paragraph2vec algorithms to learn text embeddings, respectively on the word and document level. Before training these embedding models, text was preprocessed by mapping special characters to their ascii counterparts, transforming the text to lowercase and by removing any remaining non-alphanumeric characters. The models were trained on the entire dataset of doctor and nurse notes, which comprised a total of just over one million texts. Only words with a minimum frequency of 50 were included, in order to filter out very uncommon words and infrequent misspellings, as well as to speed up the learning process and to prevent overfitting. We used a typical model size of 320 nodes, and set the number of training epochs to 20. Model performance was shown rarely to decrease with increasing values for these parameters, yet the expected gain for increasing them more appeared little [60].
2.4. Classification Models
As described in Section 2.2, the input data of the machine learning problem was a sequence of notes that is present in a patient’s EHR. We applied several models to the prediction task, which required a representation as described in Section 2.3 as input, either as a sequence or as a single representation. For each model we used a setup or architecture that is relatively straightforward and used in other literature. An overview of all models is presented in Table 3, along with the hyperparameters that are optimized. All other hyperparameters were fixed, for which a rationale is provided below.
The most commonly used statistical models that are applied to text classification include Neural Networks, Bayesian Classifiers, Support Vector Machines, and Decision Trees [61,62]. Although pattern-based classifiers and k-nearest-neighbors type classifiers have also been applied to text classification, we did not apply them in this work because of their difficulties with imbalanced datasets and difficulties with estimating probabilities that are needed for computing the AUC, respectively. For Neural Networks, we considered a three-layer feed-forward Neural Network as used, for example by Rajan et al. [63]. The Naive Bayes algorithm is very commonly used and has been shown to obtain good results, for example by Deshpande et al. [64], providing a good instantiation of a Bayesian Classifier. For Support Vector Machines, we considered a standard model with either a linear or radial kernel, which typically obtained the best results for text classification [65,66]. We used the CART algorithm finally to obtain a Decision Tree of which the depth and the number of features to consider when splitting could be controlled [67].
The models mentioned above have already proven their merits in text classification, novel Deep Learning techniques however, have recently acquired the attention of the NLP community (Lee, 2016). An additional benefit of these techniques is that they can take sequences of text as input, making use of a richer representation of the input. Firstly, Recurrent Neural Networks (RNNs) work by processing a sequence of inputs one-by-one, adjusting its internal state at each step. Based on each input, an output is computed, which serves as input for the next step along with the next item in the input sequence. In our case, only a classification label was desired as output, making a many-to-one RNN setup appropriate. In this setup the sequence of texts was processed sequentially, providing an internal encoding of the input, after which the binary outcome was determined based on this encoding. In our setup a unidirectional RNN with dropout regularization was used, and we will instantiate the recurrent cell of the RNN with both a Long Short Term Memory (LSTM) and Gated Recurrent Unit (GRU), applied for example in [68,69]. Secondly, Convolutional Neural Networks (CNNs) compute a similar mapping in a different way. CNNs are most commonly applied to image or video data (i.e., sequences of two or three dimensions), yet they are also applicable to text data (a sequence of one dimension). They work by applying a sliding window to a sequence using the convolutional operator, which is able to automatically learn higher-order features. This is done by sliding a kernel with randomly initiated weights over the sequence, after which it automatically updates its weights to learn from each example. One possible advantage of CNNs over RNNs is that in RNNs, the last items in a sequence have a relatively high impact on the outcome, while CNNs do not exhibit such a bias. We used a straightforward setup with a Convolutional layer, followed by a Dropout layer and a Max Pooling layer, after which a single fully connected layer determined the output from the previous layers, such as used in [70,71]. Both the RNN and the CNN were trained for 50 epochs.
2.5. Experiment Setup
All text representations in Table 2 were combined with all classification models in Table 3 to experimentally evaluate the performance of each pair. To be able to apply classical models to sequential data, the input sequences needed to be aggregated into a single vector. For the bag-of-words approaches, all texts in the sequence were concatenated, after which the bag-of-word features were computed. For the word and document embeddings, the sequence of vectors was averaged to compute a single vector for each instance. We used 5-fold stratified cross validation to compute the performance of each combination, measured by the AUC, along with its standard deviation. For finding the optimal hyperparameters we used a random search, as suggested by Bengio [72]. The hyperparameters were sampled from either a uniform or a log uniform distribution with a typical range that can be seen in Table 3, and a total of 250 random parameter samplings was used for each evaluation.
3. Results
The results of the experimental evaluation can be seen in Table 4, and the optimal hyperparameters have been included in Table A1 in Appendix A for completeness. It can be seen that the best prediction was obtained by combining Document Embeddings with a Recurrent Neural Network, closely followed by Binary Bag of Words with a Recurrent Neural Network and Document Embeddings with a Support Vector Machine.
From the perspective of the different representations, the weighting scheme of the Bag-of-words approach did not result in a clear difference in performance between different models, and neither was there a strong difference in applying the text embeddings on the word level or the document level seen. Overall however, text embeddings resulted in better performance than the bag-of-words approaches.
Of the classical models, the Naive Bayes algorithm, which despite its simplicity, often yield good results in text classification, is in this case, it was not among the top performing algorithms. Decision Trees were able to perform slightly better, but also could not match the performance of the other algorithms. A possible explanation for this is that these models were relatively simple, and they were not able to find the relatively complex patterns that were needed to accurately assess violence risk. The Neural Network algorithm showed better results, especially in combination with the text embeddings, and a clear difference between Bag-of-words representations and Text embedding representations could be seen. The Support Vector Machine finally was able to predict violence incidents in the first 30 of admission days best of the four classical models, with just a marginal difference in performance over different representations of text.
For the two Deep Learning models, it can be seen that, especially the RNN, outperformed several of the classical models. RNNs outperformed CNNs for this classification task as well, with a similar margin over different text representations. The AUC scores were however among the lowest when Word Embeddings were used for representing text, while these did not cause a decrease in performance for the classical models, suggesting that they did contain the information that was needed to assess the violence risk. Despite the fact that a sequence of Word Embeddings is a richer representation than the average over these Word Embeddings, the fact that the length of the input sequence was no longer proportional to the number of instances might provide difficulties in practice. In this case, given the computational resources and dataset size, the classical models were able to handle the condensed word embedding averages better. Both Deep Learning models performed best when combined with Document Embeddings, resulting in the overall optimal performance of 0.788 AUC, followed by the two bag-of-words representations.
4. Discussion
The results of the experimental evaluation in Table 4 show the best result was obtained by combining Document Embeddings with a Recurrent Neural Network, although the difference with different methods was relatively small, and in some cases, smaller than the standard deviation. Despite these small differences, it can also be seen that most of the top performing methods either used text embeddings for representing text or a Deep Learning model for classification. Although Deep Learning techniques did not exclusively lead to good classification results, they did give a small but consistent advantage in performance. In most research, Deep Learning methods are superior in large datasets, this research shows that Deep Learning methods can even start to outperform classical methods in modestly sized datasets. While near-optimal performance can be achieved with a bag-of-words approach combined with Support Vector Machines, applying Deep Learning techniques to clinical text datasets of this size will be especially beneficial in performance-critical applications. One advantage of using classical techniques on the other hand is the reduction in training time compared to Deep Learning techniques. Although the training time of Deep Learning techniques on a dataset of this size is not inhibitive, training a SVM, for instance, can in this case be up to an order of magnitude faster than training a RNN. The difference in classification time was negligible. For the Deep Learning models on the other hand, no optimization of the network architecture was done, and a relatively large number of hyperparameters was optimized with a constant number of hyperparameter samplings. Additional computational resources and experimentation with network setup might further improve the performance of the Deep Learning models, while a similar gain is not expected for classical techniques.
One possible limitation of the experimental evaluation was the 5-fold cross validation strategy for validating the model performances. Since several combinations of text representations, classification models and parameter settings have been evaluated, some degree of overfitting cannot be prevented. As a result, a small bias may exist in the optimal outcome of 0.788 AUC, which does not influence the comparison, but does inhibit regarding this as a definitive result for the health care practice. Additional research is needed to precisely establish to what level of accuracy risk assessment can be performed in an automated way using clinical text. On the other hand, adding structured variables from the EHR, such as medication use, diagnosis and patient demographics, as well as increasing the sample size are future research directions that may be able to further improve the result.
The results of the performed experiments finally have some implications for the assessment of violence risk in the psychiatric practice as well. As described in the introduction, the most commonly used violence risk assessment instruments show a median AUC between 0.70 and 0.74 when measured in a meta study over different sites [48]. Although higher AUC scores have been reported in individual studies, lower scores have been reported as well, indicating that the performance of these assessment instruments is not very generalizable to other patient populations or healthcare institutions. Our machine learning approach, which achieved an optimal AUC of 0.788 on a patient sample size that is comparable to the combined meta study sample sizes for each of these instruments, shows that assessing violence risk from clinical text in the EHR is a very promising approach. The main advantages of this approach over existing risk assessment tools is that the assessment can be specifically tailored to the population of an institution, and that it can constantly be adjusted over time. This also allows measuring the performance of the method on the relevant clinical population. The assessment can furthermore be automatically performed based on already available clinical data, thus saving time and cost without sacrificing assessment accuracy or imposing significant changes in the clinical process. Although the experiment setup necessitates some further research to fully establish to which extent prediction of violence using EHR data is possible, our research shows that this approach is promising and that in the future it can provide an important novel addition to the field of violence risk assessment.
5. Conclusions
Violence during psychiatric admissions is a problem that causes a high burden for both patients and hospital staff. Although several of its associated individual factors are known, and structured risk instruments for assessing the risk are available, meta studies reveal that generalizing these individual factors or instruments to other populations is not always straightforward. In this work, we investigated whether automatic assessment of violence risk is possible with textual data that is already captured in an Electronic Health Record (EHR). To do so, we compared classical machine learning techniques and Deep Learning techniques. For the study we used a novel and previously unexplored dataset of the University Medical Center Utrecht (UMCU) in The Netherlands.
Our experiment evaluated all combinations of a text representation (Bag-of-words with binary weighting, Bag-of-words with tf-idf weighting, Word embeddings, or Document embeddings) and a classification model (Recurrent Neural Network, Convolutional Neural Network, Neural Network, Support Vector Machine, Naïve Bayes, or Decision Tree). We used random search with 5-fold cross validation for optimizing hyperparameters. The results of our evaluation show that the best result is obtained by combining Document Embeddings with a Recurrent Neural Network (AUC = 0.788 ± 0.018), closely followed by a Binary Bag of Words and a Recurrent Neural Network (AUC = 0.771 ± 0.018), and Document Embeddings combined with a Support Vector Machine (AUC = 0.770 ± 0.029).
A relatively small but consistent improvement in performance could be seen for Deep Learning techniques over classical machine learning techniques. Deep Learning techniques furthermore have the advantage of allowing more additional experimentation with the model setup, while on the other hand, the training time of classical machine learning techniques can be up to one order of magnitude smaller. Using Deep Learning techniques on a dataset of this size and for this type of problem therefore shows promise, especially in performance critical applications.
Our results finally have potential implications for the psychiatric practice as well, although the exact accuracy of automatic risk assessment from EHR data needs to be established in further research. The results we obtained are improvements over the median AUC of structured risk assessment instruments as measured in meta studies over different sites, with a comparable sample size. The proposed method using EHR data is furthermore customizable to a specific population or institution, circumventing the problem of generalization. Automatic assessment of violence risk therefore is a promising approach that can in the future provide an important addition to the psychiatric practice.
Author Contributions
Conceptualization, F.S.; Formal analysis, V.M.; Investigation, M.S.; Methodology, M.S.; Resources, F.S.; Software, V.M.; Supervision, F.S. and M.S.; Validation, V.M.; Writing—original draft, V.M.; Writing—review & editing, F.S. and M.S.
Funding
This research received no external funding.
Acknowledgments
The authors would like to thank the UMCU Psydata group for their technical support.
Conflicts of Interest
The authors declare no conflicts of interest.
Appendix A

Table A1.
An overview of the optimal hyperparameters for each combination of a text representation and a classification model.
Table A1.
An overview of the optimal hyperparameters for each combination of a text representation and a classification model.
| Model | Hyperparameter | Bag-of-Words Binary | Bag-of-Words tf-idf | Word Embeddings | Document Embeddings |
|---|---|---|---|---|---|
| RNN 1 | Learning rate | 4.1 × 10⁻² | 5.3 × 10⁻² | 8.3 × 10⁻³ | 4.6 × 10⁻² |
| Cell type | LSTM | LSTM | GRU | LSTM | |
| Layer size | 193 | 63 | 185 | 129 | |
| Dropout rate | 0.8 | 0.7 | 0.5 | 0.8 | |
| CNN 2 | Learning rate | 1.4 × 10⁻² | 2.0 × 10⁻² | 4.2 × 10⁻³ | 1.3 × 10⁻² |
| No. filters | 41 | 69 | 45 | 49 | |
| Filter size | 3 | 3 | 3 | 4 | |
| Pooling size | 5 | 6 | 5 | 6 | |
| Dropout rate | 0.9 | 0.7 | 0.5 | 0.9 | |
| Fully connected layer size | 18 | 36 | 121 | 85 | |
| NN 3 | Learning rate | 1.5 × 10⁻³ | 1.2 × 10⁻³ | 6.4 × 10⁻² | 1.1 × 10⁻² |
| Layer size | 172 | 30 | 36 | 254 | |
| Regularization constant | 4.7 × 10⁻⁴ | 2.2 × 10⁻⁴ | 7.1 × 10⁻² | 9.9 × 10⁻² | |
| NB 4 | N/a | - | - | - | - |
| SVM 5 | C | 0.40 | 0.50 | 2.52 | 0.40 |
| Gamma | 3.1 × 10⁻⁴ | 1.7 × 10⁻⁴ | 3.6 × 10⁻⁴ | 7.9 × 10⁻⁴ | |
| Kernel | radial | radial | radial | radial | |
| DT 6 | Max depth | 2 | 3 | 2 | 4 |
| Max features | 0.52 | 0.47 | 0.56 | 0.84 | |
| Min samples split | 5 | 3 | 11 | 3 |
1 Recurrent Neural Network; 2 Convolutional Neural Network; 3 Neural Network; 4 Naive Bayes; 5 Support Vector Machine; 6 Decision Tree.
References
- Adler-Milstein, J.; Everson, J.; Lee, S.Y.D. EHR Adoption and Hospital Performance: Time-Related Effects. Health Serv. Res. 2015, 50, 1751–1771. [Google Scholar] [CrossRef] [PubMed] [Green Version]
- Peters, T.E. Transformational Impact of Health Information Technology on the Clinical Practice of Child and Adolescent Psychiatry. Child Adolesc. Psychiatr. Clin. N. Am. 2017, 26, 55–66. [Google Scholar] [CrossRef] [PubMed]
- Menger, V.; Spruit, M.; Hagoort, K.; Scheepers, F. Transitioning to a Data Driven Mental Health Practice: Collaborative Expert Sessions for Knowledge and Hypothesis Finding. Comput. Math. Methods Med. 2016, 2016, 9089321. [Google Scholar] [CrossRef] [PubMed]
- Priyanka, K.; Kulennavar, N. A survey on big data analytics in health care. IJCSIT 2014, 5, 5865–5868. [Google Scholar]
- Bates, D.W.; Saria, S.; Ohno-Machado, L.; Shah, A.; Escobar, G. Big data in health care: Using analytics to identify and manage high-risk and high-cost patients. Health Aff. 2014, 33, 1123–1131. [Google Scholar] [CrossRef] [PubMed]
- Lee, C.H.; Yoon, H.-J. Medical big data: Promise and challenges. Kidney Res. Clin. Pract. 2017, 36, 3–11. [Google Scholar] [CrossRef] [PubMed]
- Murdoch, T.B.; Detsky, A.S. The Inevitable Application of Big Data to Health Care. JAMA 2013, 309, 1351–1352. [Google Scholar] [CrossRef] [PubMed]
- Whitson, J.R. Gaming the quantified self. Surveill. Soc. 2013, 11, 163–176. [Google Scholar] [CrossRef]
- Chapman, W.W.; Nadkarni, P.M.; Hirschman, L.; D’Avolio, L.W.; Savova, G.K.; Uzuner, O. Overcoming barriers to NLP for clinical text: The role of shared tasks and the need for additional creative solutions. J. Am. Med. Inform. Assoc. 2011, 18, 540–543. [Google Scholar] [CrossRef] [PubMed]
- Ford, E.; Stockdale, J.; Jackson, R.; Cassell, J. For the greater good? Patient and public attitudes to use of medical free text data in research. Int. J. Popul. Data Sci. 2017, 1. [Google Scholar] [CrossRef] [Green Version]
- Chen, C.-Y.; Lee, P.H.; Castro, V.M.; Minnier, J.; Charney, A.W.; Stahl, E.A.; Ruderfer, D.M.; Murphy, S.N.; Gainer, V.; Cai, T.; et al. Genetic validation of bipolar disorder identified by automated phenotyping using electronic health records. Transl. Psychiatry 2018, 8, 86. [Google Scholar] [CrossRef] [PubMed]
- Garla, V.; Taylor, C.; Brandt, C. Semi-supervised clinical text classification with Laplacian SVMs: An application to cancer case management. J. Biomed. Inform. 2013, 46, 869–875. [Google Scholar] [CrossRef] [PubMed]
- Pestian, J.P.; Brew, C.; Matykiewicz, P.; Hovermale, D.J.; Johnson, N.; Cohen, K.B.; Duch, W. A shared task involving multi-label classification of clinical free text. In Proceedings of the Workshop on BioNLP 2007: Biological, Translational, and Clinical Language Processing, Prague, Czech Republic, 29 June 2007; pp. 97–104. [Google Scholar] [CrossRef]
- Sarker, A.; Gonzalez, G. Portable automatic text classification for adverse drug reaction detection via multi-corpus training. J. Biomed. Inform. 2015, 53, 196–207. [Google Scholar] [CrossRef] [PubMed]
- Mikolov, T.; Corrado, G.; Chen, K.; Dean, J. Efficient Estimation of Word Representations in Vector Space. arXiv, 2013; arXiv:1301.3781. [Google Scholar]
- Le, Q.; Mikolov, T. Distributed representations of sentences and documents. arXiv, 2014; arXiv:1405.4053. [Google Scholar]
- Goldberg, Y. A primer on neural network models for natural language processing. J. Artif. Intell. Res. 2016, 57, 345–420. [Google Scholar] [CrossRef]
- Lecun, Y.; Bengio, Y.; Hinton, G. Deep learning. Nature 2015, 521, 436–444. [Google Scholar] [CrossRef] [PubMed]
- Suresh, H.; Hunt, N.; Johnson, A.; Celi, L.A.; Szolovits, P.; Ghassemi, M. Clinical Intervention Prediction and Understanding using Deep Networks. arXiv, 2017; arXiv:1705.08498. [Google Scholar]
- Miotto, R.; Li, L.; Kidd, B.A.; Dudley, J.T. Deep Patient: An Unsupervised Representation to Predict the Future of Patients from the Electronic Health Records. Sci. Rep. 2016, 6, 26094. [Google Scholar] [CrossRef] [PubMed] [Green Version]
- Lv, X.; Guan, Y.; Yang, J.; Wu, J. Clinical Relation Extraction with Deep Learning. Int. J. Hybrid Inf. Technol. 2016, 9, 237–248. [Google Scholar] [CrossRef]
- Wu, Y.; Jiang, M.; Lei, J.; Xu, H. Named Entity Recognition in Chinese Clinical Text Using Deep Neural Network. Stud. Health Technol. Inform. 2015, 216, 624–628. [Google Scholar] [PubMed]
- Ekbal, A.; Saha, S.; Bhattacharyya, P. Deep Learning Architecture for Patient Data De-identification in Clinical Records. In Proceedings of the Clinical Natural Language Processing Workshop, Osaka, Japan, 11–17 December 2016; pp. 32–41. [Google Scholar]
- Shickel, B.; Tighe, P.J.; Bihorac, A.; Rashidi, P. Deep EHR: A Survey of Recent Advances in Deep Learning Techniques for Electronic Health Record (EHR) Analysis. IEEE J. Biomed. Health Inform. 2017, 1. [Google Scholar] [CrossRef]
- Gulshan, V.; Peng, L.; Coram, M.; Stumpe, M.C.; Wu, D.; Narayanaswamy, A.; Venugopalan, S.; Widner, K.; Madams, T.; Cuadros, J.; et al. Development and validation of a deep learning algorithm for detection of diabetic retinopathy in retinal fundus photographs. JAMA J. Am. Med. Assoc. 2016, 316, 2402–2410. [Google Scholar] [CrossRef] [PubMed]
- Esteva, A.; Kuprel, B.; Novoa, R.A.; Ko, J.; Swetter, S.M.; Blau, H.M.; Thrun, S. Dermatologist-level classification of skin cancer with deep neural networks. Nature 2017, 542, 115–118. [Google Scholar] [CrossRef] [PubMed]
- Lipton, Z.C.; Kale, D.C.; Elkan, C.; Wetzel, R. Learning to Diagnose with LSTM Recurrent Neural Networks. arXiv, 2015; arXiv:1511.03677. [Google Scholar]
- Hammerla, N.Y.; Halloran, S.; Ploetz, T. Deep, Convolutional, and Recurrent Models for Human Activity Recognition using Wearables. arXiv, 2016; arXiv:1604.08880. [Google Scholar]
- Jacobson, O.; Dalianis, H. Applying deep learning on electronic health records in Swedish to predict healthcare-associated infections. In Proceedings of the 15th Workshop on Biomedical Natural Language Processing, Berlin, Germany, 12 August 2016; pp. 191–195. [Google Scholar]
- Li, H.; Li, X.; Ramanathan, M.; Zhang, A. Identifying informative risk factors and predicting bone disease progression via deep belief networks. Methods 2014, 69, 257–265. [Google Scholar] [CrossRef] [PubMed]
- Liang, Z.; Zhang, G.; Huang, J.X.; Hu, Q.V. Deep learning for healthcare decision making with EMRs. In Proceedings of the 2014 IEEE International Conference on Bioinformatics and Biomedicine, Belfast, UK, 2–5 November 2014; pp. 556–559. [Google Scholar]
- Nickerson, P.; Tighe, P.; Shickel, B.; Rashidi, P. Deep neural network architectures for forecasting analgesic response. In Proceedings of the Annual International Conference of the IEEE Engineering in Medicine and Biology Society, EMBS, Orlando, FL, USA, 16–20 August 2016; pp. 2966–2969. [Google Scholar]
- Iozzino, L.; Ferrari, C.; Large, M.; Nielssen, O.; De Girolamo, G. Prevalence and risk factors of violence by psychiatric acute inpatients: A systematic review and meta-analysis. PLoS ONE 2015, 10, e0128536. [Google Scholar] [CrossRef] [PubMed]
- Amore, M.; Menchetti, M.; Tonti, C.; Scarlatti, F.; Lundgren, E.; Esposito, W.; Berardi, D. Predictors of violent behavior among acute psychiatric patients: Clinical study. Psychiatry Clin. Neurosci. 2008, 62, 247–255. [Google Scholar] [CrossRef] [PubMed] [Green Version]
- McDermott, B.E.; Edens, J.F.; Quanbeck, C.D.; Busse, D.; Scott, C.L. Examining the role of static and dynamic risk factors in the prediction of inpatient violence: Variable- and person-focused analyses. Law Hum. Behav. 2008, 32, 325–338. [Google Scholar] [CrossRef] [PubMed]
- Papadopoulos, C.; Ross, J.; Stewart, D.; Dack, C.; James, K.; Bowers, L. The antecedents of violence and aggression within psychiatric in-patient settings. Acta Psychiatr. Scand. 2012, 125, 425–439. [Google Scholar] [CrossRef] [PubMed]
- Pfeffer, C.R.; Solomon, G.; Plutchik, R.; Mizruchi, M.S.; Weiner, A. Variables that Predict Assaultiveness in Child Psychiatric Inpatients. J. Am. Acad. Child Psychiatry 1985, 24, 775–780. [Google Scholar] [CrossRef]
- Reynolds, G.P.; McKelvey, J.S.; Reinharth, J.; Payne, E.B.; Tropper, A.; Selig, P.; Malhotra, A.; Russ, M.; Serper, M.R. Predictors of persistent aggression on the psychiatric inpatient service. Compr. Psychiatry 2013, 54, e34. [Google Scholar] [CrossRef]
- Dack, C.; Ross, J.; Papadopoulos, C.; Stewart, D.; Bowers, L. A review and meta-analysis of the patient factors associated with psychiatric in-patient aggression. Acta Psychiatr. Scand. 2013, 127, 255–268. [Google Scholar] [CrossRef] [PubMed] [Green Version]
- Steinert, T. Prediction of inpatient violence. Acta Psychiatr. Scand. 2002, 106, 133–141. [Google Scholar] [CrossRef]
- Ægisdóttir, S.; White, M.J.; Spengler, P.M.; Maugherman, A.S.; Anderson, L.A.; Cook, R.S.; Nichols, C.N.; Lampropoulos, G.K.; Walker, B.S.; Cohen, G.; et al. The Meta-Analysis of Clinical Judgment Project: Fifty-Six Years of Accumulated Research on Clinical Versus Statistical Prediction. Couns. Psychol. 2006, 34, 341–382. [Google Scholar] [CrossRef]
- Teo, A.R.; Holley, S.R.; Leary, M.; McNiel, D.E. The Relationship Between Level of Training and Accuracy of Violence Risk Assessment. Psychiatr. Serv. 2012, 63, 1089–1094. [Google Scholar] [CrossRef] [PubMed] [Green Version]
- Higgins, N.; Watts, D.; Bindman, J.; Slade, M.; Thornicroft, G. Assessing violence risk in general adult psychiatry. Psychiatr. Bull. 2005, 29, 131–133. [Google Scholar] [CrossRef] [Green Version]
- Quinsey, V.; Harris, G.; Rice, M.E.; Cormier, C. Violent Offenders: Appraising and Managing Risk; APA Books: Washington, DC, USA, 1998; ISBN 9781433805226. [Google Scholar]
- Borum, R.; Bartel, P.A.; Forth, A.E. Structured Assessment of Violence Risk in Youth; PAR: Lutz, FL, USA, 2005. [Google Scholar]
- Webster, C.D.; Douglas, K.S.; Eaves, D.; Hart, S.D. HCR-20: Assessing Risk of Violence, Version 2; Mental Health, Law and Policy Institute: Burnaby, BC, Canada, 1997. [Google Scholar]
- Fazel, S.; Singh, J.P.; Doll, H.; Grann, M. Use of risk assessment instruments to predict violence and antisocial behaviour in 73 samples involving 24,827 people: Systematic review and meta-analysis. BMJ 2012, 345, e4692. [Google Scholar] [CrossRef] [PubMed]
- Singh, J.P.; Grann, M.; Fazel, S. A comparative study of violence risk assessment tools: A systematic review and metaregression analysis of 68 studies involving 25,980 participants. Clin. Psychol. Rev. 2011, 31, 499–513. [Google Scholar] [CrossRef] [PubMed]
- Yang, M.; Wong, S.C.P.; Coid, J. The efficacy of violence prediction: A meta-analytic comparison of nine risk assessment tools. Psychol. Bull. 2010, 136, 740–767. [Google Scholar] [CrossRef] [PubMed]
- Campbell, M.A.; French, S.; Gendreau, P. The prediction of violence in adult offenders: A meta-analytic comparison of instruments and methods of assessment. Crim. Justice Behav. 2009, 36, 567–590. [Google Scholar] [CrossRef]
- Maden, A. Standardized risk assessment: Why all the fuss? Psychiatr. Bull. 2003, 27, 201–204. [Google Scholar] [CrossRef]
- Viljoen, J.L.; McLachlan, K.; Vincent, G.M. Assessing violence risk and psychopathy in juvenile and adult offenders: A survey of clinical practices. Assessment 2010, 17, 377–395. [Google Scholar] [CrossRef] [PubMed]
- Ozomaro, U.; Wahlestedt, C.; Nemeroff, C.B. Personalized medicine in psychiatry: Problems and promises. BMC Med. 2013, 11, 132. [Google Scholar] [CrossRef] [PubMed]
- Menger, V.; Scheepers, F.; van Wijk, L.M.; Spruit, M. DEDUCE: A pattern matching method for automatic de-identification of Dutch medical text. Telemat. Inform. 2017. [Google Scholar] [CrossRef]
- Bird, S.; Klein, E.; Loper, E. Natural Language Processing with Python; O’Reilly Media, Inc.: Newton, MA, USA, 2009. [Google Scholar]
- Lan, M.; Tan, C.-L.; Low, H.-B.; Sung, S.-Y. A comprehensive comparative study on term weighting schemes for text categorization with support vector machines. In Proceedings of the Special Interest Tracks and Posters of the 14th International Conference on World Wide Web—WWW’05, Chiba, Japan, 10–14 May 2005; ACM Press: New York, NY, USA, 2005; p. 1032. [Google Scholar] [Green Version]
- Fürnkranz, J. A Study Using N-Gram Features for Text Categorization; Austrian Research Institute for Artificial Intelligence: Vienna, Austria, 1998. [Google Scholar]
- Dalal, M.K.; Zaveri, M.A. Automatic Text Classification: A. Technical Review. Int. J. Comput. Appl. 2011, 28, 37–40. [Google Scholar] [CrossRef]
- Li, T.; Zhang, C.; Ogihara, M. A comparative study of feature selection and multiclass classification methods for tissue classification based on gene expression. Bioinformatics 2004, 20, 2429–2437. [Google Scholar] [CrossRef] [PubMed] [Green Version]
- Chiu, B.; Crichton, G.; Korhonen, A.; Pyysalo, S. How to Train good Word Embeddings for Biomedical NLP. In Proceedings of the 15th Workshop on Biomedical Natural Language Processing, Berlin, Germany, 12 August 2016; pp. 166–174. [Google Scholar]
- Aggarwal, C.C.; Zhai, C.X. Mining Text Data; Springer: Boston, MA, USA, 2013; ISBN 9781461432234. [Google Scholar]
- Korde, V. Text Classification and Classifiers: A Survey. Int. J. Artif. Intell. Appl. 2012, 3, 85–99. [Google Scholar] [CrossRef]
- Rajan, K.; Ramalingam, V.; Ganesan, M.; Palanivel, S.; Palaniappan, B. Automatic classification of Tamil documents using vector space model and artificial neural network. Expert Syst. Appl. 2009, 36, 10914–10918. [Google Scholar] [CrossRef]
- Deshpande, V.P.; Erbacher, R.F.; Harris, C. An evaluation of Naïve Bayesian anti-spam filtering techniques. In Proceedings of the 2007 IEEE Workshop on Information Assurance, IAW, West Point, NY, USA, 20–22 June 2007; pp. 333–340. [Google Scholar]
- Alsaleem, S. Automated Arabic Text Categorization Using SVM and NB. Int. Arab J. Technol. 2011, 2, 124–128. [Google Scholar]
- Sun, A.; Lim, E.P.; Liu, Y. On strategies for imbalanced text classification using SVM: A comparative study. Decis. Support Syst. 2009, 48, 191–201. [Google Scholar] [CrossRef]
- Uǧuz, H. A two-stage feature selection method for text categorization by using information gain, principal component analysis and genetic algorithm. Knowl. Based Syst. 2011, 24, 1024–1032. [Google Scholar] [CrossRef]
- Liu, Z.; Yang, M.; Wang, X.; Chen, Q.; Tang, B.; Wang, Z.; Xu, H. Entity recognition from clinical texts via recurrent neural network. BMC Med. Inform. Decis. Mak. 2017, 17. [Google Scholar] [CrossRef] [PubMed]
- Tang, D.; Qin, B.; Liu, T. Document Modeling with Gated Recurrent Neural Network for Sentiment Classification. In Proceedings of the 2015 Conference on Empirical Methods in Natural Language Processing, Lisbon, Portugal, 17–21 September 2015; pp. 1422–1432. [Google Scholar]
- Hughes, M.; Li, I.; Kotoulas, S.; Suzumura, T. Medical Text Classification Using Convolutional Neural Networks. Stud. Health Technol. Inform. 2017, 235, 246–250. [Google Scholar] [CrossRef] [PubMed]
- Zhang, X.; Zhao, J.; LeCun, Y. Character-level Convolutional Networks for Text Classification. arXiv, 2015; arXiv:1509.01626. [Google Scholar]
- Bengio, Y. Practical recommendations for gradient-based training of deep architectures. arXiv, 2012; arXiv:1206.5533. [Google Scholar]
Figure 1.
An overview of the proposed steps involved in comparing deep learning and classical machine learning techniques. On the right, a fictional example admission is shown. The details of the admissions in step 1 can be seen in Table 1. All text representations in step 3a are visible in Table 2, and the classification models of step 3b are shown in Table 3.

Figure 2.
Day on which the first violence incident occurred as percentage of the total number of first incidents, cutoff after day 50. For instance, it can be verified that if violence occurs during an admission, the first incident happened on the fifth day of admission roughly 6% percent of the time.

Table 1.
Some descriptive statistics of the six inpatient units. An admission is classified as violent if at least one incident occurs between the second and 30th of admission.
Table 1.
Some descriptive statistics of the six inpatient units. An admission is classified as violent if at least one incident occurs between the second and 30th of admission.
| Unit | Population | Type of Unit | Type of Admission | No. Admissions | Violent Admissions (%) |
|---|---|---|---|---|---|
| 1 | Adult | Closed | Planned | 307 | 3.6 |
| 2 | Adult | Closed | Acute | 1047 | 7.5 |
| 3 | Child, adolescent | Closed | Acute | 415 | 13.7 |
| 4 | Adolescent, adult | Closed | Planned | 428 | 14.3 |
| 5 | Child | Closed | Planned | 139 | 34.5 |
| 6 | Child | Day treatment | Planned | 185 | 17.3 |
Table 2.
The different types of text representations and the values of the parameters used.
| Representation | Parameter | Value |
|---|---|---|
| Bag of words | Weighting | binary, tf-idf |
| N-gram range | 1–3 | |
| No. features | 1000 | |
| Text embeddings | Level | word, document |
| Model size | 320 | |
| Min frequency | 50 | |
| Epochs | 20 |
Table 3.
An overview of Deep Learning models that take a sequence as input, and classical models that require a single input, along with the relevant hyperparameters that are tuned.
Table 3.
An overview of Deep Learning models that take a sequence as input, and classical models that require a single input, along with the relevant hyperparameters that are tuned.
| Model | Hyperparameter | Range |
|---|---|---|
| Recurrent Neural Network | Learning rate | 10−5–10−1 |
| Cell type Layer size Dropout rate | GRU, LSTM 24–28 0.5–0.9 | |
| Convolutional Neural Network | Learning rate No. filters Filter size Pooling size Dropout rate Fully connected layer size | 10−5–10−1 24–28 3–7 2–7 0.5–0.9 24–28 |
| Neural Network | Learning rate | 10−5–10−1 |
| Layer size | 24–28 | |
| Regularization constant | 10−5–10−1 | |
| Naive Bayes | N/a | - |
| Support Vector Machine | Gamma | 10−5–10−1 |
| C | 10−5–10−1 | |
| Kernel | linear, radial | |
| Decision Tree | Max depth | 21–24 |
| Max features | 0.25–0.75 | |
| Min samples split | 21–24 |
Table 4.
The performance for optimal hyperparameter values for each of the representations combined with the models, based on a 5-fold stratified cross validation. The performance is measured in AUC, along with its standard deviation. The best performance over different models is marked with an a, the best performance over representations with a b.
| Model | Bag-of-Words Binary | Bag-of-Words tf-idf | Word Embeddings | Document Embeddings |
|---|---|---|---|---|
| RNN 1 | 0.771 ± 0.018 b | 0.753 ± 0.031 | 0.654 ± 0.043 | 0.788 ± 0.018 a,b |
| CNN 2 | 0.729 ± 0.030 | 0.716 ± 0.038 | 0.684 ± 0.038 | 0.763 ± 0.024 a |
| NN 3 | 0.727 ± 0.033 | 0.717 ± 0.038 | 0.751 ± 0.036 a | 0.745 ± 0.022 |
| NB 4 | 0.686 ± 0.026 | 0.704 ± 0.034 a | 0.700 ± 0.051 | 0.692 ± 0.046 |
| SVM 5 | 0.759 ± 0.040 | 0.756 ± 0.036 b | 0.764 ± 0.024 b | 0.770 ± 0.029 a |
| DT 6 | 0.727 ± 0.018 a | 0.719 ± 0.041 | 0.685 ± 0.041 | 0.665 ± 0.035 |
1 Recurrent Neural Network; 2 Convolutional Neural Network; 3 Neural Network; 4 Naive Bayes; 5 Support Vector Machine; 6 Decision Tree.
© 2018 by the authors. Licensee MDPI, Basel, Switzerland. This article is an open access article distributed under the terms and conditions of the Creative Commons Attribution (CC BY) license (http://creativecommons.org/licenses/by/4.0/).
Share and Cite
MDPI and ACS Style
Menger, V.; Scheepers, F.; Spruit, M. Comparing Deep Learning and Classical Machine Learning Approaches for Predicting Inpatient Violence Incidents from Clinical Text. Appl. Sci. 2018, 8, 981. https://doi.org/10.3390/app8060981
AMA Style
Menger V, Scheepers F, Spruit M. Comparing Deep Learning and Classical Machine Learning Approaches for Predicting Inpatient Violence Incidents from Clinical Text. Applied Sciences. 2018; 8(6):981. https://doi.org/10.3390/app8060981
Chicago/Turabian StyleMenger, Vincent, Floor Scheepers, and Marco Spruit. 2018. "Comparing Deep Learning and Classical Machine Learning Approaches for Predicting Inpatient Violence Incidents from Clinical Text" Applied Sciences 8, no. 6: 981. https://doi.org/10.3390/app8060981
Note that from the first issue of 2016, this journal uses article numbers instead of page numbers. See further details here.