Article

Optimization Analysis of the Energy Management Strategy of the New Energy Hybrid 100% Low-Floor Tramcar Using a Genetic Algorithm

1
CRRC Institute, Beijing 100070, China
2
CRRC Tangshan Co., Ltd., Tangshan 064000, China
*
Author to whom correspondence should be addressed.
Appl. Sci. 2018, 8(7), 1144; https://doi.org/10.3390/app8071144
Submission received: 23 April 2018 / Revised: 28 June 2018 / Accepted: 10 July 2018 / Published: 13 July 2018
(This article belongs to the Special Issue Hybrid Energy Storage Systems)

Abstract

:
Performance and economic efficiency of the fuel cell (FC)/battery/super capacitor (SC) hybrid 100% low-floor tramcar is mainly determined by its energy management strategy. In this paper, a train traction model was built to calculate the power output and energy consumption properties of the hybrid tramcar. With the purpose of reducing hydrogen consumption, the genetic algorithm was adopted to optimize the original energy management strategy. The results before and after the optimization show that the power requirement of the tramcar can be satisfied in both situations with the fuel cell (FC) module non-stopped. The maximum output power of the FC is reduced from 170 kW to 101.21 kW. As for the SC, a two-parallel connection module is used instead of the three-parallel one, and the power range changes from −125~250 kW to −67~153 kW. Under the original energy management strategy, the battery cannot be used efficiently with less exporting and absorbent power. Its utilization ratio is improved greatly after optimization. In sum, the equivalent total hydrogen consumption is reduced from 3.3469 kg to 2.8354 kg, dropping by more than 15%.

1. Introduction

At present, electric power is the main energy source of railway vehicles [1,2]. In China, more than 80% of the electric energy comes from thermal power generation [3]. Meanwhile, the “abundant coal-barren petroleum-lacking gas” energy structure compels the government to spend nearly 50% of coal on electric power generation annually [4,5]. As society develops, the increasing energy demand contributes to the energy crisis. Meanwhile, the large-scale application of primary energy promotes the CO2 volume fraction in the atmosphere, which is the main cause of global warming. The emissions from the mobile pollution source or industry, such as HC, NOx, and particular matter (PM), greatly threaten human health [6,7]. In this environment, we believe the urban railway system is an effective way to ease the traffic pressure. In addition, the tramcar should have played a more important role in perfecting the city environment by getting rid of the power grid and adopting clean renewable energy as its power [8].
A fuel cell is a kind of power source which transforms chemical energy into electric energy without a combustion process. The proton exchange membrane fuel cell, which is fueled with hydrogen, has the potential for heavy-duty applications due to its advantages of a high conversion efficiency, better low-temperature adaptability, and non-emission [9,10,11]. However, the soft power output characteristic of the fuel cell cannot satisfy the great power demand of the railway vehicle, especially in transient operating conditions. Besides that, the FC cannot recover the braking energy due to the unidirectional energy flow route [12]. Therefore, some other energy modules should be introduced into the power chain, such as the super capacitor, battery, and unidirectional/bidirectional DC/DC. Based on this, a 100% low-floor tramcar is developed using the above introduced hybrid power system. Here, the FC is the primary energy source, while the battery is used for enlarging the energy storage quantity, absorbing the braking energy, and serving as the emergency traction power [13,14]. The super capacitor can also be used for braking energy recovery. Due to its high power density, it is capable of improving the tramcar acceleration response [15,16].
As for the new energy hybrid power tramcar with definite parameters, its performance and economic efficiency is mainly determined by its energy management strategy. Recently, the energy management of the hybrid system has become a research hot spot around the world. Li et al. [17] proposed a power management strategy based on adaptive droop control. By employing the equivalent consumption minimization strategy (ECMS) and multi-mode strategy, the hydrogen consumption of the hybrid tramway is optimized and the safe operating conditions are warranted to fulfill a better energy efficiency of the overall hybrid system and prolong the lifetime of each power source. Han et al. [18] proposed a multi-source coordination energy management strategy based on self-convergence droop control for a large-scale and high-power hybrid tramway. As introduced in their study, the self-convergence droop control approach is capable of limiting the circulating currents, balancing the SOC (state of charged) of each ESS (energy storage system), and modifying the power injections or absorption to fulfill the regulated voltages. Zhang et al. [19] developed a locomotive model using the Advanced Vehicle Simulator (ADVISOR). Based on the model, the power of the fuel cell (FC), battery, and motor are optimized using the bisection algorithm under certain constraints. Wang et al. [20] have presented the DC/DC power converters, including unidirectional boost and bidirectional types, by using time delay control to implement power management for hybrid power systems. Li et al. [21] have presented a power sharing strategy and a state machine strategy based on droop control for a power management system of a hybrid tramway. Fadil et al. [22] have developed a nonlinear controller on the basis of a nonlinear model of a hybrid energy storage system for electric vehicles by using Lyapunov stability design techniques. Wu et al. [23] have presented an adaptive control strategy based on parameter estimations to manage the power sharing in this hybrid power system and satisfy the system constraints. Li et al. [24] have presented a power sharing strategy and a state machine strategy for a proton exchange membrance fuel cell (PEMFC)/battery/super capacitor (SC) hybrid tramway.
These researches promote the performance and energy management strategy of the hybrid system. However, studies on the energy management of the FC/battery/SC hybrid system used for a tramcar, especially the optimization of the whole train simulation based on the railway line, have rarely been reported. In this paper, a whole train simulation model, which contains the energy storage module, power-train module, power bus module, and electric auxiliary system module, was built based on the independently developed FC/battery/SC 100% low-floor tramcar. Then, the genetic algorithm was adopted to optimize the original energy management strategy by selecting the Guanggu T1 uplink in Wuhan, China, for calculation. Therefore, the applicability and quantitative index of the economy of the optimized strategy are available with the help of the calculation model.

2. Building of the Simulation Model

2.1. Parameters of the Prototype Train

There are two identical power systems in the FC/battery/SC hybrid 100% low-floor tramcar. The main parameters of the tramcar are shown in Table 1. In every power system, 3-in parallel SCs and 2-in parallel batteries are adopted, and the power source configurations are shown in Table 2.

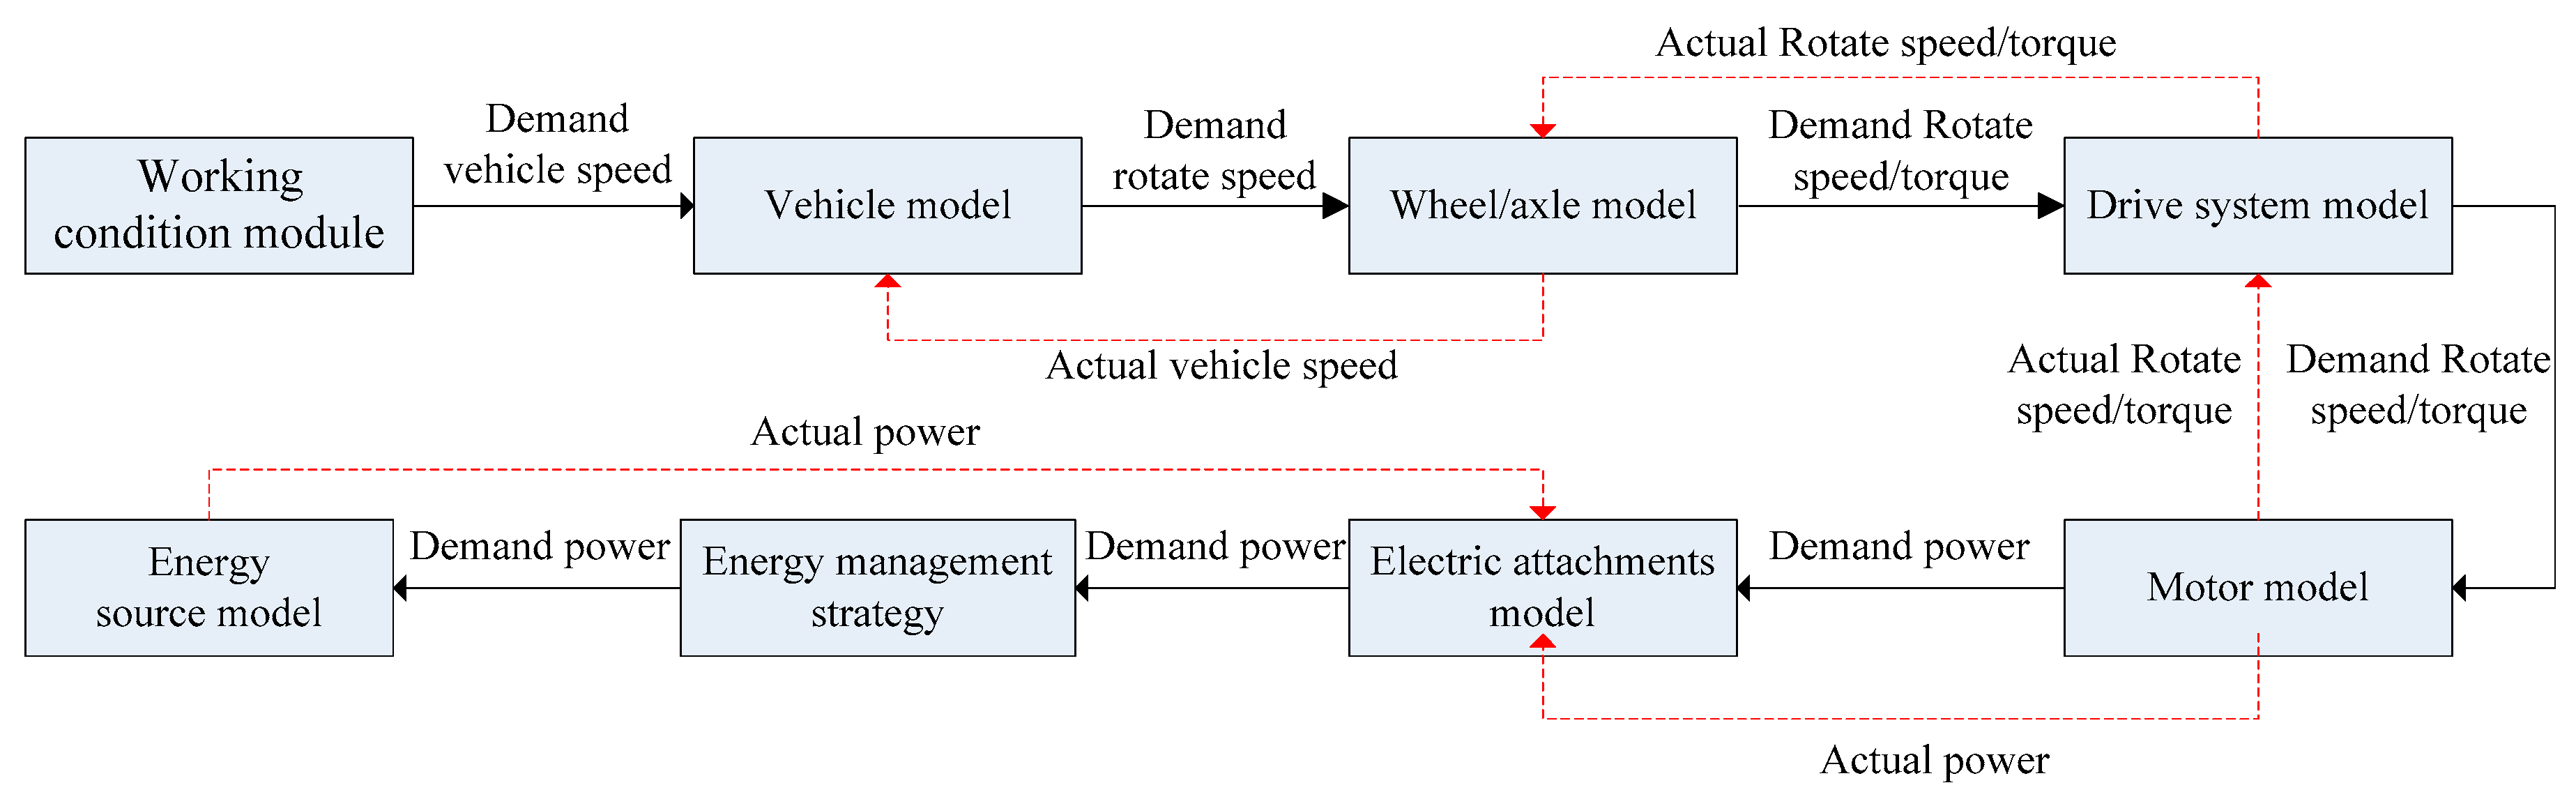
2.2. Building of the Numerical Model

The structure of the numerical model of the new energy hybrid 100% low-floor tramcar is shown in Figure 1.
The model starts from the demand of the driving cycle, and then deduces the torque, speed, and power values of every assembly unit. The emulational information flows along the vehicle dynamical model, wheel model, and drive system, and finally reaches the power assembly model. Then, the power demand is transmitted to the drive system according to the torque requirement and limitation. Next, it passes through the wheel module and finally reaches the vehicle module. The calculation error is considered in the reversed calculation process and then fed back to the vehicle module. Some key modules shown in Figure 1 will be introduced in the following parts.

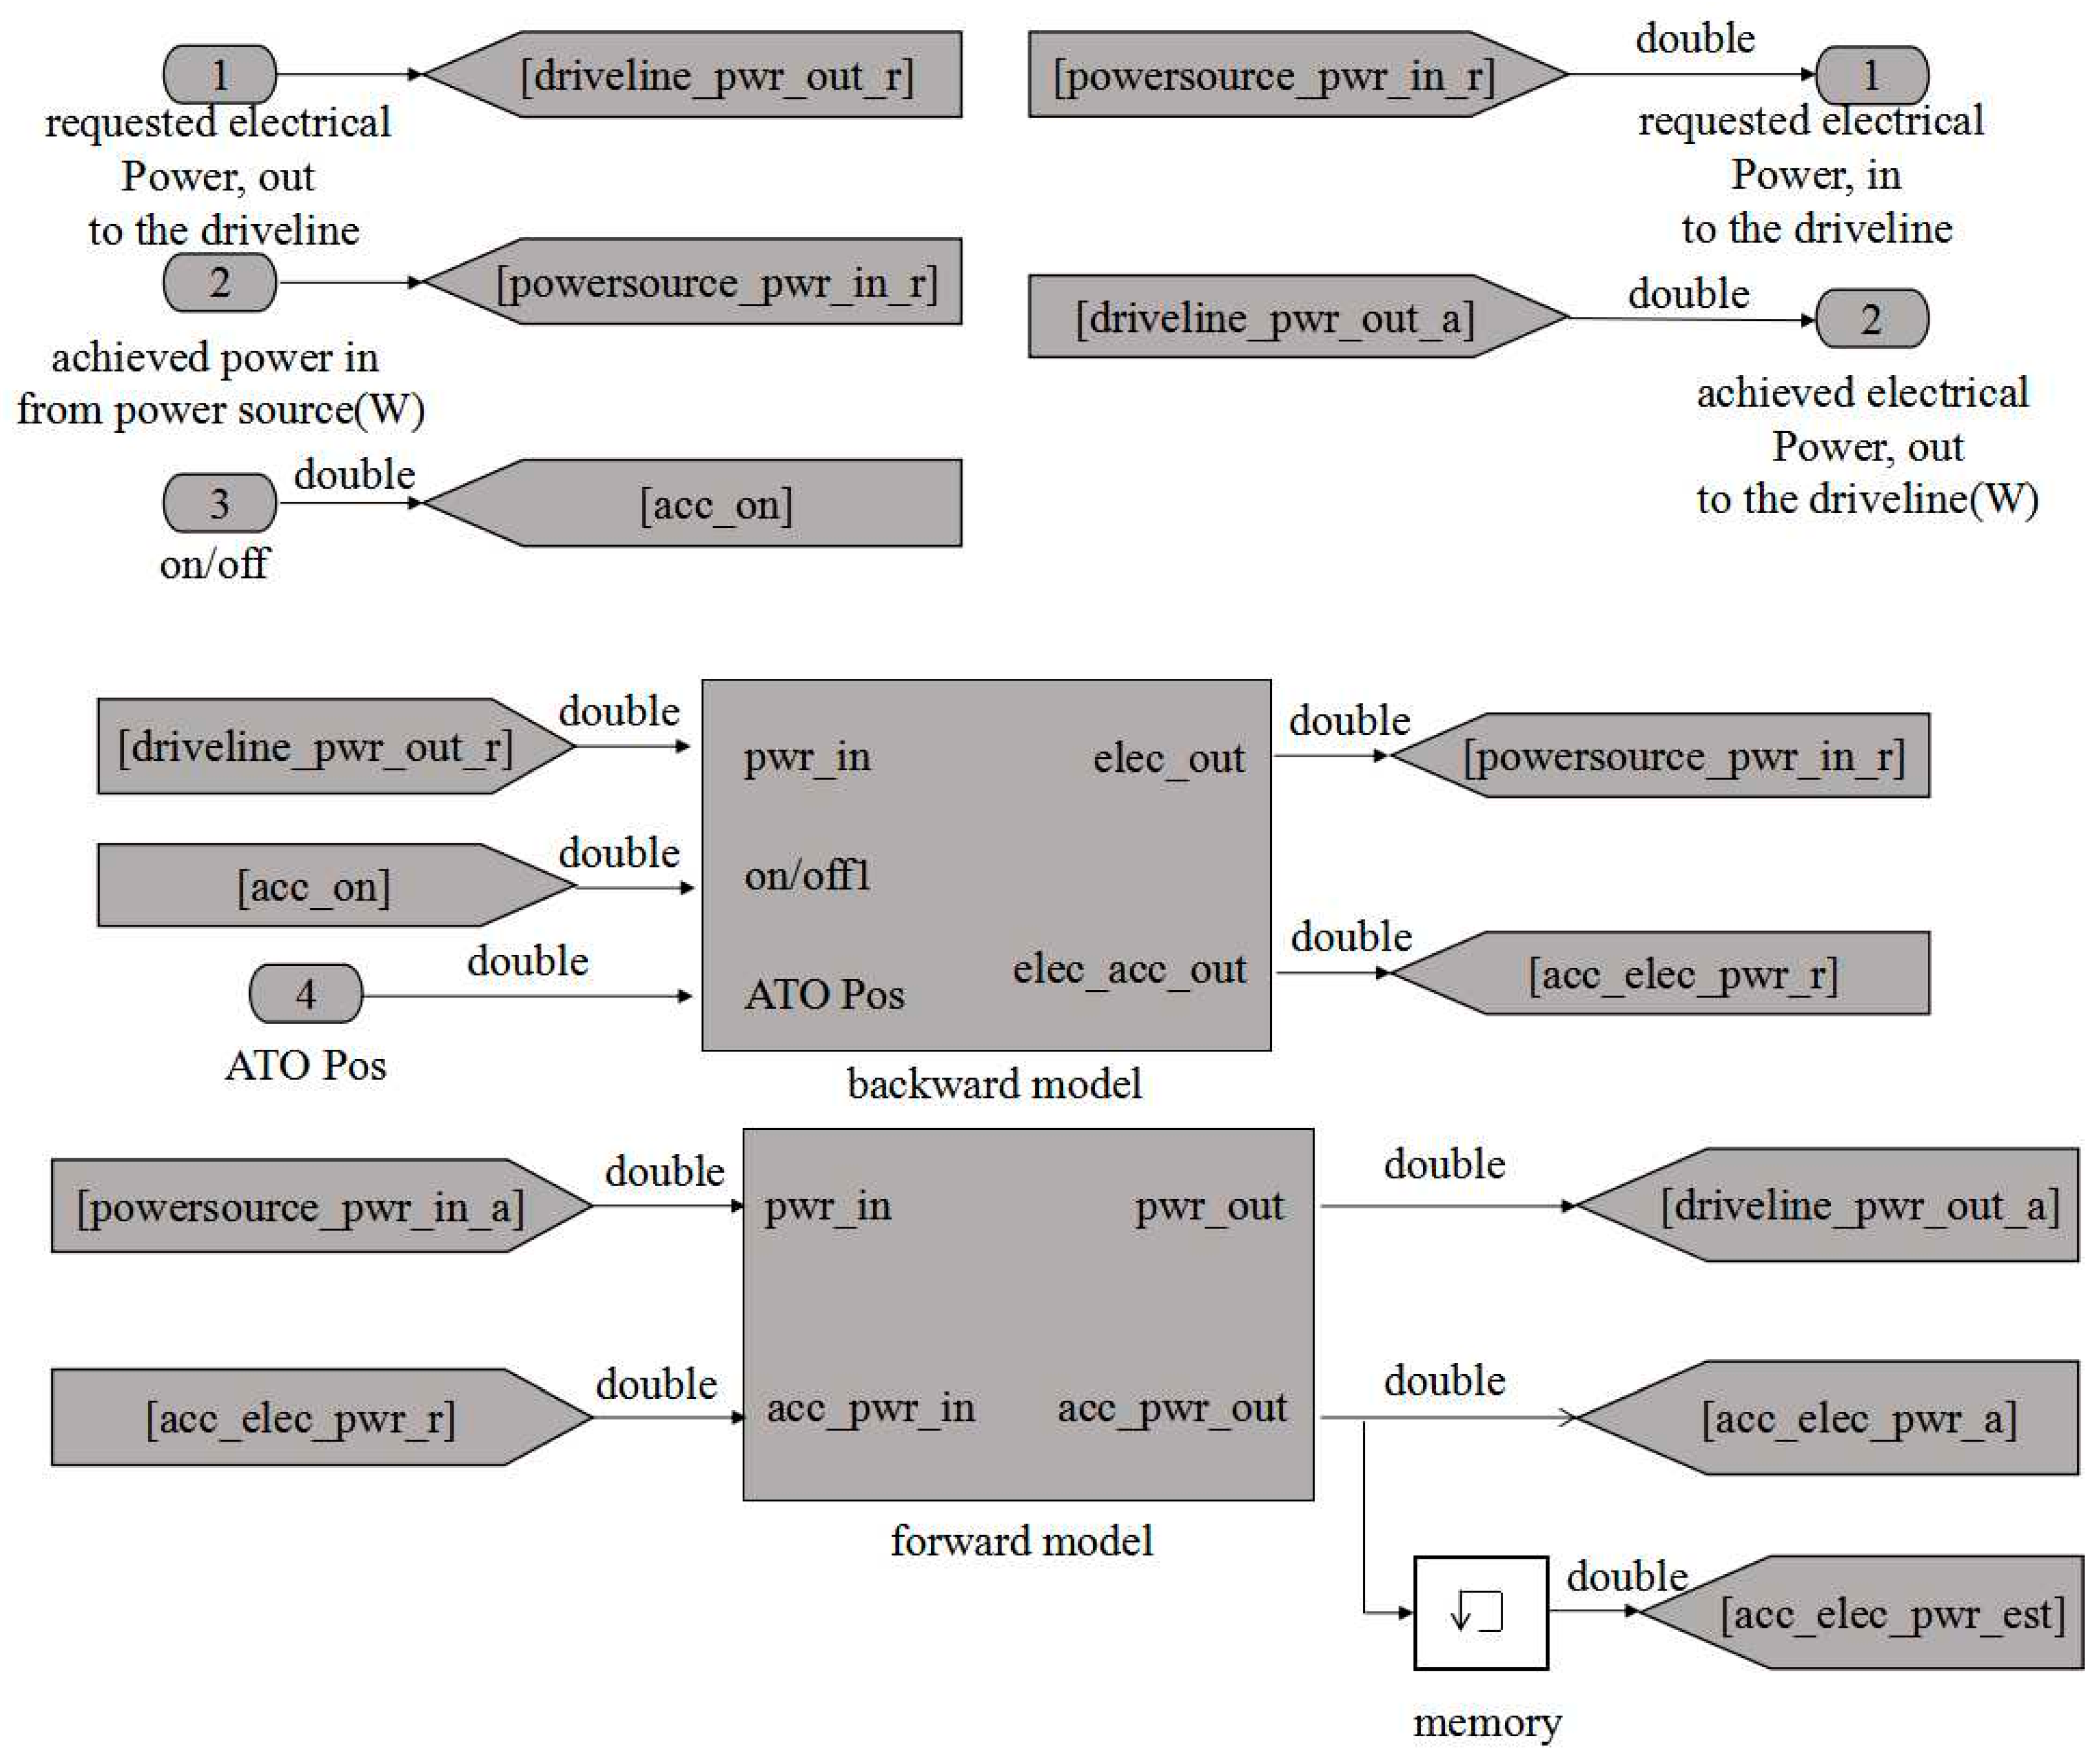
2.2.1. Electric Auxiliary System Module

The electric auxiliary system module includes the air conditioner, illumination, and so on. Power dissipation of the equipment is considered in the module, and it is divided into the constant part and variable part separately, as shown in Equation (1).
P a = P a , c o n s + P ( S )
where P a , c o n s is the constant part; and P ( s ) is a function of the train position, which is defined by the test data. The P ( s ) can also be replaced by a constant value, P c o n s , when the test data is unachievable. Then, Equation (1) can be replaced by Equation (2):
P a = P a , c o n s + P c o n s
According to the above analysis, part of the auxiliary system calculation model is shown in Figure 2.
All the input and output ports are included in the connector module. Here, the input port 1 is the power demand of the transmission system; input port 2 is the actual power output by the power producer which returns from the power bus; and input port 3 is the start switch. Output port 1 is the producer power requirement considering the power consumption of auxiliary systems transmitted to the power bus; and output port 2 is the actual output power returns to the drive system.
In the backward calculation routine, the system total power demand is the sum of the drive system power requirement and the power requirement of auxiliary systems. In the forward calculation routine, the exportable power of the drive system is the difference between actual output power returns from the power bus and the auxiliary system module power dissipation.

2.2.2. Power Bus Module

This sub-system transmits the demand and actual power of every power producer according to the load requirement and the energy management strategy. The structure of the power bus module is shown in Figure 3.
Input port 1 is the power demand from the power producer; input port 2 is the actual power demand from the battery system, which is the difference between the actual output power and the total power demand of the train load; and input port 3 is the actual power output of the super capacitor.

2.2.3. The Train Traction Module

This module is used to calculate the traction of the whole train. The initial velocity used for iterative computations was not given to the module, but the average speed value between the present and last step was used instead. The power demand used for driving the wheel can be calculated by the product of the demand driving force in the current step and the average speed. Meanwhile, in the forward calculation route, the speed for the last step is derived from a speed estimation module.
The modeling method of this model is mainly based on the dynamic equation of the train, using the iterative method to calculate the acceleration of the vehicle and then gradually integrate the speed of the vehicle. The basic and accessional resistances are considered in the calculation. The structure of the train module is shown in Figure 4, which can be divided into the forward part and backward part.
(1) Backward calculation
In the backward calculation routine, the vehicle demand speed tra_spd_r is the average value of the initial and finial speed in the current step. Also, the demanded traction is the sum of the start-basic resistance t r a _ s t a r t _ b a s i c _ r e s i s t a n c e , the curve resistance tra_curve_resistance, and the slope resistance tra_slope_resistance.
t r a _ s t a r t _ b a s i c _ r e s i s t a n c e + t r a _ c u r v e _ r e s i s t a n c e + t r a _ s l o p e _ r e s i s t a n c e
t r a _ s p d _ r = ( v _ p r e v + c y c _ s p d _ r ) / 2
(2) Forward calculation
In the forward calculation routine, the sub-module train_speed calculates the initial speed of the next step according to the actual traction and speed from the train wheel module. This is the preparation step for the solution of the demand speed in the calculation path.
The principle of forward calculation is that the quadratic polynomial equation of the average speed in the current step is obtained according to the longitudinal dynamics equation of the train. The average speed of the current step v_aver can be obtained by solving this quadratic or one equation. Then, the final speed v_t is gained by the initial speed v_0 in the current step.
When the actual traction of the train tra_force_a is greater than or equal to zero, the average velocity of the current step v_aver is the smaller value between v_aver and tra_spd_a. Otherwise, the v_aver is taken by the maximum value between v_aver and tra_spd_a.

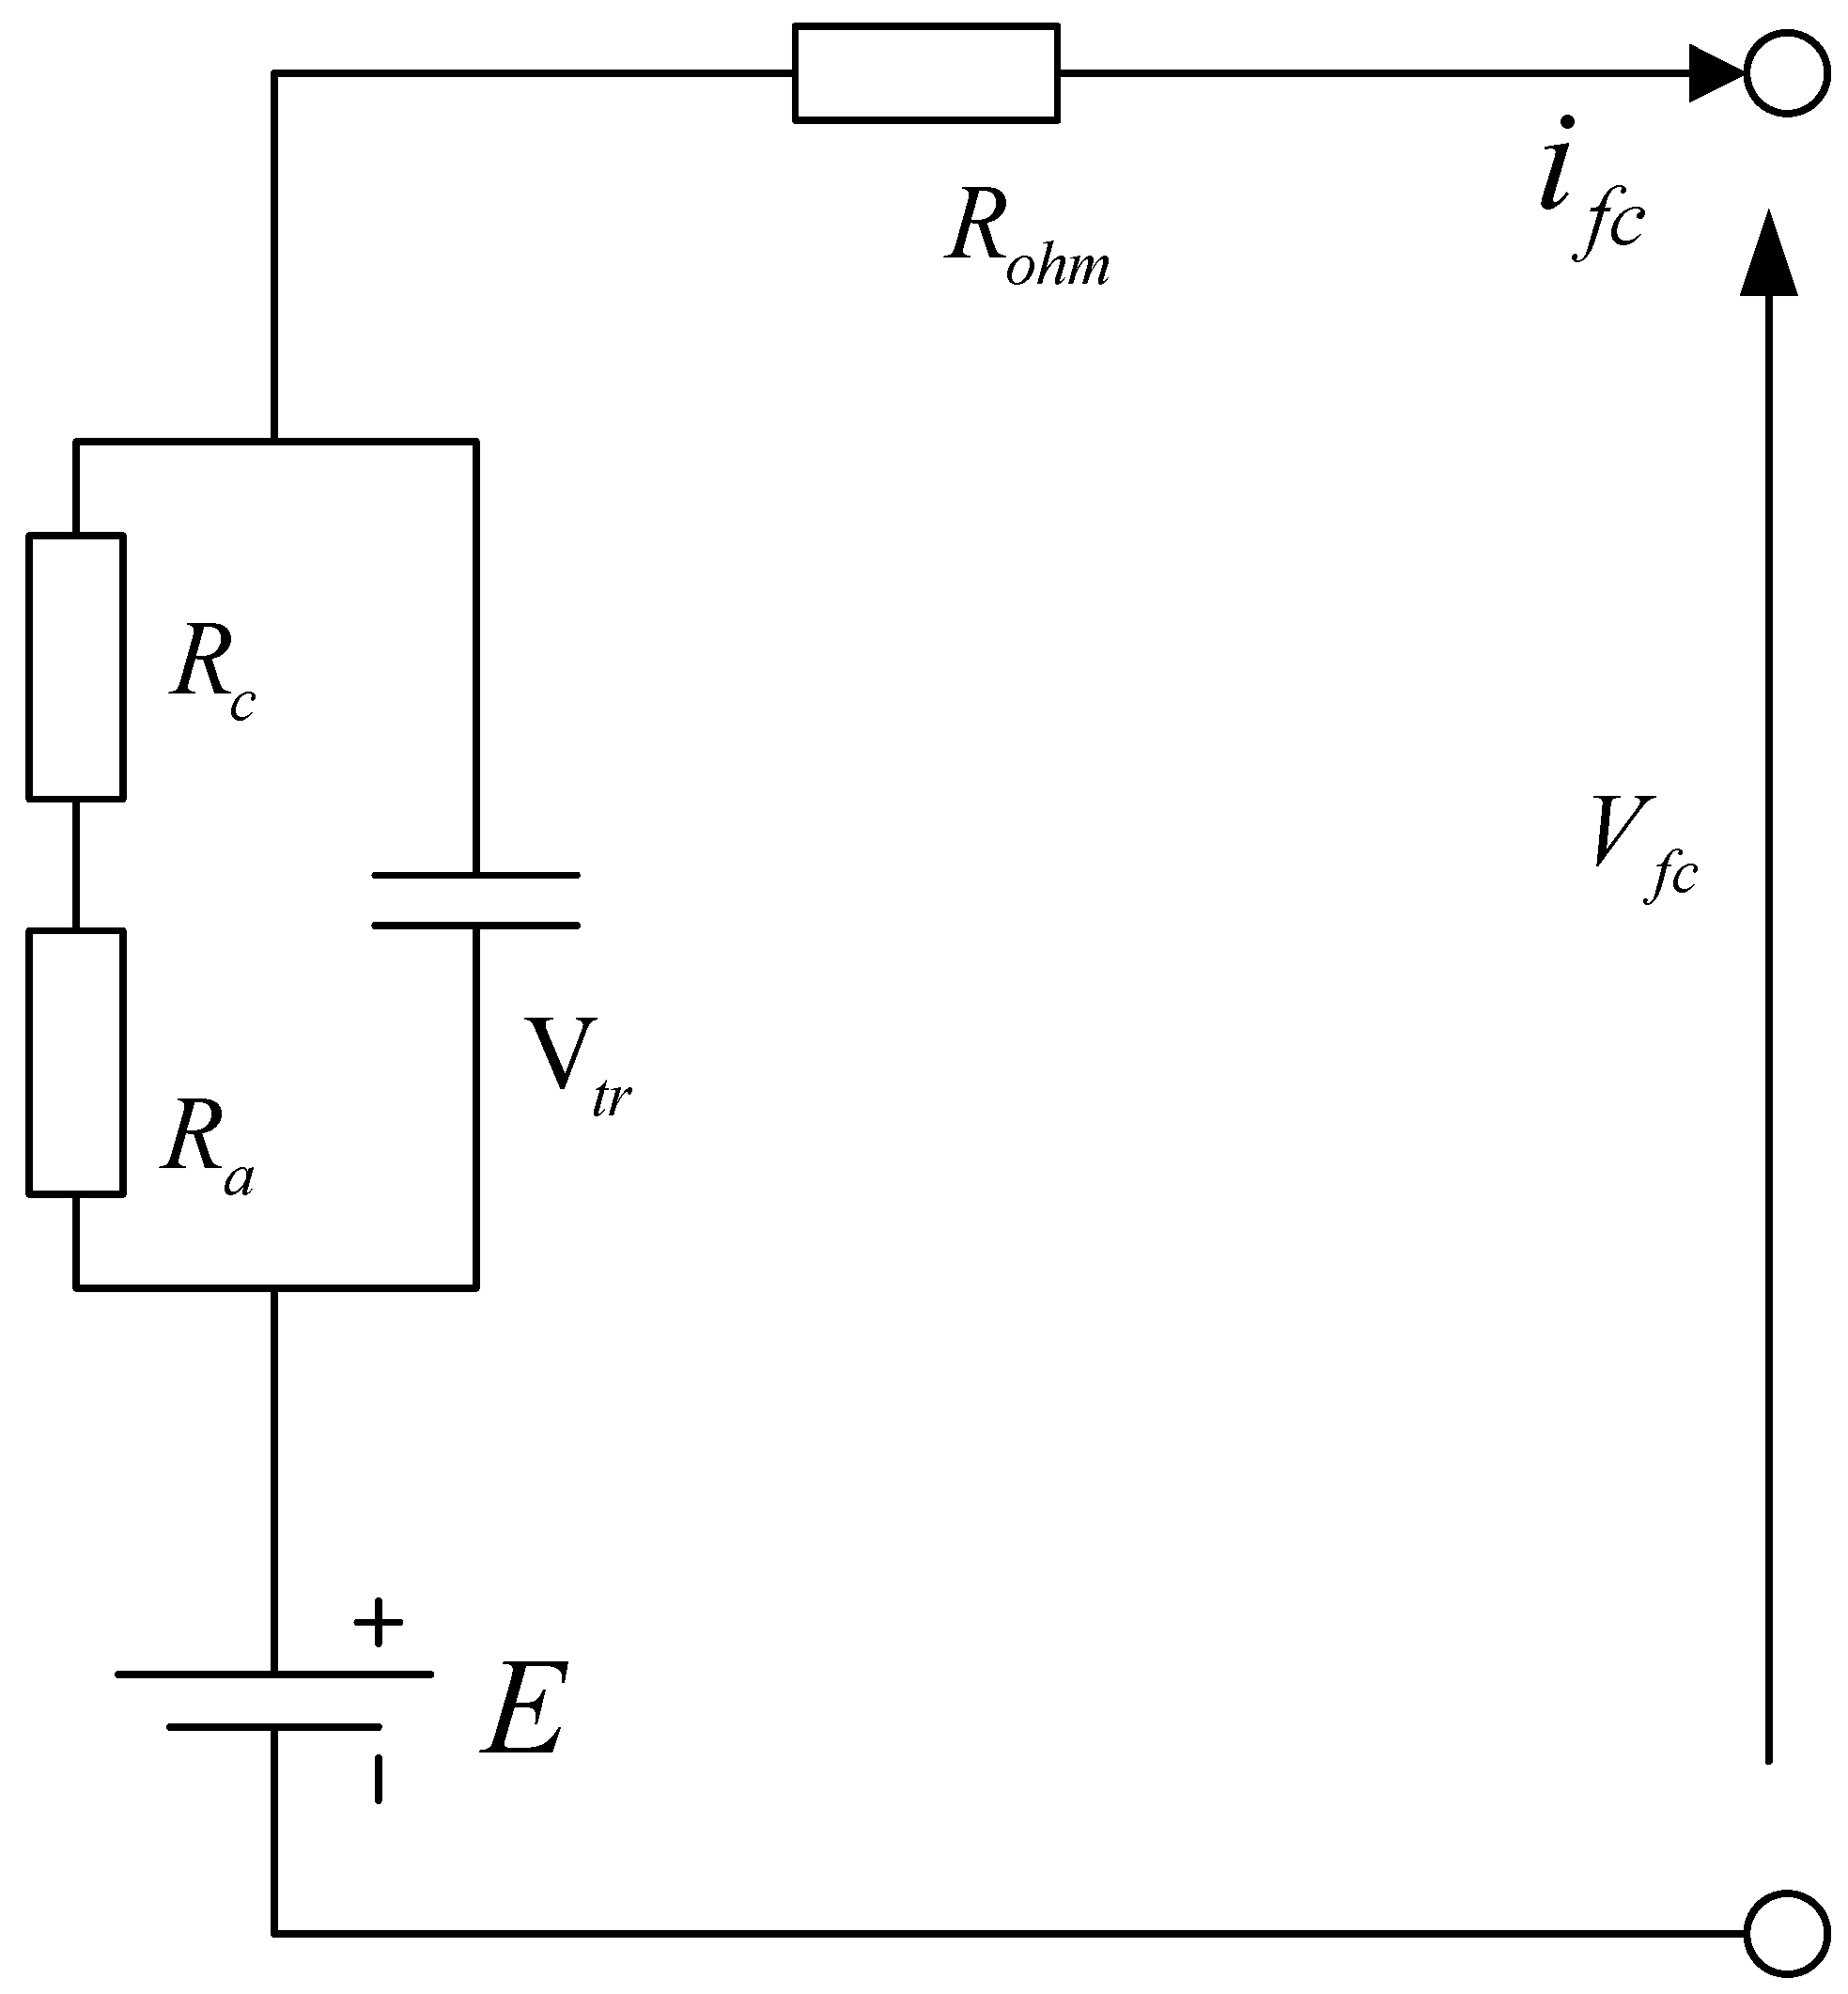
2.2.4. Energy Storage System Module

The energy storage system module in this study is used to simulate the on-board FC, battery, and SC modules. The module receives power demand instructions from the power bus, returns to the fuel cell, battery, and super capacitor of the actual output power, voltage, current, state of charged, and so on. The positive power value is defined as discharge.
(1) Fuel cell system module
There are many kinds of fuel cells. In this study, the Ballard 150 kW PEMFC is adopted as the prototype for modeling. The operating process of the PEMFC is relatively complex. In order to deduce a simplified nonlinear fuel-cell module, some assumptions are made below:
(1)
Assuming that the working temperature of the FC stack is constant (the response time of the FC to temperature is about 102 s).
(2)
Assuming that both the anode and cathode of the fuel cell are well humidified, which means the humidity management is considered to be OK.
(3)
Assuming that the liquid water will not leave the stack, which means the water management is considered to be OK.
(4)
Assuming that the humidifier and temperature controller work in a reasonable range, which means temperature management is considered to be OK.
To simplify the dynamic model, assuming that the entry reactant mole fraction is constant, namely pure hydrogen (99.95%) is directly inhaled to the anode. Air mixing (according to Nitrogen and Oxygen 79:21) is sent into the cathode, assuming that all gases are ideal.
The equivalent circuit model of the proton exchange membrane fuel cell is shown in Figure 5.
According to the steady-state voltage and current characteristics of the fuel cell, the output voltage of the fuel cell is represented by V fc :
V f t = E V a V c V o h m
where E is the reversible voltage of fuel cell (open circuit voltage at steady state), V; V a is the activation voltage drop of the anode and cathode (also known as activation overpressure drop), V; V c is the voltage drop caused by reactant gas concentration drop or the mass transfer of oxygen and hydrogen (also known as the concentration overpressure drop), V; and V o h m is the ohm overvoltage caused by the proton passing through a solid electrolyte or the electron passing through a circuit, V.
The steady-state component of the fuel cell voltage V s t is expressed as:
V s t = E V o h m
The transient component of the fuel cell voltage V t r is:
V t r = V a + V c
The calculation method of open circuit voltage is as follows:
E = K c · E n
where K c is the voltage constant under rated operating condition; and E n is the Nernst voltage, V.
The calculation method of activation voltage drop is as follows:
V a = N A ln ( i f t i 0 ) 1 s T d / 3 + 1
where A is the slope of tafel, V; i 0 is the exchange current for fuel cells corresponding to activation voltage, A; and T d is the fuel cell activation response time, s.
(2) The battery module
The equivalent circuit of the battery is shown in Figure 6. Here, V o c is the open circuit voltage, Rint is the battery internal resistance, I is the battery current, and V is the battery output voltage.
The open circuit voltage is a function of SOC and module temperature. The corresponding values of SOC, temperature, and open-circuit voltage are obtained by a test of the typical working condition, and then the continuous variation of the open-circuit voltage with SOC and temperature is gained by interpolation. The open-circuit voltage of the series battery pack is the product of single module voltage and the number of battery monomers. Charging and discharging internal resistance of the battery can be calculated by the same method.
V o c = l i n e a r F i t t i n g ( e s s s o c , e s s t e m , e s s v o c )
o p e n   c i r c u i t   v o l t a g e = e s s _ m o d u l e _ n u m · V o c
According to the electric power formula and Kirchhoff’s voltage law (KVL), the quadratic equation is obtained, and the current value and voltage value are achievable by solving the equation.
P = V · I
V = VocRint·I
where Rint is the internal resistance. The basic method for SOC calculation is the Ann-time integral.
(3) SC system module
The equivalent circuit of SC is shown in Figure 7.
The open circuit voltage is calculated by Equation (14):
V o c = S O C · ( V m a x V m i n ) + V m i n
where SOC is the capacity of the SC; and Vmax and Vmin are the maximum and minimum voltage, respectively. Generally, Vmax is the nominal voltage of the SC. If the SC can be emptied, the Vmin is zero. In the full charge state, namely the SOC = 1, the Voc is equal to Vmax.
The equivalent series internal resistance of charge and discharge is a function of the internal monomer SC’s temperature ess_tmp and current ess_i. The corresponding values of temperature, current, and internal resistance of charge and discharge are obtained by a discrete test, and then the continuous variation of the charge and discharge resistance with temperature and current is gained by interpolation. Compared to the battery model, there is only one set of internal resistance parameters in the SC module. The positive value of the current corresponds to the discharge resistance, while the negative value corresponds to the charge resistance. The internal resistance of the SC group is the result of single SC internal resistance multiplied by the series number and then divided by the number of parallel lines, that is:
R = r · n s / n p
e s s _ m o d _ r = e s s _ r · e s s _ m o d u l e _ n u m / e s s _ p a r a l l e l _ m o d _ n u m
where r is the single super capacitor internal resistance; ns is the series number; and np is the parallel number.
According to the equivalent circuit:
P = V o c · I R · I 2
Equation (17) has two solutions. The voltage required to produce the same power is smaller for a large current situation. While the minimum working voltage of the battery is half of the open-circuit voltage Voc. Therefore, the smaller one in the solution is what we need, which means the current can be calculated by Equation (18):
I = ( V o c ( V o c 2 4 R P ) 0.5 ) / 2 R

3. Simulation Calculation Based on the Original Energy Management Strategy

3.1. The Original Energy Management Strategy

The original energy management strategy of the FC/battery/SC hybrid 100% low-floor tramcar is a power following principle. The first step of the strategy is to calculate the power restriction of the power source under current conditions.
Define the charge/discharge cut-off SOC of the battery and the charge/discharge cut-off voltage of the capacitor. If the mass of the remaining hydrogen is greater than the lowest available hydrogen of the fuel cell, the maximum output power of the fuel cell is defined as the product of the minimum voltage and the maximum current, and the minimum output power of the fuel cell is the product of the maximum voltage and the minimum current. If the mass of the remaining hydrogen is smaller than the lowest available hydrogen of the fuel cell, the maximum and minimum output power is 0. The DC bus side maximum power of the fuel cell is the maximum output power multiplied by DC efficiency. The DC bus minimum power is the minimum output power multiplied by DC efficiency.
If the capacitor voltage is between the charge/discharge cut-off voltages, the maximum output power of the capacitor is the capacitor voltage multiplied by the maximum limiting current of the capacitor. If capacitor SOC is not in this range, the maximum output power of the capacitor is 0. Capacitor minimum output power (i.e., charging power, negative) is the terminal voltage of the capacitor multiplied by the minimum current of the capacitor (negative). The DC bus side maximum power of the capacitor is the maximum output power of the capacitor multiplied by DC efficiency. The DC bus minimum power of the capacitor is the minimum output power of the capacitor multiplied by DC efficiency.
If the battery voltage is between the charge/discharge cut-off voltages, the maximum output power is the battery voltage multiplied by the maximum limiting current. The minimum output power (i.e., charging power, negative) is the current terminal voltage multiplied by the minimum current (negative). If the SOC of the capacitor is not in this range, the maximum and minimum output power of the battery is 0. The DC bus side maximum power of the battery is the maximum output power of capacitor multiplied by DC efficiency. The DC bus minimum power of the battery is the minimum output power multiplied by DC efficiency.
The maximum output power is the sum of the maximum powers of the fuel cell, battery, and SC.
Then, the calculation of power distribution is as follows:
First, the power on the FC bus side is output based on the minimum allowable power. Then, the power of the FC minus the bus power will be left over. This part of the power will be given priority to the charging capacitor, and then the battery will be charged (considering the maximum charging power of the battery and capacitor).
If the demand power of the bus is equal to or greater than the minimum power of the FC DC side and the demand power of the bus is smaller than the minimum power of the FC DC side, then the output power of the FC is the demand power of the bus with the batteries and SCs do not work. If the demand power of the bus is greater than the maximum power of the FC DC side, fuel cells are powered by the maximum allowable capacity and the remaining part of the demand power is output by the capacitor.
The final actual output power of the FC is the bus demand power of the fuel DC, divided by DC efficiency.

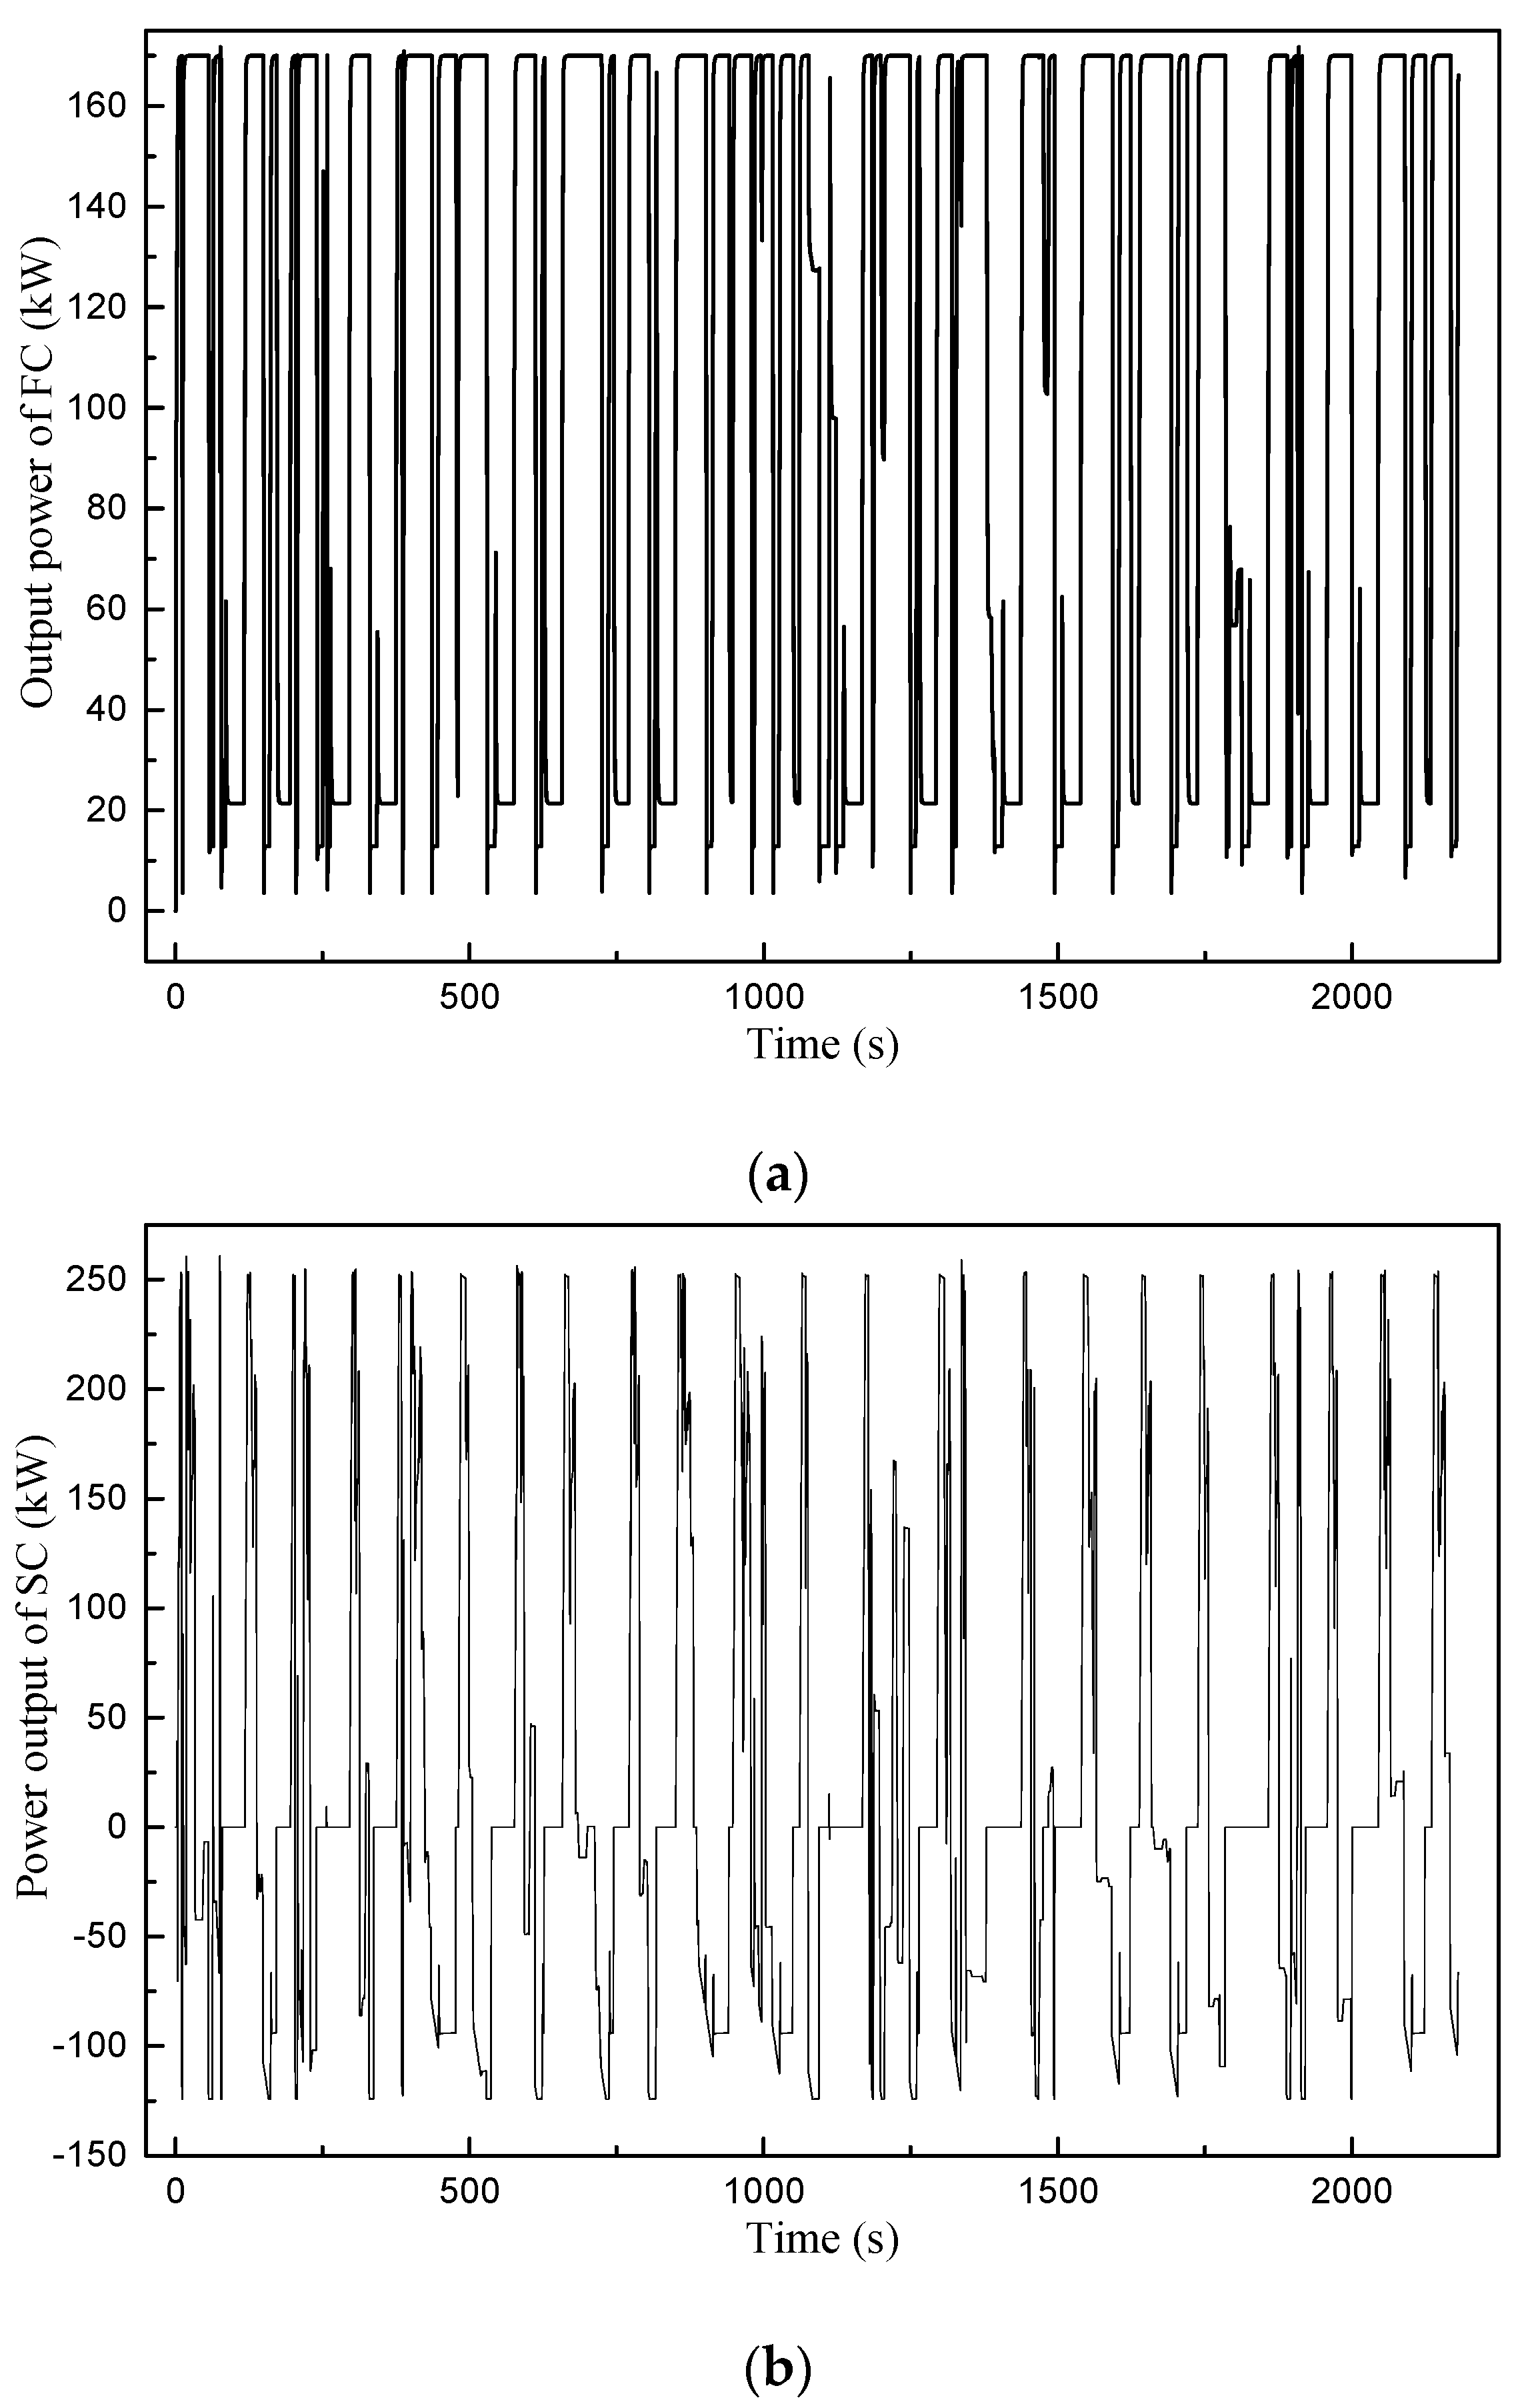
3.2. Simulation Results and Analysis

Considering the previously introduced train parameters, energy storage device configuration, and energy allocation strategy, the circuit simulation was carried out based on the T1 line of Wuhan Guanggu. The T1 line has 23 platforms and 22 main parking spaces, as shown in Table 3. All intersections are considered in the calculation to ensure that the supplied energy storage device is equipped with sufficient energy.
Due to the line speed limitation, the maximum train speed was controlled to be no more than 50 km/h. The initial SOC of the battery is 90%, and the initial voltage of the SC is 510 V. In this report, both the maximum discharge and charge currents of the battery are set as 4C, according to the experimental results. These two parameters were not changed in the optimization process to reduce the variables. The maximum charging power is about one third of the maximum discharge power. In order to speed up the optimization of the genetic algorithm, we assume that the maximum battery absorption power is one third of the maximum output power in the energy distribution strategy.
_ c h _ b t = ( 1 / 3 ) · P _ d i s c h _ b t
In the same way, due to the SC maximum output current being 700 A and the maximum absorption current being 300 A, the energy distribution strategy assumes that the maximum absorption power of the SC is three sevenths of the maximum output power.
P _ c h _ u c = ( 3 / 7 ) · P _ d i s c h _ u c
Figure 8 shows the train position–speed and time–power diagrams. The dashed line represents the expected value, and the solid line represents the actual running curve of the train. It seems that the train can travel at the desired speed and power with the configuration of the FC/battery/SC hybrid power 100% low-floor tramcar.
Figure 9 is the output power curves of FC, SC, and power battery versus time. We can see that the FC is not shut down in the whole working condition, and the maximum output power is 170 kW. In the practical engineering use condition, the fuel cell starts slowly with a slow dynamic response. Since the service life of the FC can be reduced when working in a high frequency start-stop condition, the FC does not shut down when the tramcar operates on certain rail tracks. The output power of the SC fluctuates between −125 kW and 250 kW. This is the result of the maximum charge current of the SC is three parts of the maximum discharge current. Under the existing strategy, the battery has a low utilization rate, which means it neither exports nor absorbs much energy most of the time.
Figure 10 shows the time–power state curve. The solid line is the battery SOC, and the dotted line is the SC SOC. It seems that the SOC of SC varies between 18% and 100%, while the battery SOC is limited by the energy management system (the battery SOC allows a range of 40~90%), and the whole operating process is basically maintained at about 90%.
By calculation, the hydrogen consumption of the train is 3.3469 kg, and the running time is 2178 s.
The simulation results show that:
(1)
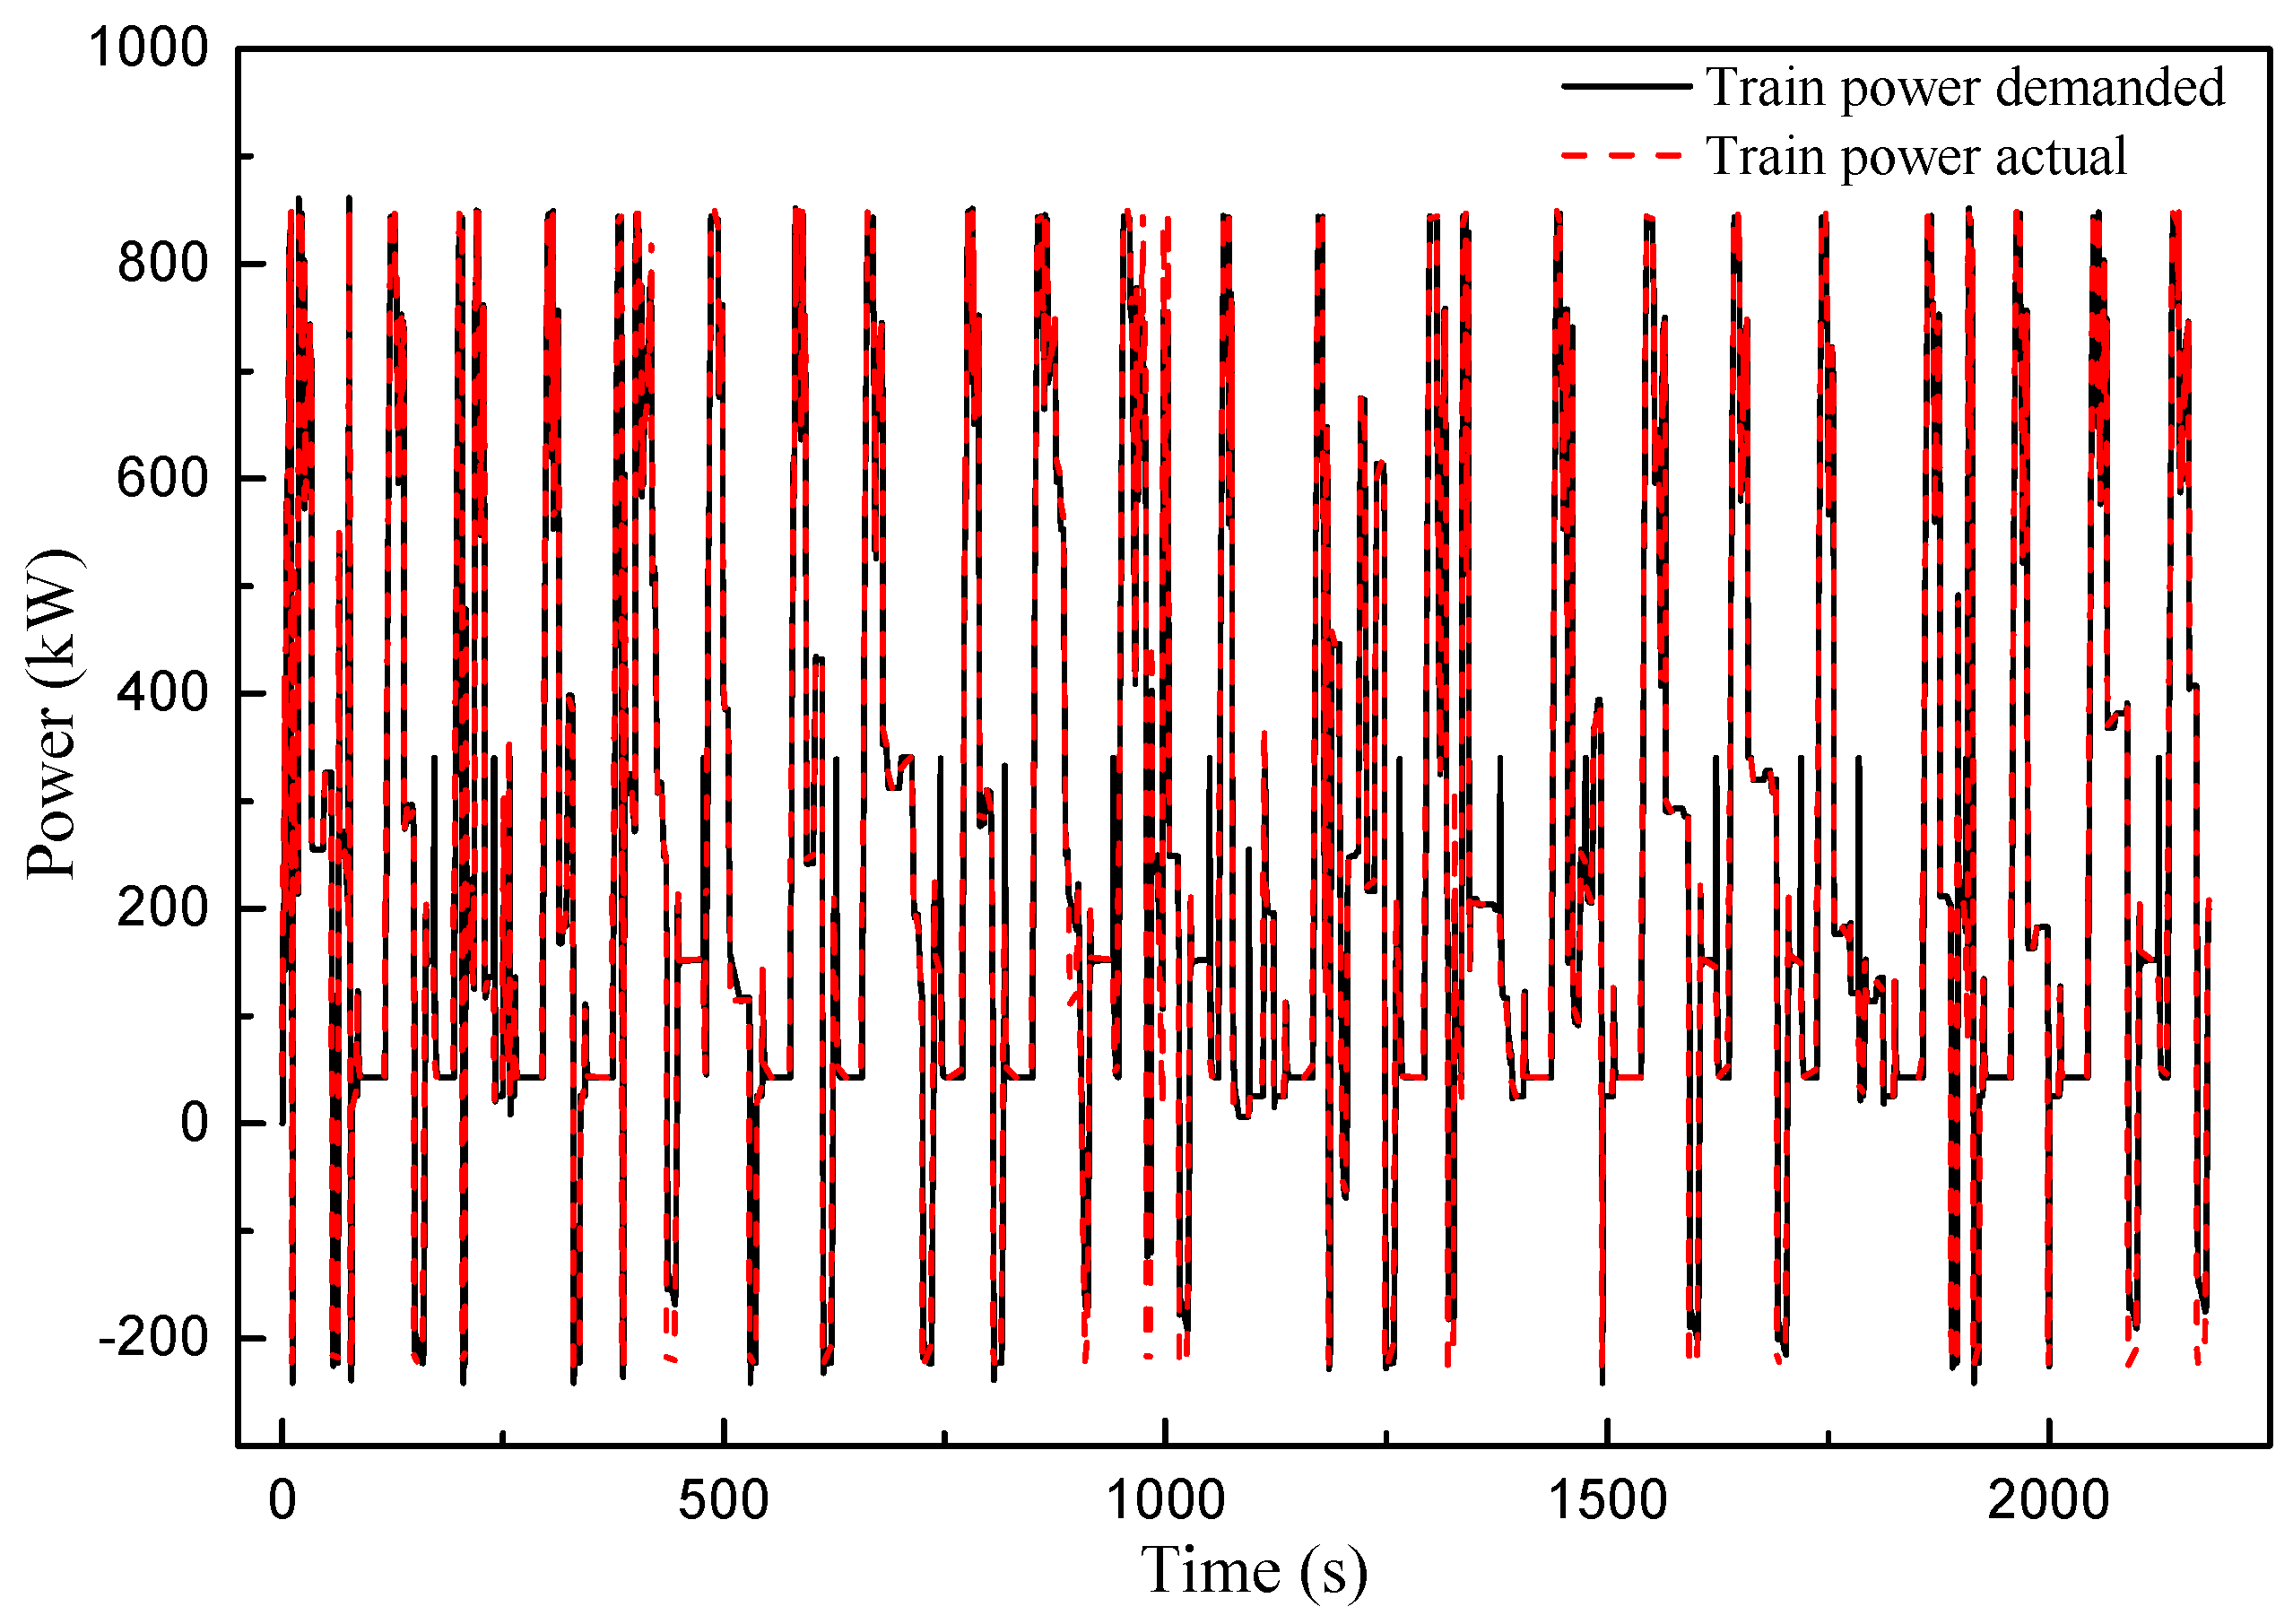
The energy configuration and energy management strategy of the new energy hybrid tramcar can meet the operational requirements of the experimental line;
(2)
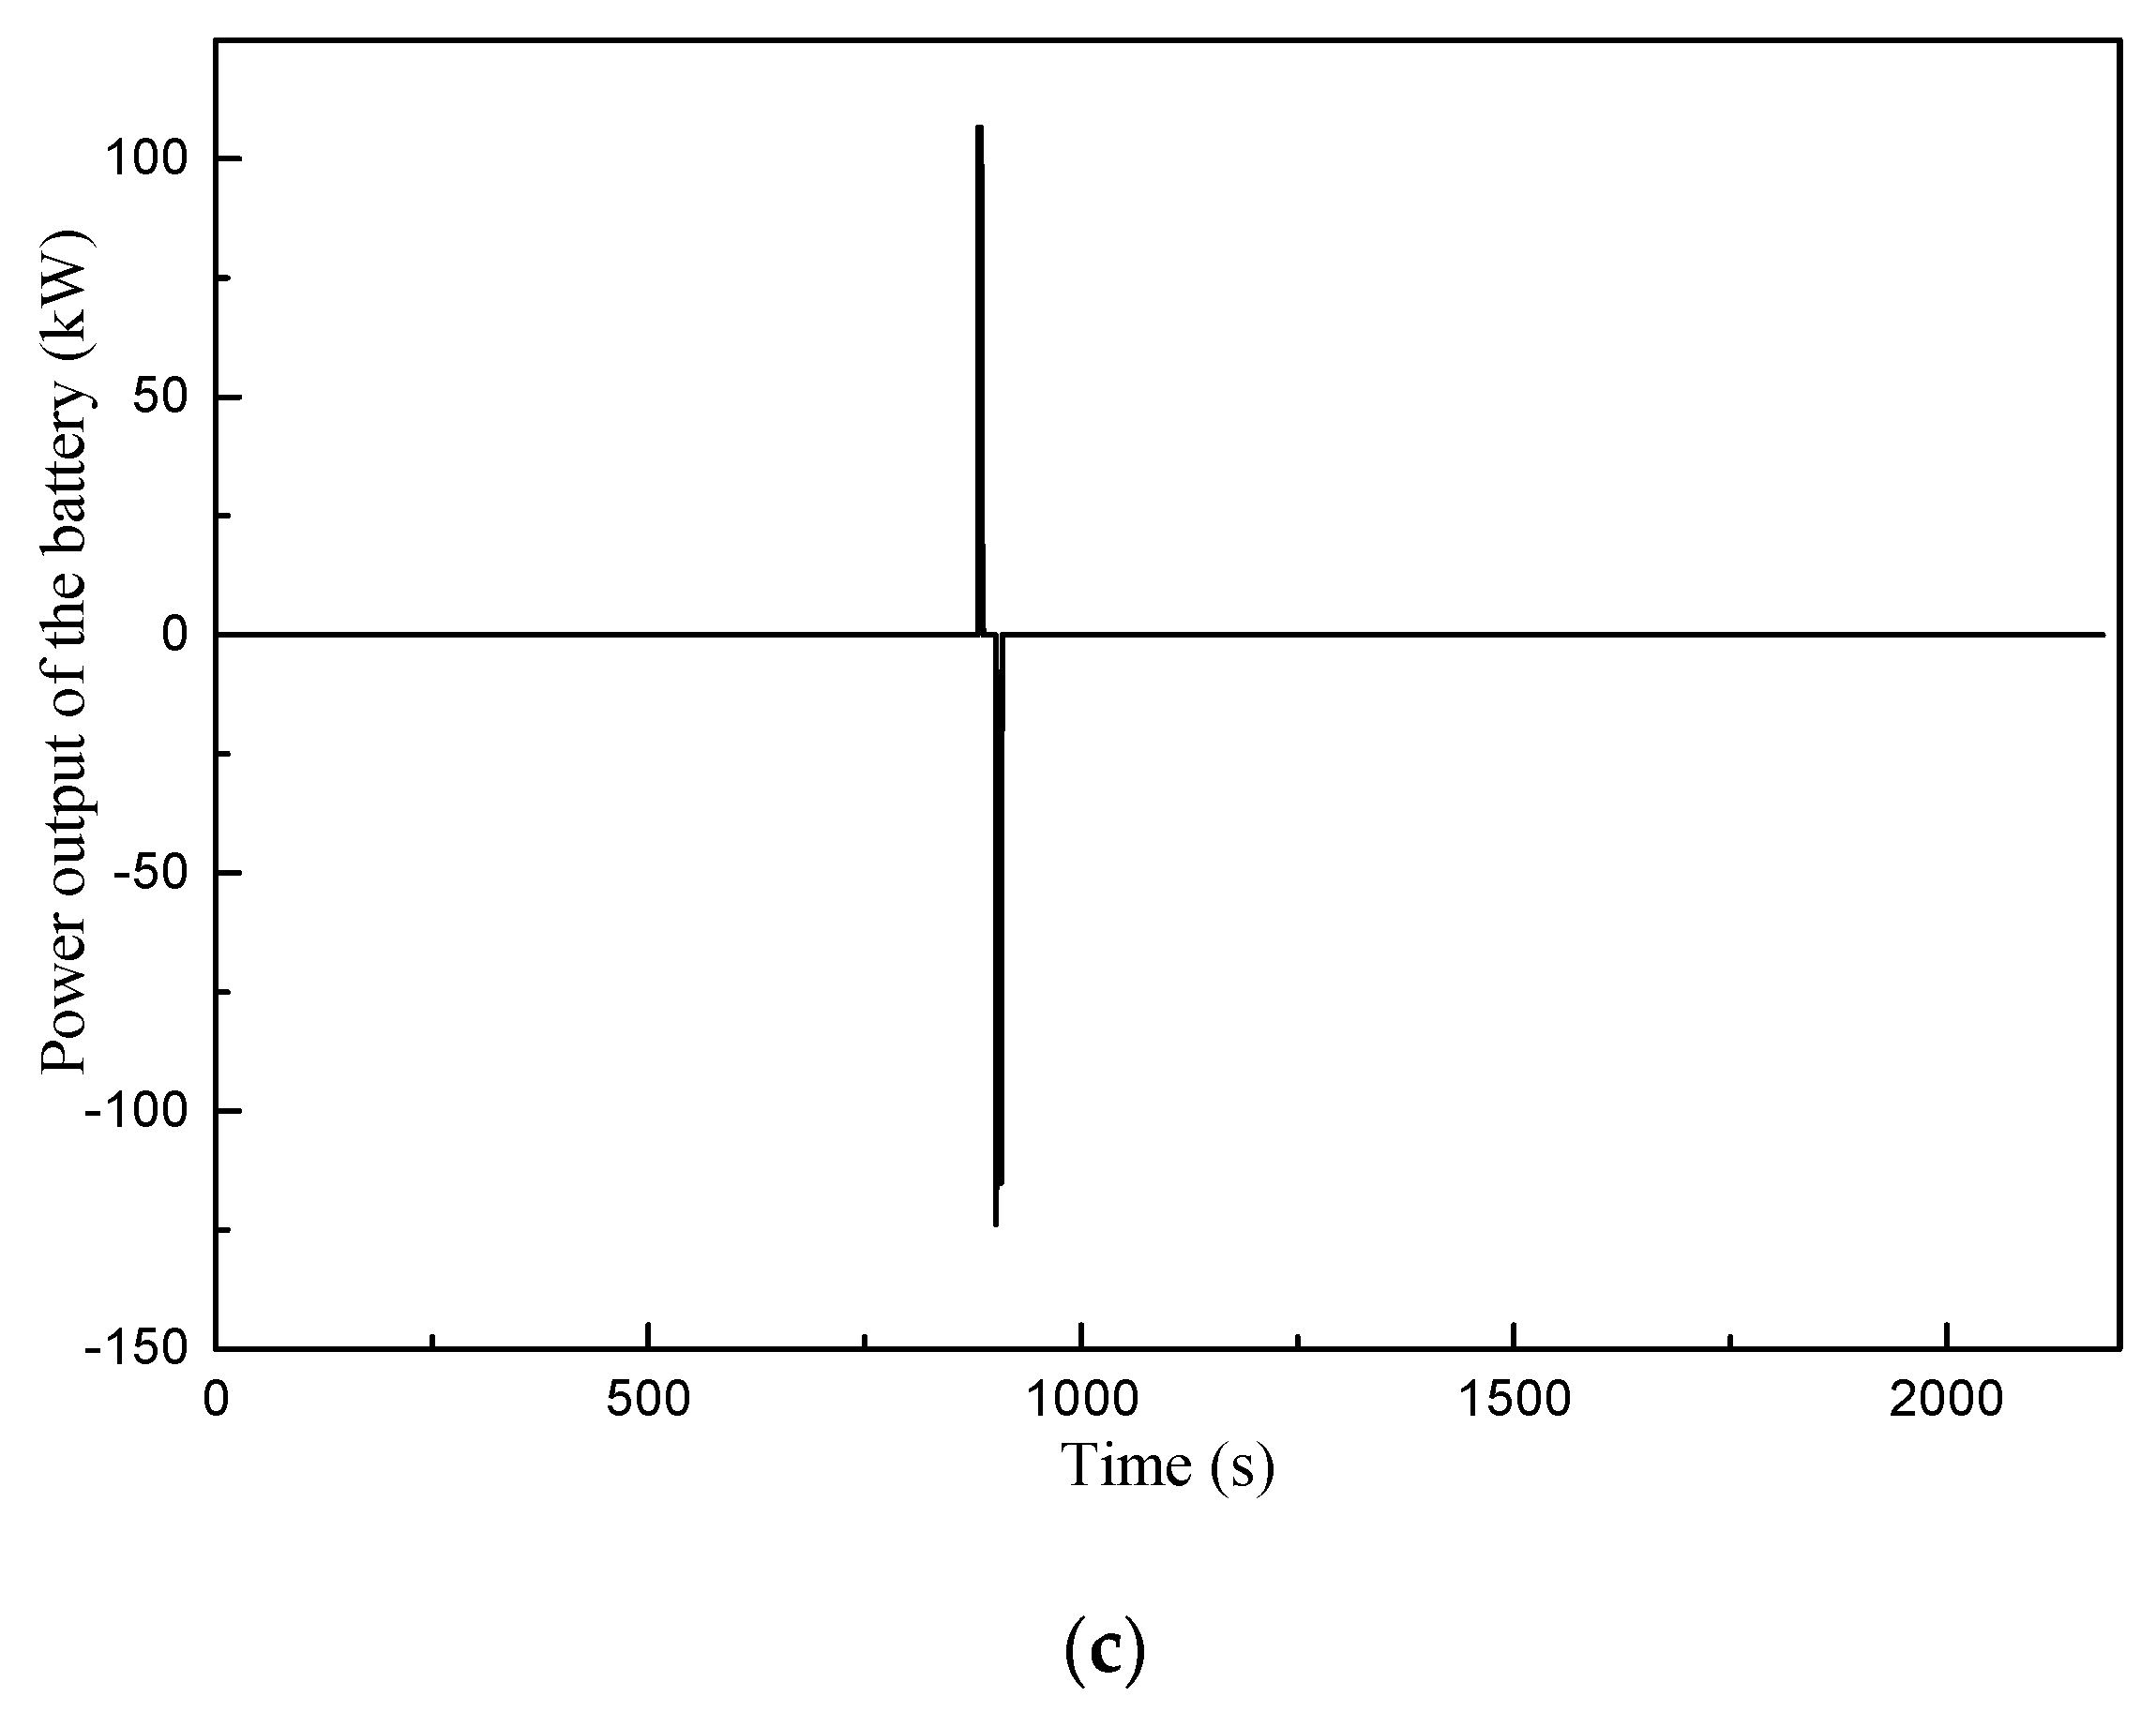
The battery has not been used effectively during the traction stage of the train;
(3)
The regenerative braking energy loss is great in the braking stage.
If the optimization of the train energy management strategy is carried out, it needs to reduce the energy output of FC and SC, improve the utilization of the power battery in the traction stage of the train, and reduce the loss of regenerative braking energy.

4. Optimization of the Energy Management Strategy

4.1. Selection of Optimization Method

At present, energy management strategies based on optimization methods can be divided into two categories. One type is based on static data tables or historical data, a global optimal energy management method for energy optimization control under specific operating conditions. The other type is based on the real-time status of the vehicle or the current parameters of the recurrence control, which can usually guarantee a local or instantaneous optimal energy allocation strategy [25,26].
Since the instantaneous optimal energy allocation strategy is generally aimed at automotive operating conditions, and depending on the operating characteristics of the tram, its operating conditions can be determined. Therefore, the global optimal energy management method is selected here. Based on the energy management strategy of the global optimal, the most representative are the dynamic programming control method [27], Pontryagin minimum method [28], genetic algorithm [29], and other intelligent control methods. Among them, the genetic algorithm pays no attention to the system model. It just needs to determine how the evaluation function can be evolved through optimization. It is also advantageous in providing more convenience in changing the energy allocation strategy in the original tram and it is easy to implement in the project. So, the genetic algorithm was adopted in this report to optimize the energy allocation strategy in the original tramcar [30].

4.2. Optimization of Energy Distribution Strategy Based on Genetic Algorithm

4.2.1. Target Fitness Function

The optimization goal of this study is to reduce the fuel consumption of the fuel cell without reducing the performance of the tram. Therefore, the target fitness value function used to evaluate the tram energy allocation strategy is:
Among them, X is the set of variables related to calculating the fitness value including the tram, and f ( X ) is the fitness value function. S is the search space where X is located. m H 2 ( X ) is the mass of hydrogen consumed by trams after a complete operating condition. m c h g , b a t ( X ) and m c h g , s c ( X ) are the electrical energy consumed by the grid to charge the battery and capacitor to their initial state after a complete operating condition, respectively, and the electrical energy is converted into fuel quality:
m c h g , b a t ( X ) = E c h g , b a t ( S O C i n i t , b a t S O C e n d , b a t ) · η f u e l , e l e ζ d c
m c h g , s c ( X ) = E c h g , s c ( S O C i n i t , s c S O C e n d , s c ) · η f u e l , e l e ζ d c
Among them: ζ d c is the efficiency of the energy passing through the DC/DC converter when the grid is charging the battery and the super capacitor; E c h g , b a t ( ) and E c h g , s c ( ) are the required energy calculation functions (kWh), and are related to the state of the charge of the battery/super capacitor at the beginning and the end of the journey, respectively; S O C i n i t , b a t and S O C e n d , b a t are the battery states at the beginning and the end of the journey, respectively; S O C i n i t , s c and S O C e n d , s c are the SOC of the super capacitor at the beginning and the end of the journey, respectively; η f u e l , e l e is the conversion coefficient of electric energy into fuel quality, which is based on previous research, and according to a more conservative estimation, the lower price of hydrogen fuel is ¥20 per kilogram, and the higher price of industrial electricity is ¥0.9 per kilowatt-hour, so it is converted here. The coefficient is taken as 0.9/20; ζ d c is the efficiency of the DC/DC that the energy passes when charging the battery/super capacitor by grid.
X is subject to the following constraints:
S O C b t _ m i n S O C b t S O C b t _ m a x
S O C u c _ m i n S O C u c S O C u c _ m a x
Among them, S O C b t _ m i n and S O C b t _ m a x are the minimum and maximum values of the allowable range of the battery state, which are taken as 40% and 90% in this study, respectively; and S O C u c _ m i n and S O C u c _ m i n are the minimum and maximum values of the allowable capacitor state, which are taken as 18% and 96% in this study, respectively (100% in simulation).

4.2.2. Process of Energy Allocation Strategy Optimization

According to the description of Section 2.1, the structure of the energy allocation strategy for tram is shown in Figure 11.
From the foregoing, we can see that the optimization object of the genetic algorithm is the power target in the energy allocation strategy: P_disch_fc, P_disch_bt, and P_disch_uc, which represent the maximum output power of the fuel cell, the maximum output power of the power battery, and the maximum output power of the super capacitor. After determining the optimization objectives and the optimization target fitness value function, the genetic algorithm can be optimized for the energy distribution strategy of the tram. The energy allocation strategy genetic algorithm optimization process is shown in Figure 12.

4.3. Simulation Calculation and Analysis of Optimization Strategy

According to the simulation method in Section 3.2, the genetic algorithm optimization simulation of the energy distribution strategy of trams is carried out. In the simulation, the number of individuals for each generation of population is 50, and a total of 100 generations have been evolved. The simulation results are as follows:
P_disch_bt = 91.57 kW; P_disch_uc = 153.74 kW; P_disch_fc = 101.21 kW
Figure 13 shows the evolutionary process diagram of the genetic algorithm simulation. It can be seen that at the 36th generation, the fitness level reached the maximum, which corresponds to the minimum fuel consumption of the tram. From the 36th generation to the 100th generation, the optimal solution of the genetic algorithm remains unchanged, that is, the algorithm converges. In the end, the entire journey fuel consumption is equivalent to 2.8354 kg.
Figure 14 is the FC output power changing with running time. We can see that the train can satisfy the running power requirement.
Figure 15 is the power output characteristics of each energy storage system after optimization. We can see that the FC is not shut down in the whole working condition, and the maximum output power is 101.21 kW. The output power of the SC fluctuates between −125 kw and 250 kW. This is because the maximum charge current of the SC is three sevenths of the maximum discharge current. As for the battery, the utilization ratio is improved efficiently by exporting and absorbing more energy, which is the main reason for using the optimized energy management strategy to reduce the fuel consumption.
Figure 16 shows the tram running time-power status curve. It can be seen that the SOC of the super capacitor changes from 18% to 100%, and the SOC of the power battery drops significantly. This further proves that the optimized power distribution strategy has improved the utilization rate of power batteries. It should be noted that this figure only shows the status information of the battery and the super capacitor during the running of the tram, and does not record the process of charging the battery and capacitor to the initial state after the tram arrives at the station. This charging process has been considered in the optimization process.

5. Conclusions

(1)
A simulation model was built based on the FC/battery/SC hybrid 100% low-floor tramcar, which can be used to predict the performance and fuel consumption of the new energy hybrid system.
(2)
Under the original energy management strategy, the fuel consumption of the energy storage system is relatively high with a low capacity utilization ratio. The FC module never stops during the whole process, with a maximum output power of 170 kW. The power range of the super capacitor is −125 kW to 250 kW, which is the result of the charge current being three-sevenths of the discharge current. The battery was not used efficiently for its tiny exporting and absorbent energy. The equivalent energy consumption is 3.3469 kg for the whole line simulation.
(3)
The genetic algorithm can be used to realize the optimization solution of the energy management strategy. The optimal objects are set as the maximum output power of the FC P_disch_fc, battery P_disch_bt, and SC P_disch_uc. The maximum fitness value corresponding to the minimum fuel consumption and the algorithm converged when the optimal solution remained unchanged.
(4)
The optimized energy management strategy can improve the economic efficiency of the new energy hybrid tramcar. The maximum output power of the FC dropped to 101.2 kW and never stopped during the whole running process. The SC module is reduced from 3-in parallel to 2-in parallel, and its output power drops to −67 kW to 153 kW. As for the battery, the use ratio is improved greatly by exporting and absorbing more energy. The equivalent energy consumption is 2.8354 kg for the whole line simulation, which is a reduction of 15% compared to the original strategy.

Author Contributions

M.L. (Minggao Li) and M.L. (Ming Li) conceived and designed the prototype of the hybrid tramcar. G.H. and N.L. performed the simulation. Q.Z. and Y.W. analyzed the data.

Funding

This research received no external funding.

Conflicts of Interest

The authors declare no conflict of interest.

Abbreviations

FCFuel Cell
SCSuper Capacitor
HCHydrocarbon
PMParticular matter
ECMSEquivalent Consumption Minimization Strategy
SOCState of Charge
ESSElectronic Switching System
ADVISORAdvanced Vehicle Simulator
PEMFCProton Exchange Membrane Fuel Cell
KVLKirchhoff’ s Voltage Law

References

  1. Liu, Z.N. Design of Energy-Saving Oriented Case Database Construction of Metro Diagram. Ph.D. Thesis, Nanjing University of Science and Technology, Nanjing, China, 2016. [Google Scholar]
  2. Kong, L.Y.; Liang, Q.H.; Zhang, Y. Study on traction energy consumption of linear induction motor rail transit system. J. China Railw. Soc. 2007, 29, 106–112. [Google Scholar]
  3. Feng, L. Analysis on optimization design and thermodynamic performance of solar aided power Generation System. Ph.D. Thesis, North China Electric Power University, Beijing, China, 2016. [Google Scholar]
  4. Wang, Z.; Zhu, Y.; Zhu, Y.; Shi, Y. Energy structure change and carbon emission trends in China. Energy 2016, 115, 369–377. [Google Scholar] [CrossRef]
  5. Chen, W.; Ma, T.C. Patent information analysis on circulating fluidized bed. Sci. Technol. Manag. Res. 2015, 329, 146–151. [Google Scholar]
  6. Madrazo, J.; Clappier, A. Low-cost methodology to estimate vehicle emission factors. Atmos. Pollut. Res. 2017, 9, 323–332. [Google Scholar] [CrossRef]
  7. Ferrero, E.; Alessandrini, S.; Balanzino, A. Impact of the electric vehicles on the air pollution from a highway. Appl. Energy 2016, 169, 450–459. [Google Scholar] [CrossRef]
  8. Weerakkody, U.; Dover, J.W.; Mitchell, P.; Reiling, K. Particulate matter pollution capture by leaves of seventeen living wall species with special reference to rail-traffic at a metropolitan station. Urban For. Urban Green. 2017, 27, 173–186. [Google Scholar] [CrossRef]
  9. Molavian, M.R.; Abdolmaleki, A.; Gharibi, H.; Tadavani, K.F.; Zhiani, M. Two highly strong semi-IPNs for proton exchange membrane fuel cell (PEMFC) application. Mater. Today Commun. 2018, 15, 94–99. [Google Scholar] [CrossRef]
  10. Devi, A.U.; Divya, K.; Kaleekkal, N.J.; Rana, D.; Nagendran, A. Tailored SPVdF-co-HFP/SGO nanocomposite proton exchange membranes for direct methanol fuel cells. Polymer 2018, 140, 22–32. [Google Scholar] [CrossRef]
  11. Wang, J.; Gong, C.; Wen, S.; Liu, H.; Qin, C.; Xiong, C.; Dong, L. Proton exchange membrane based on chitosan and solvent-free carbon nanotube fluids for fuel cells applications. Carbohydr. Polym. 2018, 186, 200–207. [Google Scholar] [CrossRef] [PubMed]
  12. Gheorghita, A.; Mihai, L.; Magda, F. Optimization of the proton exchange membrane fuel cell hybrid power system for residential buildings. Energy Convers. Manag. 2018, 163, 22–37. [Google Scholar]
  13. Ziemann, S.; Müller, D.B.; Schebek, L.; Weil, M. Modeling the potential impact of lithium recycling from EV batteries on lithium demand: A dynamic MFA approach. Resour. Conserv. Recycl. 2018, 133, 76–85. [Google Scholar] [CrossRef]
  14. Ogura, K. 5-Next-generation battery-driven light rail vehicles and trains. Electr. Veh. Prospect. Chall. 2017, 169–206. [Google Scholar] [CrossRef]
  15. Xu, X.; Nan, J.; Wang, J.; Gao, Z. Estimate of Super Capacitor’s Dynamic Capacity. Energy Procedia 2017, 105, 2194–2200. [Google Scholar] [CrossRef]
  16. Capasso, C.; Veneri, O. Integration between Super-capacitors and ZEBRA Batteries as High Performance Hybrid Storage System for Electric Vehicles. Energy Procedia 2017, 105, 2539–2544. [Google Scholar] [CrossRef]
  17. Li, Q.; Wang, T.; Dai, C.; Chen, W.; Ma, L. Power Management Strategy based on Adaptive Droop Control for a Fuel Cell-Battery-Supercapacitor Hybrid Tramway. IEEE Trans. Veh. Technol. 2017. [Google Scholar] [CrossRef]
  18. Han, Y.; Li, Q.; Wang, T.; Chen, W.; Ma, L. Multi-source Coordination Energy Management Strategy based on SOC consensus for a PEMFC-Battery-Supercapacitor Hybrid Tramway. IEEE Trans. Veh. Technol. 2017, 67, 296–305. [Google Scholar] [CrossRef]
  19. Zhang, G.; Chen, W.; Li, Q. Modeling optimization and control of a FC/battery hybrid locomotive based on ADVISOR. Int. J. Hydrog. Energy 2017, 42, 18568–18583. [Google Scholar] [CrossRef]
  20. Wang, Y.X.; Kai, O.; Kim, Y.B. Modeling and experimental validation of hybrid proton exchange membrane fuel cell/battery system for power management control. Int. J. Hydrog. Energy 2015, 40, 11713–11721. [Google Scholar] [CrossRef]
  21. Li, Q.; Chen, W.; Liu, Z.; Li, M.; Ma, L. Development of energy management system based on a power sharing strategy for a fuel cell-battery-supercapacitor hybrid tramway. J. Power Sources 2015, 279, 267–280. [Google Scholar] [CrossRef]
  22. El Fadil, H.; Giri, F.; Guerrero, J.M.; Tahri, A. Modeling and nonlinear control of a fuel cell/Supercapacitor hybrid energy storage system for electric vehicles. IEEE Trans. Veh. Technol. 2014, 63, 3011–3018. [Google Scholar] [CrossRef]
  23. Wu, C.; Chen, J.; Xu, C.; Liu, Z. Real-time Adaptive Control of a Fuel Cell-Battery Hybrid Power System with Guaranteed Stability. IEEE Trans. Control Syst. Technol. 2016, 25, 1394–1405. [Google Scholar] [CrossRef]
  24. Li, Q.; Yang, H.; Han, Y.; Li, M.; Chen, W. A state machine strategy based on droop control for an energy management system of PEMFC-battery-supercapacitor hybrid tramway. Int. J. Hydrog. Energy 2016, 41, 16148–16159. [Google Scholar] [CrossRef]
  25. Zhou, D.; Ravey, A.; Al-Durra, A.; Gao, F. A comparative study of extremum seeking methods applied to online energy management strategy of fuel cell hybrid electric vehicles. Energy Convers. Manag. 2017, 151, 778–790. [Google Scholar] [CrossRef]
  26. Tian, H.; Li, S.E.; Wang, X.; Huang, Y.; Tian, G. Data-driven hierarchical control for online energy management of plug-in hybrid electric city bus. Energy 2018, 142, 55–67. [Google Scholar] [CrossRef]
  27. Duchaud, J.L.; Notton, G.; Darras, C.; Voyant, C. Power ramp-rate control algorithm with optimal State of Charge reference via Dynamic Programming. Energy 2018, 149, 709–717. [Google Scholar] [CrossRef]
  28. Aydin, E.; Bonvin, D.; Kai, S. Dynamic optimization of constrained semi-batch processes using Pontryagin’s minimum principle—An effective quasi-Newton approach. Comput. Chem. Eng. 2017, 99, 135–144. [Google Scholar] [CrossRef] [Green Version]
  29. Dong, H.; Li, T.; Ding, R.; Sun, J. A Novel Hybrid Genetic Algorithm with Granular Information for Feature Selection and Optimization. Appl. Soft Comput. 2018, 65, 33–46. [Google Scholar] [CrossRef]
  30. Wieczorek, M.; Lewandowski, M. A mathematical representation of an energy management strategy for hybrid energy storage system in electric vehicle and real time optimization using a genetic algorithm. Appl. Energy 2017, 192, 222–233. [Google Scholar] [CrossRef]
Figure 1. Structure of the numerical model.
Applsci 08 01144 g001
Figure 2. Calculation model for the auxiliary system.
Applsci 08 01144 g002
Figure 3. Structure of the power bus module.
Applsci 08 01144 g003
Figure 4. Structure of the train module.
Applsci 08 01144 g004
Figure 5. The equivalent circuit model of fuel cell (FC).
Applsci 08 01144 g005
Figure 6. Equivalent circuit model of the battery.
Applsci 08 01144 g006
Figure 7. Equivalent circuit of the super capacitor (SC).
Applsci 08 01144 g007
Figure 8. Comparation of the expected and simulated values. (a) Position–Speed; (b) Time–Power.
Applsci 08 01144 g008
Figure 9. The output power characteristics of each module of the energy storage system. (a) Train running time–FC output power; (b) Train running time–SC output power; (c) Train running time–Battery output power.
Applsci 08 01144 g009aApplsci 08 01144 g009b
Figure 10. Power state changing with train running time.
Applsci 08 01144 g010
Figure 11. Structure of the tramcar energy management strategy.
Applsci 08 01144 g011
Figure 12. Optimization of the energy management strategy using a genetic algorithm.
Applsci 08 01144 g012
Figure 13. The evolutionary process.
Applsci 08 01144 g013
Figure 14. The FC output power changing with train running time.
Applsci 08 01144 g014
Figure 15. The output power characteristics of each module after optimization. (a) Train running time–FC output power; (b) Train running time–SC output power; (c) Train running time–Battery output power.
Applsci 08 01144 g015
Figure 16. The power state changing with train running time.
Applsci 08 01144 g016
Table 1. Main parameters of the tramcar.
ParametersValues
Weight/t63 (Motor car 22.4, Trailer car 18.2)
Transmission ratio6.28
Inertia mass coefficientMotor car 0.1, Trailer car 0.05
Drag coefficient A3.06743
Drag coefficient B0.02686
Drag coefficient C0.00158
Maximum operating speed/km·h−160
Maximum acceleration/m·s−21.2
Table 2. Configuration of a single power source.
Fuel Cell
Rated efficiency/%50
Minimum voltage/V440
Maximum output power/kW170
Super Capacitor
Nominal voltage/V528
Rated capacity/F45
Maximum discharge current/A700
Maximum charging current/A300
End-off-discharge voltage/V220
End-off-charge voltage/V510
Battery
Nominal voltage/V331
Rated capacity/Ah20
Discharge Rate/C4
Maximum charging current/A120
end-off discharge SOC/%40
end-off charge SOC/%90
Table 3. Station and intersections data information of T1.
Station NumberPosition (m)Platform Length (m)Stopping Time (s)
1164640
2300030
38056430
412316430
51295030
61715030
72070030
817966430
922496430
102320030
112768030
1229486430
133438030
1436386430
153910030
1641106430
174853030
1850536430
195315030
2055156430
2162176430
2270146430
2378706430
2489666430
259316030
2610,100030
2710,2156430
2810,500030
2910,820030
3010,9706430
3111,230030
3211,580030
3311,6876430
3412,274030
3512,4246430
3612,650030
3713,440030
3813,4506430
3913,857030
4014,0676430
4114,6286430
4215,026030
4315,2266430
4415,6586430

