Smart System for the Optimization of Logistics Performance of the Pruning Biomass Value Chain


1
Department of Energy and Technology, Swedish university of agricultural sciences, P.O. Box 75651 Uppsala, Sweden
2
Mobitron AB, P.O. Box 56146 Huskvarna, Sweden
3
Research Centre for Energy Resources and Consumption-CIRCE, Mariano Esquillor Gomez, 15 50018 Zaragoza, Spain
*
Author to whom correspondence should be addressed.
Appl. Sci. 2018, 8(7), 1162; https://doi.org/10.3390/app8071162
Submission received: 19 June 2018
/
Revised: 10 July 2018
/
Accepted: 10 July 2018
/
Published: 18 July 2018
(This article belongs to the Special Issue Sustainable Energy Systems Planning, Integration and Management)
Abstract
:Featured Application
The specific application of this work is that it improves management of solid biofuel supply chain. Its potential application is for integrated product distribution management where product quality control and traceability can be integrated to increase customer satisfaction and resource utilization, and reduce logistics cost as well as environmental impact.
Abstract
Agricultural pruning biomass is one of the important resources in Europe for generating renewable energy. However, utilization of the agricultural residues requires development of efficient and effective logistics systems. The objective of this study was to develop smart logistics system (SLS) appropriate for the management of the pruning biomass supply chain. The paper describes the users’ requirement of SLS, defines the technical and functional requirements and specifications for the development of SLS, and determines relevant information/data to be documented and managed by the SLS. This SLS has four major components: (a) Smart box, a sensor unit that enables measurement of data such as relative humidity, temperature, geographic positions; (b) On-board control unit, a unit that performs route planning and monitors the recordings by the smart box; (c) Information platform, a centralized platform for data storing and sharing, and management of pruning supply chain and traceability; and (d) Central control unit, an interface linking the Information platform and On-board control unit that serves as a point of administration for the whole pruning biomass supply chain from harvesting to end user. The SLS enables the improvement of performance of pruning biomass supply chain management and product traceability leading to a reduction of product loss, increased coordination of resources utilisation and quality of solid biofuel supply, increased pruning marketing opportunity, and reduction of logistics cost. This SLS was designed for pruning biomass, but could also be adapted for any type of biomass-to-energy initiatives.
1. Introduction
Biomass is an important source of renewable energy sources. Biomass comprises among others, vegetation, energy crops, biosolids, forestry and agricultural residues, organic municipal waste, as well as some industrial waste [1]. Agricultural residues from the pruning operations of fruit plantations can be used as a renewable energy source. However, such utilization of pruning residues has been limited due to logistic-related constraints in harvesting, processing and transporting activities [2,3,4]. Although there is a potential source of renewable energy from agricultural pruning residues, the challenges and opportunities of the logistics operations have not been assessed well considering the entire chains from pruning harvesting to transport to end users.
It is therefore important to develop new improved logistics for pruning residues, which covers harvesting, transport and storage for agricultural pruning (fruit tree, vineyards and olive groove prunings and branches from up-rooted trees). This study aims to develop an integrated concept where location and quality allow a wise decision tool to support decisions for logistic operators. This paper describes the users’ need for a smart logistics system (SLS), defines the components of SLS with technical and functional requirements and specifications, and determines relevant information/data to be documented and managed by the SLS.
1.1. Telematics Information System
Telematics is modern technology of receiving, storing, and sending of information in a wireless form. In a broad sense, it means, the use of informatics and telecommunication in an integrated form. In a telematics system, technologies such as the Global Positioning System (GPS), General Packet Radio Service (GPRS), and GSM (Global System for Mobile Communications) are used. GPS is a space-based global navigation satellite system (GNSS) that provides reliable location and time information in all weather and at all times unless the receiver is underground or in unobstructed line of sight to four or more GPS satellites. The GPRS is a packet-oriented mobile data service on the 2G and 3G cellular communication systems. The GSM, originally from Groupe Spécial Mobile, is the world’s most popular standard for mobile telephony systems.
According to the European Telecommunication Standards Institute (ETSI), GSM was originally designed to operate in the 900 MHz band and gradually adapted for operation in bands up to 1900 MHz [5]. GPRS was commercially introduced first in early 2000s. It is enabler for always-on data connection with essential applications for web browsing and offers faster data rates than GSM i.e., up to 171 kbit/s, theoretically [6].
Telematics can be used for providing real-time information in fleet management, vehicle tracking, and monitoring freight and driver data. Mobile telematics are emerging as new models connecting smartphones to a car’s computer system and exchange data using the wireless network. In logistics companies, systems developed to improve fleet management mainly apply GPS and GSM.
Telematics refers to the combination of telecommunication and informatics and it is of key importance in an intelligent transport system (ITS) [7]. Telematics can be expressed as “the use of wireless devices and “black box” technologies to transmit data in real time back to an organization” [8]. Mobile telematics are emerging as new models connecting smartphones to a car’s computer system and exchange data using the wireless network. In logistics companies, systems developed to improve fleet management mainly apply GPS and GSM to retrieve real-time information.
The management of goods during transport requires tracking (ability to locate goods at any time), tracing (ability to know the product movement from source to end user), and monitoring (ability to know and control product quality status during transportation) information and its analysis. This management approach is relevant for agricultural goods and it can be performed based on technologies such as wireless sensors for climatic conditions (such as temperature and humidity) which can be installed in a truck trailer [7]. Oliveria et al. [9] proposed a logistics management system for cargo transport based on geofencing algorithms and radio-frequency technology, in order to improve services, reduce costs and ensure the safety in cargo transportation. Xiao et al. [10] used a wireless sensor network to monitor temperature and relative humidity in order to improve cold chain logistics for table grapes and increase traceability and product quality information.
Some of the important communication technologies applicable in goods transport systems and implemented in the current SLS include QR codes, Bluetooth wireless communications devices, GPS and GPRS/GSM receivers. A QR Code is a matrix symbology where the symbols consist of an array of square modules arranged in a square pattern [11]. Bluetooth is a technology for wireless communication between different components. In the current Smart system, Bluetooth is used for communication between the Smart box code and scanner for reading the QR code, and IR (infrared) communication is used for communication between a PC and the Smart box. IR communication is used to load the required parameters, start data collection period, and download data from the Smart box.
1.2. Electron Trade and Its Advantages
In any trading system, market participants interact in various ways [12]. Historically, this interaction has been based on face-to-face communication. Modern electronic communication networks (ECNs) could eliminate the face-to-face communication at physical locations. This could increase competition and reduce transaction costs [13]. Referring to United States Securities and Exchange Commission, Hendershott [13] defined ENCs as “electronic trading systems that automatically match with sell orders at specified prices”. ENCs bypass human intermediaries (e.g., dealers) and offer faster trade execution.
The Committee on the Global Financial System (CGFS) broadly defined [12] the electronic trading system (ETS) as “a facility that provides some or all of the following services: electronic order routing (the delivery of orders from users to the execution system), automated trade execution (the transformation of orders into trades) and electronic dissemination of pre-trade (bid/offer quotes and depth) and post-trade information (transaction price and volume data)”. In ETS, the trading processes and trading relationship are automated using computers. ETS differs from traditional trading systems in many ways [12]:
- ➣
- it is location-neutral and allows continuous multilateral interaction;
- ➣
- it can be scaled up to handle more trades by increasing the computer network capacity;
- ➣
- it integrates the different parts of the trading process from start to end.
The trading system can be structured as decentralized markets (relies largely on bilateral interaction of market participants) or centralized markets (participants interaction is fully multilateral). Multilateral interaction is realized when trading activities are pooled on a single platform.
1.3. Basic Concept of Web-Based Information Platform
The motivations why enterprises invest in information systems include cutting cost, increasing productivity (without increasing cost) and increasing product and/or service quality [14]. Although information systems are introduced with sizable investment costs, they may be underutilized or abandoned unless accepted by intended users [14,15]. The usage of information systems depend on the perceived usefulness and how user friendly the systems are. Perceived usefulness may include improvement of work quality, working time, work performance and control over the work. Similarly, the perceived ease of use of information system can be conceived if it is easy to operate, enables users to do what they want to do, and if it is flexible and requires less mental effort to interact with it [14]. In the SLS to be developed, a web-based Information platform should be user friendly and have the perceived usefulness described above.
The Information platform, as part of this new SLS, has integrated the QR code generation and printing options to enhance a continuous flow of information associated with the pruning biomass to be traded using the SLS. According to ISO/IEC 18004:2015 [11], there are four technically different, but closely related QR Codes: QR Code Model 1 (with a capacity to store up to 1167 numerals), QR Code Model 2 (an enhanced form of model 1 with a capacity to store up to 7089 numerals and used as the basis of the first edition of ISO/IEC 18004), QR Code (closely similar to QR Code Model 2 with additional facility for a mirror image oriented appearance of symbols and this code was used as basis of the second edition of ISO/IEC 18004:2006), and Micro QR Code format (a variant of QR Code which enables a small to moderate amount of data to be represented by a small symbol) [11,16].
2. Biomass Supply Chain and Its Actors
2.1. Biomass Supply Chain
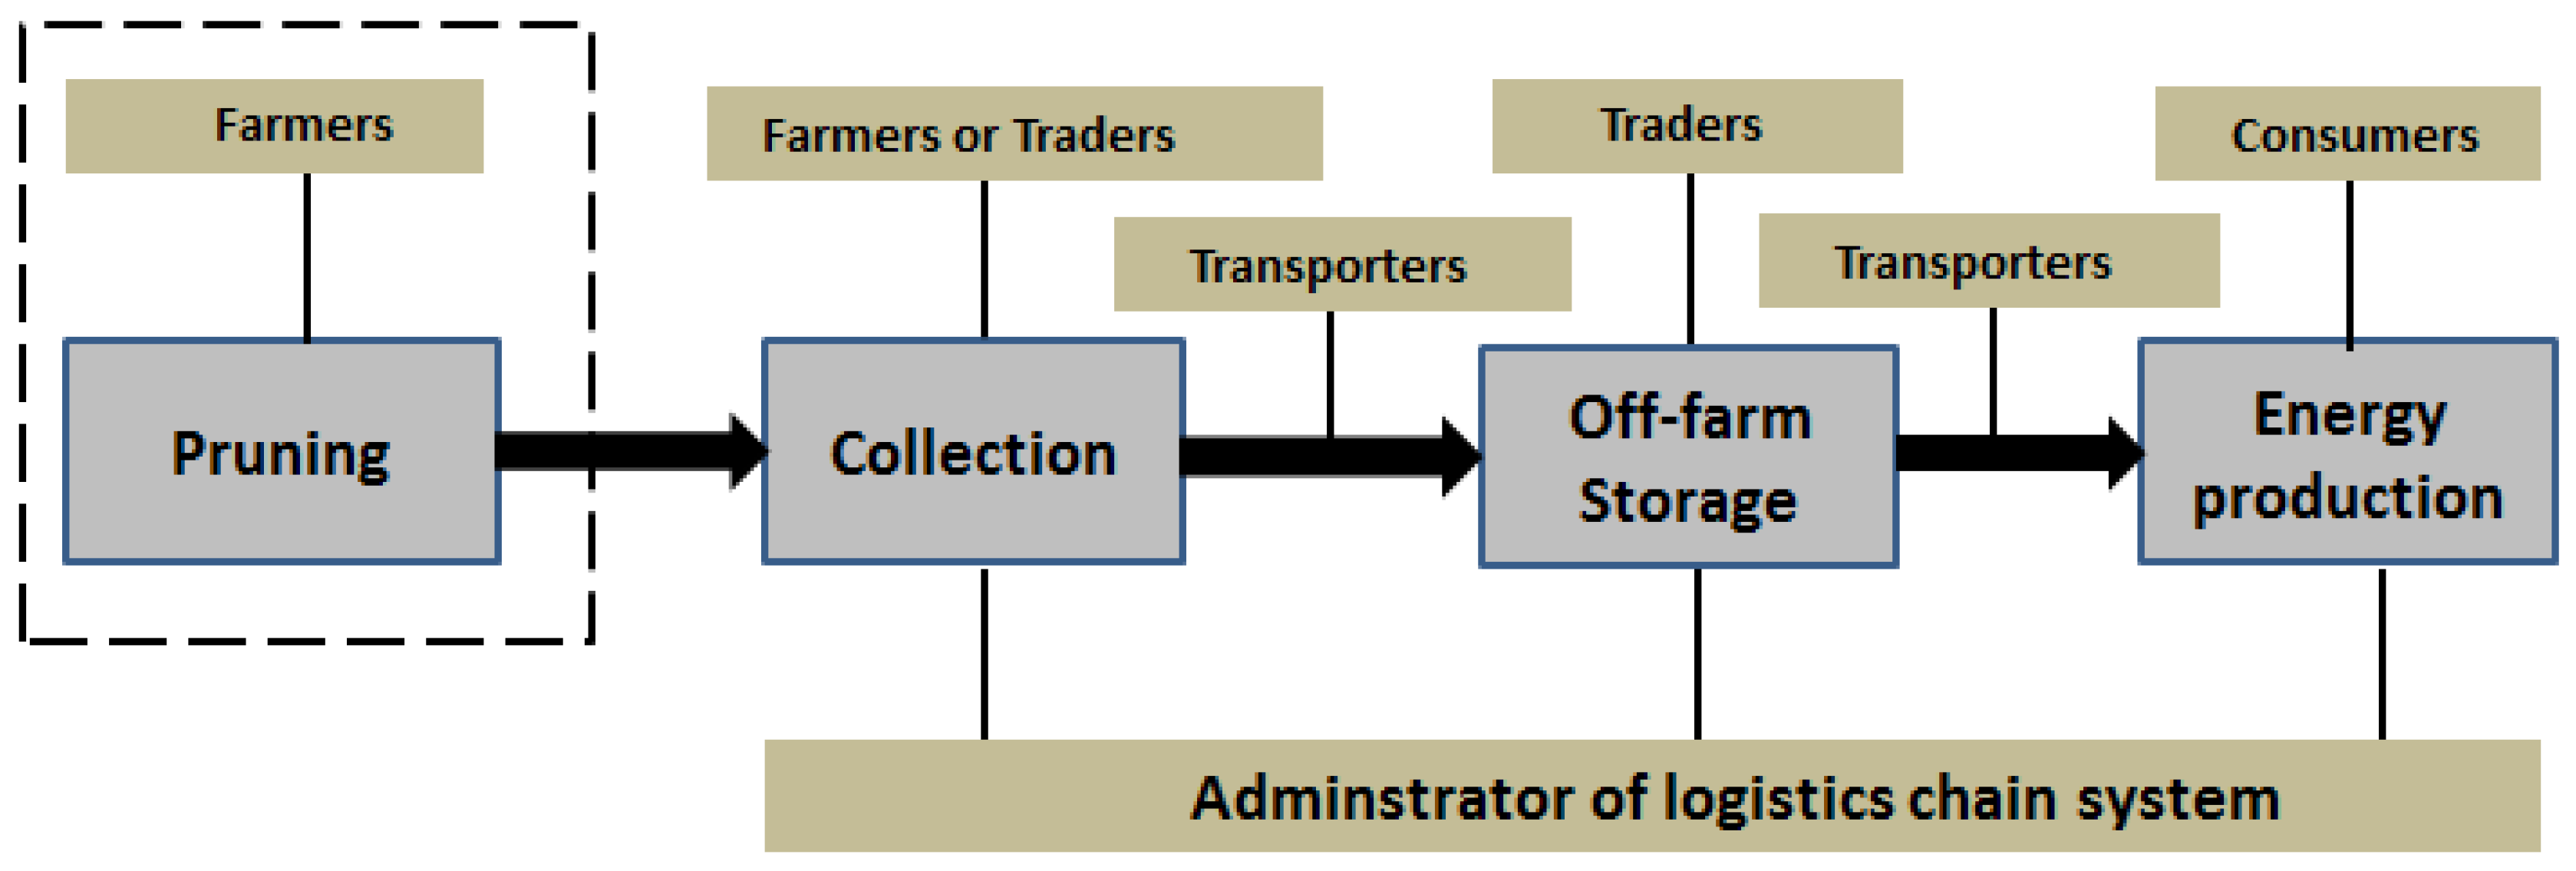
Sources of pruning wood could be different from fruit trees, for example Almond, Fruit, Vineyard, And Olive, Apple and Cherry prunings. As indicated in Figure 1, the chain includes pruning, collection, off-farm storage and energy production. Pruning activities are carried out mainly manually by farmers. Appropriate machinery can be used to collect (harvest) the pruning and bale or chip it as required based on biomass quality requirements by energy plants (end users). In order to monitor the quality characteristics of pruning (bales and chips) as it moves from farm to end users (see Figure 1), the SLS should create an application platform where different actors in the supply chain can interact.
2.2. Actors in the Pruning Biomass Supply Chain and Their Role in the Smart System
For the pruning supply chain, four actors of the biomass supply chain were considered:
Producers: Farmers are primary producers of biomass. They produce, harvest, process (chipping, baling) and sell biomass. An account for access to the Information platform could be created for each farmer participating in the system, so that they can put all the necessary information regarding their products.
Traders: The biomass traders buy, store, and sell the biomass. Therefore, traders who own storage and fulfil quality control criteria could be registered and get an ID number from system to gain access to the platform for information sharing.
Transporters: Biomass transporters or logistics operators are those who handle biomass procurement, source identification, and a proper way of delivering to end users with the desired characteristics. These logistics operators can play complex roles by interacting with different actors.
Consumers: Consumers are end-users who can order biomass product needed. They can have their own account to access the Information platform perform online order and receive information. They specify the quality and quantity of biomass required at power plant. They also determine and control the state of deliveries. Consumers can also follow information flow continuity regarding their orders and deliveries.
3. Components of Smart Logistics System (SLS) Prototype
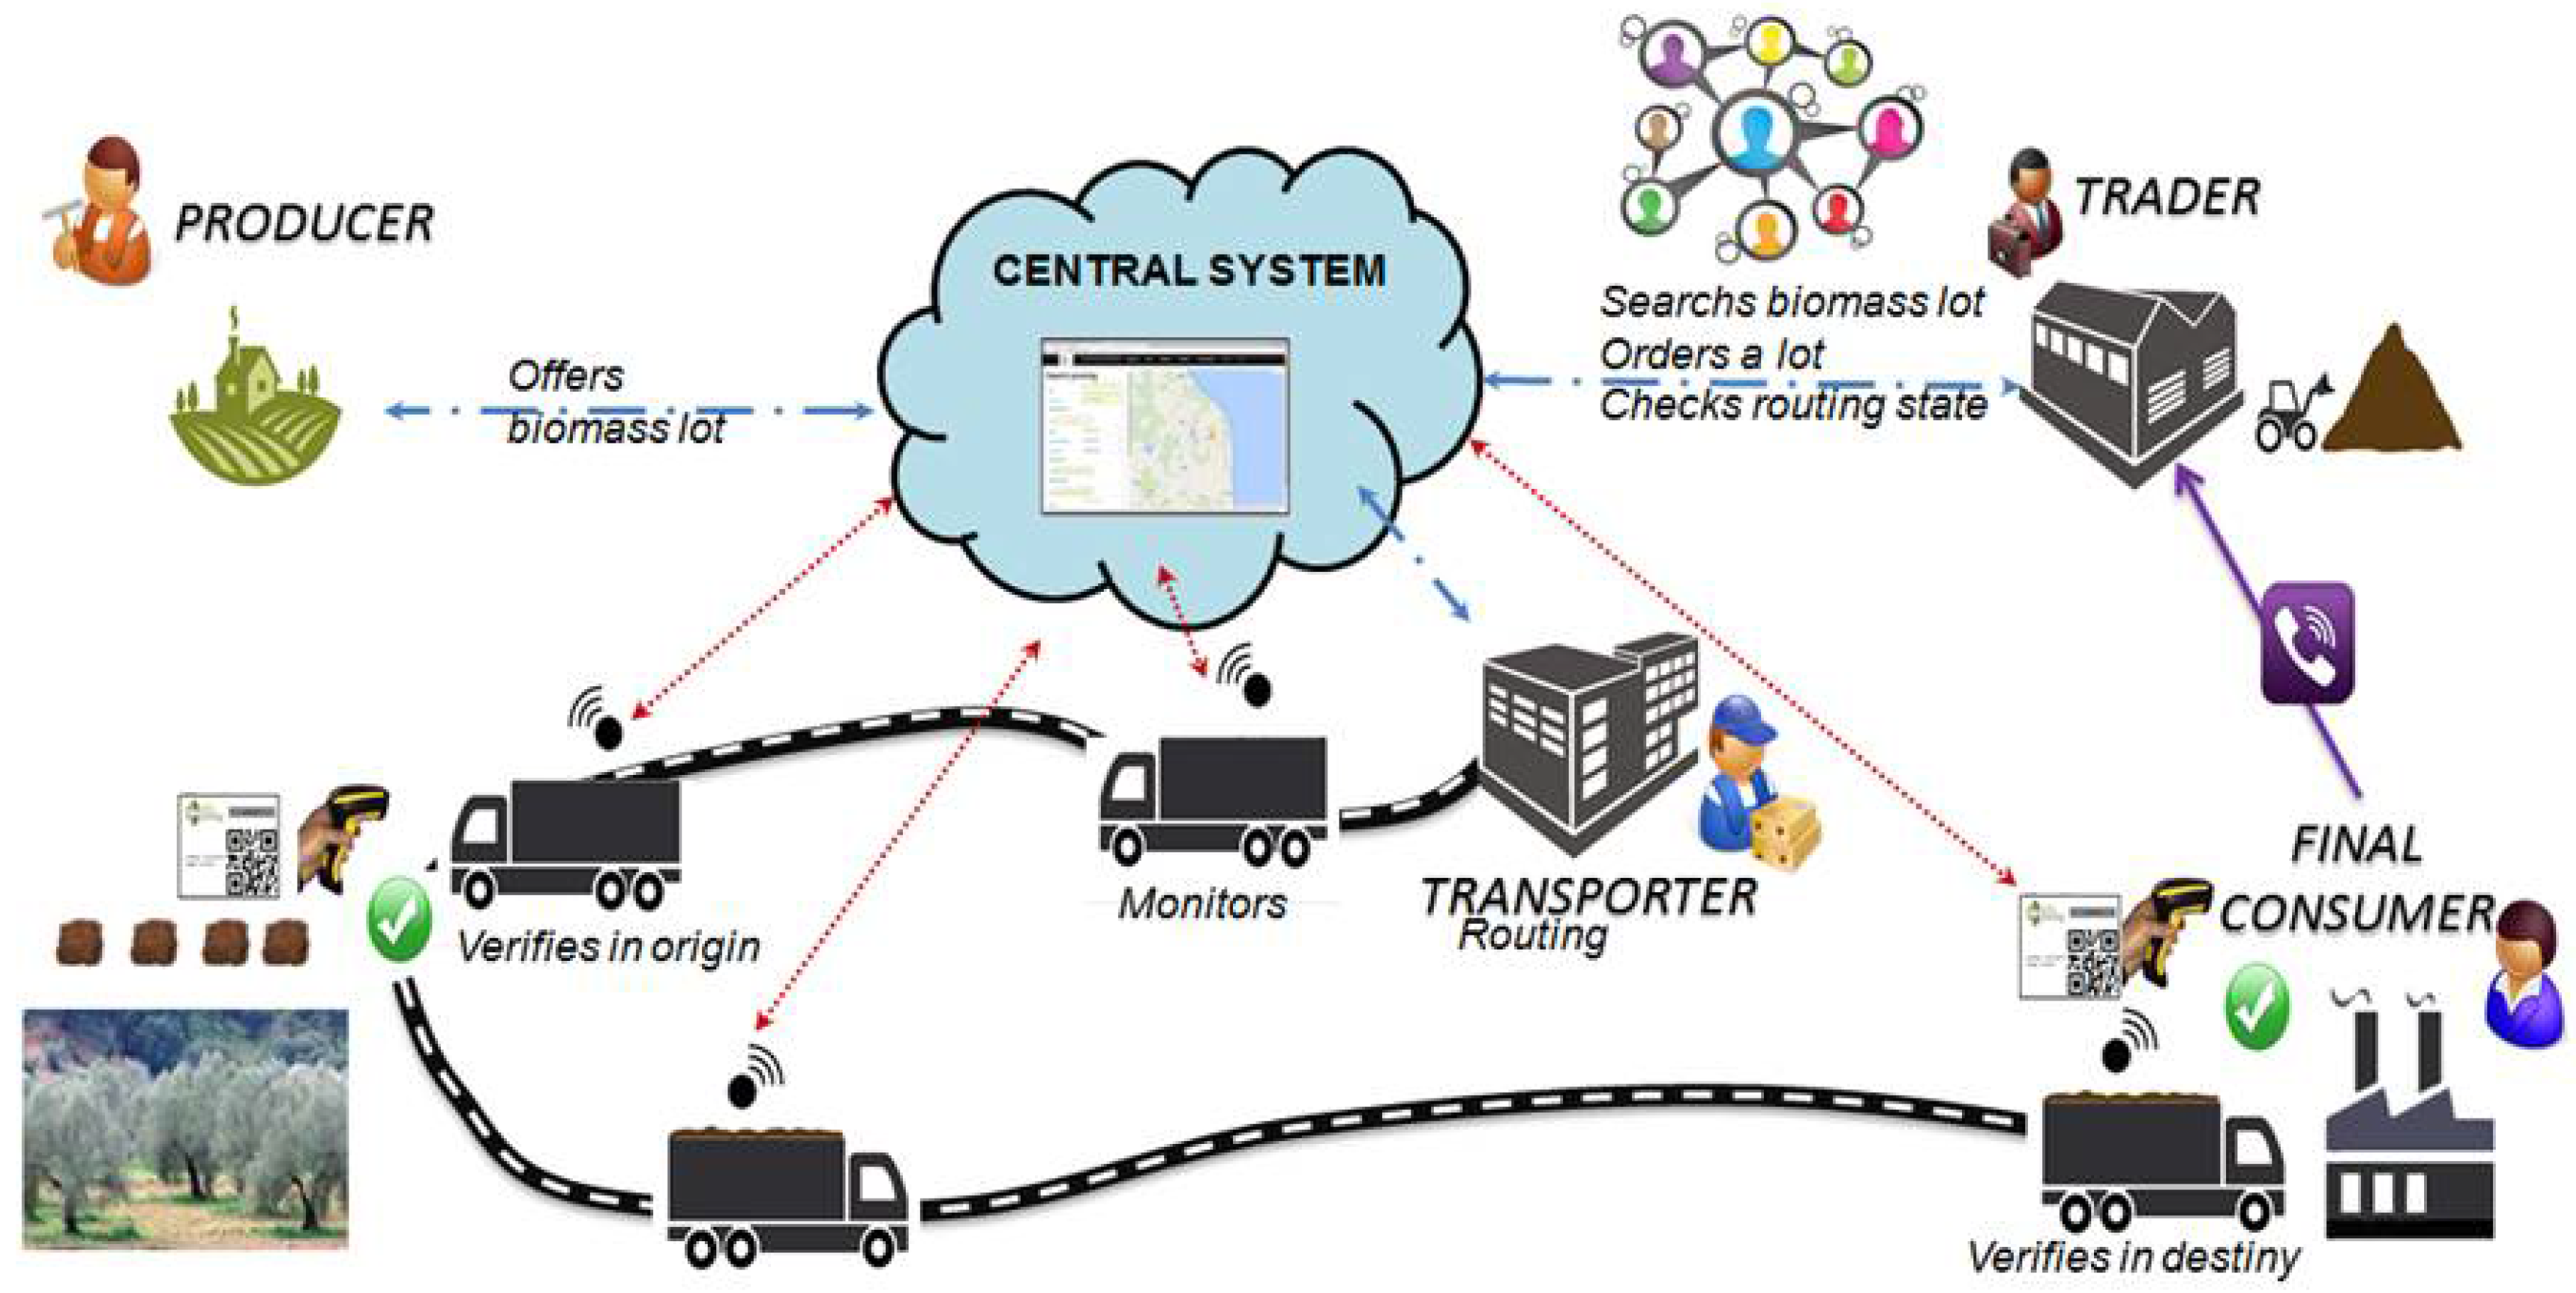
The Smart Logistics System (SLS) has four units (see Figure 2): (a) a Sensor unit (Smart box); (b) an On-board control unit; (c) a web-based Information platform, and (d) Central control unit. The Smart box tool is closely controlled by the On-board control unit. The Central control unit manages also the web-based Information platform and monitors information and material flow as well as facilitating interaction among different actors of biomass supply chain (see Figure 3). In this Smart system, the GPS, GPRS and GSM modules are integrated to monitor the information from the Smart box to the platform and Central control system.
3.1. Sensor Unit (Smart Box)
The sensor unit measures continuously the parameters such as relative humidity, temperature (with possibility of measuring at different positions at the same time), geographical position and tracking, and vehicle speed. It has accessories such as a barcode or QR (Quick Reader) and sensors for temperature and moisture content measurements at remote distance from sensor unit. The extension of the sensor unit should be placed in the loading compartment (trailer) of the vehicle and able to communicate wirelessly with the On-board control system, with the ability to transfer and receive data. The sensor unit (Smart box) is assembled with its accessories, GPS and GPRS/GSM modules connected with antennas. Sensors for temperature and relative humidity are also connected to it so that continuous measurement can be done during transport from producers to the required destinations.
3.2. Components of Smart Box Tool (Sensor Unit)
The Smart box uses a sensor probe (see Table 1) which could be placed in the loading compartment (trailer) of the vehicle and measures temperature and relative humidity of the pruning biomass during transport with time interval determined prior to start of the measurement. The start and end of measurements and the real-time performance of the sensor unit is monitored by the transport operator using the On-board control unit. The Smart box registers the GPS coordinates during transport. It also captures the QR code readings (data on biomass quality parameters) on the labels during scanning and retrieves the quality parameters of the transported prunings.
Three new Smart box prototypes were developed using an up-to-date data log system to test their performance. These three Smart box tools could be identified with their serial numbers when these are connected to the central control and monitoring system. The prototypes use Smart box and associated accessories (see Table 1). In order to perform measurements, the Smart system has 6 different components: Smart box for recording required data and transferring data; sensors for measuring temperature and humidity; GPS module and its antenna for detecting geographical coordinates; GPRS/GSM module and its antenna for wireless communication with the Central control unit; a Scanner for scanning QR code from pruning biomass label.
In the Smart System, PowerScan™ 9500 scanner [19] was implemented to read QR codes. PowerScan™ PBT9500 has powerful algorithm that enables to read the QR code. The QR code implemented in this SLS has standard QR code Specification (ISO/IEC 18004:2000 bzw. ISO/IEC 18004:2006) which has been replaced by ISO/IEC 18004:2015 [11]. The scanner communicates with the Smart box via wireless communication using Bluetooth.
The functions of the Smart box were programmed using the CargoLog PC software, and connected to the web address of the Information platform [20]. In order to use the geographical information systems with up-to-date information on facility locations and roads as integrated in Google Maps, the web-based Information platform is linked with Google Maps using Google Maps Engine API version ct 06.2015. This capability of the smart system enables the smart tool to interact with updated Google Maps with detailed information for the geographical position.
3.3. Assembly of Smart Box (Sensor Unit) Components
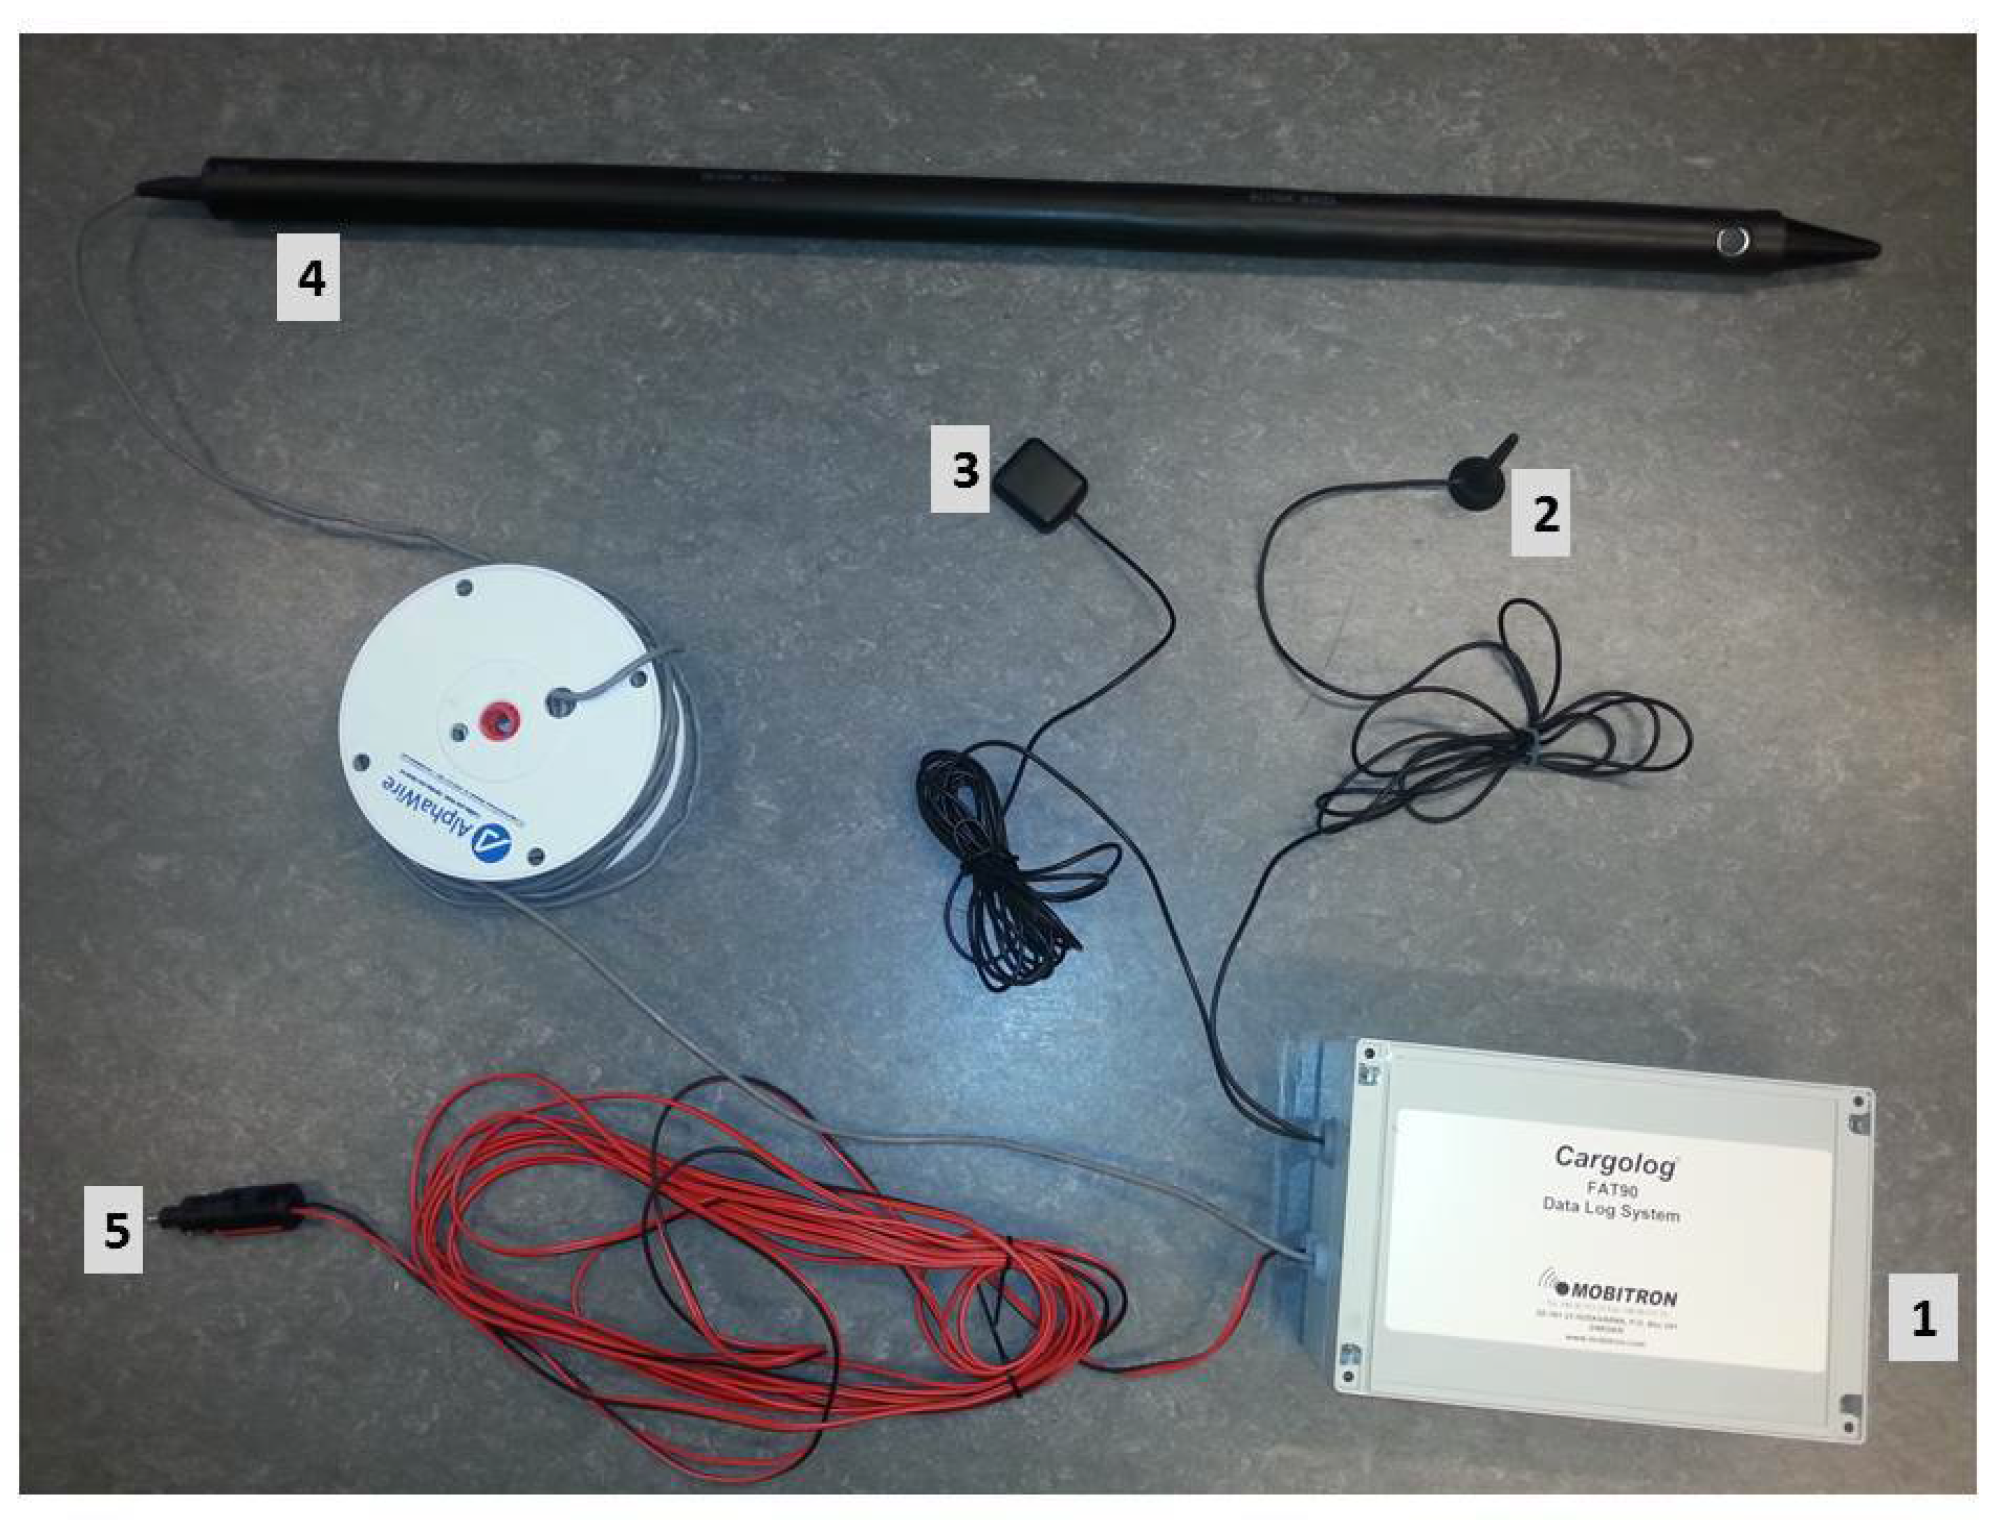
Once the Smart box is connected to its accessories such as power supply, GPS and GPRS/GSM antennas and temperature and relative humidity sensor probe, it should be installed in the metal case that has four power magnets (see Table 1 and Figure 4). Using magnets, the metal case can be mounted on the vehicle at the suitable position. The sensor probe should be inserted into the biomass loaded in the loading compartment (trailer) of the vehicle. The GPS antenna and GPRS/GSM antenna are connected to the Smart box with 5 m- and 2.5 m-long cables respectively. The antennas have magnetic feet and can be affixed on top of a vehicle. For the best signal reception, the GPS antenna should be placed in a horizontal unshielded line of sight to establish contact with the satellites. The GPRS/GSM antenna should be placed in a way it can get a clear view. The scanner was provided with a plastic holder for better handling and protection (see Figure 5).
3.4. On-Board Control System
The On-board control system is an important unit which should be linked to the sensor unit via wireless connection (Bluetooth, or IR) and to the Information platform and Central control unit (Figure 2).
This unit is always on the vehicle and is monitored by the transporter. The main functions are to: monitor the sensor unit (Smart box); receive and transfer data from the sensor unit to the central platform and to the Central control unit; receive and transfer data from and to web-based Information platform and Central control system; and perform route planning.
The SLS has an ability to consider the pick-up and delivery locations on Google Map-based geographic information system (GIS) and generate optimum biomass delivery routes. The transporters of biomass use this functionality of the smart system to plan their optimum driving routes based on locations of pruning (on farm or at storage site) and order locations (consumers’ locations). This functionality leads to economic and environmental efficiency of the pruning supply chain.
The On-board control unit uses CargoLog [21] software designed for a PC running on Windows XP/Windows 7/Windows 8, with minimum 20 MB free disk space and 1 free USB port. From the On-board control unit, the transport operator can monitor the performance of Smart box tool (parameters to be measured, measurement intervals and data transfer intervals to the Central control system).
Using the Web-based information platform [20], the SLS has the ability to consider the pick-up and delivery locations on Google Map integrated into the platform. Using the google based geographic information systems, the Smart System enables the transporter to generate optimum pruning delivery routes.
3.5. Information Platform
The web-based platform has the characteristics of an on-line marketing system. The system has been built in such a way that all actors such as farmers/producers, users/customers, transport companies and the on-board control system have access to the platform. The platform will be managed by the Central control system. The platform has two components:
Component 1: where the producers and processors put in information about their products; and
Component 2: where the product request and billing system is included.
The basic information which the farmers and processors should put in the platform includes quality parameters of biomass and the amount of biomass so that the end-users (for example a power plant) could order as required.
The system allows the actors to access the platform and provide and receive the required data. Special software was developed to enable the actors such as biomass producers and traders to be able to print a QR code and label their products. It enables them to print a label with QR code and lot number according to the pre-established labelling characteristics. The detailed information on traceability system linked to this SLS is reported by Bosona et al. [17].
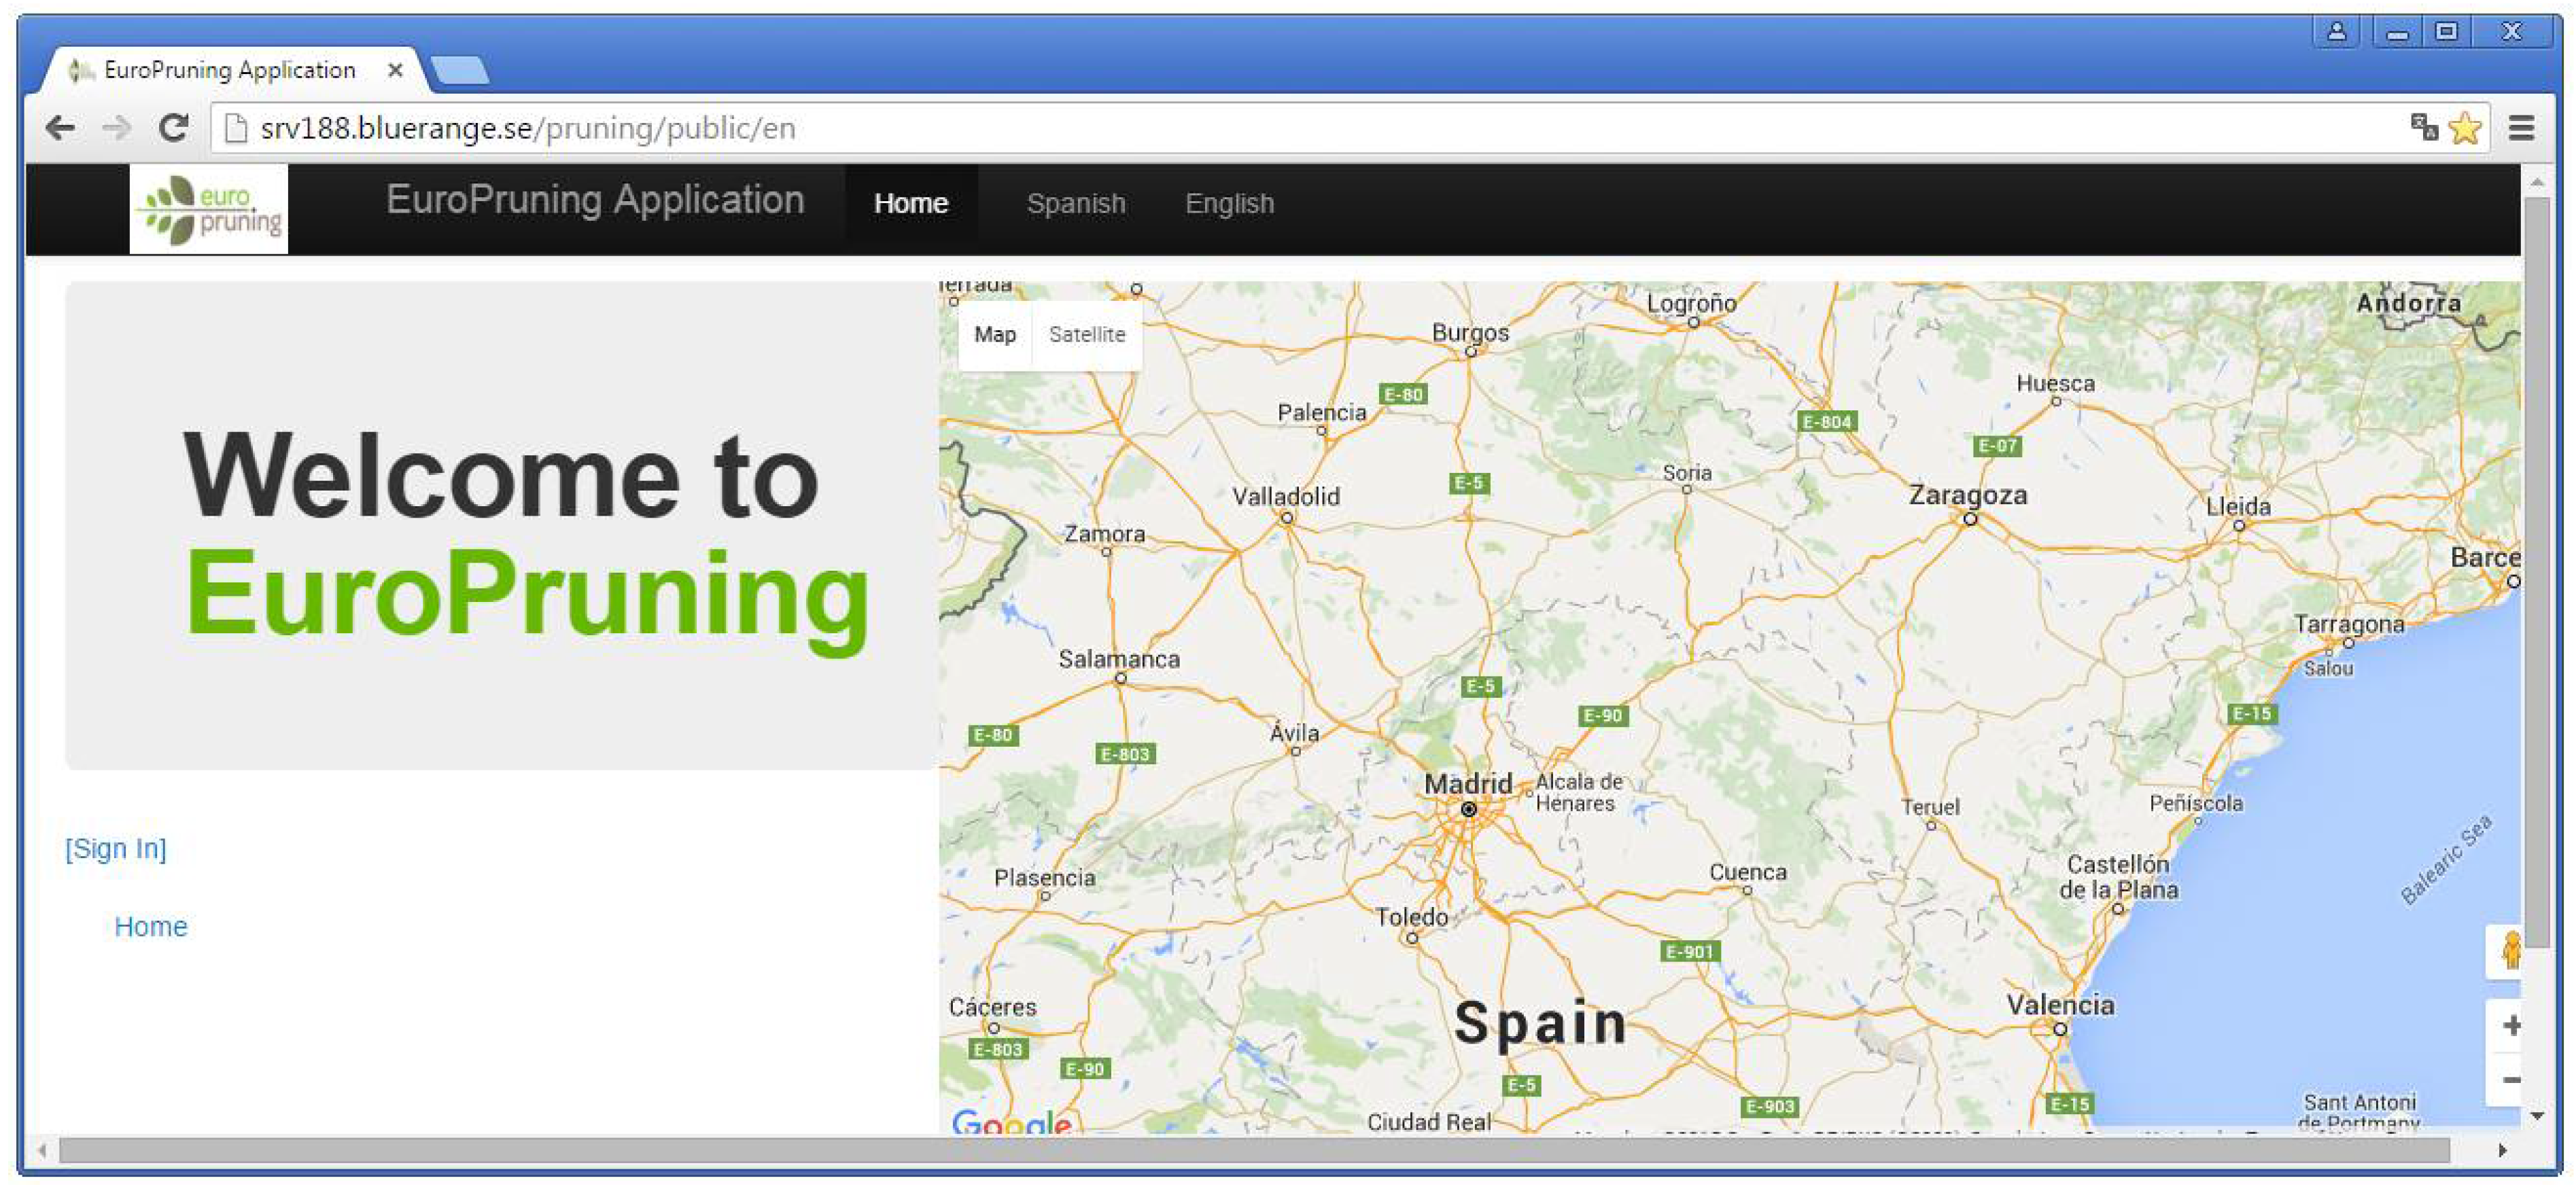
The platform provides an e-trading platform for effective marketing of pruning biomass. Figure 6 depicts an example of a first page display where different actors can login and use it.
3.5.1. Activities by Different Actors
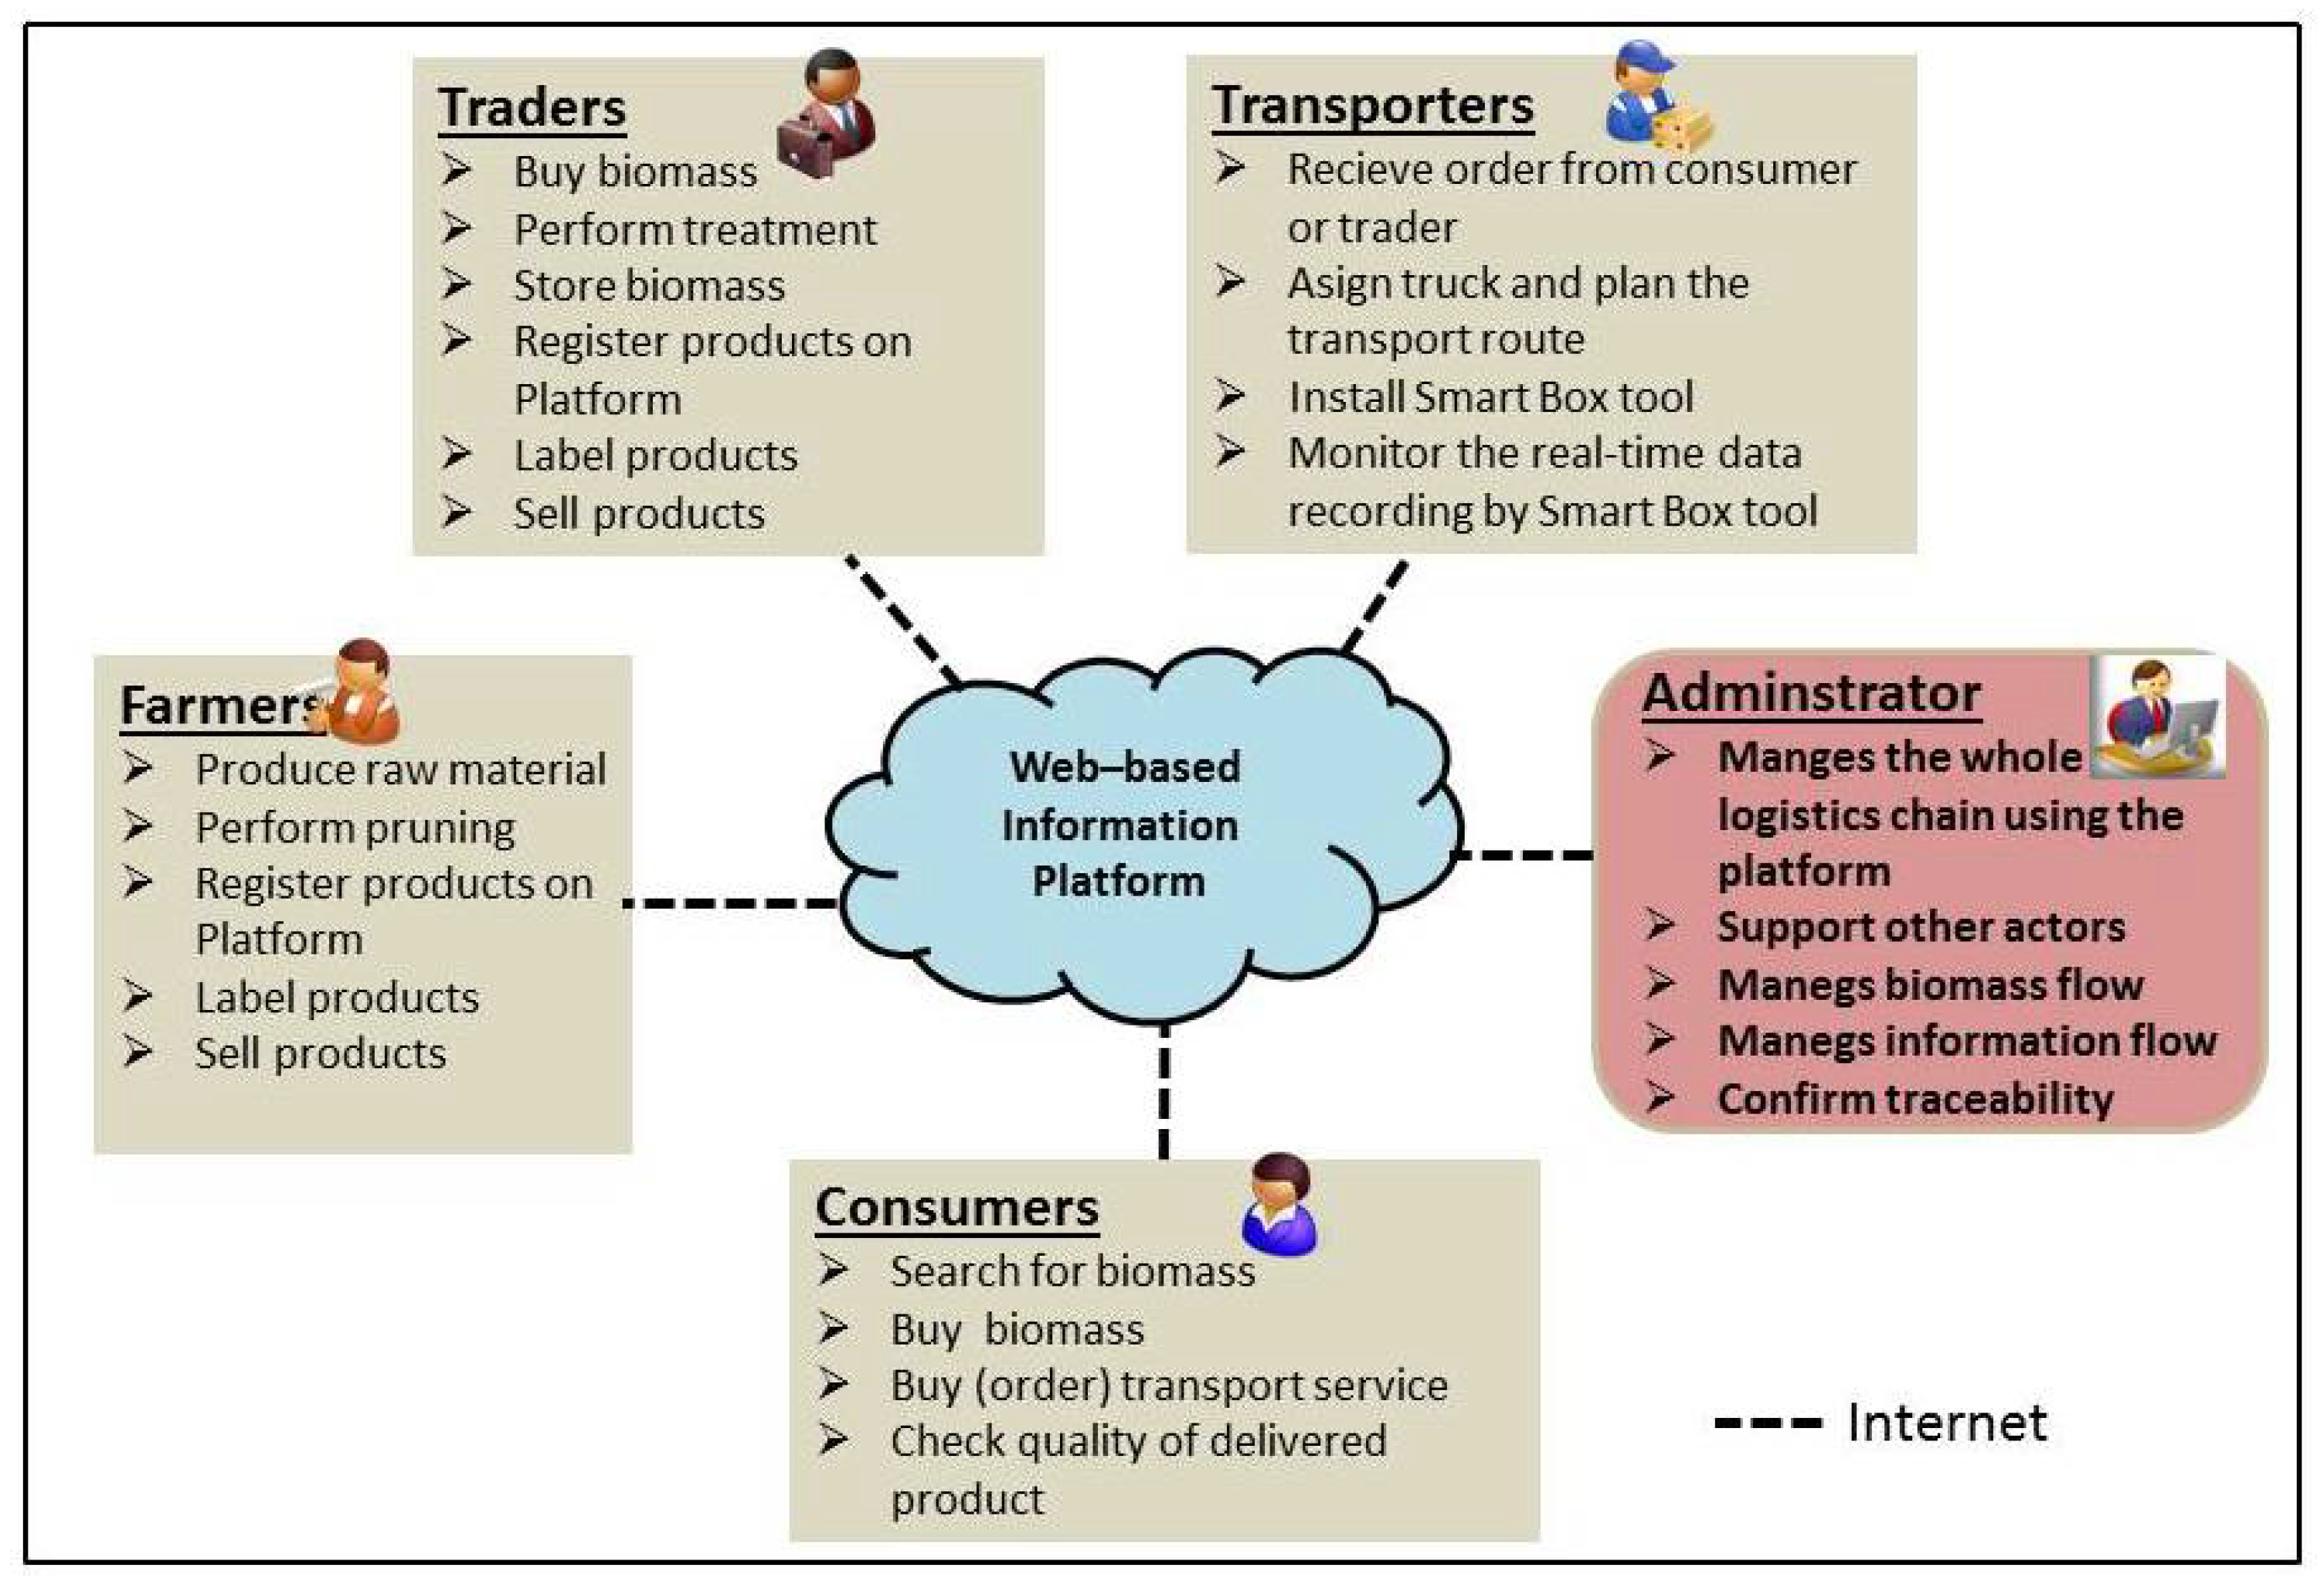
The information platform provides support functionality to different actors such as farmers (raw material producer), solid biofuel traders, transporters, and final consumers (the power plant). Figure 7 summarises the major activities of the actors using the platform while Figure 8 depicts the network of actions indicating how the platform enhances interaction among actors of the pruning supply chain.
During development of the platform, firstly, the biomass quality parameters and related information required to be gathered and stored were organized in a manner convenient to be implemented in the online platform. For this, a spreadsheet database was created for storing the data entered into the platform. Based on the defined activities, user-friendly interfaces have been created for each category of actors and administrators. Programing languages such as C+; php, java, and Delphi were used during developing the platform.
The platform [20] has been integrated also with Google Maps using Google Maps Engine API version ct 06.2015. This enables the smart system to interact with updated Google Maps with detailed information for the geographical position and to display (on the platform) the locations of pruning farms, biomass storage and processing sites, energy plants, the planned routes, and eventually the delivery routes. Using geographic information provided by the user (e.g., latitude–longitude coordinates of a facility under consideration) and GPS coordinates recorded and transmitted by the Smart box, the platform provides online mapping and display services.
The platform has been integrated with a QR code generation option for identifying biomass products entering and leaving the pruning supply chain. The standard specification of this QR code (ISO/IEC 18004:2000 bzw ISO/IEC 18004:2006) has been replaced by ISO/IEC 18004:2015 in 2015 (ISO, 2015).
This information platform can be upgraded and improved to increase its robustness and/or add additional functionality based on the feedback of users and experience of the logistics manager who administrates the Central control unit.
3.5.2. Interfaces of the SLS Platform for Different Actors
The platform has the characteristics of an on-line marketing system. For instance, the interface for farmers has a format for entering biomass quality parameters and generating lot numbers while the interface for transporters has features for receiving orders (to provide transport service for consumers or traders) and performing route planning. All registered actors such as farmers (producers), traders, transporters, and consumers have to login the web-based application platform before performing any action.
Interface foradministrator: the platform has been designed to have additional functional features for administrator. For instance, the administrator can add new users, edit the profile of registered users, or delete users who want to unsubscribe from the system. This enables the logistics manager of the logistics smart system to administer the whole material and information flow along the biomass logistics chain.
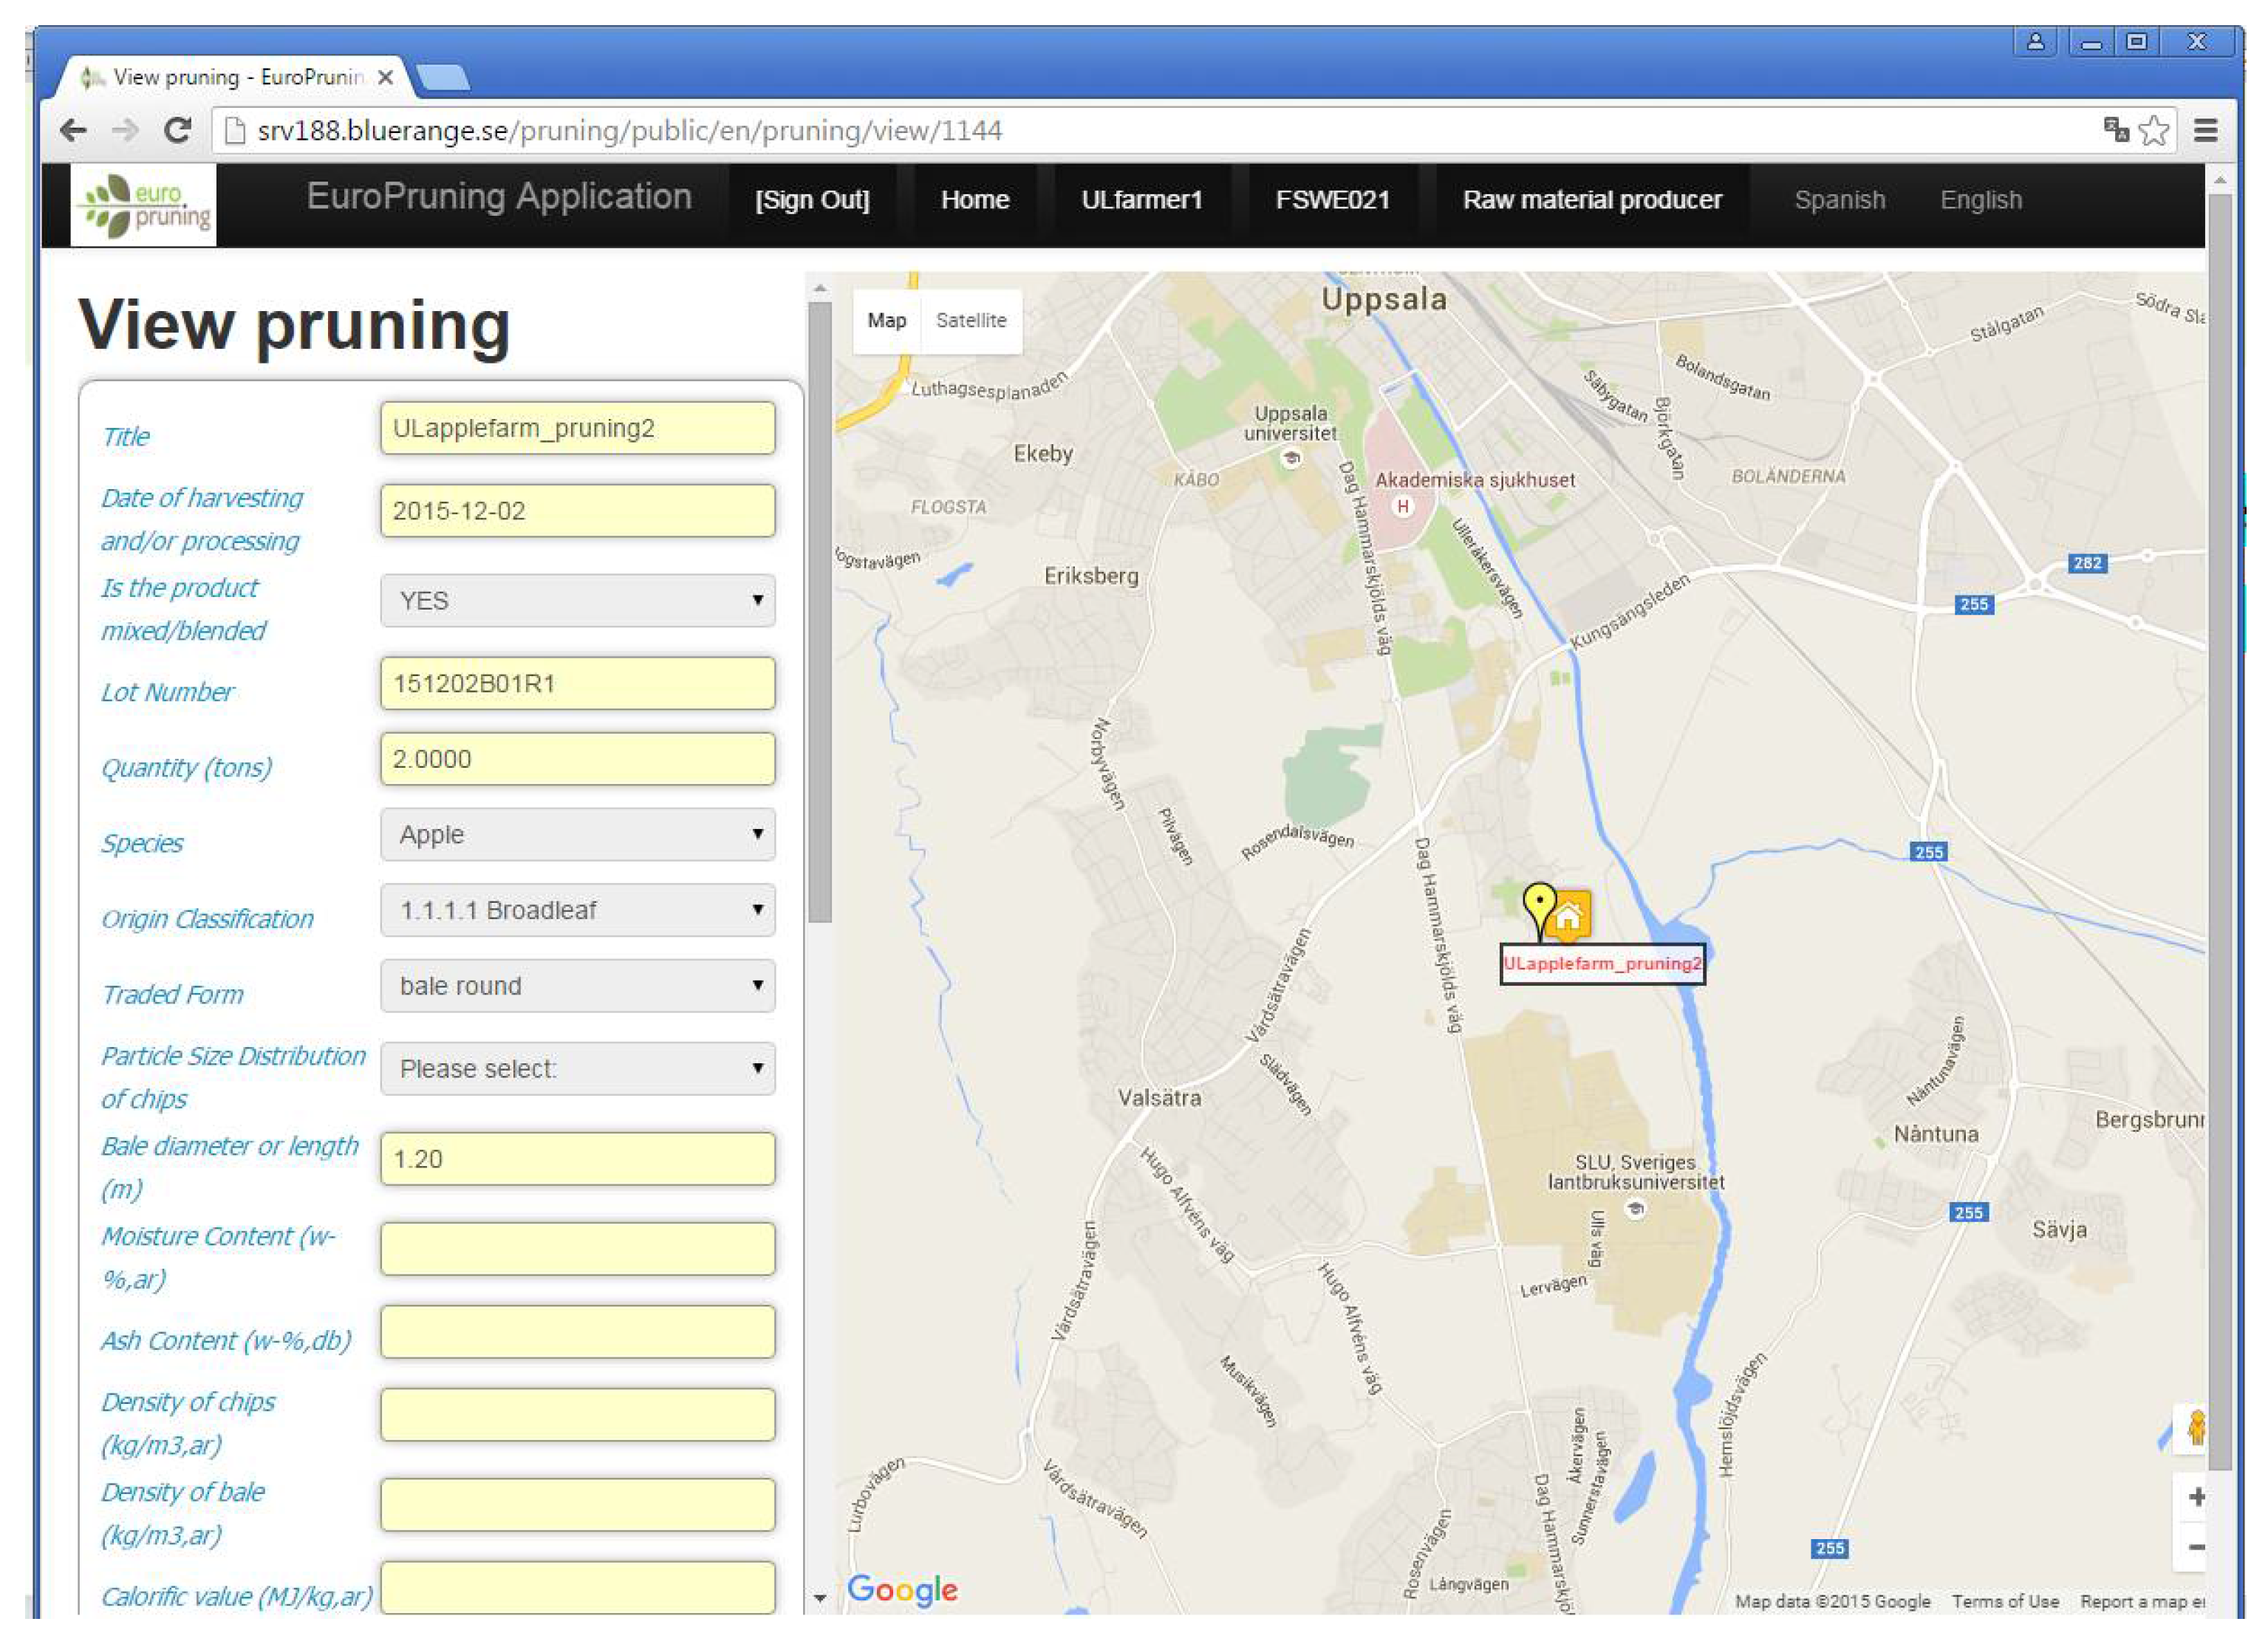
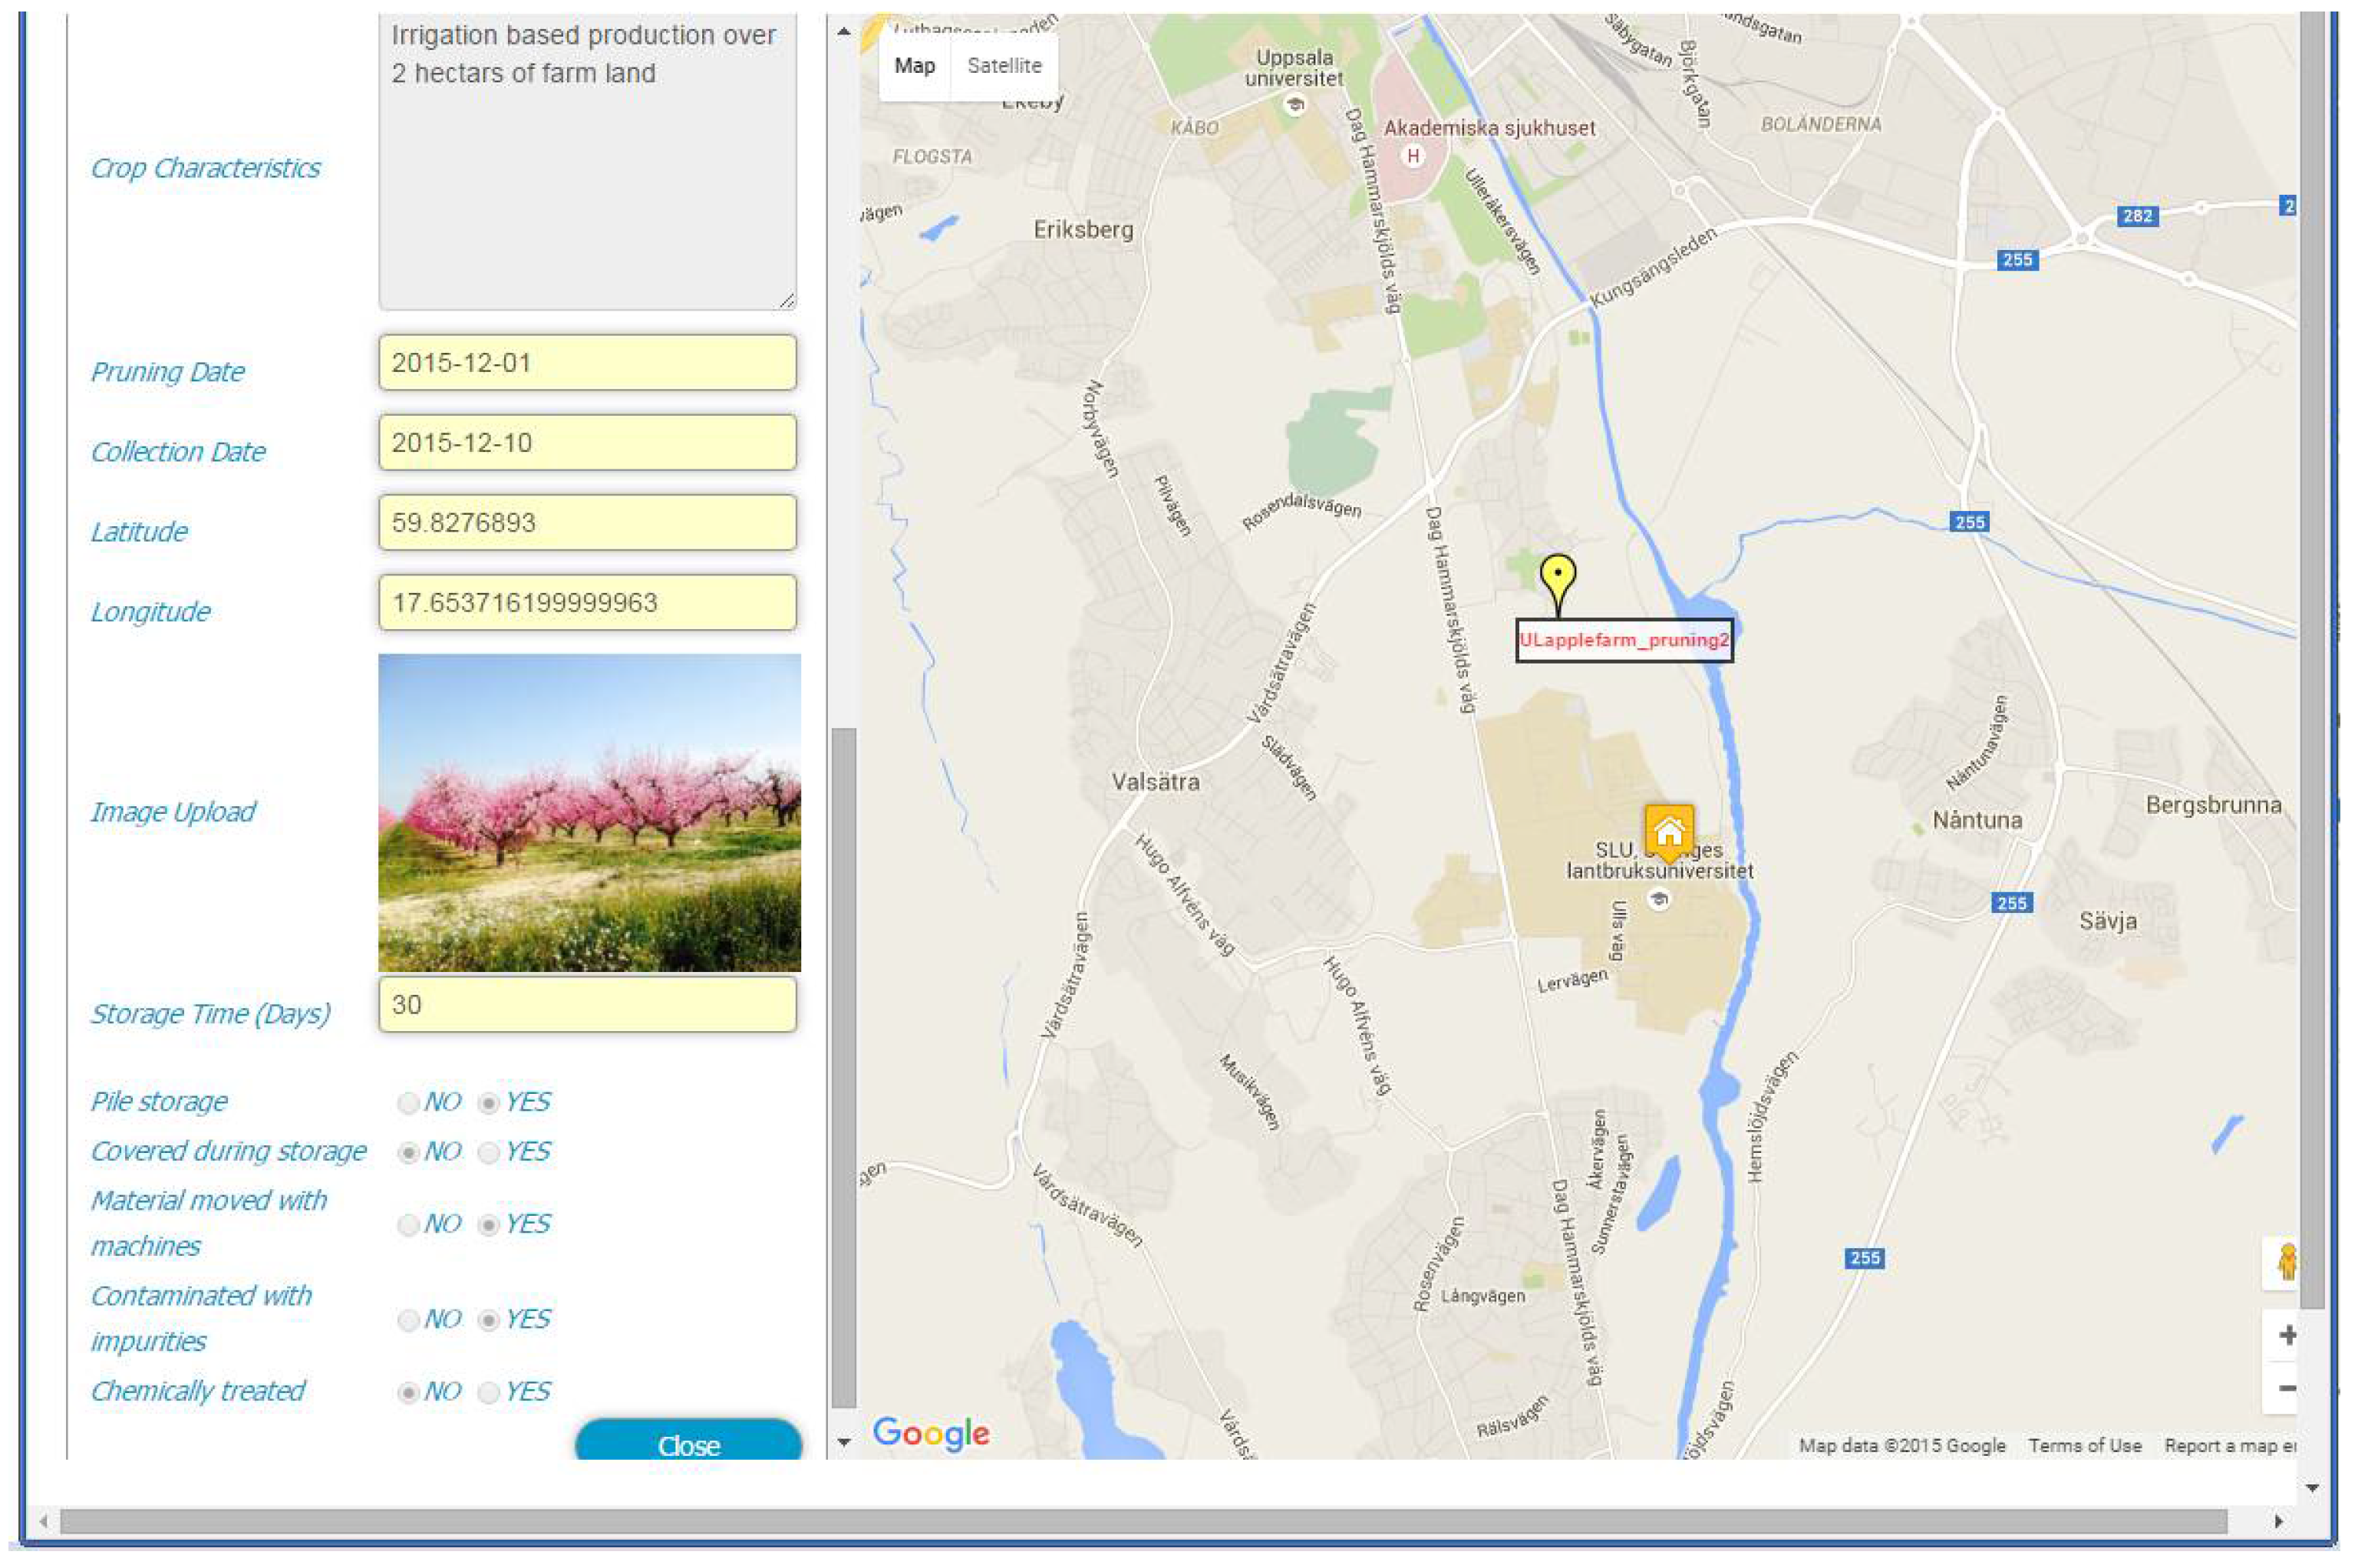
Interface for biomass producers: the new pruning biomass enters into the trading system when the farmer registers it in the application platform entering all required information about the product. The platform allows the producers (farmers or traders) to enter and edit the information regarding their pruning products (see Figure 9). The tool allows a producer to enter location information for each pruning batch, if its location differs from the location of a company (producer). It also enables the producers to generate a QR code of biomass products with a specific lot number. The lot number generation has been linked to the actual processing date i.e., baling or chipping date.
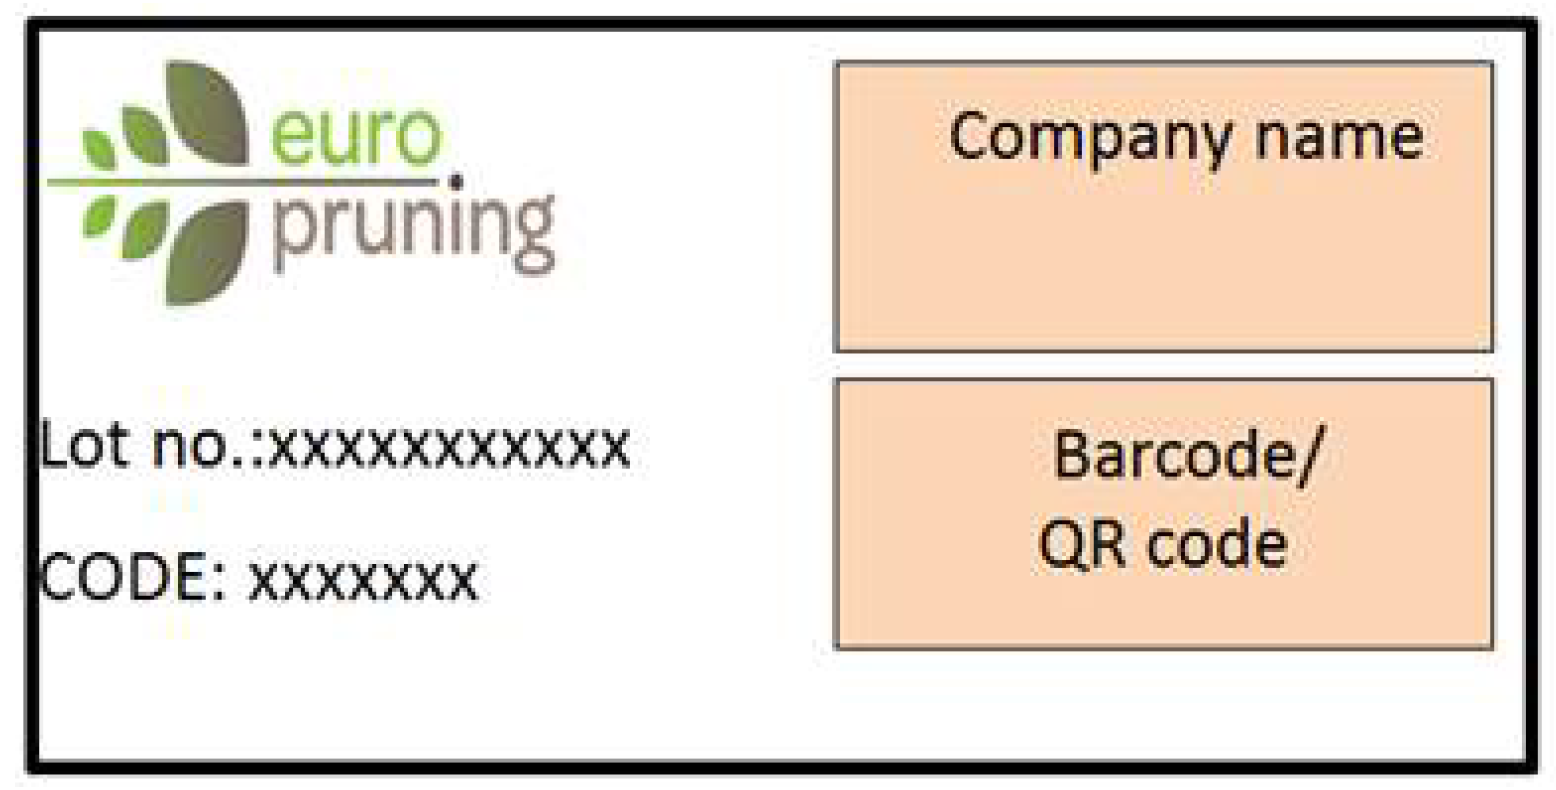
The interface allows the biomass providers (farmers and traders) to print the label associated to their products. Figure 10 presents label with company name (label holder), product lot number, and QR code.
Interface for traders: the platform supports the traders during procurement and selling the pruning biomass. Traders can search for available products in the platform and order it for purchasing. Traders can use also the platform to register their biomass products (after storing and/or processing to add value) on the platform to be available for sale.
Interface for consumers: the consumers have access to search for available products that are ready for sale, read quality parameter information provided by producers, make orders (to purchase products) and select an appropriate transport company to obtain a transport service for purchased biomass product.
Interface for transporters: the interface allows a transporter to enter a different start, storage, and end location for each shipment route. The platform allows the transporters to receive different orders from different consumers and add the accepted orders into planned shipments. It enables transporters to identify the location of products and the location of the customers’ store as well as the quantities required at each store. The location information attached to each user profile will be used to determine the source and destination locations for each order as well as in planning the route for each shipment.
3.6. Central Control Unit
The central control unit is the governing unit linked to the Information platform and On-board control unit (see Figure 2). It could be able to receive and transfer information within the decided intervals of time, and saves information. It provides a human–machine interface to administer and enable the monitoring of the system.
The Central control unit was designed to enable the administrator of the pruning trading system to monitor the SLS performance as whole. In general, it receives, controls, and transfers information from one actor to other actors along the pruning supply chain. This is an important unit that enables evaluation of the performance of the SLS and seeks continuous improvement measures that could lead to an economically effective and environmentally sustainable supply chain of renewable biomass energy generation.
4. Implementation and Management of the SLS
4.1. Material Flow Along the Logistics Chain
In the smart system, the web-based Information platform plays an important role to run and manage the whole pruning trading system. The tool allows each actor to understand the types of data to share and receive using a user-friendly interface as explained above.
Once the new pruning biomass enters the system, it passes different stages along the logistics chain. On the platform, the pruning position can be pinpointed under the link ‘Status’ which could be displayed as ‘Pending’, ‘Ready’, ‘Ordered’, or ‘Routed’. These terms indicating the status of recorded pruning biomass are defined in Table 2.
In general, integrating the Smart box tool and web-based Information platform, the SLS enables users to perform tracking, tracing, and monitoring activities [8] for improved management of the pruning biomass supply chain.
4.2. Data Acquisition and Management
The platform enables users to have an effective data acquisition, monitoring, and utilization system. Yu et al. [22] discussed the importance of data-driven supply chains and indicated that coordination and supply chain responsiveness increases the financial performance of firms. The developed platform receives data from two sources:
- (i)
- Actors (farmers, traders, etc.) can enter data (regarding biomass quality parameters and biomass supply related activities) directly into the platform.
- (ii)
- The Smart box measures some parameters such as relative humidity, temperature, GPS coordinates during biomass transport and transmits these data directly to the platform via GPRS/GSM devices. The platform can receive data from different Smart box tools and store the data along with the identification number (Cargolog serial number) of the respective Smart box.
The collected data will be stored in the server of the platform and monitored by the administrator of the system. The platform has a spreadsheet-based database on the server. This data can be used for different purposes, such as analysis of biomass quality against required quality standards, performance analyses of biomass distribution and traceability systems, and identifying improvement strategies.
The data gathered and stored in the data base can be categorized as:
- (i)
- information that should be kept for documentation, but non-traceable; and
- (ii)
- information that should be included in the labelling/traceability system and follows the product.
The information that documented in the database and needed to be public could be printed as a barcode or QR code. The farmers/producers will then deliver the barcode/QR code with the pruning to the transport company. The information from the barcode or QR code can also be used for traceability purposes. The information from the barcode/QR code will be first transferred to the sensor unit and then transferred to the web-based platform. Table 3 and Table 4 present data source, destination and transfer intervals.
4.3. Order Management Using the Platform
Order management is one of important contributions of the information platform. This functionality enables online pruning biomass trading (i.e., pruning e-trade). Two types of orders are handled in this SLS: Pruning biomass order and Transport service order.
Pruning biomass order management: in this smart system, the contact could be directly between farmers and consumers or between farmers and traders as well as between traders and consumers (see Table 5).
Transport service order management: traders and consumers order the transport service. Transporters are order receivers. The transporter has the right to accept or reject the service ordered by traders or consumers while the traders and consumers have the right to choose transporters from a list of transporters registered in the SLS.
In both cases of order management (product and service orders), there should be a predefined contractual agreement between the concerned actors using the SLS platform. Such a contract number regarding the concerned actor can be registered (by the administrator using ‘Add New User’ link) within the profile of the respective user. The financial transaction between the actors will be based on this procurement agreement. There is no financial transaction to be done on this platform and no financial related data to be documented in the spreadsheet-based database.
In this study, three Smart box prototypes have been developed; the SLS system has been tested in Sweden, Germany, and Spain with effective results and improvement feedbacks. Detailed performance evaluation results of this SLS will be reported separately. This SLS has the ability to generate optimum delivery routes for biomass products. It was found to be an important tool to improve the performance of pruning biomass supply chain management and product traceability by reducing biomass loss (in terms of quality and quantity) and increasing the quality of solid fuel and delivery service, creating effective pruning marketing channels, and reducing logistics and transaction costs.
As a final remark, it must be noted that the improvements in logistics that the system facilitates are applicable to any type of biomass. Therefore, the whole system can be easily adapted to improve the management of biomass like forestry woodchips, agrarian residues, or energy crop production and marketing.
5. Conclusions
The smart logistics system (SLS) has been designed with the objective to effectively and efficiently manage the pruning biomass supply chain leading to more sustainable biomass utilization. The smart system allows all recognized actors such as farmers, traders, transporters, and end users (power plants) to have access to the web-based application platform and provide and receive data, order, and activity reports. The SLS has four major components:
- Smart box (Sensor unit): for performing measurements of relative humidity, temperature, location records, truck speed and routes, and information associated with QR codes.
- On-board control unit: for performing route planning, monitoring measurements by the sensor unit, and controlling data/information flow between Smart box tools and the web-based Information platform.
- Information platform: for performing documentation and data sharing, facilitating interaction between different actors and biomass trading, and facilitating the management of pruning supply chain and traceability.
- Central control unit: for providing human-computer interface (linked to the Information platform and On-board control unit) and administering the whole pruning trading and delivery system.
Three Smart box prototypes have been developed and the whole SLS system has been tested in Sweden, Germany, and Spain with effective results and improvement feedback. This smart logistics system has the ability to generate optimum delivery routes for biomass products, and its application leads to economic and environmental efficiency of the pruning supply chain. It also describes how biomass producers, traders, transporters, and end users use the SLS and play their roles in promoting an economically effective and environmentally more sustainable logistics system for a pruning biomass trading system.
Author Contributions
G.G. conceived the SLS. G.G., D.G., T.B. and S.-O.O. and designed the SLS. S.-O.O. led the development of prototypes. G.G., D.G. and T.B. participated in monitoring and providing feedback for the development of SLS. T.B. and G.G. wrote the paper.
Funding
This research was funded by [European Union Seventh Framework Programme (FP7/2007-2013)] grant number [312078]. This work was part of international project EuroPruning: “Development and implementation of a new and non-existent logistics chain for biomass from pruning”.
Conflicts of Interest
The authors declare no conflict of interest.
References
- Iakovou, E.; Karagiannidis, A.; Vlachos, D.; Toka, A.; Malamakis, A. Waste biomass-to-energy supply chain management: A critical synthesis. Waste Manag. 2010, 30, 1860–1870. [Google Scholar] [CrossRef] [PubMed]
- Vela’zquez-Martı’, B.; Ferna’ndez-Gonza’lez, E.; Lo’pez-Corte’s, I.; Salazar-Herna’ndez, D.M. Quantification of the residual biomass obtained from pruning of vineyards in Mediterranean area. Biomass Bioenergy 2011, 35, 3453–3464. [Google Scholar] [CrossRef]
- Vela’zquez-Martı’, B.; Ferna’ndez-Gonza’lez, E.; Lo’pez-Corte’s, I.; Salazar-Herna’ndez, D.M. Quantification of the residual bioma ss obtained from pruning of trees in Mediterranean olive groves. Biomass Bioenergy 2011, 35, 3208–3217. [Google Scholar] [CrossRef]
- Esteban, L.S.; Carrasco, J.E. Biomass resources and costs: Assessment in different EU countries. Biomass Bioenergy 2011, 35, S21–S30. [Google Scholar] [CrossRef]
- Mobile Technologies GSM. Available online: http://www.etsi.org/technologies-clusters/technologies/mobile/gsm?highlight=YToxOntpOjA7czoz OiJnc20iO30 (accessed on 10 July 2018).
- General Packet Radio Service, GPRS. Available online: http://www.etsi.org/index.php/technologies-clusters/technologies/mobile/gprs (accessed on 9 July 2018).
- Santa, J.; Zamora-Izquierdo, M.A.; Jara, A.J.; Gómez-Skarmeta, A.F. Telematic platform for integral management of agricultural/perishable goods in terrestrial logistics. Comput. Electron. Agric. 2012, 80, 31–40. [Google Scholar] [CrossRef] [Green Version]
- IT Glossary. Available online: https://www.gartner.com/it-glossary/telematics (accessed on 10 July 2018).
- Oliveira, R.R.; Cardoso, I.M.G.; Barbosa, J.L.V.; da Costa, C.A.; Prado, M.P. An intelligent model for logistics management based on geofencing algorithms and RFID technology. Expert Syst. Appl. 2015, 42, 6082–6097. [Google Scholar] [CrossRef]
- Xiao, X.; Wang, X.; Zhang, X.; Chen, E.; Li, J. Effect of the quality property of table grapes in cold chain logistics-integrated WSN and AOW. App. Sci. 2015, 5, 747–760. [Google Scholar] [CrossRef]
- Information Technology—Automatic Identification and Data Capture Techniques—QR Code Bar Code Symbology Specification. Available online: https://www.iso.org/obp/ui/#iso:std:iso-iec:18004:ed-3:v1:en (accessed on 10 July 2018).
- The Implications of Electronic Trading in Financial Markets. Committee on the Global Financial System (CGFS). Bank for International Settlements. Available online: http://www.bis.org/publ/cgfs16.pdf (accessed on 18 June 2018).
- Hendershott, T. Electronic trading in financial markets. IT Prof. 2003, 4, 10–14. [Google Scholar] [CrossRef]
- Legris, P.; Ingham, J.; Collerette, P. Why do people use information technology? A critical review of the technology acceptance model. Inf. Manag. 2003, 40, 191–204. [Google Scholar] [CrossRef]
- Yi, M.Y.; Hwang, Y. Predicting the use of web-based information systems: Self-efficiency, enjoyment, learning goal orientation, and the technology acceptance model. Int. J. Hum.-Comput. Stud. 2003, 59, 431–449. [Google Scholar] [CrossRef]
- Types of QR Codes. Available online: http://www.qrcode.com/en/codes/ (accessed on 18 June 2018).
- Bosona, T.; Gebresenbet, G.; Olsson, S. Traceability System for Improved Utilization of Solid Biofuel from Agricultural Prunings. Sustainability 2018, 10, 258. [Google Scholar] [CrossRef]
- Recursos Gráficos Para Todos. Available online: https://www.freepik.es/ (accessed on 18 June 2018).
- Cargolog Impact Record System. Available online: http://mobitron.se/en/cargolog-impact-recorder-system/power-9500-2/ (accessed on 16 July 2018).
- Official Website of Europruning Application Platform. Available online: http://europruning.mobitron.se/public/en (accessed on 16 July 2018).
- Cargolog Impact Record System. Available online: http://mobitron.se/en/cargolog-impact-recorder-system/ (accessed on 16 July 2018).
- Yu, W.; Chavez, R.; Jacobs, M.A.; Feng, M. Data-driven supply chain capabilities and performance: A resource-based view. Transp. Res. Part E Logist. Transp. Rev. 2018, 114, 371–385. [Google Scholar] [CrossRef]
Figure 1.
Different actors along the pruning biomass logistics chain.

Figure 2.
The conceptual organization of smart logistics system (SLS) components (Adapted from [17] with slight modification).
Figure 2.
The conceptual organization of smart logistics system (SLS) components (Adapted from [17] with slight modification).

Figure 3.
Linkage between different activities of actors along biomass supply chain with application of SLS. Source: Created by authors using free Icons obtained from FREEPIK [18].
Figure 3.
Linkage between different activities of actors along biomass supply chain with application of SLS. Source: Created by authors using free Icons obtained from FREEPIK [18].

Figure 4.
Smart box system assembly: (1) Smart box protected with metal case; (2) GPRS/GSM antenna; (3) GPS antenna; (4) temperature and humidity measuring sensor probe; (5) power cable.
Figure 4.
Smart box system assembly: (1) Smart box protected with metal case; (2) GPRS/GSM antenna; (3) GPS antenna; (4) temperature and humidity measuring sensor probe; (5) power cable.

Figure 5.
PowerTM 9500 scanner with its components.

Figure 6.
SLS Information platform displaying home page for signing in. http://europruning.mobitron.se/public/en.
Figure 6.
SLS Information platform displaying home page for signing in. http://europruning.mobitron.se/public/en.

Figure 7.
Major activities of different users of the platform. In order to allow the actors to perform the activities indicated, the platform has modules and links to defined actions making the platform more user friendly.
Figure 7.
Major activities of different users of the platform. In order to allow the actors to perform the activities indicated, the platform has modules and links to defined actions making the platform more user friendly.

Figure 8.
Network of actions by different users of the platform.

Figure 9.
Farmer’s interface as signed in by a raw material producer. The page displays a data entering format where some of the parameters will be added.
Figure 9.
Farmer’s interface as signed in by a raw material producer. The page displays a data entering format where some of the parameters will be added.


Figure 10.
Sample of label indicating appearance of company name with its identification code, lot number of ordered biomass product, and QR code.
Figure 10.
Sample of label indicating appearance of company name with its identification code, lot number of ordered biomass product, and QR code.


Table 1.
Characteristics and functions of components of Smart box tool.
| Component | Characteristics Description | Function as Applied in SLS | |
|---|---|---|---|
| Registration unit |  Model of the registration unit CS 0940-6 | The Smart box which is based on the platform for the Cargolog Impact Recorder System is a measuring unit that records the temperature and humidity of the pruning biomass (using the sensor probe), QR readings (using scanner), and Global Positioning System (GPS) coordinates (using GPS signal receivers) during biomass transport. It also transmits the recorded data to the central server using General Packet Radio Service/Global System for Mobile Communications (GPRS/GSM) tools. It is provided with a holder so that it can be installed with appropriate protection against mechanical damage. The smart box could either be equipped with a battery or receive a power supply of 12 or 24 volt from the vehicle’s battery. | |
| Metal case |  Metal Case with four magnets | The metal case is used for protecting the smart box from mechanical damage, aggressive gases, liquids and humidity. The Smart box is installed in the metal case with its holder. | |
| Power cable |  Power supply cable | The power supply cable is used to connect the Smart box to external power source of 12 or 24 V. | |
| Sensor, sensor probe, and cable |  | Temperature and relative humidity sensors are installed in the probe for protection. The probe is connected to the Smart box and long enough to measure at any distance required within 15 m. The sensors are protected by a hard cover. The hard probe enables the sensors to be inserted into biomass to measure temperature and humidity during transport. The measurement interval can be adjusted as required. | |
| GPS antenna |  | GPS antenna with magnetic foot Cable length: 5 m Size in mm (L × W × H): 50 × 40 × 10 | The GPS antenna receives signals from satellites and enables the GPS system to determine the geographical coordinates. The GPS antenna is directly connected to the GPS module in the Smart box. |
| GPRS/GSM antenna |  | Antenna with magnetic foot Cable length: 2.5 m | The GPRS/GSM antenna transmits data from the Smart box to the Central control unit. The GPRS/GSM antenna is directly connected to the Smart box by 2.5 m long cable. The antenna has a magnetic foot so that it can be placed at appropriate position with a clear view for optimal transmission of data/information. |
| Scanner |  Type: PowerScanTM BT9500 family Model: PBT9500 Capability: Single scanner and omni-directional reading; improved ergonomic and user comfort Holder: HLD-P080 | The PowerTM 9500 is used to read QR codes on labels of the pruning biomass. It can read QR codes with a distance of over 1.0 m/3.3 ft, depending on the barcode’s resolution. Its features support 1D, stacked and 2D codes, postal codes and image capture. The Power 9500 scanner enables to perform a reliable, and long-term operation. PowerScan™ 9500 scanner combines omnidirectional reading capabilities with an optical characteristics and it is able to read any kind of bar code, regardless of the orientation. It has a HLD-P080 plastic holder designed to be mounted on a wall or fixed on a desk. | |
| Infrared (IR) Interface |  Type: Cargolog FAT90 IR Interface Version: 60944 TopCom version with USB Size in mm (L × W × H): 150 × 48 × 35 | The IR interface is used for communication between the Smart box and On-board control using Bluetooth. The CargoLog PC software enables parameters to be to downloaded and sampling sequences to be initiated, and reads out the collected data after or during a record period. | |
Table 2.
Pruning record status.
| Status | Definition |
|---|---|
| Pending | The pruning has been entered into the system; the provider can still edit or delete that pruning. |
| Ready | The pruning has been flagged as ready; all consumers can access the system to view its quality parameters and order it. |
| Ordered | The pruning has been ordered by a buyer (consumer or trader) and assigned to a specific transporter. That transporter can access the system to view its source and destination locations and add it to a shipment. |
| Routed | The pruning has been selected by a transporter to be included in one of the shipment routes. The transporter plans its best delivery route |
Table 3.
Data type, source, destination and utilization.
| Data Type | Data Source | Device (to Transfer Data to Smart Box) | Data Destination | Main Data User |
|---|---|---|---|---|
| Temperature | New measurement by sensor placed in the prunings | Sensor probe with cable | Information platform server (and On-board control unit PC) | Consumer, producer, Administrator (Central control unit) |
| Relative humidity | New measurement by sensor placed in the prunings | Sensor probe with cable | Information platform server (and On-board control unit PC) | Consumer, producer, Administrator |
| Pruning characteristics | QR code on labels of pruning transported | Scanner | Information platform server (and On-board control unit PC) | Consumer, Trader, Transporter, Administrator |
| GPS coordinates | Earth orbiting satellites | GPS antenna and GPS receiver | Information platform server (and On-board control unit PC) | Transporter, Administrator |
Table 4.
Smart box data recording and transferring intervals.
| Parameter | Unit | Recommended Recording Interval | Recommended Transfer Interval | Comment |
|---|---|---|---|---|
| Temperature | °C | 15 min | 30 min | The intervals can be adjusted by On-board control unit |
| Relative humidity | % | 15 min | 30 min | The intervals can be adjusted by On-board control unit |
| GPS coordinates (latitude, longitude) | Decimal degrees | 5 min | 30 min | - |
| QR reading | Text | Twice | Twice | QR reading is done during loading the product and after end of delivery (unloading) |
Table 5.
Order tracking using smart logistics system.
| Pruning Title (or Lot No.) | Offer (to Sale) | Order (to Purchase) | Offer (As Purchased or after Additional Processing) | Order |
|---|---|---|---|---|
| To be assigned by pruning provider | by producer | by consumer | - | - |
| To be assigned by pruning provider | by producer | by trader | by trader | by consumer |
© 2018 by the authors. Licensee MDPI, Basel, Switzerland. This article is an open access article distributed under the terms and conditions of the Creative Commons Attribution (CC BY) license (http://creativecommons.org/licenses/by/4.0/).
Share and Cite
MDPI and ACS Style
Gebresenbet, G.; Bosona, T.; Olsson, S.-O.; Garcia, D. Smart System for the Optimization of Logistics Performance of the Pruning Biomass Value Chain. Appl. Sci. 2018, 8, 1162. https://doi.org/10.3390/app8071162
AMA Style
Gebresenbet G, Bosona T, Olsson S-O, Garcia D. Smart System for the Optimization of Logistics Performance of the Pruning Biomass Value Chain. Applied Sciences. 2018; 8(7):1162. https://doi.org/10.3390/app8071162
Chicago/Turabian StyleGebresenbet, Girma, Techane Bosona, Sven-Olof Olsson, and Daniel Garcia. 2018. "Smart System for the Optimization of Logistics Performance of the Pruning Biomass Value Chain" Applied Sciences 8, no. 7: 1162. https://doi.org/10.3390/app8071162
Note that from the first issue of 2016, this journal uses article numbers instead of page numbers. See further details here.