Region Adjacency Graph Approach for Acral Melanocytic Lesion Segmentation


Department of Automatic Control and Robotics, AGH University of Science and Technology, 30-059 Krakow, Poland
*
Author to whom correspondence should be addressed.
Appl. Sci. 2018, 8(9), 1430; https://doi.org/10.3390/app8091430
Submission received: 27 June 2018
/
Revised: 10 August 2018
/
Accepted: 11 August 2018
/
Published: 22 August 2018
(This article belongs to the Section Applied Biosciences and Bioengineering)
Abstract
:Malignant melanoma is among the fastest increasing malignancies in many countries. Due to its propensity to metastasize and lack of effective therapies for most patients with advanced disease, early detection of melanoma is a clinical imperative. In non-Caucasian populations, melanomas are frequently located in acral volar areas and their dermoscopic appearance differs from the non-acral ones. Although lesion segmentation is a natural preliminary step towards its further analysis, so far virtually no acral skin lesion segmentation method has been proposed. Our goal was to develop an effective segmentation algorithm dedicated for acral lesions. We obtain a superpixel oversegmentation of a lesion image by performing clustering in a joint color-spatial 5d space defined by coordinates of CIELAB color space and spatial coordinates of the image. We then construct a region adjacency graph based on this superpixel representation. We obtain the ultimate segmentation result by performing a hierarchical region merging. The proposed segmentation method has been tested on 134 color dermoscopic images of different types of acral melanocytic lesions (including melanoma) from various sources. It achieved an average Dice index value of 0.85, accuracy 0.91, precision 0.89, sensitivity 0.87, and specificity 0.88. Experimental results suggest the effectiveness of the proposed method, which would help improve the accuracy of other diagnostic algorithms for acral melanoma detection. The results also suggest that the computational approach towards lesion segmentation yields more stable output than manual segmentation by dermatologists.
1. Introduction
Human cutaneous melanoma is the deadliest type of skin cancer, characterized by a swiftly rising incidence rate [1]. It is among the most aggressive neoplasms, rapidly metastasizing to distant organs. When it progresses to a metastatic stage, it establishes powerful mechanisms to resist current medical therapies (such as chemo- and radiotherapy). However, when detected early, in almost all cases, it is possible to treat melanoma with a simple surgical excision [2].
The acral lentiginous melanoma (ALM) is a kind of lentiginous skin melanoma located mainly on soles and palms (Figure 1). Although ALM is rare among people with lighter skin types, in non-Caucasian populations, nearly half of melanomas are located in acral volar areas [3]. ALM has four patterns considering pigmentation: parallel-furrow, lattice-like, fibrillar, and parallel-ridge pattern [4]. Among these patterns, ALM lesions with the furrow and ridge patterns occurs most frequently [3]. In particular, the parallel ridge pattern shows 86% sensitivity and 99% specificity as a characteristic feature of melanoma [5]. The examination of pigmentation patterns is possible through a digital epiluminescence microscopy (ELM, also dermoscopy or dermatoscopy) which is a non-invasive, in vivo technique that makes subsurface structures of the skin accessible for examination in an optic magnification between 10 to 40 times [2]. Nevertheless, the accuracy of expert dermatologists in diagnosing melanoma is estimated to be 75–84%, which is partly due to the subjectivity of the diagnostic judgments [6].
To overcome this problem, some methods for automated diagnostics of melanoma using dermoscopic images of suspected lesions were already developed [7]. However, they are aimed at detecting non-acral melanomas. Since the appearance of ALM differs significantly from that of melanoma in other sites of the body, it is difficult to apply those methods to ALM [8].
In this study, the authors propose an automatic segmentation algorithm designed for acral lesions. It is expected that the proposed algorithm will help localize dermoscopic patterns in ALM more easily, thus contributing to the more effective early diagnosis of ALM.
Related Works
To the best of our knowledge, only one acral skin lesion segmentation method has been proposed so far—Iyatomi et al. combined Otsu’s thresholding with region growing [9].
Regarding classical algorithms for non-acral skin lesion segmentation, in-depth surveys on lesion border detection in dermoscopy images can be found in [10,11]. The proposed methods include threshold-based [12,13,14], region growing [15,16,17] and active-contour-based methods [18,19]. Thresholding methods try to segment the skin lesions based on a threshold value, usually calculated by analyzing pre-defined image features such as the intensity histogram. Region growing based methods recursively merge pixels or regions together in a hierarchical manner. Methods based on energy functions (active contour methods) attempt to determine skin lesion boundaries by minimizing a cost function defined on image characteristics such as edges and smoothness.
There have also been proposed approaches based on convolutional neural networks, which predict pixel-wise labeling of the images [20,21]. Both approaches use fully convolutional networks (FCNs) to automatically segment the skin lesions. However, they address the issue of FCN producing coarse segmentation boundaries for challenging skin lesions differently: through a multistage segmentation approach in which multiple FCNs learn complementary visual characteristics of different skin lesions [20] or using a superpixel-based approach [21].
Recently, a few methods using neutrosophic clustering have been proposed [22,23,24]. Their general framework consists of three steps. First, the dermoscopic images are mapped into a neutrosophic set domain (e.g., using the shearlet transform results for the images [22] or statistics based on gradient and intensity values [23,24]) over three memberships: true, indeterminate, and false memberships. Then, a neutrosophic clustering algorithm (c-means in [22,23] or k-means in [24]) is used for clustering the uncertain data. Finally, a skin lesion is identified using either cluster statistics [23,24] of the adaptive region growing approach [22].
Despite an apparent lack of dedicated algorithms for ALM segmentation, a few methods for pattern analysis and lesion classification have been proposed. Iyatomi et al. differentiated between acral volar melanomas and nevus using principal component analysis applied to color-, shape-, and texture-related properties of dermoscopic images, as well as developed pattern detectors for typical ALM dermatoscopic patterns using similar features [25]. Abbas et al. proposed a pattern classification method based on color symmetry and multiscale texture analysis in a perceptually uniform colorspace [26]. Recently, Yang et al. developed an automatic algorithm for the detection of furrow and ridge patterns in volar lesions [8]. Iyatomi et al. extracted lesion area using Otsu’s thresholding, Abbas et al. used regions of interest of predefined size, whereas Yang et al. did not perform any kind of lesion segmentation.
2. Methods
Although many algorithms have been proposed for color image segmentation, the number is still not as rich as for gray level images. It has been demonstrated that, for many images, especially with homogeneous background, the region growing algorithms are one of the best solutions [27]. The aim of region-growing algorithms is to start at a seed pixel and expand the area based on the homogeneity criteria. The problem which occurs during the implementation of region growing algorithms is to adjust the local homogeneity criteria and to assess the two adjacent pixels. During our research different segmentation methods based on Otsu’s thresholding algorithm, an active contour model, as well as region growing, have been implemented and verified. The conducted attempts showed either over- or undersegmentation of the skin lesion region. The outcomes for all the implemented methods have been presented in Figure 9. Based on our research, the region adjacency graph algorithm has been chosen for the acral melanoma segmentation.
2.1. Overview
As illustrated in Figure 2, the implemented algorithm is divided into four stages: preprocessing, simple linear iterative clustering algorithm (SLIC)—an oversegmentation method, region adjacency graph construction, and hierarchical merging. In general, using traditional segmentation methods, we obtain an intentionally oversegmented image. The input image is composed of superpixels that describe each region, and each superpixel is connected to its neighbors that succeed the topological operation. The weight of each such a connection (an edge) is defined in terms of a metric based on differences in values of attributes of the connected nodes. Those connections together with their weights form an undirected weighted graph. The graph is created in a structure called Region Adjacency Graph (RAG). The way the nodes are merged is the main characteristic of every re-segmentation approach and is responsible for the success of the method [28]. A similar workflow has already been successfully used to design transfer functions for volume rendering of medical data [29,30] brain tumor segmentation [31,32,33], as well as segmentation of muscle fibers [34].
2.2. Image Pre-Processing
The use of immersion fluids can provide better visual effects and improve the diagnostic accuracy of dermoscopic examinations. However, during the image acquisition, the artifacts like air bubbles and the surplus of the immersion oil become visible. Therefore, the very first steps in our image analysis system is the preprocessing stage which aims at reducing the amount of artifacts and noise to obtain the best quality of the input image. In order to mitigate the detrimental effects of air bubbles, we use the square-shaped median smoothing filter with the mask size proportional to the image size as proposed in [15]. The mask size n for an image of size is defined as:
Before the dermoscopic images can be used for the segmentation step, the black frame introduced during the digitization process must be removed. For a fast and efficient black frame removal step, an RGB image is first converted to the HSL (hue, saturation and luminance) color space. A pixel is considered to be black when the lightness component of the HSL color space is less than 15 [7]. The preprocessing step increases not only the accuracy of the border detection but also reduces the computation time of the whole method.
2.3. Oversegmentation
The purpose of the first step of the segmentation algorithm is to group local regions by oversegmenting the image. In our solution, we use the simple linear iterative clustering algorithm (SLIC) which performs k-means in the 5d space defined by both the , , values of the CIELAB colorspace and x, y coordinates of the pixels to create superpixels [35,36]. Superpixel algorithms group pixels into not only perceptual, but semantic meanings of an image. The mapping from pixel grids to superpixels holds the desirable properties of computational efficiency, perceptual meaningfulness and oversegmentation, which means that most of important boundaries in the image are found. To perform the SLIC operation the following parameters must be adjusted: K—the number of segments (superpixels), —the width of Gaussian smoothing kernel, and compactness—a parameter that balances the color-space proximity with image space-proximity. As the number of superpixel is given, each superpixel will have approximately pixels. For each superpixel, at regular grid intervals, cluster centers are chosen based on the following equation:
As the Euclidean distance is not suitable for bigger distances in CIELAB colorspace, the following distance, , has been applied:
The size of each superpixel is where N is the size of the image and K refers to the number of superpixels. The center of the superpixel is defined as . Parameter m is responsible for the compactness of the superpixel and was set to 10. At the beginning, the algorithm samples K regularly spaced cluster centers and moves them to seed locations based on the lowest gradient position in a neighborhood. Each pixel is assigned to its nearest cluster center whose search area overlaps this pixel. After all the pixels are combined with the nearest cluster center, a new center is computed [36].
Figure 3 shows how similar regions of the image are grouped in superpixels depending on the number of segments and compactness.
2.4. Region Adjacency Graph
In the previous step, we intentionally oversegmented the acral melanoma image. The SLIC algorithm (as most of the segmentation algorithms) tends to favor small regions of similar color and properties. Medical images tend to be complex by nature and often contain several regions with different shades of the same color that need to be differentiated. Accurate skin lesion segmentation on dermoscopy images is difficult due to the following two main challenges: (i) the appearance patterns vary a lot around the lesion boundary across patients and (ii) the intensity distributions highly vary across different lesion types. An efficient merging algorithm is required to connect adjacent and similar regions into correctly segmented objects. A region adjacency graph (RAG) has been chosen to analyze relationships between those regions. Figure 4a presents the outcome of the SLIC algorithm which generates an over-segmentation, on which the RAG graph is built. Each superpixel region has a yellow edge. Each superpixel region is considered a vertex in a graph (Figure 4b). The edges between the first and the second superpixels have been coloured depending on their weight. The edges between similar regions are dark, whereas edges between dissimilar regions are purple. Each region is connected to all its immediate neighbors and the weight of such a connection is proportional to the similarity between the two regions, as has been proposed by Tremeau in [27]. Each region is represented by two color distribution metrics: and , where is the mean color value of the set of pixels in the region while is the standard deviation:
The weight of an edge which connects two regions and is calculated using the Fisher distance:
where refers to the set of pixels in each region.
After applying the algorithm, a graph similar to the one shown in Figure 5 is constructed.
2.5. Hierarchical Merging
A region adjacency graph created in the previous step represents an oversegmented image. Objects are divided into regions smaller than necessary or even incorrectly for the final outcome. There are a few techniques to merge small regions into a bigger one, such as normalized cut, thresholding edge weights, and hierarchical merging. The hierarchical merging algorithm chooses the smallest weighing edge and combines the regions it connects into a new one preserving the adjacency of the new region to all neighbours of the two merged regions (weights of the new connections are updated accordingly) [37]. The algorithm continuous to merge regions until the minimum edge weight in the graph is more than the given threshold value. In contrast with the normalized cut [38], the hierarchical merging algorithm follows the bottom-up approach. The hierarchical merging algorithm is faster and resistant to different image segmentation approaches in contrast to normalized cut, which requires parameter adjustment. Figure 6 shows an example of the hierarchical merging process. We can observe that the oversegmented area is merged into regions of similar properties.
3. Results
3.1. Image Database
The proposed segmentation method has been tested on color dermoscopic images from a widely used Interactive Atlas of Dermoscopy [2]. Images for this atlas have been provided by two university hospitals (University of Naples, Italy, and University of Graz, Austria) and stored on a CD-ROM in the JPEG format. The documentation of each dermoscopic image was performed using a Dermaphot apparatus (Heine, Optotechnik, Herrsching, Germany) and a photo camera (Nikon F3, Nikon Corporation, Tokyo Prefecture, Japan) mounted on a stereomicroscope (Wild M650, Heerbrugg AG, Switzerland) in order to produce digitized ELM images of skin lesions. Database images have been assessed manually by a dermoscopic expert with an extensive clinical experience. The database included 134 cases with different types of acral melanocytic lesions including melanoma. Dermoscopy color images have different resolutions, ranging from 0.033 to 0.5 mm/px. Figure 7 presents samples from our database.
3.2. Statistical Analysis
The performance of the acral skin lesion segmentation approach based on the RAG algorithm can be assessed based on the analysis of the Sørensen index also known as the dice similarity coefficient (DSC), which is a statistic used to compare the similarity of two samples [39]. The DSC is calculated based on two binary sets, X and Y, as follows:
The DSC is frequently used as a statistical measure which calculates the degree of overlapping between the experimental segmentation and the manual segmentation. Using the definition of true positive (TP), false positive (FP), and false negative (FN), it can be re-written as:
In our case, TP denotes acral lesion pixels, FP—omitted acral lesion pixels, and FP—healthy skin pixels classified as an acral lesion.
Furthermore, precision (PRC), accuracy (ACC), sensitivity (SE), and specificity (SP) are calculated using the following equations:
Precision describes random errors while accuracy is more commonly systematic errors (statistical bias):
Table 1 compares segmentation results obtained with the implemented algorithm (RAG) and other common segmentation approaches including region growing (RG), Otsu’s method (Otsu), and active contour model (ACM). Our proposed method is able to correctly detect the acral lesions while most of the other methods tend to oversegment the area. The proposed algorithm achieved an average DSC of 0.85, accuracy 0.91, precision 0.89, sensitivity 0.87, and specificity 0.88. Only 12 images were scored less than 0.7 with the proposed algorithm.
Figure 8 illustrates the obtained results of the proposed segmentation algorithm based on the region adjacency graphs when applied to the test images. At the beginning, the medical image undergoes the pre-processing step. The first step of the segmentation process includes the SLIC oversegmentation with superpixels’ detection; results of these step are presented in the third column of Figure 8. Afterwards, the RAG construction algorithm which connects the oversegmented regions with calculated weights has been applied (the 4th column). The merging process is necessary to achieve the balance between over- and undersegmentation (the 5th column). Considering the obtained results presented in the last column of Figure 8, it can be reported that the implemented algorithm is very effective in detecting the acral melanomas on the dermoscopic image datasets. Furthermore, unlike many previously published dermatoscopic segmentation algorithms, it can handle multiple lesions (Figure 8d).
3.3. Comparison with Other Segmentation Methods
As no previous attempts to the segmentation of acral melanoma have been described in literature, we would like to compare our method with other well-known segmentation algorithms and summarize how our work differs from them. We compared the proposed RAG-based segmentation approach with three popular low-level image segmentation methods including region growing (RG), Otsu’s method (Otsu), and active contour model (ACM). The RG algorithm is a seeded region-growing algorithm which is designed to segment healthy skin around skin lesion in dermoscopy image. For the segmentation of skin lesion, we select one seed which is located in the left corner on the healthy skin. It gives us the certainty that we will separate the homogeneous background from the skin mole [7,40]. We use the Chan–Vese (CV) active contour algorithm with the following parameters: mask function—large with a general CV method [41]. For the RAG algorithm, two parameters have to be adjusted. Firstly, the amount of superpixels has been set to 400. The more regions, the longer the merging process lasts. The second parameter is the threshold value for the merging algorithm. Setting a very low threshold will not merge any regions and will give us back the original image. A very large threshold on the other hand would merge all regions and return the image as just one big blob. While the difference between the health skin and the skin lesion is still significant, the parameter could be adjusted during a few experiments. As it is difficult to obtain good segmentation outcome, and the definition of ‘good’ often depends on the application, these methods are usually used for obtaining the first impression of the arose problem before building a more sophisticated detection system. The results presented in Table 1 indicate that the proposed approach is very efficient in segmenting the acral melanomas. Furthermore, we observed that the implemented algorithm has been more robust to varying lighting conditions and permanent changes to the foreground (an acral lesion) than the remaining algorithms. It can be established that, for most of the image cases, the RAG-based segmentation procedure offered better results than the RG, Otsu, and ACM. For the evaluation of the advantages and correctness of the implemented algorithm, we present a few outcomes after applying the described solution and other segmentation methods (Figure 9).
4. Conclusions
In this paper, we presented an acral skin lesion segmentation algorithm based on a region adjacency graph. We obtain a superpixel oversegmentation of a lesion image by performing clustering in a space defined by coordinates of CIELAB color space and spatial coordinates of the image. We then use this superpixel representation to construct a region adjacency graph based on a similarity measure. Finally, we perform hierarchical region merging to obtain the ultimate segmentation result. Experimental results show that the proposed method outperforms other low-level segmentation approaches. The results also suggest that the computational approach towards lesion segmentation yields more robust output than manual segmentation by dermatologists [10,42,43]. Therefore, we believe that our method could help improve the accuracy of other diagnostic algorithms for acral melanoma detection. In our future research, we will concentrate on the analysis of dermoscopic patterns found in ALM and test deep learning algorithms for the ALM segmentation [44].
Author Contributions
Formal analysis, J.J.-K.; Methodology, J.J.-K.; Project administration, J.J.-K.; Software, J.J.-K.; Resources, J.J.-K. and P.K., Writing—Original draft, J.J.-K. and P.K., Writing—Review and editing, J.J.-K. and P.K.
Funding
This scientific work was supported by AGH University of Science and Technology research grant on Decision no. 15.11.120.735, 15.11.120.635 to J. Jaworek-Korjakowska and 5.11.120.628 to P. Kleczek.
Conflicts of Interest
The authors declare no conflict of interest.
References
- Garbe, C.; Leiter, U. Melanoma epidemiology and trends. Clin. Dermatol. 2009, 27, 3–9. Available online: http://www.ncbi.nlm.nih.gov/pubmed/19095149 (accessed on 10 March 2018). [CrossRef] [PubMed]
- Argenziano, G.; Soyer, P.; Giorgio, V.D.; Piccolo, D.; Carli, P.; Delfino, M.; Ferrari, A.; Hofmann-Wellenhof, R.; Massi, D.; Mazzocchetti, G.; et al. Interactive Atlas of Dermoscopy; Book and CD/Web Resource; Edra Medical Publishing and New Media: Milan, Italy, 2000. [Google Scholar]
- Saida, T.; Oguchi, S.; Miyazaki, A. Dermoscopy for acral pigmented skin lesions. Clin. Dermatol. 2002, 20, 279–285. [Google Scholar] [CrossRef]
- Saida, T.; Oguchi, S.; Ishihara, Y. In vivo observation of magnified features of pigmented lesions on volar skin using video macroscope. Usefulness of epiluminescence techniques in clinical diagnosis. Arch. Dermatol. 1995, 131, 298–304. [Google Scholar] [CrossRef] [PubMed]
- Saida, T.; Miyazaki, A.; Oguchi, S.; Ishihara, Y.; Yamazaki, Y.; Murase, S.; Yoshikawa, S.; Tsuchida, T.; Kawabata, Y.; Tamaki, K. Significance of dermoscopic patterns in detecting malignant melanoma on acral volar skin: Results of a multicenter study in Japan. Arch. Dermatol. 2004, 140, 1233–1238. [Google Scholar] [CrossRef] [PubMed]
- Argenziano, G.; Soyer, H.; Chimenti, S.; Talamini, R.; Corona, R.; Sera, F.; Binder, M.; Cerroni, L.; Rosa, G.D.; Ferrara, G.; et al. Dermoscopy of pigmented skin lesions: Results of a consensus meeting via the Internet. J. Am. Acad. Dermatol. 2003, 48, 679–693. [Google Scholar] [CrossRef] [PubMed]
- Jaworek-Korjakowska, J.; Kłeczek, P. Automatic Classification of Specific Melanocytic Lesions Using Artificial Intelligence. BioMed Res. Int. 2016, 2016, 1–17. [Google Scholar] [CrossRef] [PubMed]
- Yang, S.; Oh, B.; Hahm, S.; Chung, K.Y.; Lee, B.U. Ridge and furrow pattern classification for acral lentiginous melanoma using dermoscopic images. Biomed. Signal Process. Control 2017, 32, 90–96. [Google Scholar] [CrossRef]
- Iyatomi, H.; Oka, H.; Celebi, M.; Hashimoto, M.; Hagiwara, M.; Tanaka, M.; Ogawa, K. An improved Internet-based melanoma screening system with dermatologist-like tumor area extraction algorithm. Comput. Med. Imaging Graph. 2008, 32, 566–579. [Google Scholar] [CrossRef] [PubMed]
- Celebi, M.E.; Schaefer, G.; Iyatomi, H.; Stoecker, W.V. Lesion Border Detection in Dermoscopy Images. Comput. Med. Imaging Graph. 2009, 33, 148–153. [Google Scholar] [CrossRef] [PubMed]
- Celebi, M.E.; Wen, Q.; Iyatomi, H.; Shimizu, K.; Zhou, H.; Schaefer, G. A State-of-the-Art Survey on Lesion Border Detection in Dermoscopy Images. In Dermoscopy Image Analysis, 1st ed.; Celebi, M.E., Mendonca, T., Marques, J.S., Eds.; CRC Press: Boca Raton, FL, USA, 2015; Chapter 4; pp. 97–129. [Google Scholar]
- Garnavi, R.; Aldeen, M.; Celebi, M.E.; Varigos, G.; Finch, S. Border detection in dermoscopy images using hybrid thresholding on optimized color channels. Comput. Med. Imaging Graph. 2011, 35, 105–115. [Google Scholar] [CrossRef] [PubMed]
- Emre Celebi, M.; Quan, W.; Sae, H.; Hitoshi, I.; Gerald, S. Lesion Border Detection in Dermoscopy Images Using Ensembles of Thresholding Methods. Skin Res. Technol. 2012, 19, 252–258. [Google Scholar] [CrossRef] [PubMed]
- Peruch, F.; Bogo, F.; Bonazza, M.; Cappelleri, V.M.; Peserico, E. Simpler, Faster, More Accurate Melanocytic Lesion Segmentation Through MEDS. IEEE Trans. Biomed. Eng. 2014, 61, 557–565. [Google Scholar] [CrossRef] [PubMed]
- Celebi, E.; Kingravi, H.A.; Iyatomi, H.; Aslandogan, Y.A.; Stoecker, W.V.; Moss, R.H.; Menzies, S.W. Border detection in dermoscopy images using statistical region merging. Skin Res. Technol. 2008, 14, 347–353. [Google Scholar] [CrossRef] [PubMed] [Green Version]
- Silveira, M.; Nascimento, J.C.; Marques, J.S.; Marcal, A.R.S.; Mendonca, T.; Yamauchi, S.; Maeda, J.; Rozeira, J. Comparison of Segmentation Methods for Melanoma Diagnosis in Dermoscopy Images. IEEE J. Sel. Top. Signal Process. 2009, 3, 35–45. [Google Scholar] [CrossRef]
- Hitoshi, I.; Hiroshi, O.; Xiaohe, C. Unsupervised border detection in dermoscopy images. Skin Res. Technol. 2007, 13, 454–462. [Google Scholar] [CrossRef] [Green Version]
- Erkol, B.; Moss, R.H.; Stanley, R.; Stoecker, W.V.; Hvatum, E. Automatic lesion boundary detection in dermoscopy images using gradient vector flow snakes. Skin Res. Technol. 2005, 11, 17–26. [Google Scholar] [CrossRef] [PubMed] [Green Version]
- Ma, Z.; Tavares, J.M.R. A novel approach to segment skin lesions in dermoscopic images based on a deformable model. IEEE J. Biomed. Health Inform. 2016, 20, 615–623. [Google Scholar] [CrossRef] [PubMed]
- Bi, L.; Kim, J.; Ahn, E.; Kumar, A.; Fulham, M.; Feng, D. Dermoscopic Image Segmentation via Multistage Fully Convolutional Networks. IEEE Trans. Biomed. Eng. 2017, 64, 2065–2074. [Google Scholar] [CrossRef] [PubMed]
- Bozorgtabar, B.; Sedai, S.; Roy, P.K.; Garnavi, R. Skin lesion segmentation using deep convolution networks guided by local unsupervised learning. IBM J. Res. Dev. 2017, 61, 1–8. [Google Scholar] [CrossRef]
- Guo, Y.; Ashour, A.S.; Smarandache, F. A Novel Skin Lesion Detection Approach Using Neutrosophic Clustering and Adaptive Region Growing in Dermoscopy Images. Symmetry 2018, 10, 119. [Google Scholar] [CrossRef]
- Ashour, A.S.; Guo, Y.; Kucukkulahli, E.; Erdogmus, P.; Polat, K. A hybrid dermoscopy images segmentation approach based on neutrosophic clustering and histogram estimation. Appl. Soft Comput. 2018, 69, 426–434. [Google Scholar] [CrossRef]
- Ashour, A.S.; Refaat Hawas, A.; Guo, Y.; Wahba, M. A novel optimized neutrosophic k-means using genetic algorithm for skin lesion detection in dermoscopy images. Signal Image Video Process. 2018. [Google Scholar] [CrossRef]
- Iyatomi, H.; Oka, H.; Celebi, M.E.; Ogawa, K.; Argenziano, G.; Soyer, H.P.; Koga, H.; Saida, T.; Ohara, K.; Tanaka, M. Computer-Based Classification of Dermoscopy Images of Melanocytic Lesions on Acral Volar Skin. J. Investig. Dermatol. 2008, 128, 2049–2054. [Google Scholar] [CrossRef] [PubMed]
- Abbas, Q.; Celebi, M.E.; Serrano, C.; Garcia, I.F.; Ma, G. Pattern classification of dermoscopy images: A perceptually uniform model. Pattern Recognit. 2013, 46, 86–97. [Google Scholar] [CrossRef]
- Tremeau, A.; Colantoni, P. Regions Adjacency Graph Applied To Color Image Segmentation. IEEE Trans. Image Process. 2000, 9, 735–744. [Google Scholar] [CrossRef] [PubMed]
- Korting, T.; Fonseca, L.; Dutra, L.; Silva, F. A New Graph-Based Approach for Urban Image Segmentation. In Proceedings of the 16th International Conference in Central Europe on Computer Graphics, Visualization and Computer Vision, Bory, Czech Republic, 4–7 February 2008. [Google Scholar]
- Nguyen, B.P.; Tay, W.L.; Chui, C.K.; Ong, S.H. A clustering-based system to automate transfer function design for medical image visualization. Vis. Comput. 2012, 28, 181–191. [Google Scholar] [CrossRef]
- Cai, L.; Tay, W.L.; Nguyen, B.P.; Chui, C.K.; Ong, S.H. Automatic transfer function design for medical visualization using visibility distributions and projective color mapping. Comput. Med. Imaging Graph. 2013, 37, 450–458. [Google Scholar] [CrossRef] [PubMed]
- Chen, X.; Nguyen, B.P.; Chui, C.K.; Ong, S.H. Automated brain tumor segmentation using kernel dictionary learning and superpixel-level features. In Proceedings of the 2016 IEEE International Conference on Systems, Man, and Cybernetics (SMC), Budapest, Hungary, 9–12 October 2016; pp. 002547–002552. [Google Scholar] [CrossRef]
- Chen, X.; Nguyen, B.P.; Chui, C.; Ong, S. Reworking Multilabel Brain Tumor Segmentation: An Automated Framework Using Structured Kernel Sparse Representation. IEEE Syst. Man Cybern. Mag. 2017, 3, 18–22. [Google Scholar] [CrossRef]
- Chen, X.; Nguyen, B.P.; Chui, C.K.; Ong, S.H. An Automated Framework for Multi-label Brain Tumor Segmentation based on Kernel Sparse Representation. IEEE Syst. Man Cybern. Mag. 2017, 14, 25–43. [Google Scholar]
- Nguyen, B.P.; Heemskerk, H.; So, P.T.C.; Tucker-Kellogg, L. Superpixel-based segmentation of muscle fibers in multi-channel microscopy. BMC Syst. Biol. 2016, 10, 124. [Google Scholar] [CrossRef] [PubMed]
- Ren, X.; Malik, J. Learning a classification model for segmentation. In Proceedings of the Ninth IEEE International Conference on Computer Vision, Nice, France, 13–16 October 2003; Volume 1. [Google Scholar]
- Achanta, R.; Shaji, A.; Smith, K.; Lucchi, A.; Fua, P.; Süsstrunk, S. SLIC Superpixels Compared to State-of-the-Art Superpixel Methods. IEEE Trans. Pattern Anal. Mach. Intell. 2012, 34, 2274–2282. [Google Scholar] [CrossRef] [PubMed] [Green Version]
- Eads, D. Hcluster: Hierarchical Clustering for SciPy. 2008. Available online: www.scipy-cluster.googlecode.com (accessed on 10 March 2018).
- Shi, J.; Malik, J. Normalized Cuts and Image Segmentation. IEEE Trans. Pattern Anal. Mach. Intell. 2000, 22, 888–905. [Google Scholar] [CrossRef]
- Sørensen, T. A Method of Establishing Groups of Equal Amplitude in Plant Sociology Based on Similarity of Species and Its Application to Analyses of the Vegetation on Danish Commons. Kongelige Danske Videnskabernes Selskab 1948, 5, 1–34. [Google Scholar]
- Jaworek-Korjakowska, J. Computer-aided diagnosis of micro-malignant melanoma lesions applying support vector machines. BioMed Res. Int. 2016, 1–8. [Google Scholar] [CrossRef] [PubMed]
- Chan, T.F.; Vese, L.A. Active contours without edges. IEEE Trans. Image Process. 2001, 10, 266–277. [Google Scholar] [CrossRef] [PubMed] [Green Version]
- Wighton, P.; Sadeghi, M.; Lee, T.K.; Atkins, M.S. A Fully Automatic Random Walker Segmentation for Skin Lesions in a Supervised Setting. In Medical Image Computing and Computer-Assisted Intervention—MICCAI 2009; Yang, G.Z., Hawkes, D., Rueckert, D., Noble, A., Taylor, C., Eds.; Springer: Berlin/Heidelberg, Germany, 2009; pp. 1108–1115. [Google Scholar]
- Zortea, M.; Skrovseth, S.O.; Schopf, T.R.; Kirchesch, H.M.; Godtliebsen, F. Automatic Segmentation of Dermoscopic Images by Iterative Classification. Int. J. Biomed. Imaging 2011, 2011, 972648. [Google Scholar] [CrossRef] [PubMed]
- Yu, L.; Chen, H.; Dou, Q.; Qin, J.; Heng, P. Automated Melanoma Recognition in Dermoscopy Images via Very Deep Residual Networks. IEEE Trans. Med. Imaging 2017, 36, 994–1004. [Google Scholar] [CrossRef] [PubMed]
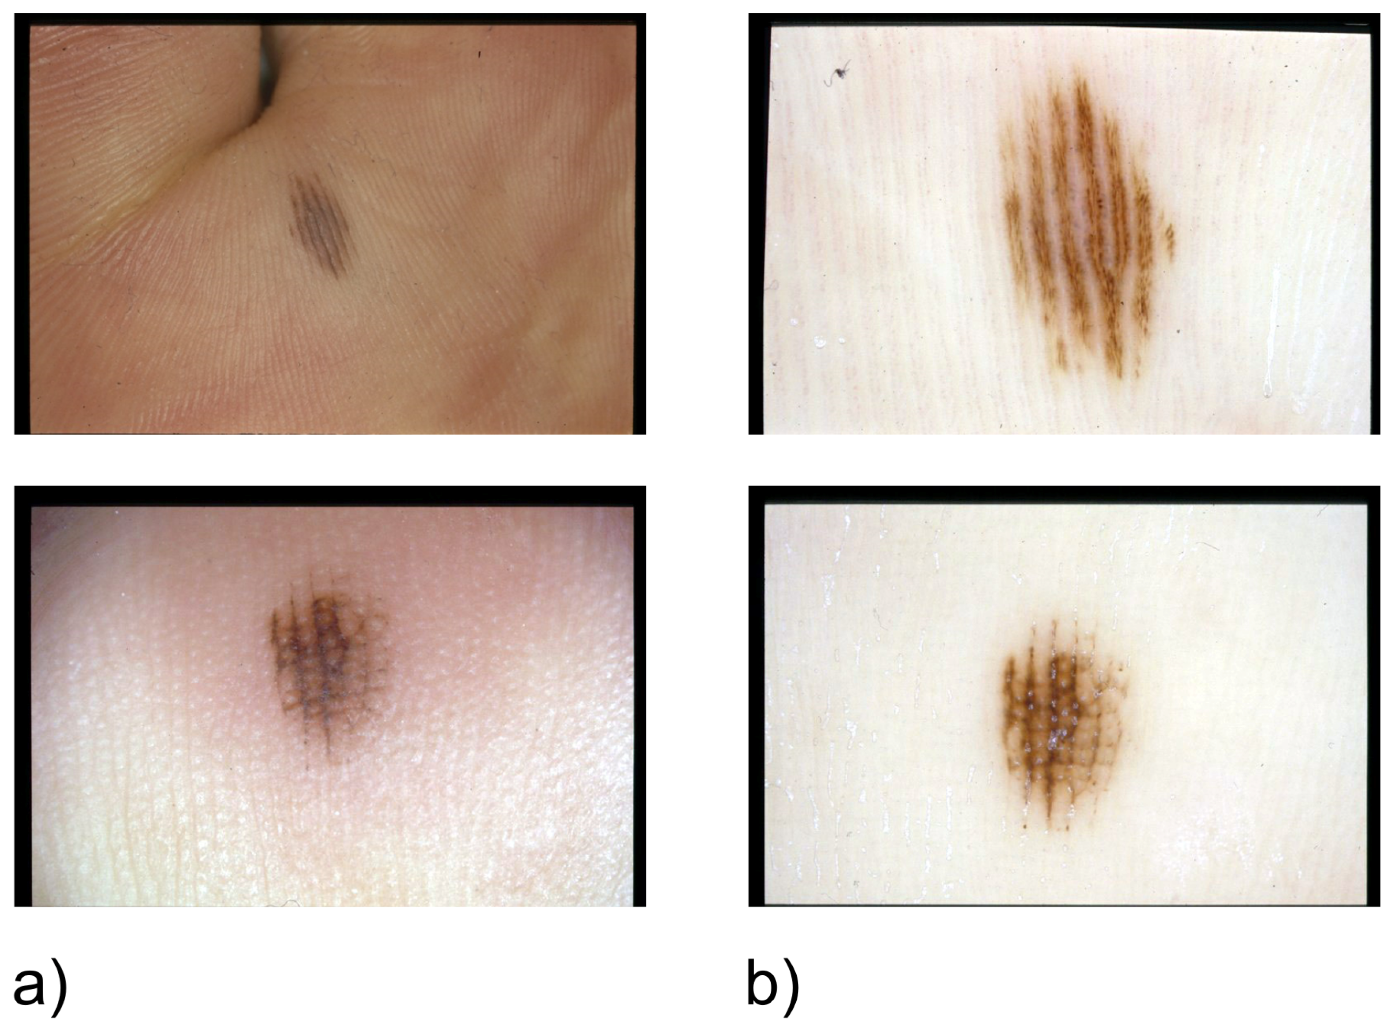
Figure 1.
Examples of dermoscopic images showing acral melanocytic lesions.

Figure 2.
Illustration of the proposed system: (Image processing) involves air bubble smoothing and black frame removal; (Simple Linear Interactive Clustering) small homogeneous region grouping by oversegmenting the medical image; (Region Adjacency Graph) construction of RAG for the oversegmented image with assigning appropriate weights; (Segmentation) hierarchical region merging based on a given criteria.

Figure 3.
Applying SLIC segmentation to generate oversegmented regions: (a) 50 superpixels; (b) 200 superpixels; (c) 400 superpixels; and (d) 800 superpixels.
Figure 3.
Applying SLIC segmentation to generate oversegmented regions: (a) 50 superpixels; (b) 200 superpixels; (c) 400 superpixels; and (d) 800 superpixels.

Figure 4.
Spatial views of region relationships: (a) region partitioning by SLIC algorithm; (b) region adjacency graph.
Figure 4.
Spatial views of region relationships: (a) region partitioning by SLIC algorithm; (b) region adjacency graph.

Figure 5.
Region adjacency graph.

Figure 6.
Visualization of two steps of the hierarchical merging algorithm: (a) oversegmented area including four regions ; (b) the first merging step ; (c) the second merging step .
Figure 6.
Visualization of two steps of the hierarchical merging algorithm: (a) oversegmented area including four regions ; (b) the first merging step ; (c) the second merging step .

Figure 7.
Database examples.

Figure 8.
Results obtained with a RAG-based segmentation approach: (a) image pre-segmented with the SLIC algorithm; (b) visualization of the RAG for oversegmented regions; (c) hierarchical merging outcome; (d) final contour of the RAG-based segmentation method.
Figure 8.
Results obtained with a RAG-based segmentation approach: (a) image pre-segmented with the SLIC algorithm; (b) visualization of the RAG for oversegmented regions; (c) hierarchical merging outcome; (d) final contour of the RAG-based segmentation method.

Figure 9.
Segmentation results obtained using different approaches: (a) active contour model; (b) region growing; (c) Otsu’s thresholding algorithm; (d) RAG-based segmentation.
Figure 9.
Segmentation results obtained using different approaches: (a) active contour model; (b) region growing; (c) Otsu’s thresholding algorithm; (d) RAG-based segmentation.


Table 1.
A comparison between implemented RAG algorithm and various segmentation methods.
| DSC | ACC | PRC | SE | SP | |
|---|---|---|---|---|---|
| RAG | 0.85 | 0.91 | 0.89 | 0.93 | 0.89 |
| RG | 0.81 | 0.83 | 0.85 | 0.87 | 0.88 |
| Otsu | 0.69 | 0.72 | 0.79 | 0.81 | 0.76 |
| ACM | 0.76 | 0.79 | 0.72 | 0.67 | 0.81 |
© 2018 by the authors. Licensee MDPI, Basel, Switzerland. This article is an open access article distributed under the terms and conditions of the Creative Commons Attribution (CC BY) license (http://creativecommons.org/licenses/by/4.0/).
Share and Cite
MDPI and ACS Style
Jaworek-Korjakowska, J.; Kleczek, P. Region Adjacency Graph Approach for Acral Melanocytic Lesion Segmentation. Appl. Sci. 2018, 8, 1430. https://doi.org/10.3390/app8091430
AMA Style
Jaworek-Korjakowska J, Kleczek P. Region Adjacency Graph Approach for Acral Melanocytic Lesion Segmentation. Applied Sciences. 2018; 8(9):1430. https://doi.org/10.3390/app8091430
Chicago/Turabian StyleJaworek-Korjakowska, Joanna, and Pawel Kleczek. 2018. "Region Adjacency Graph Approach for Acral Melanocytic Lesion Segmentation" Applied Sciences 8, no. 9: 1430. https://doi.org/10.3390/app8091430
Note that from the first issue of 2016, this journal uses article numbers instead of page numbers. See further details here.