Article

An Approach to Participatory Business Process Modeling: BPMN Model Generation Using Constraint Programming and Graph Composition

AGH University of Science and Technology, Faculty of Electrical Engineering, Automatics, Computer Science and Biomedical Engineering, Department of Applied Computer Science, al. A. Mickiewicza 30, 30-059 Krakow, Poland
*
Author to whom correspondence should be addressed.
Appl. Sci. 2018, 8(9), 1428; https://doi.org/10.3390/app8091428
Submission received: 13 July 2018 / Revised: 3 August 2018 / Accepted: 17 August 2018 / Published: 21 August 2018
(This article belongs to the Special Issue Applied Sciences Based on and Related to Computer and Control)

Abstract

:
Designing business process models plays a vital role in business process management. The acquisition of such models may consume up to 60% of the project time. This time can be shortened using methods for the automatic or semi-automatic generation of process models. In this paper, we present a user-friendly method of business process composition. It uses a set of predefined constraints to generate a synthetic log of the process based on a simplified, unordered specification, which describes activities to be performed. Such a log can be used to generate a correct BPMN model. To achieve this, we propose the use of one of the existing process discovery algorithms or executing the activity graph-based composition algorithm, which generates the process model directly from the input log file. The proposed approach allows process participants to take part in process modeling. Moreover, it can be a support for business analysts or process designers in visualizing the workflow without the necessity to design the model explicitly in a graphical editor. The BPMN diagram is generated as an interchangeable XML file, which allows its further modification and adjustment. The included comparative analysis shows that our method is capable of generating process models characterized by high flow complexity and can support BPMN constructs, which are sufficient for about 70% of business cases.

1. Introduction

Business process models are intended to be bridges between technical and business people. They are used to describe sequential, parallel, as well as alternative workflows within an organization, which aim to achieve the required goals. Visualizations of processes make them much easier to comprehend than textual descriptions. Therefore, associations such as the Object Management Group (see: http://www.omg.org/) make an effort to create universal and comprehensive standards for the visual design of process, decision and software models [1,2,3]. A properly-designed model does not require major enhancements as long as there are no significant changes in the process. However, as requirements for modern software systems, as well as organizational structures in companies are constantly changing, there is a general need to redesign processes frequently. Thus, it is crucial to use an efficient modeling approach.
Because processes are often modeled manually by designers, the time spent on process acquisition can be shortened when prototypes of the models are generated. The aim of this work is to simplify the business process modeling phase by significantly limiting the number of iterations between the designer of the process and its participants. Our method tends to automate the modeling process by merging data provided by multiple process participants into a semi-structured form, as well as describing algorithms that transform this specification into a visual form.
The approach presented in this paper is related to various research areas such as business process modeling, process planning, as well as constraint programming. Figure 1 presents an overview of the proposed method. It describes the sequence in which data collected from different process participants are merged to generate a BPMN diagram. This paper introduces the approach, describes briefly its two first phases and is focused on the third and fourth phase of the approach, i.e., BPMN model generation.
In the first phase, all the process participants are given a spreadsheet-based form to insert information about executed tasks, along with the conditions and effects of their execution. Then, the files are merged into one specification where the consistency and uniformity of task names, as well as used data entities should be assured. In the next step, the specification is formalized as a Constraint Satisfaction Problem (CSP) and is passed to a constraint solver in order to generate a synthetic workflow log (or simply log) of the process. Such a log, which is a set of all admissible execution sequences, is then used to generate a final model by one of two different methods, namely process mining (Phase IVa) and graph-based model composition (Phase IVb).
This paper is organized as follows: In Section 2, we provide an overview of business process modeling along with a brief specification of BPMN, which is the notation used in our approach. In Section 3, we present related works in the area of process planning and transforming declarative models into an imperative form. The concept of gathering process data to form its declarative specification is presented in Section 4. Section 5 describes the constraint-based model, which is used to generate a set of synthetic traces of the analyzed process, while in Section 6, we present two ways of composing a BPMN diagram based on the generated log. The detailed specification of our approach was evaluated in Section 7 in terms of its ability to support complex process flows, as well as different BPMN constructs. Our idea is summarized in concluding remarks presented in Section 8.

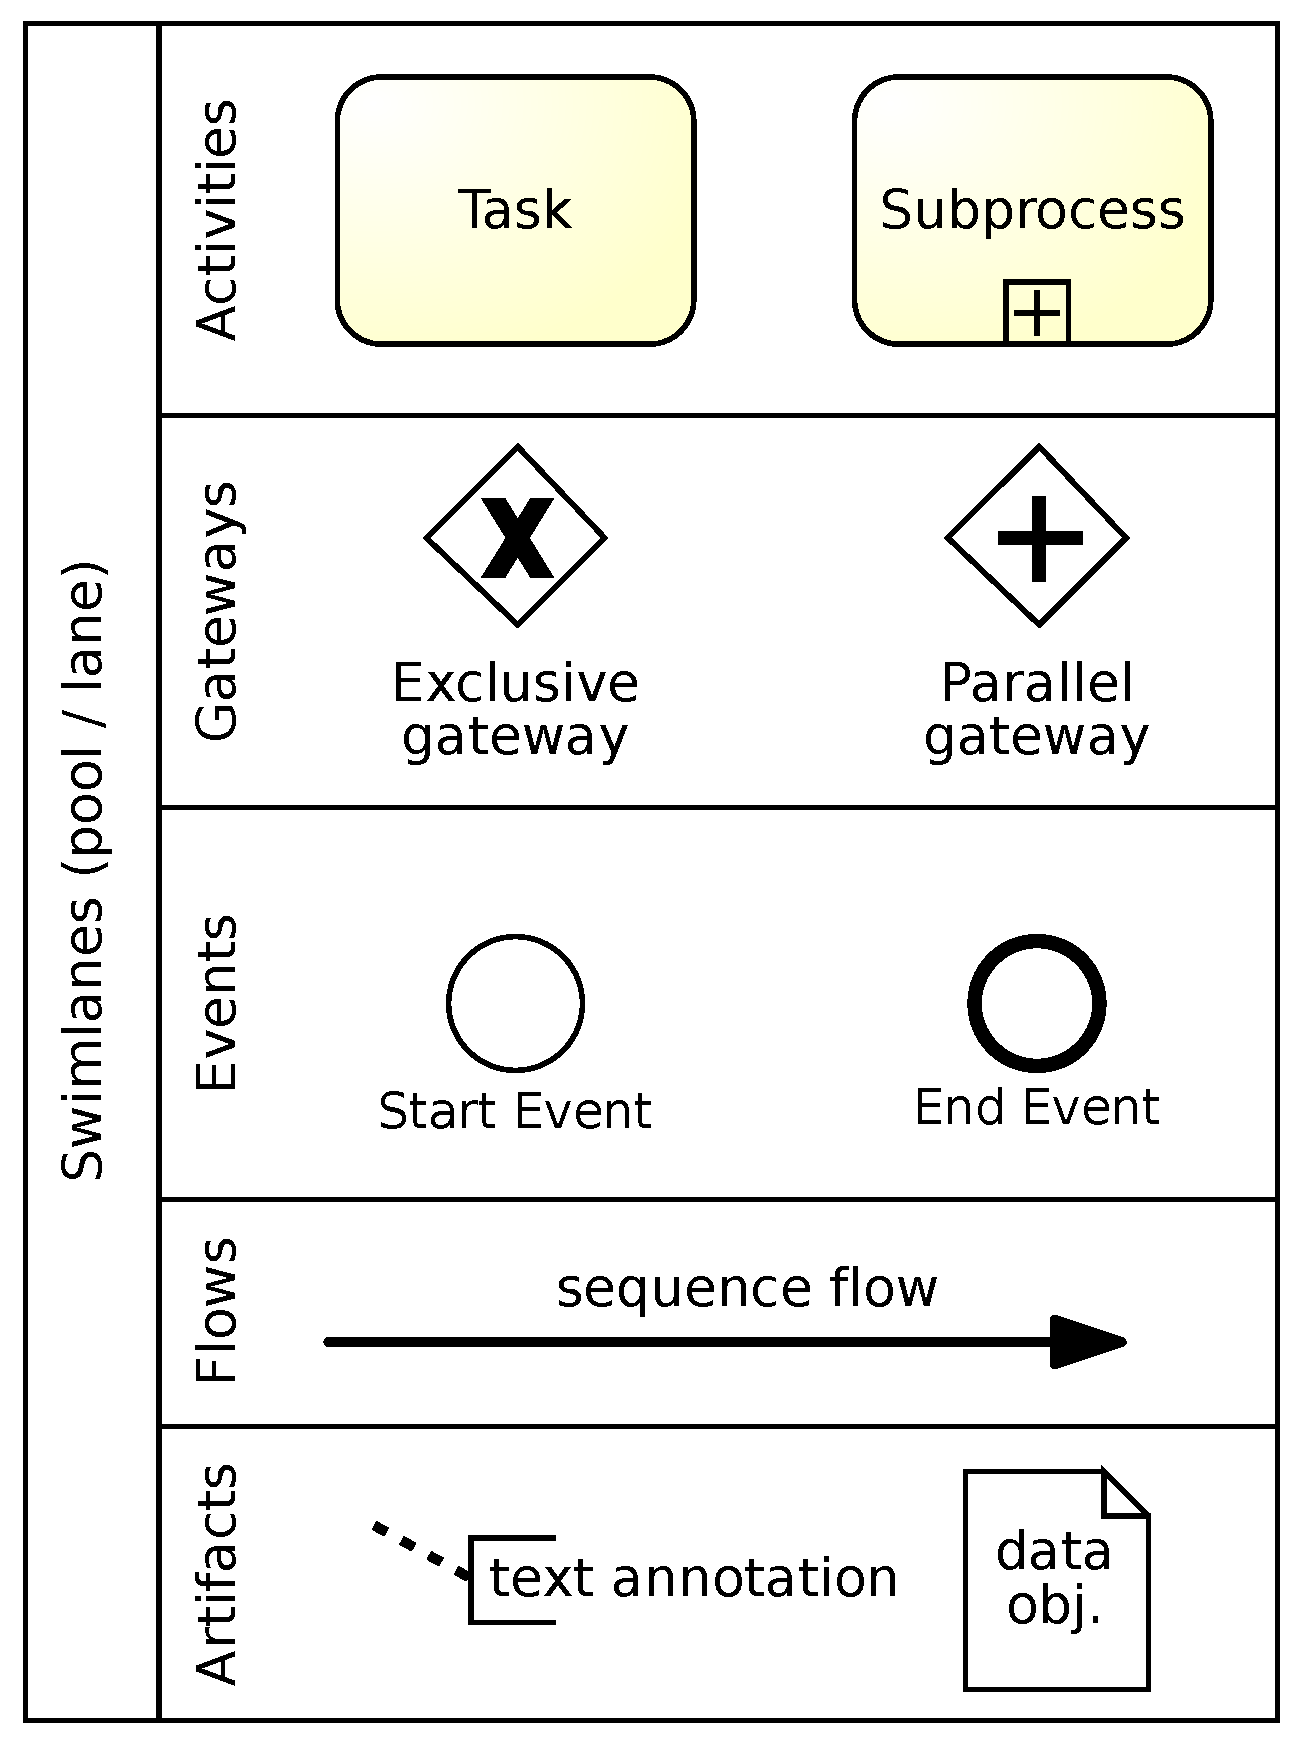
2. Business Process Modeling with BPMN

Business Process Management (BPM) [4] is a holistic approach to improving organization’s workflow focusing on re-engineering of processes. Its goal is to optimize procedures and increase efficiency and effectiveness by constant process improvement. Thus, BPM is often considered as a legacy or the next step after workflows [5], which are often defined in terms of automation of business processes during which documents, information or tasks are passed from one participant to another for action.
However, BPM supports business processes using methods, techniques and software in the design, execution, control and analysis of processes involving humans, organizations, applications, documents and other information sources [6].
As BPM is restricted to operational processes, excluding processes that cannot be made explicit, its key aspect is a business process [7]. A business process is often described as a collection of related activities transforming different kinds of inputs into outputs. The main output of the whole process is mainly considered as a product or service, which constitutes a customer value.
Although there are many process modeling languages [8], Business Process Model and Notation (BPMN) [1], adopted and maintained by the OMGgroup, is one of the most widely-used notations for modeling processes.
Business Process Model and Notation (BPMN) [1] contains a set of graphical elements for constructing diagrams depicting the components of the process and the way it should be executed. The present BPMN 2.0 version of the specification enables process engineers and business analysts to design process, choreography, as well as collaboration models. However, the most popular are process models [9], and these will be used in our approach.
The basic subset of BPMN elements is presented in Figure 2. It contains activities that represent tasks executed within the process. This notation allows also for modeling data and control flow, including splits and joins of execution paths, conditional operations, loops, event-triggered actions, paths and communication processes. Activities, gateways and events constitute flow objects, which can be connected by sequence flows determining the order of task execution.
There are various ways of modeling more advanced or complex constructs in BPMN, e.g., time issues [10,11]. Sometimes, pure BPMN is not enough, and the notation has to be extended to represent modern concepts such as process tailoring [12], multiple process instances [13] or ubiquitousness [14].
However, regarding the routing of a process, five basic control-flow patterns can be distinguished [15], which include simple sequences, parallel splits, synchronization, exclusive choices and simple merges (see the examples shown in Figure 3):
  • Sequence: simple succession of activities.
  • Parallel split: split in a single thread of control into multiple threads that can execute in parallel.
  • Synchronization: synchronization of multiple parallel branches into a single thread.
  • Exclusive choice: representation of a decision point in a process where one of several branches is chosen.
  • Simple merge: a point in a process where two or more alternative branches come together without synchronization.
To distinguish business functions or parts of the system related to certain flow objects, the concept of swim lanes is usually used in BPMN notation. Business process participants, which can either be entities within an organization or different collaborators in a process [16], are represented by pools. Their sub-partitions, which represent specific objects or roles, are called lanes.
For our approach, let us define a simple BPMN process model as a tuple: P = ( O , F ) , where:
  • O 
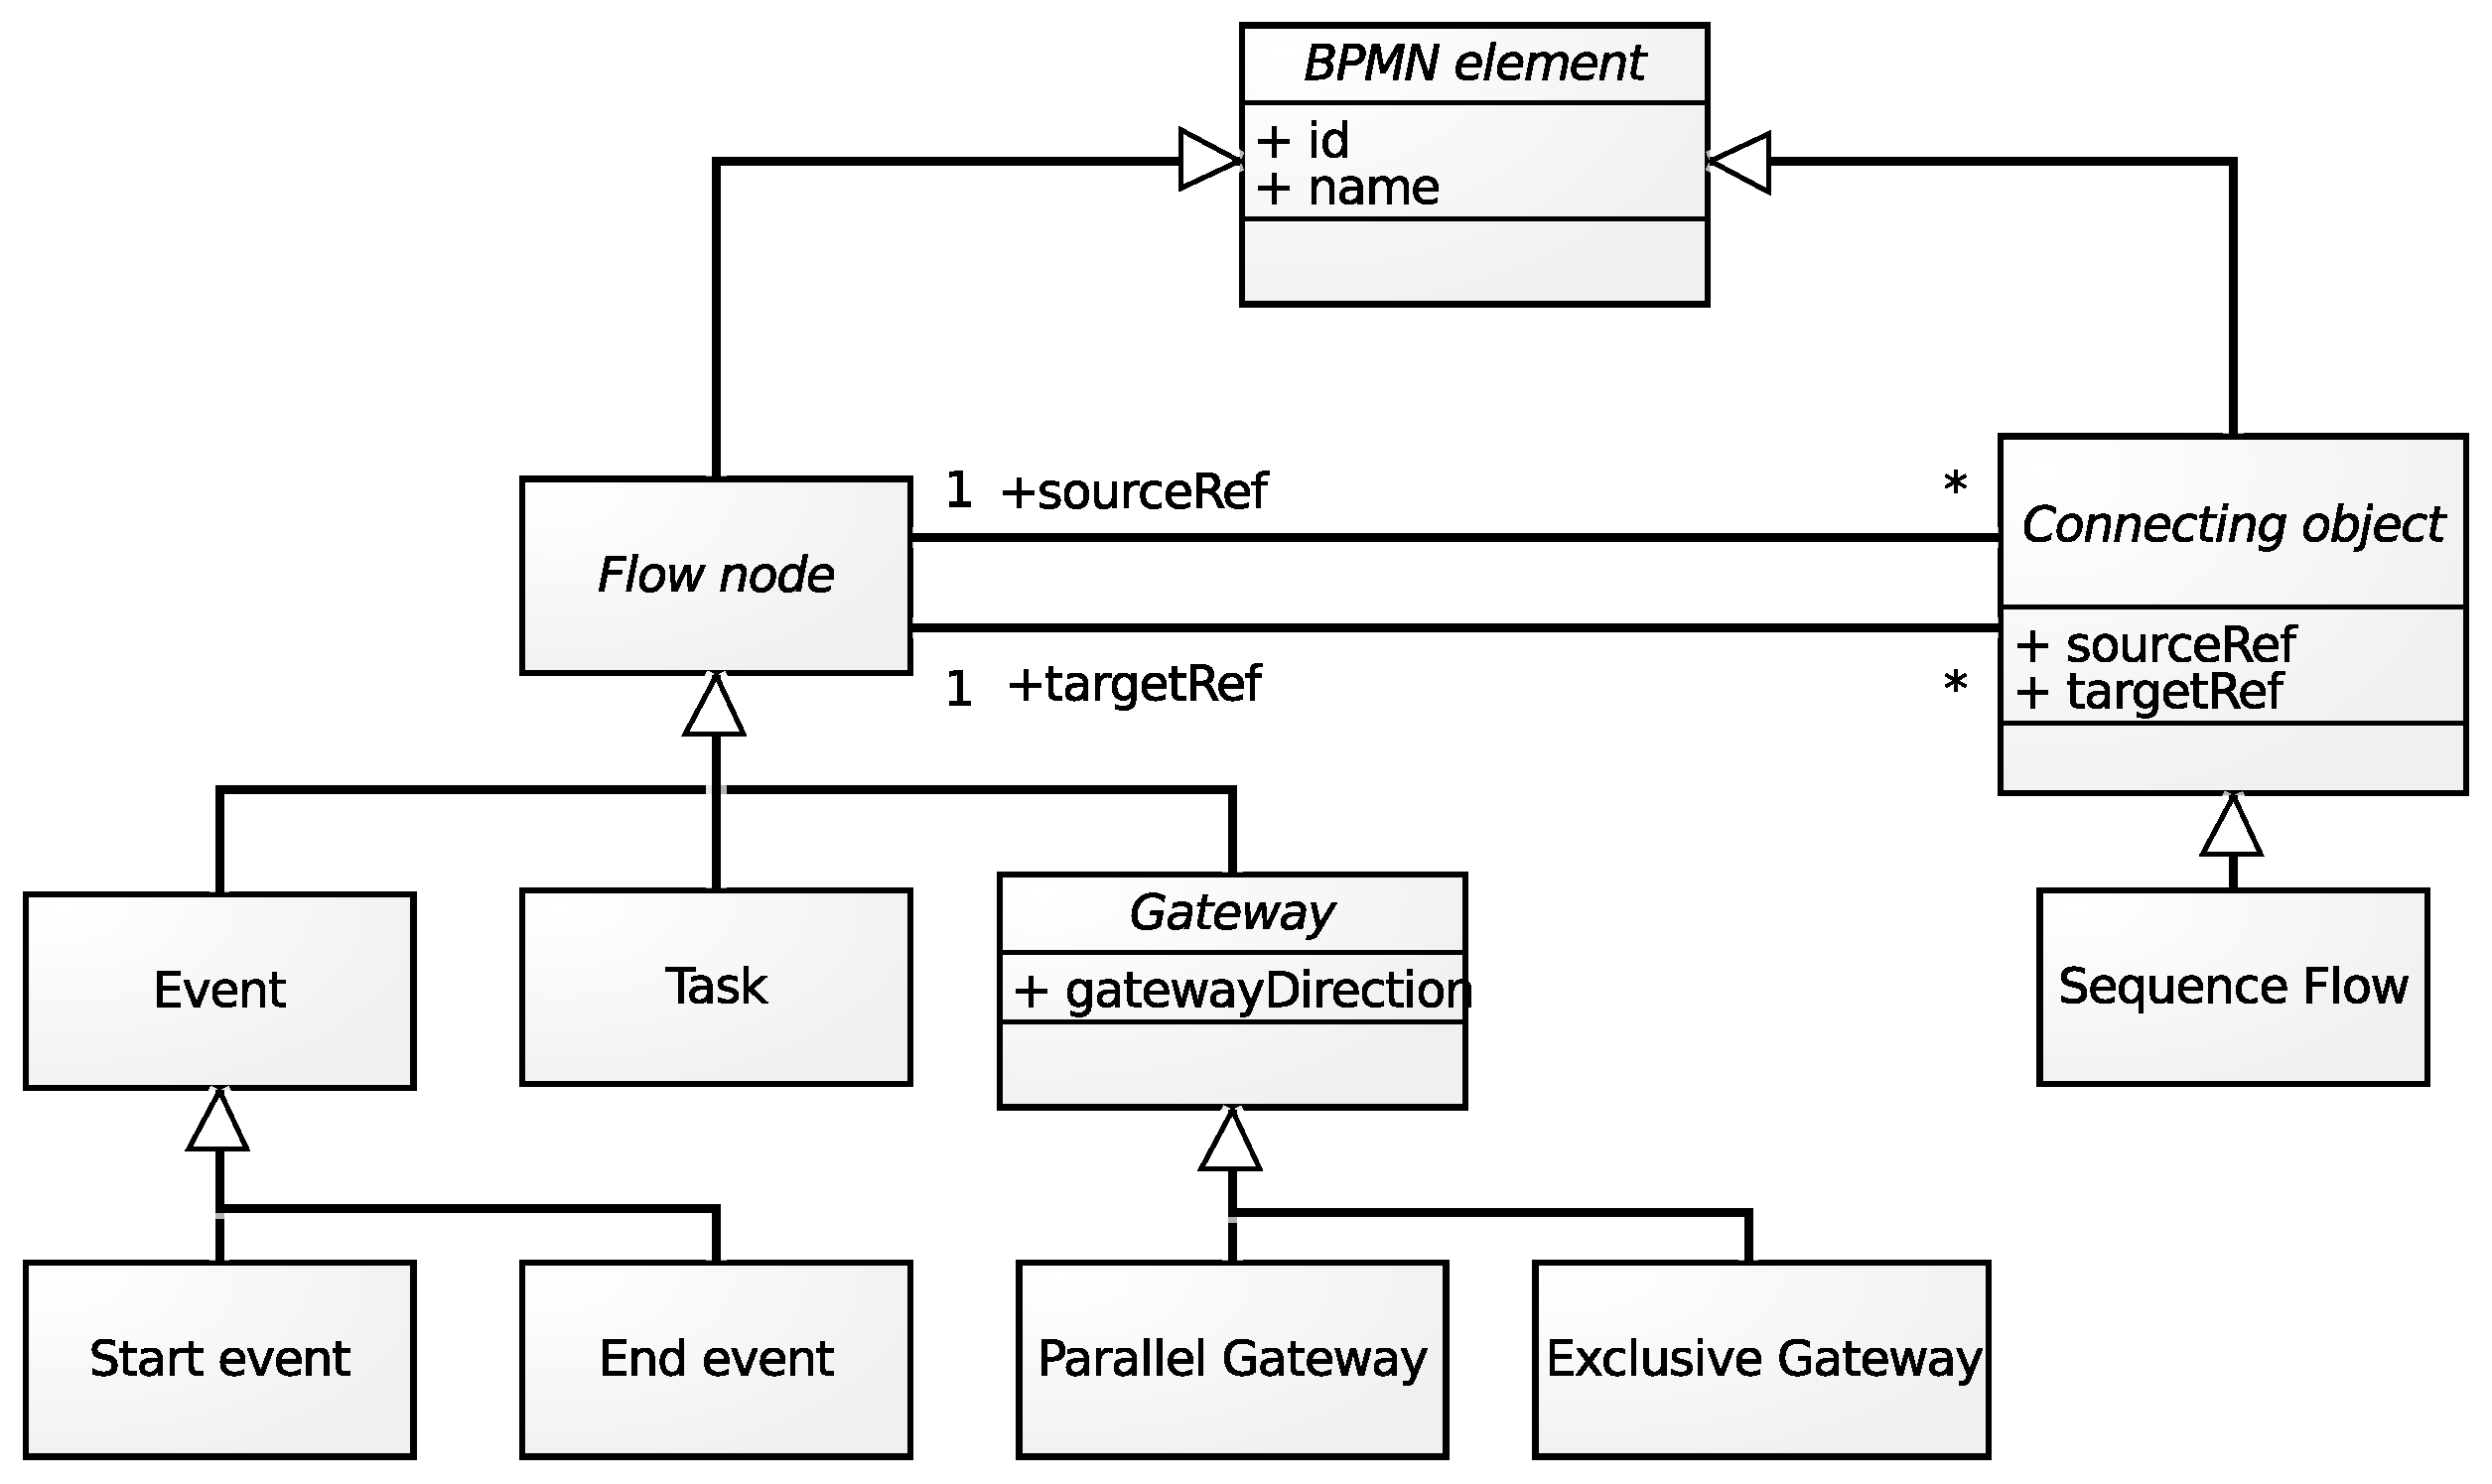
is the set of flow objects,
  • F O × O is the set of sequence flows.
Moreover, the set O of flow objects is divided into three disjoint sets (based on the definition provided in [17]):
  • T : a non-empty set of tasks ( | T | > 0 ),
  • E : a non-empty set of start and end events ( | E | > 1 ),
  • G : a set of gateways that split or merge the flow,
such as O = T E G .
In this paper, we use the concept of data entities. Unlike the data object described in the standard [1] (and presented in Figure 2), it is not a part of the generated process diagram, but constitutes the additional process specification, which is needed for our composition method. In other words, a data entity can be defined as a variable of a primitive or complex data type, which accompanies the execution of a task. According to the literature [18], four different data operations performed by tasks are distinguished in business processes: create, read, update and delete. A set of data entities present in the whole process is defined by Formula (1).
Δ = { δ : δ = ( I D , n a m e , t y p e ) } ,
where δ is a data entity, defined as a triple containing its ID, name and type.

3. Related Works

The method presented in this paper focuses on the generation BPMN models. Thus, this approach can be compared with such approaches as generating processes from natural language texts [19] or data models [20]. As such a method includes transforming processes from other representations, it can be also compared to these approaches. Let us briefly overview these groups of approaches in order to explain the difference of this attempt.

3.1. Generating Models from Text Description

A promising research direction is generating process models from text description [19]. Such a description can be provided in natural language or structured natural language [21]. However, such generated models are limited to the elements possible for obtaining the text description.

3.2. Generating Models from Other Models

A business process model can be created based on a set of existing process diagrams, which represent different execution variants of the workflow. Such an approach is called decomposition-driven consolidation [22] and supports process modeling by reducing redundancies and possible inconsistencies, which may occur in manually-created models. Process models can also be acquired using translation from other representations, such as the UML diagrams (e.g., use case diagrams [23,24,25], sequence diagrams [26]). the DMNmodels (e.g., [27]) or the CMMNmodels (e.g., [28]). Unfortunately, translation from other notations requires the other models designed. Such models, however, do not provide enough information and often even do not exist.

3.3. Generating Process Models from Data Models

There are also approaches that provide translations from various data models. These approaches use such representations as Bill Of Materials (BOM) [29], Product-Based Workflow Design (PBWD) [30,31,32,33], based on the Product Data Model (PDM) [34], Product Structure Tree (PST) [35,36], Decision Dependency Design (D3) [37,38] or attribute relationship diagrams [39]. Although these solutions have been applied in different business areas, all of them require preparing data models, and most of them do not support the BPMN notation. However, one of the related approaches [40] supports the creation of choreographed BPMN models by detecting synchronization points based on analyzing data objects generated and consumed in the process.

3.4. Generating Imperative Process Models from Declarative Models

Process models are usually modeled using the imperative approach focusing on the explicit definition of the process. Another approach focusing on the directives, policies and regulations, which restrict the potential ways of achieving the process goal, is declarative modeling [41]. Some studies show that imperative and declarative models are not so distant [42], and hybrid solutions are more expected by practitioners [43]. Thus, an important research direction in the area of generating process models is generating an imperative model based on a declarative one; see [42,43,44,45,46]. Most of these solutions take advantage of constraint programming to find solutions fulfilling the assumptions. Parody et al. [47] proposed an idea where a hybrid process model that combines a data-oriented declarative specification and a control flow-oriented imperative specification is formalized. In the next step, constraint programming is used to solve the optimization problem by finding the most appropriate data input for the process. Such approaches are similar to ours; however, our approach does not require preparing n additional declarative model as an input.

3.5. Analyzing Workflow Logs

Information about the analyzed process can be also retrieved by performing an analysis of an existing workflow log. Such a set of execution sequences can be explored in order to determine temporal relationships between activities [48]. Event data of a workflow may help to derive a process model from its configurable representation. One of the recently-proposed business process management use cases [49] consists of generating specified process variants based on the configurable model and the historical workflow log obtained from the analyzed system. Chesani et al. [50] generated synthetic traces for a business process model. Their approach covered also negative logs, which represent workflow sequences not allowed during process execution.

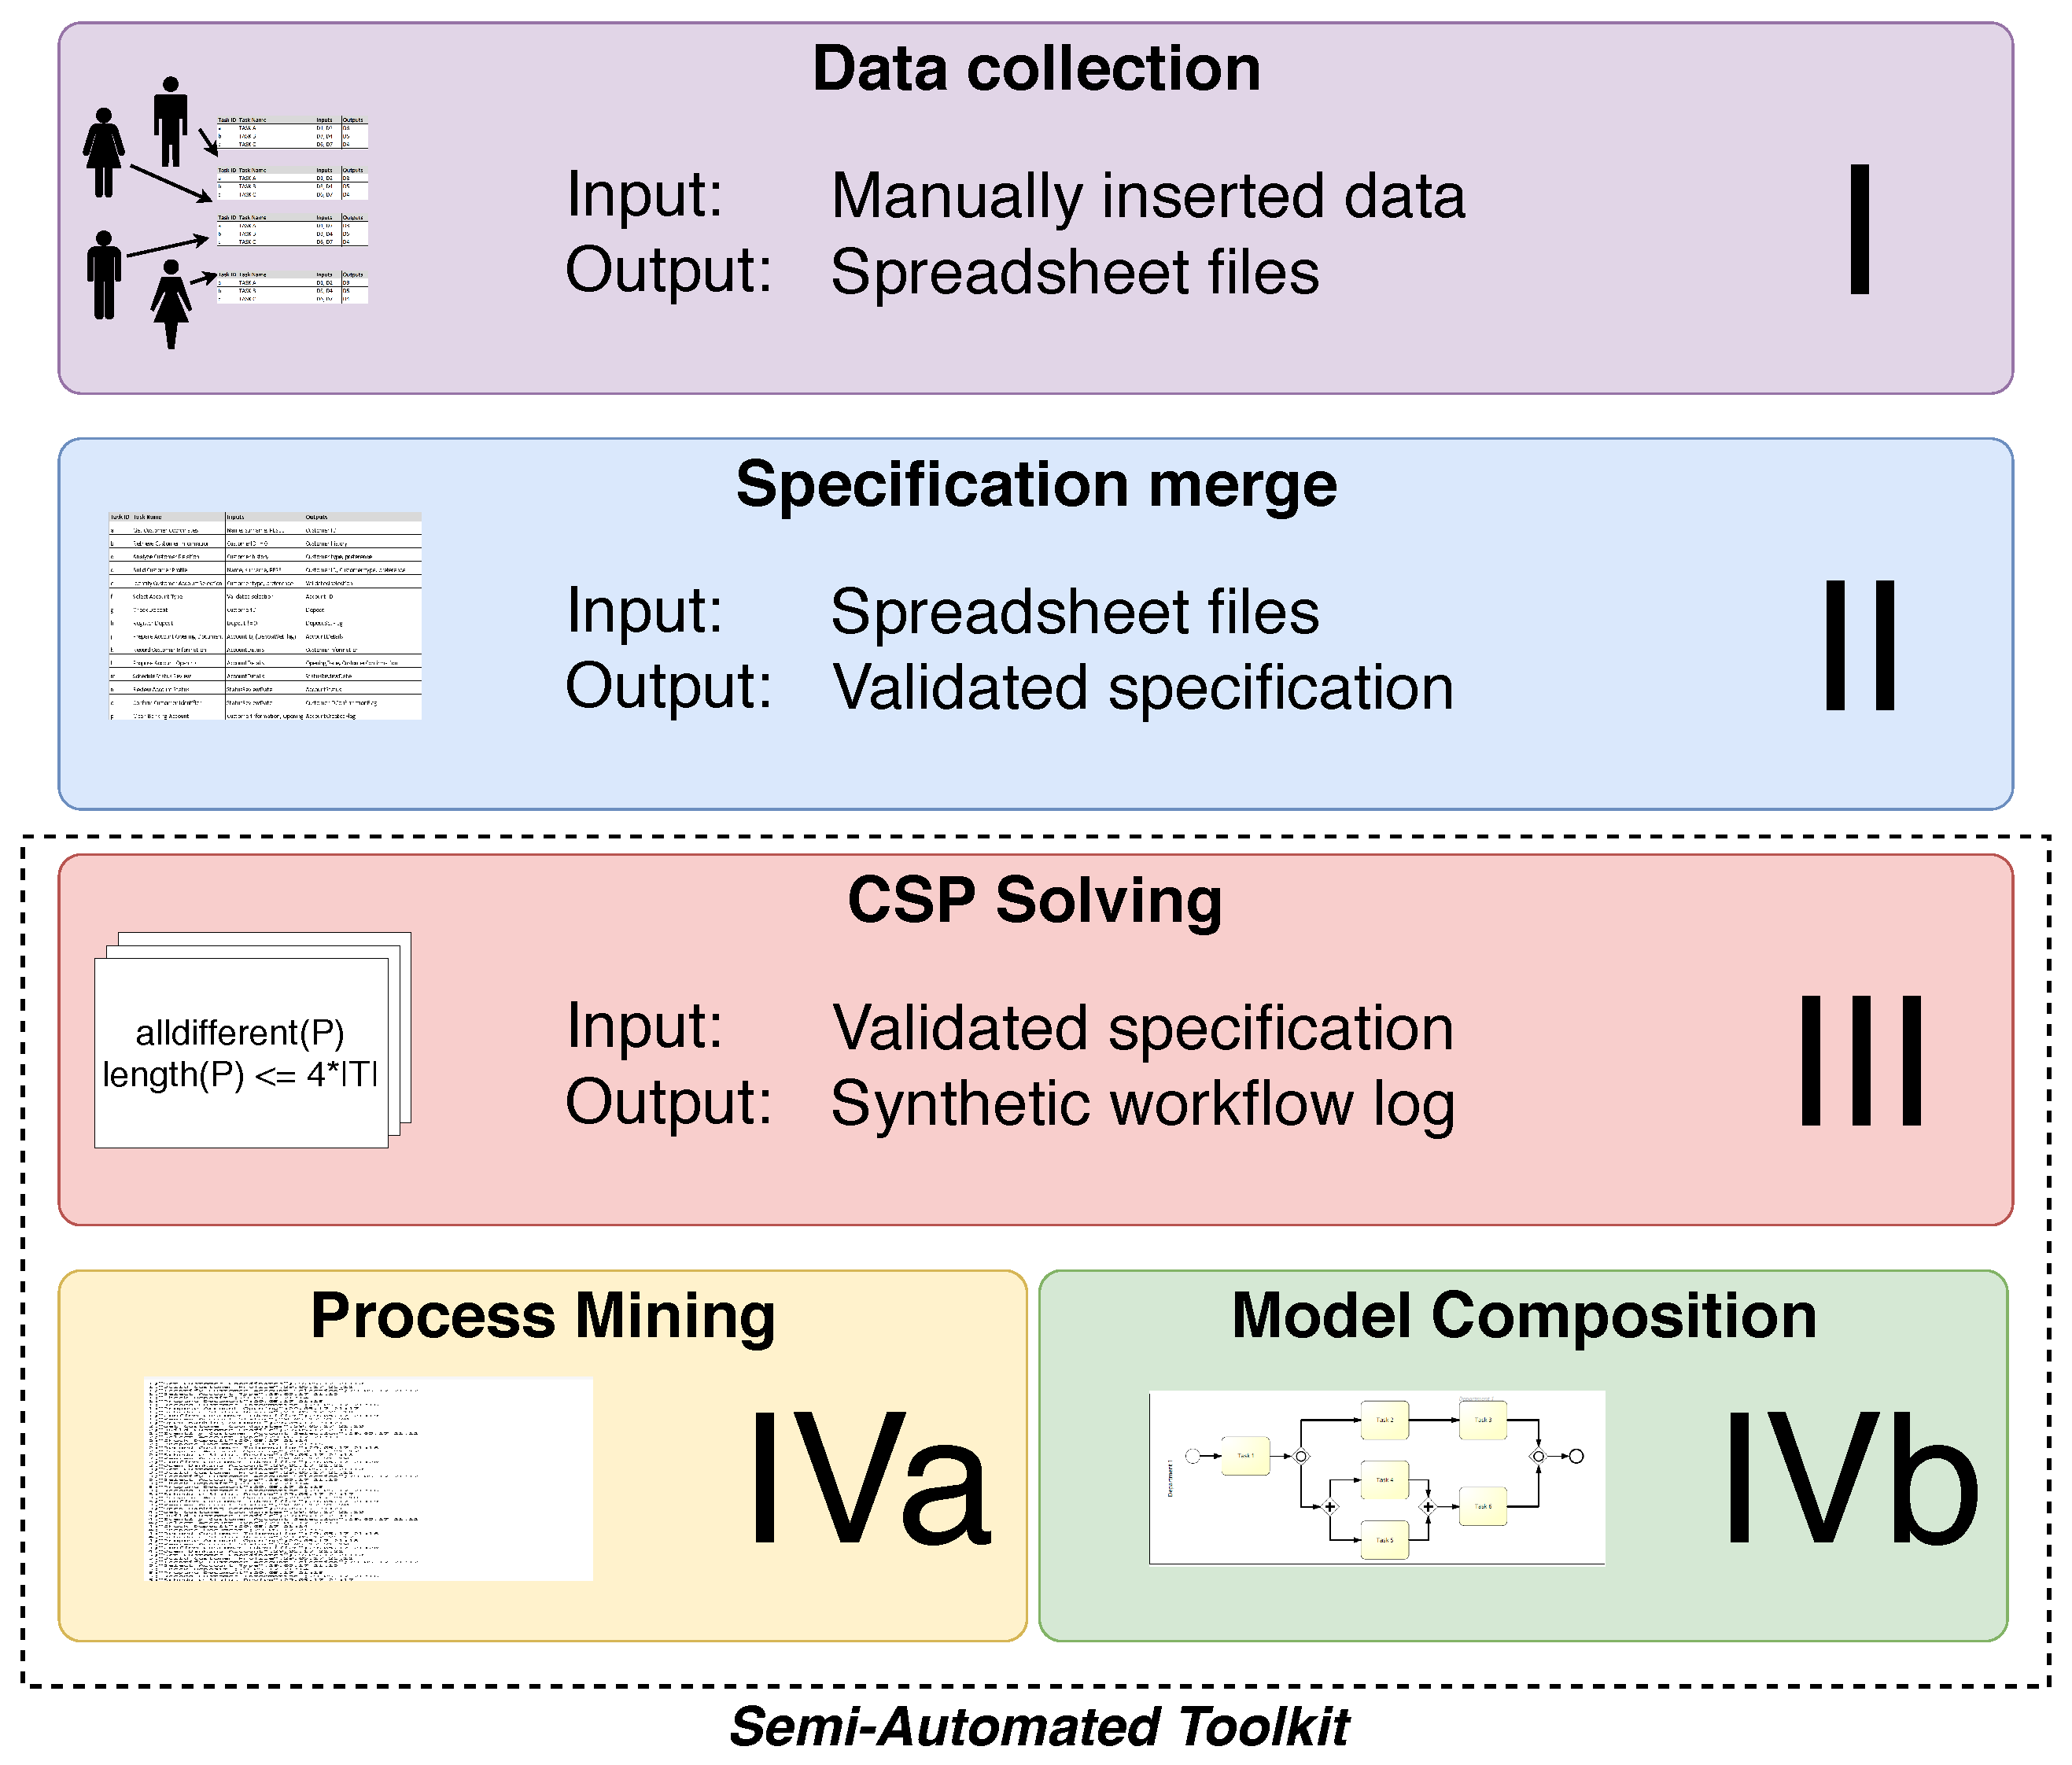
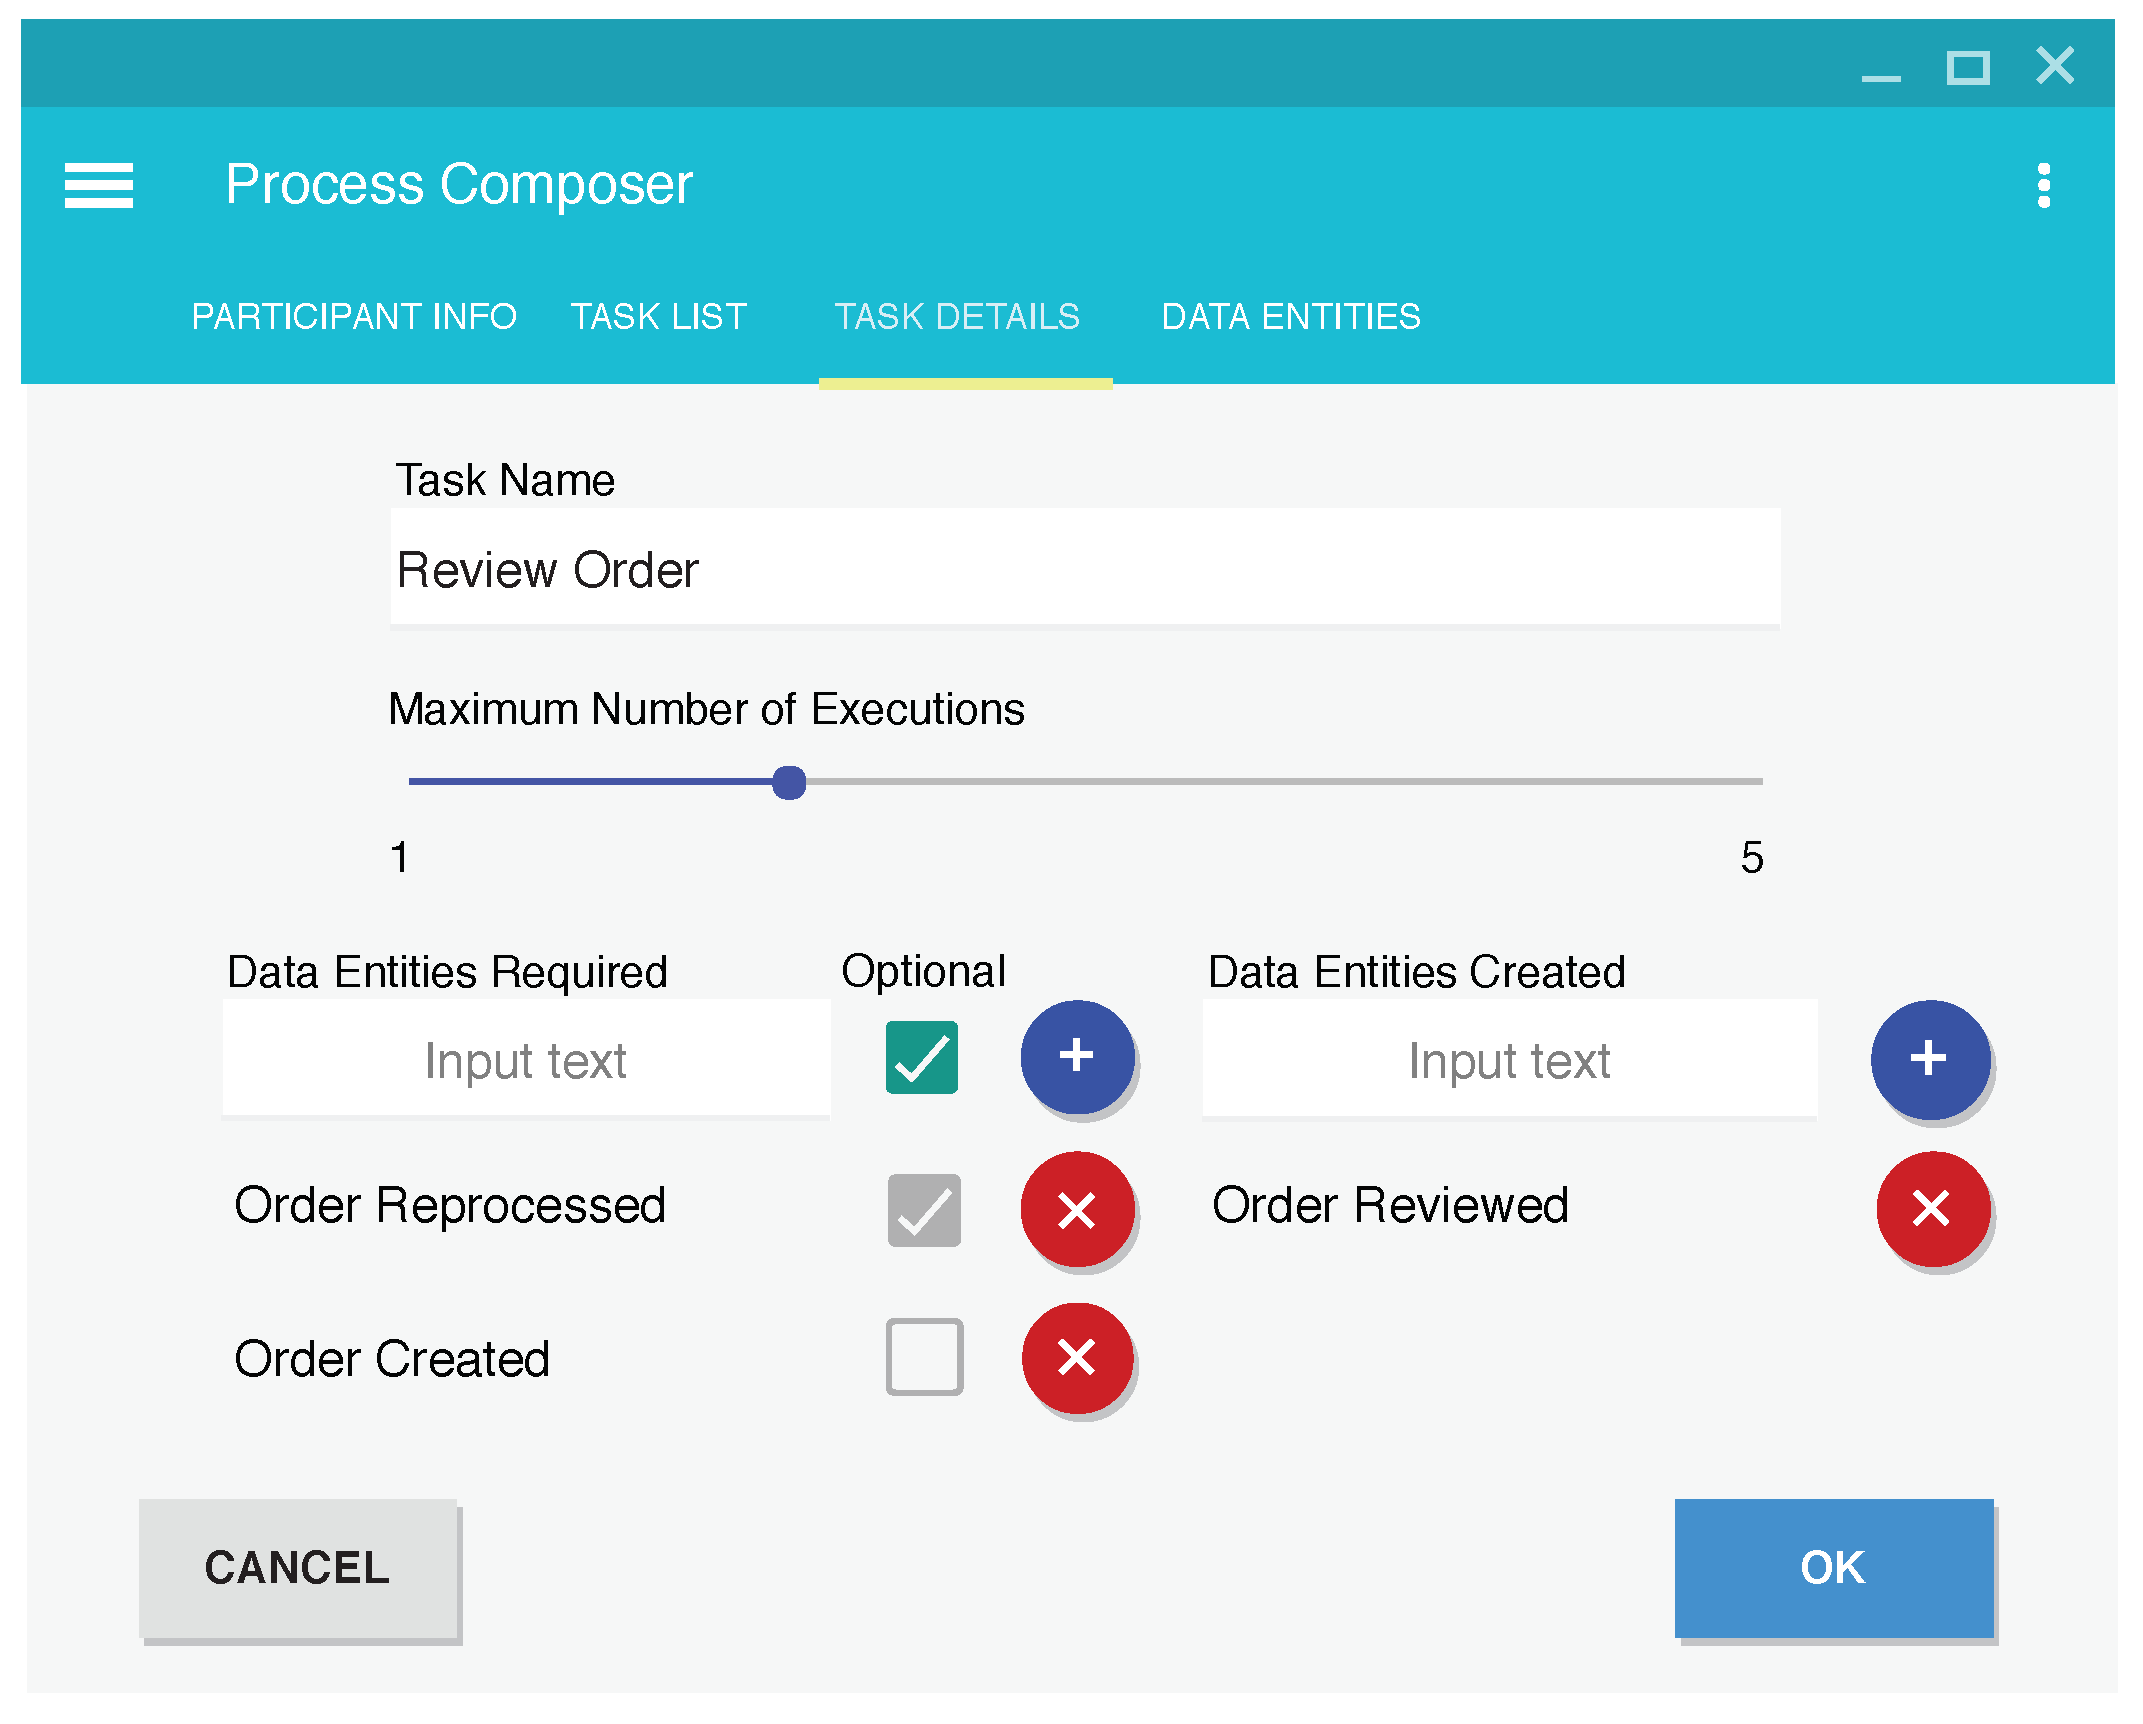
4. Collecting Process Data

Business processes usually involve multiple contributors, which perform different tasks. Therefore, designing a real-life process model is a complex activity and requires much communication between the process architect and its main participants. The idea proposed in this paper consists of providing an automated tool that gathers the required data in the simplest possible declarative form. In the first step, all the process participants need to determine which tasks are performed within their area of responsibility and provide the following information regarding each task:
  • data entities that are required or are optional for execution,
  • data entities created after execution,
  • maximum number of repetitions.
One of the ways of providing the required input is a web-based form, which can be used to acquire data from the participants of the process. Its sample layout is presented in Figure 4. It is also possible to bypass the form itself and provide the input in a spreadsheet file.
Such a business process description may be prepared using spreadsheets. Let us analyze a case study example model of a supply process, which is realized by four participants: warehouse operator, accounts payable specialist, purchasing specialist and purchasing manager. Their roles and responsibilities are presented in Figure 5.
Detailed task specifications performed by different roles are listed in Table 1, Table 2, Table 3 and Table 4. Data entities that are optional for task execution are listed in parentheses. The general process specification based on inputs from different participants includes 12 tasks and 13 data entities (Table 5).
In addition, the process designer must precisely define the initial state of the process in the form of a list of data entities that are present before its execution. Additional required information is the set of final states of the process, which covers the desired goal as mandatory information. Optionally, it may also include different error states, which may happen during execution of the process. In this case, the initial state of the process requires only a goods request data entity to be present. Since the goal of the analyzed business process is to provide requested goods, it has two possible goal states:
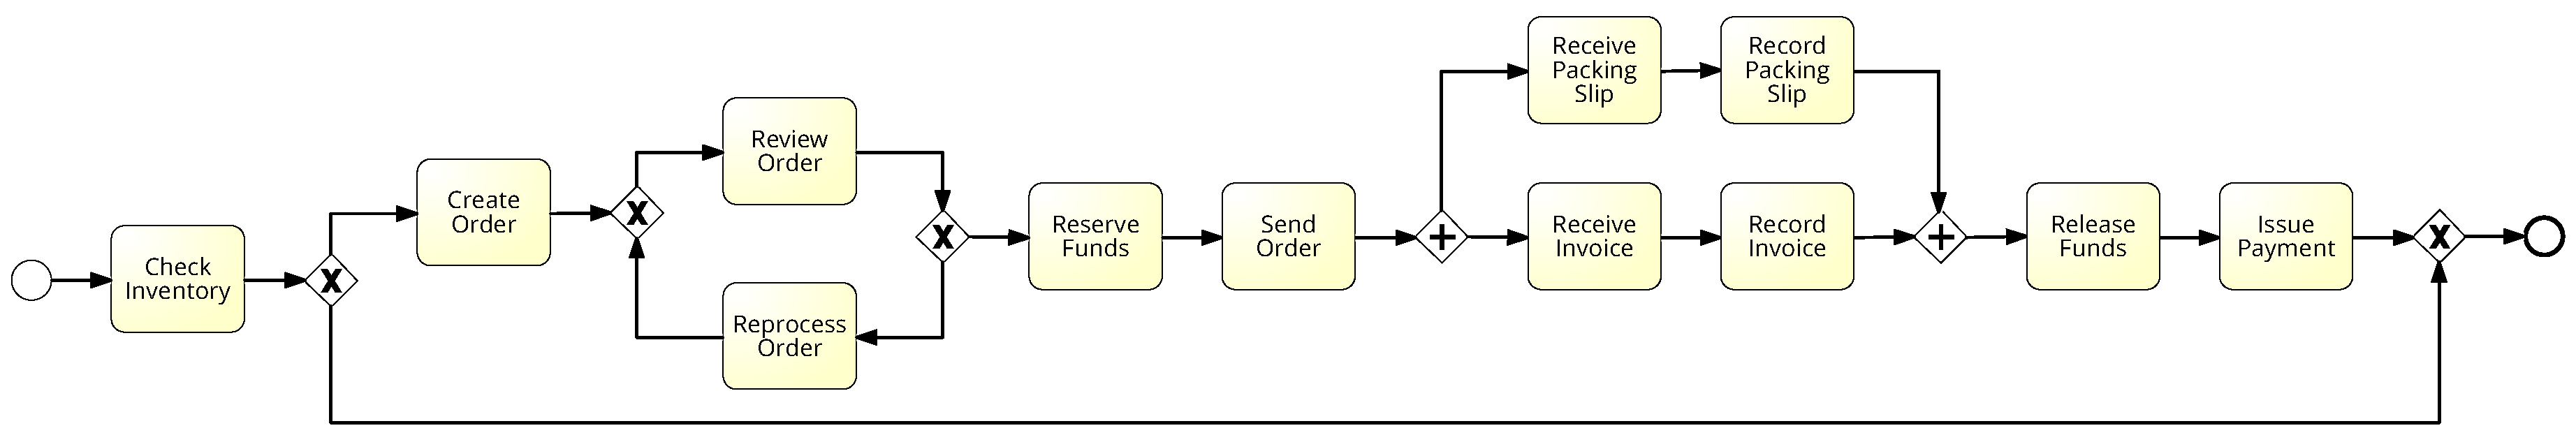
  • If requested goods are available in the warehouse, then there is no need for purchase order; then inventory checked is the only data entity required. All data related to purchase order processing should not exist.
  • Otherwise, the expected goal is a completed purchase order, which corresponds to the order completed data entity.
After gathering all the data entities and determining boundary states of the analyzed business process, its participants are able to indicate which data entities cannot exist before the task is executed. For example, if a purchasing specialist is performing the task create order, then the data entity order reviewed should not be present, as there was no order to be approved before. Correspondingly, an existing data entity can be removed as a result of an execution of a task. To illustrate this situation, the task issue payment can be shown as an example. If the payment is done, there are no more funds released for the order, and the release funds data entity should be deleted.
The final step of the process data collection consists of merging the information from all the process participants into a single spreadsheet representation.

5. Constraint-Based Model

The composition of business processes is conducted using the Constraint Programming approach (CP) [51]. It is based on the principles of the method presented in our preliminary work [52], which covered a basic scenario. In order to prepare data for the algorithm, the spreadsheet representation needs to be converted to a formal model.

5.1. Formal Process Data Structures

Using notation presented in Section 2, let us denote T as the set of all tasks included in the spreadsheet representation and Δ as the set of all data entities identified by the process participants. Assuming that the cardinality of these sets are equal to n and m, respectively, creation of the constraint model consists of generating two n × m matrices:
  • M T C : for conditions needed for a task to be executed,
  • M T E : for effects caused by the execution of a task.
Values of matrices M T C and M T E should reflect the execution preconditions and effects of each task, as defined by the process participants in the specification (see Table 1, Table 2, Table 3 and Table 4). A precondition or an effect is understood as the presence of data entities before or after task execution, respectively.
Formulae (2) and (3) present rows of matrices M T C and M T E , which correspond to the review order task specified in Table 4. The order of the columns refers to the order of data entities listed in Table 5.
M T C [ R e v i e w O r d e r ] = 0 0 0 0 0 0 0 0 0 0 0 1 1
M T E [ R e v i e w O r d e r ] = 0 0 0 0 0 1 0 0 0 0 0 1 0
In addition, having g as the number of admissible goal states, it is necessary to define a matrix M S T of size g × m , which describes admissible goal states, and a m-element vector s 0 should be defined to store information about the presence of data entities before the execution of the process. All these data structures can contain integer values from the set { 1 , 0 , 1 } . Table 6 explains the meaning of structure values with respect to data entities present in the process.
The last structure to be defined is an n-element vector e t , which defines the maximum number of executions per each task. By default, its values should be equal to one unless the process contains loops or tasks executed iteratively. In the example supply process, the specification of which is presented in Table 1, Table 2, Table 3 and Table 4, there is only one such task. Therefore, a vector e t should contain a value of two on the corresponding position, while all its other elements should be equal to one.

5.2. Generation of a Workflow Log

A workflow log W = { σ 1 , σ 2 , σ L } is a multiset of event traces [53] σ , which can be defined as ordered sequences of activities in a process: σ = ( τ ( 1 ) , τ ( 2 ) , τ ( K ) ) . Although the definition of a workflow log allows traces to appear multiple times, the aim of the presented approach is to generate a complete log artificially [54], which contains distinct workflow traces covering all the admissible execution sequences of the process. Therefore, W will be considered as an ordinary set in the further analysis.
The synthetic workflow log is generated based on the data input/output specification in the process. Thus, its generation requires data structures that were presented in Section 5.1. For the purpose of finding a set of solutions, the notion of a process state is introduced. It is an m-element vector representing the presence of data entities at a particular stage of the process execution. Before specifying constraints needed to generate proper logs, it is necessary to define the satisfiability predicate [52], which determines if state vector s fulfills the requirement for a task to be executed (Formula (4)).
s a t ( s , T C ( τ i ) ) j = 1 m : s j = T C ( τ i ) j T C ( τ i ) j = 1
where T C ( τ i ) corresponds to the i-th row in the M T C matrix.
To generate a complete process log, the analyzed problem must be modeled using constraints over variables [55]. This concept is based on three main pillars:
  • Search space: finite sequences of tasks.
  • Decision variables: workflow trace, process state matrix.
  • Constraints over variables: determined by the input data, as well as a set of predefined formulae.
The constraint-based model was created in the MiniZinc [56] modeling language. In this section, we present the description of applied predicates and constraints, along with their simplified code representations. Two custom predicates were defined in order to be reused in constraint definitions, namely:
  • State satisfies requirements (based on Formula (4)).
    Applsci 08 01428 i004
  • State satisfies set of requirements.
    Applsci 08 01428 i005
Then, the predefined constraints, which ensure the correctness of the process were formulated as follows:
  • The global limit of executions for all tasks is a constant value and denoted as M A X E X .
    Applsci 08 01428 i006
  • The number of executions for each task should be lower than or equal to the corresponding value in vector e t or to the global limit.
    Applsci 08 01428 i007
  • The maximum length of the workflow trace is equal to n × M A X E X .
    Applsci 08 01428 i008
  • The input state of the first executed task should be equal to s 0 .
    Applsci 08 01428 i009
  • Every non-empty task should change the current state.
    Applsci 08 01428 i010
  • The process should end when the desired goal state is achieved.
    Applsci 08 01428 i011
  • The last state of the process should satisfy one of the goal states.
    Applsci 08 01428 i012
  • A task can be executed only if the current state satisfies its input conditions.
    Applsci 08 01428 i013
The presented model is executed using the Gecode solver [57]. For the workflow trace generation. the search goal should be set for constraint satisfaction by using the statement solve satisfy. To generate a workflow log, two files are needed:
  • the model file .mzn, which contains definitions of decision variables, predicates and constraints,
  • the data file .dzn, where all the input information such as matrices M T C , M T E , M S T and initial state vector s 0 are defined.
Since the result of a single search is a single workflow trace, in order to obtain a complete log, the option to print all solutions should be used. The results are saved to a text file, which serves as an input to the next step: process composition.

6. Composition of a BPMN Diagram

There are two possible scenarios that may be applied when composing a business process model based on a synthetic workflow log:
  • The mining-driven approach.
  • The process composition based on activity graphs.
The former consists of translating the log into an event log file and applying one of the existing process mining algorithms. In case of using the latter, a workflow log is processed directly and converted to a graph form, which is a first step towards the generation of a BPMN diagram.

6.1. Mining-Driven Approach

The mining-driven approach allows the user to generate a BPMN diagram using the output from the constraint-based model described in Section 5. For this purpose, one of the most widely-used open source environments for process mining is the ProM Tools software [58,59]. The user can select one of the desired methods and generate a BPMN model based on a workflow log of a process.
In the first step, the ordered list of tasks obtained as a result of solving the constraint satisfaction problem presented in Section 5.2 needs to be converted into a file in XESformat, which is an XML-based standard for event logs [60].
In our previous paper [52], we presented a solution for this problem, using Heuristic Miner with the default parameters. This Petri-net mining algorithm provides a good level of construct recognition [61]; however, it has a tendency to underfit the model. In other words, there can be more admissible task sequences in the resulting model than included in the logs. In addition, heuristic-based algorithms include noise reduction, which results in ignoring workflow traces that appear less frequently in the log. A process model composed using such an algorithm may lack alternative branches, which serve as a bypass for a large number of tasks, e.g., paths leading to error end events.
There are several different process discovery algorithms that can be applied to process composition. In general, they can be divided into five main groups [61,62]:
  • Abstraction-based (also known as α -series): consists of three phases: abstraction, induction and construction. In such an algorithm, ordering relations between tasks are identified, and the final workflow net is constructed based on predefined rules.
  • Heuristic-based: consider the frequency of ordering relations appearing in workflow traces, and filter out the potential noise.
  • Search-based: use genetic algorithms to discover process models that represent the most frequent behavior in a workflow log.
  • Language-based: assume that each activity in a trace is a letter in an alphabet and each trace is a word. One of the approaches [63] uses Integer Linear Programming (ILP) to discover control flows.
  • Inductive: filter the most frequent activities, and produce a process tree. The generated model is then enriched with frequency information for each task and the information about how the generated model deviates from the input log.
Table 7 presents a comparison of selected process mining algorithms and their suitability for constraint-based process composition. In this brief summary, we consider only these mining techniques, which can generate a BPMN model in the ProM environment (see: http://www.promtools.org/).
It is worth noting that although using an existing process mining framework to generate a BPMN model is a comfortable task, the available algorithms are not fully dedicated to work on artificial data.

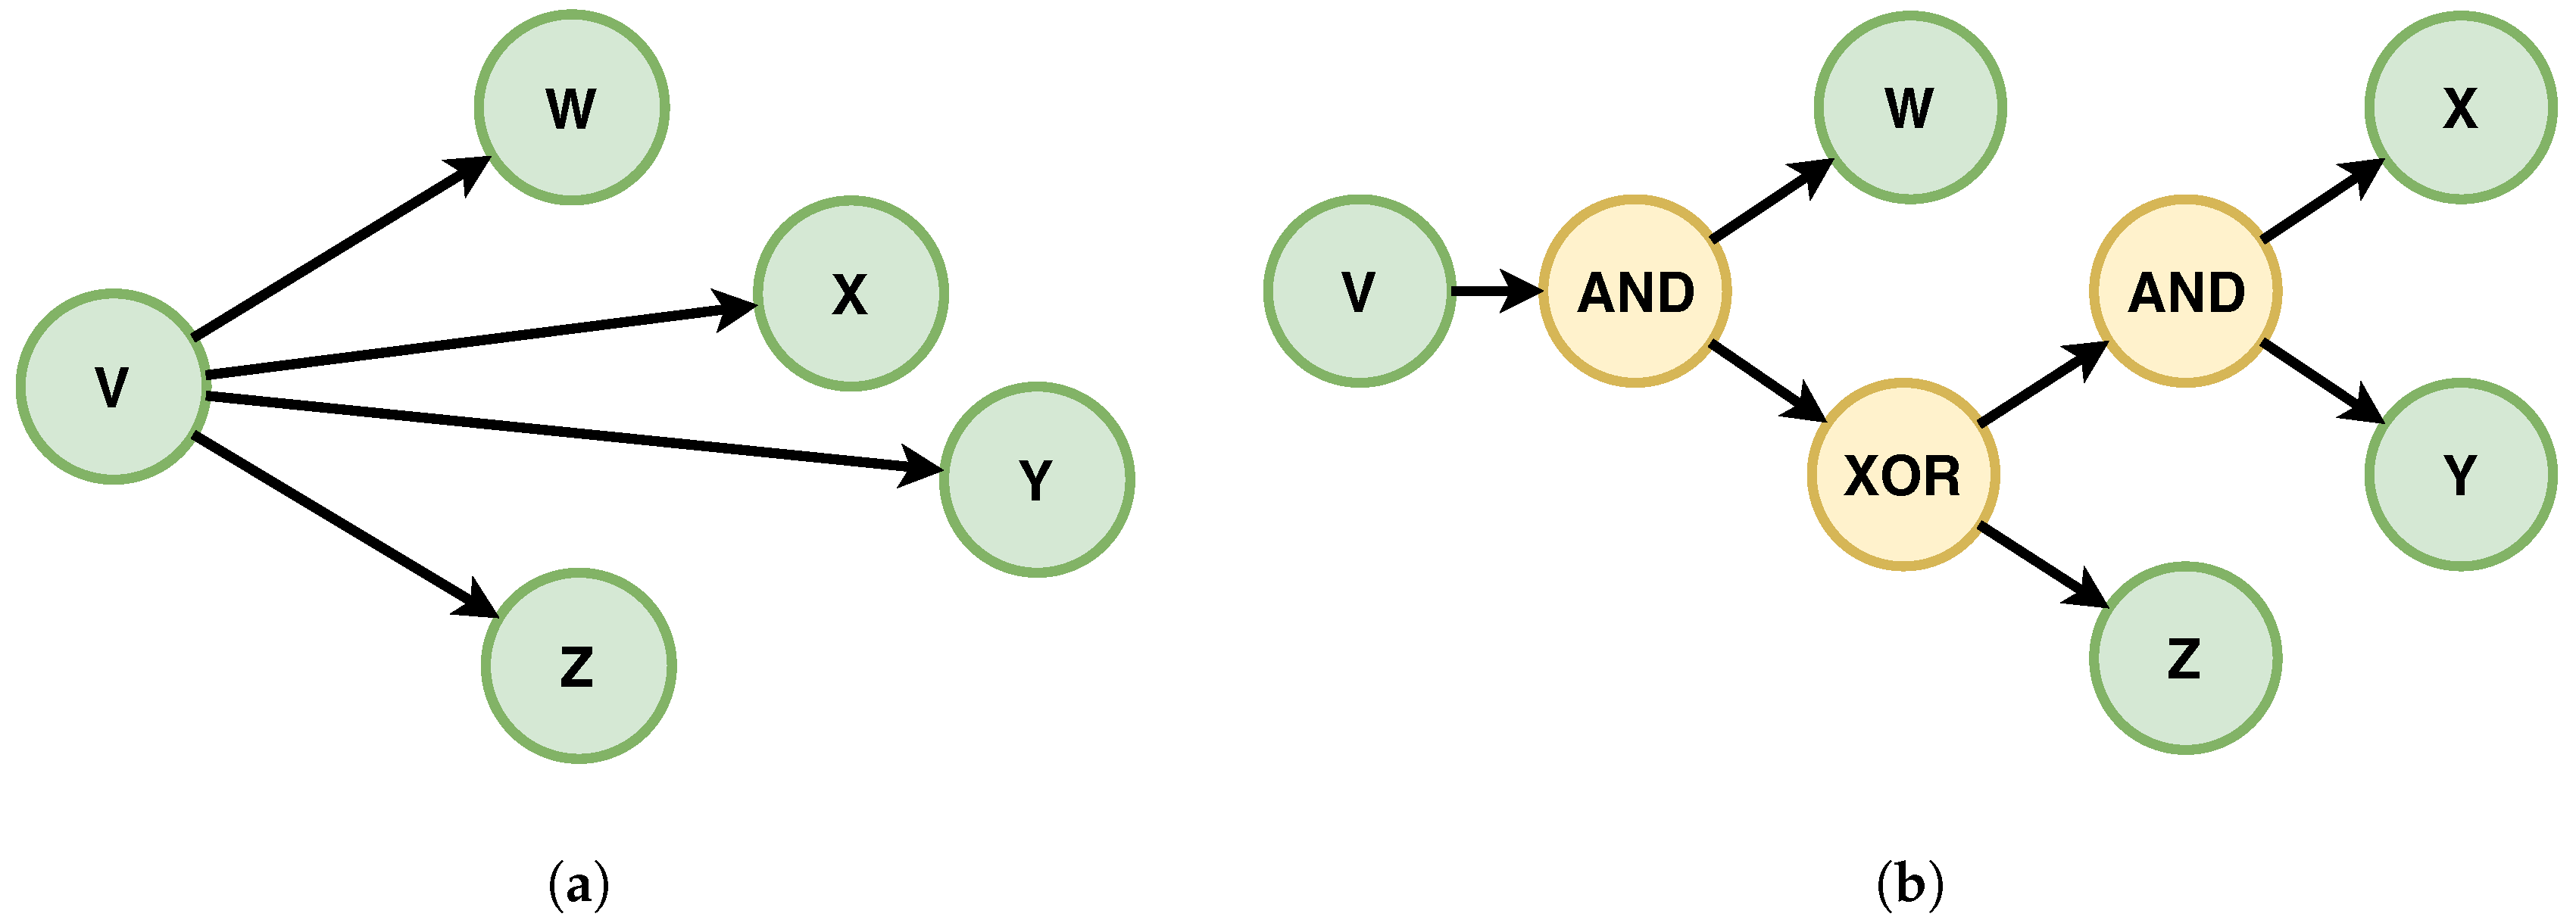
6.2. Process Composition Based on Activity Graphs

All the process mining techniques presented in Section 6.1 consist of generating a Petri-net based on a provided set of workflow traces. Converting such a net to a BPMN model is a complex task and may require additional model modifications [64]. Therefore, the other approach presented in this paper is based on activity graphs and is used to compose a BPMN model directly from a synthetic workflow log.
An activity graph [65] G A of a business process can be defined by Expression (5):
G A = ( V A , E , d e g , d e g + ) ,
where:
  • V A is a finite set of vertices representing process activities,
  • E is a set of directed edges,
  • d e g : V A N 0 determines the number of incoming edges for a vertex, and N 0 stands for non-negative integers,
  • d e g + : V A N 0 determines the number of outgoing edges for a vertex.
There are several relation templates [66] that describe dependencies between events in a workflow log and as a consequence relations between activities in a business process model. Let us recall those that correspond to the most strict ordering relations between two events, denoted as A and B:
  • chain response: if A occurs, then it is directly followed by B,
  • chain precedence: if B occurs, then it is directly preceded by A,
  • chain succession: A occurs if and only if B occurs directly afterwards.
Activity graphs represent admissible chain response and chain precedence relations in a workflow log. The creation of such a graph G A for a given workflow log W consists of defining an initial node, a terminal node and a separate intermediate node for every activity in the logs and then linking all the pairs of nodes with directed edges if a chain ordering relation occurs between them (see Algorithm 1 for details).
Applsci 08 01428 i001
Representing all the chain ordering relations in a log by a directed edge may lead to parallelism clutter [62]. This situation occurs when the process specification allows one or more activities to be executed in parallel. In the workflow log generated according to the method described in Section 5.2, such activities can appear in different order, depending on the workflow trace. As a result, given two activities A and B, if A occurs directly before B in trace σ x and at B occurs directly before A in trace σ y , then executing Algorithm 1 will cause the creation of two independent directed edges: one from A to B and the other from B to A. The issue of doubled edges needs to be resolved in order to avoid doubled sequence flows between parallel activities in the generated BPMN model.
The necessary refinement of the set of edges (E) consists of identifying potentially parallel activities and removing doubled connections between them. A relation of potential parallelism was defined in the α algorithm: two tasks are likely to be parallel if they can follow each other directly in any order [67]. Although this rule is valid for models representing a simple workflow, it does not work perfectly if loops exist in the discovered process. In order to illustrate such a situation, let us present an example of two workflow logs, each consisting of two traces having four different activities (Formulae (6) and (7)):
W 1 = { A B C D , A C B D } ,
W 2 = { A B C D , A B C B D } .
Log W 2 contains a loop, as task B is executed two times. Figure 6 presents activity graphs created as a result of executing Algorithm 1 with the logs W 1 and W 2 as input data. If the rule from algorithm α were applied, then doubled edges between activities B and C would need to be removed in both graphs. In the second graph, this would result in a connectivity loss, as the vertex representing activity C would not be reachable from the initial node.
Medeiros et al. [68] proposed an extension to the α algorithm, which includes the discovery of length-two loops. In this extension, a new ordering relation Δ was defined. It is used to identify short loops as follows: given two tasks A and B being part of workflow log W, A Δ W B if and only if a sequence A B A is a part of at least one trace in W. Another introduced ordering relation is ⋄, which is valid when A Δ B and B Δ A . As a consequence, tasks A and B cannot be considered parallel if A B . Such a solution could handle basic loop structures; however, it is unable to identify relations properly between tasks shown in Figure 6b without further modifications. In this case, B Δ C is true, while the reciprocal relation C Δ B does not imply.
As a solution to this problem, we propose a redefinition of task parallelism, which can be applied to activity graphs defined by Formula 5. Given a workflow log W over a set of tasks T and activity graph G A created based on W, two tasks A , B T can be considered parallel if and only if:
  • There exists a directed edge leading from A to B and one from B to A.
  • There exists a workflow trace σ W where the number of occurrences for A and B is equal.
  • There exist two workflow traces σ 1 , σ 2 W such that A occurs first before the first occurrence of B in σ 1 and B occurs first before the first occurrence of A in σ 2 .
Parallelism relations can be also identified using Prime Event Structures (PES) [69]. This method is based on the assumption that two events are considered to be concurrent if there are neither causality nor conflict relations between them [70]. Having properly identified potentially parallel pairs of tasks, it is possible to run the refinement procedure of set E. Its objective is to remove all edges from activity graph G A , the endpoints of which satisfy the three aforementioned conditions of activity parallelism.
In the next step, an activity graph needs to be transformed into a business process graph, which is a precise representation of a BPMN process model. As a complex gateway structure may appear, this task includes mainly the identification and connection of logical gateways present in the process, which has been discussed in our previous work [71]. Similarly to the model used to generate synthetic workflow traces based on the process specification, the algorithm for discovering complex gateway structures was modeled as a constraint satisfaction problem in the MiniZinc environment.
Given a predefined set of constraints, which ensure a proper flow between gateways, the process composition algorithm includes the dynamic creation of an input data file and running the simulation for each graph vertex, the indegree or outdegree of which is greater than two. Algorithm 2 describes the identification of places where complex gateway structures are needed, as well as the iterative execution of MiniZinc simulations for structure discovery. The example method applies to split gateways. In order to include join gateway structures in the process model, an analogical algorithm needs to be executed.
Applsci 08 01428 i002
In such a case, instead of successors and outgoing edges of vertex v, predecessors and incoming edges should be considered. The result of the presented algorithm is a directed graph, the vertices of which represent the most common elements of a BPMN model (see Figure 2): a start event, an end event, activities and data-based gateways.
Figure 7 shows an example of executing Algorithm 2 on a part of the activity graph G A , the set of vertices of which contains the following activities: { V , W , X , Y , Z } . V is the source node with four direct successors. The identified parallel relations are: ( W , X ) , ( W , Y ) and ( W , Z ) . The other pairs of tasks can only be executed exclusively.
The last phase of the proposed approach to business process composition is the transformation of the generated business process graph into a BPMN diagram. For this purpose, we use the interchangeable BPMN 2.0 XML format, which was described in detail in the specification of BPMN [1]. In this standard, both flow objects and sequence flows are represented by XML elements. Table 8 presents BPMN sub-class elements, which are currently supported in process composition (the metamodel for this BPMN subset is presented in Figure 8.
The algorithm for generating an XML file from a business process graph consists of three major steps (see Algorithm 3):
  • Create the process file structure.
  • For each vertex and its attributes, create an element corresponding to the type of flow object.
  • For each directed edge, create a sequenceFlow element.
Applsci 08 01428 i003
The BPMN 2.0 standard includes also a possibility to define the visual layout of a business process model. This is managed by the BPMN Diagram Interchange package (BPMN DI), the elements of which represent flow objects and sequence flows along with their coordinates on the canvas. In order to create a layout for the composed model, it is possible to use one of the existing layouts for directed graphs such as the ISOMalgorithm based on self-organizing graphs [72]. Graphical layouts specific for BPMN models can be also generated using a dedicated library, such as EasyBPMN [73].
Although the proposed approach offers the possibility to compose a BPMN diagram with a graphical layout, the generated models can be saved without the BPMN DI section. In such a case, the model can be opened in one of the editing environments for BPMN diagrams.
Figure 9 shows the resulting BPMN model, which was generated based on the specification presented in Table 1, Table 2, Table 3 and Table 4. At the final stage of process modeling, labels for events and conditions for exclusive gateways should be added manually. The conditions for the conditional flows might also be mined with some decision discovery algorithm [74].

7. Evaluation

To validate the correctness of the proposed approach, we use a set of existing BPMN models, which contain different flow object structures. Several complexity metrics were defined for evaluation of business process models [76], which consist of describing a process diagram by a numerical value that expresses the difficulty to design or implement the model. Regarding the fact that the biggest modeling challenges in the area of process composition are gateways and loops (see Section 6.2), the Control-Flow Complexity (CFC) could be used in this case. It represents the number of states induced by control elements in a process. However, it disregards the possibility that activities executed in parallel can be triggered in a different order, as the presence of an AND gateway induces only one state [77]. To overcome this inconvenience, we propose a Log-based Complexity Metric (LCM), which represents the number of workflow traces with respect to the number of activities in a process. Its definition is given by Formula (8).
L C M = W T
Table 9 presents a set of sample BPMN models used to evaluate the proposed method. It contains the analytically-determined number of traces and corresponding values of the LCM metric. In order to calculate the number of traces for process models that contain loops, we use the notion of a sufficiently complete workflow log, which is explained in Definition 1.
Definition 1.
(Sufficiently complete workflow log) Let G P be a business process graph [78] representing the analyzed process and S C be a set of all simple cycles in G P . Function C C ( τ ) determines the number of occurrences of the vertex representing activity τ in S C . Workflow log W is sufficiently complete if it contains all the possible execution sequences where the number of occurrences for each activity τ is lower than or equal to C C ( τ ) + 1 .
Another useful metric that measures the complexity of control flows is the Looping Depth (LD). It describes the degree to which structured blocks in the process model are nested. It also gives the information about the maximal number of task repetitions in a sufficiently complete workflow log. For comparison, we also provided the values for the CFC metrics denoting the complexity of the models.
The evaluation of the proposed method can be divided into two separate phases: one for verifying workflow traces generated based on the formal specification described in Section 5 and the other that aims to validate the graph-based model composition proposed in Section 6.

7.1. Generation of Workflow Traces

In order to evaluate the constraint-based model, we create an artificial process specification for each of the example models, which is based on the following assumptions:
  • Each activity generates one data entity.
  • Each activity requires data entities generated by its predecessors. If it is preceded by an exclusive gateway, then an artificial data entity is created to represent the alternative.
  • The initial state of the process is a zero vector.
  • The goal state of the process requires data entities produced by its predecessors.
After performing the simulation in MiniZinc for all the example models included in Table 9, we have achieved 100% accuracy of the method. In other words, in every case, the number of traces generated by the constraint-based model was equal to the analytical estimation.

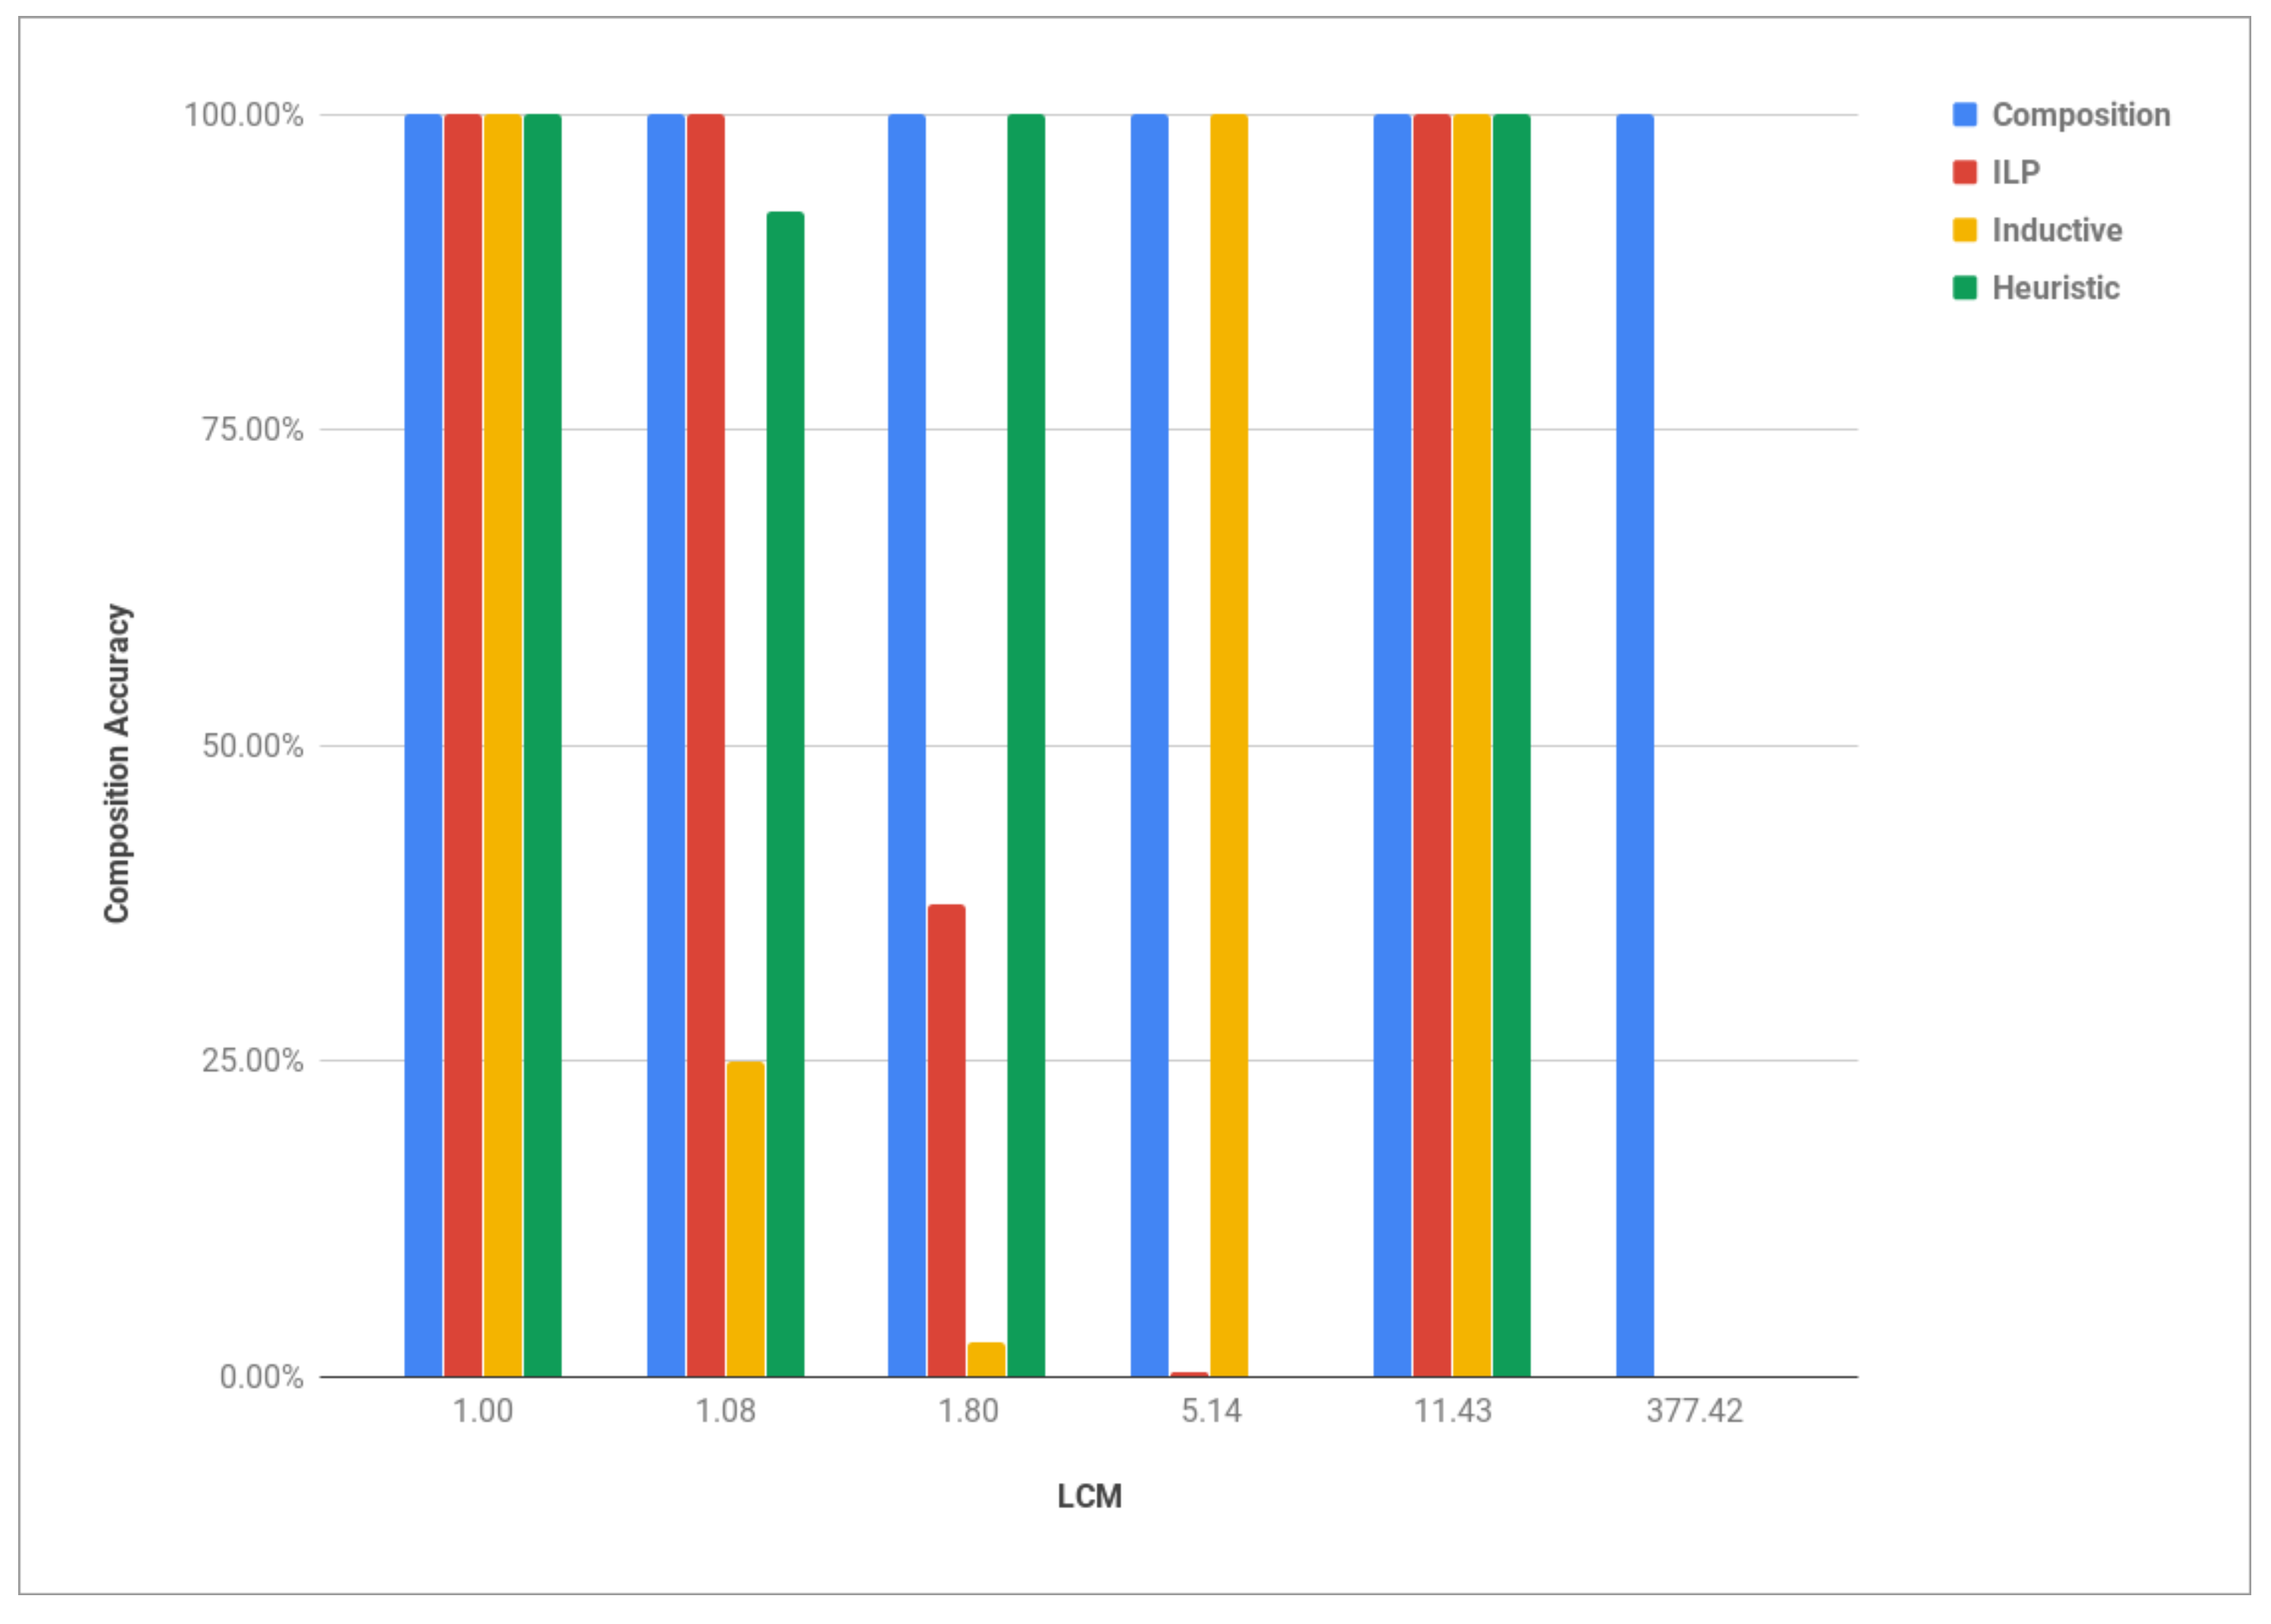
7.2. Graph-Based Model Composition

For the purpose of evaluating the proposed composition method, it might have been convenient to use one of the existing metrics for analyzing process discovery algorithms, such as replay fitness, simplicity, precision and generalization [79]. However, in process composition, we focus mainly on the allowed behavior of the process instead of analyzing the graphical layout of the model. Therefore, we determine the rate to which the generated BPMN diagram can satisfy the set of workflow traces generated by solving the constraint satisfaction problem.
In order to do so, we use the concept of log-based process model verification, which consists of generating a synthetic set of traces based on the resulting diagram and comparing it to the original log. A model can be considered perfectly composed if the original log is sufficiently complete (see Definition 1) with respect to this model. Thus, the generated model should allow one to execute all the sequences represented by original traces and no more. To verify this ability, we propose a metric called composition accuracy. It combines the following measures:
  • model fitness: the percentage of traces from the original log, which were generated based on the composed model,
  • execution precision: the percentage of generated workflow traces that are allowed in the original log.
    C A = model _ fitness × execution _ precision
The metric can be calculated as defined in Formula (9). In order to illustrate its use, we provide an elementary example. Let W C be a complete workflow log generated based on a declarative specification (Formula (10)).
W C = { { A , B , C } , { B , A , C } , { A , B , C , D } , { B , A , C , D } } .
Let us assume that a BPMN model was composed based on log W C . The set of traces generated from the resulting model is a synthetic log W S (Formula (11)).
W S = { { A , B , C , D } , { B , A , C , D } , { A , C , B , D } } .
As can be clearly seen, two logs significantly differ. First, the generated model allows one to reproduce only half of the original traces since traces without activity D do not occur in W S . The model fitness is then equal to 50%. Secondly, log W C does not contain sequence { A , C , B , D } . In this case, the composed model allows for more behavior than the original log. This leads to an execution precision equal to 66.67%. Multiplying these two metrics results in a composition accuracy equal to 33.34%.
In order to verify the ability of our approach to compose BPMN models based on a synthetic workflow log, we compare it to process mining algorithms that were briefly reviewed in Table 7. At the first step, we have excluded Alpha Miner because of its inability to discover loops [68]. Figure 10 presents the results of comparing the activity graph-based composition described in Section 6.2 to three process discovery algorithms, namely: ILP Miner, Inductive Miner and Heuristic Miner. All the mining algorithms were executed in the ProM 6 environment [59], with a minimal noise threshold and default parameters for the others.
The results show that there is no explicit correlation between log-based complexity and the composition accuracy. However, one may observe that the models where process mining algorithms achieved less accurate results are characterized by higher looping depth (see Table 9). Therefore, we have grouped the results by looping depth and presented the average composition accuracy for each value in Figure 11.

7.3. Limitations

The main purpose of the proposed method is to facilitate business process modeling by automating tasks that need to be executed between creating a specification of the process and obtaining the final model. However, modeling a business process will still require manual actions of different stakeholders of the process, i.e., process owners or process analysts, such as identifying tasks and participants, as well as defining the desired final outcome.
In order to be commonly used in practice, such a method needs to be versatile enough not only by managing cases of high complexity, as described in Section 7.2, but also by assuring the support of commonly-used elements of the selected notation.
Since our approach consists of multiple steps based on different algorithms, the support of modeling elements is limited in multiple phases, which include:
  • creating the spreadsheet specification (see Section 4),
  • generating a synthetic workflow log (see Section 5),
  • composing the final model (see Section 6).
Therefore, if there is a need to include a BPMN element in the method, it should be supported by all three main stages of the process composition. In 2008, zur Muehlen and Recker [80] analyzed a set of business process models and ranked 50 different BPMN 1.0 elements in terms of frequency distribution. Although the survey did not cover the most recent business cases, it is still considered valid in terms of element usage in BPMN process models [81]. Their results show that over 75% of the constructs were present in less than 30% of diagrams used in consulting engagements. Table 10 shows the current support of our approach for the 12 most frequently-occurring BPMN elements.
In the presented approach, we do not explicitly support the multi-instance or loops markers for tasks. Our approach supports loops modeled in an explicit way using the sequence flow. A short loop containing a single task can be later refined into a task with a loop marker. However, such process refactoring is out of the scope of this paper.

8. Conclusions

In this paper, we presented a method for participatory business process modeling. Our approach consists of collecting data coming from different process participants and merging it into one declarative specification of performed tasks. Based on this semi-formal description, we generate a set of synthetic workflow logs, which is then used to obtain the final model.
For the generation of BPMN models based on the set of generated traces, we propose two approaches, namely: the mining-driven model generation and the activity graph-based composition. The former uses existing process mining techniques, while the latter is an in-house technique that merges the logs into an activity graph and transforms it into a BPMN model. The presentation of both approaches is followed by a comparative analysis performed on a set of example models.
As a future work, we plan to develop an integrated tool that uses the proposed techniques to generate the correct BPMN model. Our aim is to generate BPMN diagrams using partially structured data from different sources, using multiple spreadsheet files as inputs. An integral part of such an extension would be an integrated tool for merging and validating data provided by the participants by filling in the appropriate forms. Another challenge is to model additional BPMN constructs, such as message flows or associations.

Supplementary Materials

The repository is available online at www.github.com/wpk1124/ProcessComposer_v2. The repository includes: a set of sample BPMN models, evaluation results, the constraint-based model used for workflow log generation and the source code of the application used for model composition.

Author Contributions

Conceptualization, P.W. and K.K. Formal analysis, A.L. Methodology, P.W. Software, P.W. Supervision, A.L. Validation, K.K. and A.L. Visualization, P.W. Writing, review and editing, K.K. and A.L.

Funding

The research reported in this paper as well as the open access charge were financed by the AGH UST grant.

Acknowledgments

The authors would like to thank the anonymous reviewers for providing valuable comments and suggestions to improve the paper.

Conflicts of Interest

The authors declare no conflict of interest.

References

  1. Object Management Group (OMG). Business Process Model and Notation (BPMN): Version 2.0 Specification; Technical Report Formal/2011-01-03; Object Management Group: Needham, MA, USA, 2011. [Google Scholar]
  2. Object Management Group (OMG). Decision Model and Notation, Version 1.0.; Technical Report Formal/2015-09-01; Object Management Group: Needham, MA, USA, 2015. [Google Scholar]
  3. Miller, J.; Mukerji, J. MDA Guide Version 1.0.1; Object Management Group (OMG): Needham, MA, USA, 2003. [Google Scholar]
  4. Weske, M. Business Process Management: Concepts, Languages, Architectures, 2nd ed.; Springer: Berlin/Heidelberg, Germany, 2012. [Google Scholar]
  5. Lawrence, P. (Ed.) Workflow Handbook; John Wiley & Sons, Inc.: New York, NY, USA, 1997. [Google Scholar]
  6. Van der Aalst, W. Business process management: A personal view. Bus. Process Manag. J. 2004, 10. [Google Scholar] [CrossRef]
  7. Lindsay, A.; Dawns, D.; Lunn, K. Business Processes—Attempts to Find a Definition. Inf. Softw. Technol. 2003, 45, 1015–1019. [Google Scholar] [CrossRef]
  8. Kluza, K.; Wiśniewski, P.; Jobczyk, K.; Ligęza, A.; Mroczek, A.S. Comparison of selected modeling notations for process, decision and system modeling. In Proceedings of the 2017 Federated Conference on IEEE Computer Science and Information Systems (FedCSIS), Prague, Czech Republic, 3–6 September 2017; pp. 1095–1098. [Google Scholar]
  9. Chinosi, M.; Trombetta, A. BPMN: An introduction to the standard. Comput. Stand. Interfaces 2012, 34, 124–134. [Google Scholar] [CrossRef]
  10. Kluza, K.; Jobczyk, K.; Wiśniewski, P.; Ligęza, A. Overview of Time Issues with Temporal Logics for Business Process Models. In Proceedings of the 2016 Federated Conference on Computer Science and Information Systems, Gdansk, Poland, 11–14 September 2016; Ganzha, M., Maciaszek, L., Paprzycki, M., Eds.; IEEE: Piscataway, NJ, USA, 2016; Volume 8, pp. 1115–1123. [Google Scholar] [CrossRef]
  11. Arevalo, C.; Escalona, M.; Ramos, I.; Domínguez-Muñoz, M. A metamodel to integrate business processes time perspective in BPMN 2.0. Inf. Softw. Technol. 2016, 77, 17–33. [Google Scholar] [CrossRef] [Green Version]
  12. Pillat, R.M.; Oliveira, T.C.; Alencar, P.S.; Cowan, D.D. BPMNt: A BPMN extension for specifying software process tailoring. Inf. Softw. Technol. 2015, 57, 95–115. [Google Scholar] [CrossRef]
  13. Gómez-López, M.T.; Reina Quintero, A.M.; Parody, L.; Pérez Álvarez, J.M.; Reichert, M. An Architecture for Querying Business Process, Business Process Instances, and Business Data Models. In Business Process Management Workshops; Teniente, E., Weidlich, M., Eds.; Springer International Publishing: Cham, Switzerland, 2018; pp. 757–769. [Google Scholar]
  14. Yousfi, A.; Bauer, C.; Saidi, R.; Dey, A.K. uBPMN: A BPMN extension for modeling ubiquitous business processes. Inf. Softw. Technol. 2016, 74, 55–68. [Google Scholar] [CrossRef]
  15. Wohed, P.; van der Aalst, W.M.P.; Dumas, M.; ter Hofstede, A.H.M.; Russell, N. On the Suitability of BPMN for Business Process Modelling. In Business Process Management, Proceedings of the 4th International Conference, BPM 2006, Vienna, Austria, 5–7 September 2006; Dustdar, S., Fiadeiro, J.L., Sheth, A.P., Eds.; Springer: Berlin/Heidelberg, Germany, 2006; pp. 161–176. [Google Scholar] [CrossRef] [Green Version]
  16. Lodhi, A.; Küppen, V.; Saake, G. An Extension of BPMN Meta-model for Evaluation of Business Processes. Sci. J. Riga Tech. Univ. 2011, 43, 27–34. [Google Scholar] [CrossRef] [Green Version]
  17. Ligęza, A. BPMN—A logical model and property analysis. Decis. Mak. Manuf. Serv. 2011, 5, 57–67. [Google Scholar]
  18. Meyer, A.; Pufahl, L.; Fahland, D.; Weske, M. Modeling and Enacting Complex Data Dependencies in Business Processes. In Business Process Management, Proceedings of the 11th International Conference, BPM 2013, Beijing, China, 26–30 August 2013; Springer: Berlin/Heidelberg, Germany, 2013; pp. 171–186. [Google Scholar]
  19. Friedrich, F.; Mendling, J.; Puhlmann, F. Process Model Generation from Natural Language Text. In Advanced Information Systems Engineering; Lecture Notes in Computer Science; Mouratidis, H., Rolland, C., Eds.; Springer: Berlin/Heidelberg, Germany, 2011; Volume 6741, pp. 482–496. [Google Scholar]
  20. Reijers, H.A.; Limam, S.; van der Aalst, W.M.P. Product-based workflow design. J. Manag. Inf. Syst. 2003, 20, 229–262. [Google Scholar]
  21. Kluza, K.; Honkisz, K. From SBVR to BPMN and DMN models. proposal of translation from rules to process and decision models. In International Conference on Artificial Intelligence and Soft Computing; Springer: Cham, Switzerland, 2016; pp. 453–462. [Google Scholar]
  22. Milani, F.; Dumas, M.; Matulevičius, R. Decomposition driven consolidation of process models. In International Conference on Advanced Information Systems Engineering; Springer: Berlin/Heidelberg, Germany, 2013; pp. 193–207. [Google Scholar]
  23. Nawrocki, J.R.; Nedza, T.; Ochodek, M.; Olek, L. Describing Business Processes with Use Cases; BIS: Klagenfurt, Austria, 2006; pp. 13–27. [Google Scholar]
  24. Lubke, D.; Schneider, K.; Weidlich, M. Visualizing Use Case Sets as BPMN Processes. In Proceedings of the 2008 Requirements Engineering Visualization (REV ’08), Barcelona, Spain, 8 September 2008; pp. 21–25. [Google Scholar]
  25. Zafar, U.; Bhuiyan, M.; Prasad, P.; Haque, F. Integration of use case models and BPMN using Goal-Oriented requirements engineering. J. Comput. 2018, 13, 212–222. [Google Scholar]
  26. Suchenia, A.; Kluza, K.; Jobczyk, K.; Wiśniewski, P.; Wypych, M.; Ligęza, A. Supporting BPMN Process Models with UML Sequence Diagrams for Representing Time Issues and Testing Models. In International Conference on Artificial Intelligence and Soft Computing; Springer: Cham, Switzerland, 2017; pp. 589–598. [Google Scholar]
  27. Hasic, F.; De Smedt, J.; Vanthienen, J. Towards assessing the theoretical complexity of the decision model and notation (DMN). In Proceedings of the 8th International Workshop on Enterprise Modeling and Information Systems Architectures (EMISA), Essen, Germany, 12–13 June 2017; pp. 64–71. [Google Scholar]
  28. Nešković, S.; Kirchner, K. Using Context Information and CMMN to Model Knowledge-Intensive Business Processes. In Proceedings of the 6th International Conference on Information Society and Technology ICIST 2016, Kopaonik, Serbia, 28 February – 2 March 2016; pp. 17–21. [Google Scholar]
  29. Van der Aalst, W. On the automatic generation of workflow processes based on product structures. Comput. Ind. 1999, 39, 97–111. [Google Scholar] [CrossRef]
  30. Vanderfeesten, I.; Reijers, H.; Aalst, W. Case Handling Systems as Product Based Workflow Design Support. In Enterprise Information Systems; Lecture Notes in Business Information Processing; Filipe, J., Cordeiro, J., Cardoso, J., Eds.; Springer: Berlin/Heidelberg, Germany, 2009; Volume 12, pp. 187–198. [Google Scholar]
  31. Vanderfeesten, I.; Reijers, H.; Aalst, W.; Vogelaar, J. Automatic Support for Product Based Workflow Design: Generation of Process Models from a Product Data Model. In On the Move to Meaningful Internet Systems: OTM 2010 Workshops; Lecture Notes in Computer Science; Meersman, R., Dillon, T., Herrero, P., Eds.; Springer: Berlin/Heidelberg, Germany, 2010; Volume 6428, pp. 665–674. [Google Scholar]
  32. Vanderfeesten, I.; Reijers, H.A.; van der Aalst, W.M.P. Product-based workflow support. Inf. Syst. 2011, 36, 517–535. [Google Scholar] [CrossRef]
  33. Van der Aa, H.; Reijers, H.A.; Vanderfeesten, I. Composing workflow activities on the basis of data-flow structures. In Business Process Management; Springer: Berlin/Heidelberg, Germany, 2013; pp. 275–282. [Google Scholar]
  34. Vanderfeesten, I.; Reijers, H.A.; van der Aalst, W.M.P. Product based workflow support: Dynamic workflow execution. In Advanced Information Systems Engineering; Springer: Berlin/Heidelberg, Germany, 2008; pp. 571–574. [Google Scholar]
  35. Li, S.; Shao, X.; Zhang, Z.; Chang, J. Dynamic Workflow Modeling Based on Product Structure Tree. Appl. Math. 2012, 6, 751–757. [Google Scholar]
  36. Li, S.; Shao, X.D.; Chang, J.T. Dynamic workflow modeling oriented to product design process. Comput. Integr. Manuf. Syst. 2012, 18, 1136–1144. [Google Scholar]
  37. Wu, F.; Priscilla, L.; Gao, M.; Caron, F.; Roover, W.; Vanthienen, J. Modeling Decision Structures and Dependencies. In On the Move to Meaningful Internet Systems: OTM 2012 Workshops; Lecture Notes in Computer Science; Herrero, P., Panetto, H., Meersman, R., Dillon, T., Eds.; Springer: Berlin/Heidelberg, Germany, 2012; Volume 7567, pp. 525–533. [Google Scholar]
  38. Roover, W.; Vanthienen, J. On the Relation between Decision Structures, Tables and Processes. In On the Move to Meaningful Internet Systems: OTM 2011 Workshops; Lecture Notes in Computer Science; Meersman, R., Dillon, T., Herrero, P., Eds.; Springer: Berlin/Heidelberg, Germany, 2011; Volume 7046, pp. 591–598. [Google Scholar]
  39. Kluza, K.; Nalepa, G.J. A method for generation and design of business processes with business rules. Inf. Softw. Technol. 2017, 91, 123–141. [Google Scholar] [CrossRef]
  40. Gómez-López, M.T.; Pérez-Álvarez, J.M.; Varela-Vaca, A.J.; Gasca, R.M. Guiding the Creation of Choreographed Processes with Multiple Instances Based on Data Models. In Business Process Management Workshops; Dumas, M., Fantinato, M., Eds.; Springer International Publishing: Cham, Switzerland, 2017; pp. 239–251. [Google Scholar]
  41. Goedertier, S.; Vanthienen, J.; Caron, F. Declarative business process modelling: Principles and modelling languages. Enterp. Inf. Syst. 2015, 9, 161–185. [Google Scholar] [CrossRef] [Green Version]
  42. De Giacomo, G.; Dumas, M.; Maggi, F.M.; Montali, M. Declarative Process Modeling in BPMN. In Advanced Information Systems Engineering, Proceedings of the 27th International Conference, CAiSE 2015, Stockholm, Sweden, 8–12 June 2015; Springer International Publishing: Cham, Switzerland, 2015; pp. 84–100. [Google Scholar] [CrossRef]
  43. Reijers, H.A.; Slaats, T.; Stahl, C. Declarative modeling—An academic dream or the future for BPM? In Business Process Management; Springer: Berlin/Heidelberg, Germany, 2013; pp. 307–322. [Google Scholar]
  44. Prescher, J.; Di Ciccio, C.; Mendling, J. From Declarative Processes to Imperative Models. In Proceedings of the Fourth International Symposium on Data-driven Process Discovery and Analysis SIMPDA 2014, Milan, Italy, 19–21 November 2014; pp. 162–173. [Google Scholar]
  45. Mrasek, R.; Mülle, J.; Böhm, K. Automatic generation of optimized process models from declarative specifications. In International Conference on Advanced Information Systems Engineering; Springer: Cham, Switzerland, 2015; pp. 382–397. [Google Scholar]
  46. Jiménez-Ramírez, A.; Weber, B.; Barba, I.; Del Valle, C. Generating optimized configurable business process models in scenarios subject to uncertainty. Inf. Softw. Technol. 2015, 57, 571–594. [Google Scholar] [CrossRef] [Green Version]
  47. Parody, L.; Gómez-López, M.T.; Gasca, R.M. Hybrid business process modeling for the optimization of outcome data. Inf. Softw. Technol. 2016, 70, 140–154. [Google Scholar] [CrossRef]
  48. Tang, Y.; Mackey, I.; Su, J. Querying workflow logs. Information 2018, 9, 25. [Google Scholar] [CrossRef]
  49. Arriagada-Benítez, M.; Sepúlveda, M.; Munoz-Gama, J.; Buijs, J.C. Strategies to automatically derive a process model from a configurable process model based on event data. Appl. Sci. 2017, 7, 1023. [Google Scholar] [CrossRef]
  50. Chesani, F.; Ciampolini, A.; Loreti, D.; Mello, P. Abduction for Generating Synthetic Traces. In International Conference on Business Process Management; Springer: Cham, Switzerland, 2017; pp. 151–159. [Google Scholar]
  51. Rossi, F.; Van Beek, P.; Walsh, T. Handbook of Constraint Programming; Elsevier: Boston, MA, USA, 2006. [Google Scholar]
  52. Wiśniewski, P.; Kluza, K.; Ślażyński, M.; Ligęza, A. Constraint-Based Composition of Business Process Models. In Business Process Management Workshops; BPM 2017; Lecture Notes in Business Information Processing; Springer: Cham, Switzerland, 2018; Volume 308, pp. 133–141. [Google Scholar]
  53. Weijters, A.; van Der Aalst, W.M.; De Medeiros, A.A. Process mining with the heuristics miner-algorithm. TU Eindhoven. Tech. Rep. WP 2006, 166, 1–34. [Google Scholar]
  54. Gaaloul, W.; Baïna, K.; Godart, C. A bottom-up workflow mining approach for workflow applications analysis. In Data Engineering Issues in E-Commerce and Services; Springer: Berlin/Heidelberg, Germany, 2006; pp. 182–197. [Google Scholar]
  55. Chenouard, R.; Granvilliers, L.; Soto, R. Model-driven constraint programming. In Proceedings of the 10th International ACM SIGPLAN Conference on Principles and Practice of Declarative Programming, Valencia, Spain, 15–17 July 2008; ACM: New York, NY, USA, 2008; pp. 236–246. [Google Scholar]
  56. Nethercote, N.; Stuckey, P.J.; Becket, R.; Brand, S.; Duck, G.J.; Tack, G. MiniZinc: Towards a Standard CP Modelling Language. In Principles and Practice of Constraint Programming—CP 2007, Proceedings of the 13th International Conference, Providence, RI, USA, 23–27 September 2007; Bessière, C., Ed.; Springer: Berlin/Heidelberg, Germany, 2007; pp. 529–543. [Google Scholar] [CrossRef]
  57. Schulte, C.; Stuckey, P.J. Efficient Constraint Propagation Engines. ACM Trans. Program. Lang. Syst. 2008, 31, 2:1–2:43. [Google Scholar] [CrossRef]
  58. Van der Aalst, W. Process Mining Software. In Process Mining: Data Science in Action; Springer: Berlin/Heidelberg, Germany, 2016; pp. 325–352. [Google Scholar]
  59. Van der Aalst, W.M.; van Dongen, B.F.; Günther, C.W.; Rozinat, A.; Verbeek, E.; Weijters, T. ProM: The process mining toolkit. BPM (Demos) 2009, 489, 2. [Google Scholar]
  60. Van Der Aalst, W.; Adriansyah, A.; De Medeiros, A.K.A.; Arcieri, F.; Baier, T.; Blickle, T.; Bose, J.C.; van den Brand, P.; Brandtjen, R.; Buijs, J.; et al. Process mining manifesto. In International Conference on Business Process Management; Springer: Berlin/Heidelberg, Germany, 2011; pp. 169–194. [Google Scholar]
  61. Van Dongen, B.F.; De Medeiros, A.A.; Wen, L. Process mining: Overview and outlook of petri net discovery algorithms. In Transactions on Petri Nets and Other Models of Concurrency II; Springer: Berlin/Heidelberg, Germany, 2009; pp. 225–242. [Google Scholar]
  62. Leemans, S.J.; Fahland, D.; van der Aalst, W.M. Exploring processes and deviations. In International Conference on Business Process Management; Springer: Cham, Switzerland, 2014; pp. 304–316. [Google Scholar]
  63. Van der Werf, J.M.E.; van Dongen, B.F.; Hurkens, C.A.; Serebrenik, A. Process discovery using integer linear programming. In International Conference on Applications and Theory of Petri Nets; Springer: Berlin/Heidelberg, Germany, 2008; pp. 368–387. [Google Scholar]
  64. Kalenkova, A.A.; van der Aalst, W.M.; Lomazova, I.A.; Rubin, V.A. Process mining using BPMN: Relating event logs and process models. Softw. Syst. Model. 2017, 16, 1019–1048. [Google Scholar] [CrossRef]
  65. Kundu, D.; Samanta, D. A Novel Approach to Generate Test Cases from UML Activity Diagrams. J. Object Technol. 2009, 8, 65–83. [Google Scholar] [CrossRef]
  66. Maggi, F.M.; Mooij, A.J.; van der Aalst, W.M. User-guided discovery of declarative process models. In Proceedings of the 2011 IEEE Symposium on Computational Intelligence and Data Mining (CIDM), Paris, France, 11–15 April 2011; pp. 192–199. [Google Scholar]
  67. Van der Aalst, W.; Weijters, T.; Maruster, L. Workflow mining: Discovering process models from event logs. IEEE Trans. Knowl. Data Eng. 2004, 16, 1128–1142. [Google Scholar] [CrossRef]
  68. Alves de Medeiros, A.; Van Dongen, B.; Van Der Aalst, W.; Weijters, A. Process Mining: Extending the Alpha-Algorithm to Mine Short Loops; Technical Report, BETA Working Paper Series; Eindhoven University of Technology: Eindhoven, The Netherlands, 2004. [Google Scholar]
  69. Nielsen, M.; Plotkin, G.; Winskel, G. Petri nets, event structures and domains. In Semantics of Concurrent Computation; Springer: Berlin/Heidelberg, Germany, 1979; pp. 266–284. [Google Scholar]
  70. Armas-Cervantes, A.; García-Bañuelos, L.; Dumas, M. Event structures as a foundation for process model differencing, part 1: Acyclic processes. In International Workshop on Web Services and Formal Methods; Springer: Berlin/Heidelberg, Germany, 2012; pp. 69–86. [Google Scholar]
  71. Wiśniewski, P.; Ligęza, A. Constraint-Based Identification of Complex Gateway Structures in Business Process Models. In International Conference on Artificial Intelligence and Soft Computing; Springer: Berlin/Heidelberg, Germany, 2018; pp. 788–798. [Google Scholar]
  72. Meyer, B. Self-organizing graphs—A neural network perspective of graph layout. In International Symposium on Graph Drawing; Springer: Berlin/Heidelberg, Germany, 1998; pp. 246–262. [Google Scholar]
  73. Crosmarie, G.; Salatge, N.; EasyBPMN. EasyBPMN Toolbox—A Powerful Java Library for BPMN 2.0. Available online: https://research.linagora.com/display/easybpmn/ (accessed on 2 May 2018).
  74. Bazhenova, E.; Buelow, S.; Weske, M. Discovering decision models from event logs. In International Conference on Business Information Systems; Springer: Cham, Switzerland, 2016; pp. 237–251. [Google Scholar]
  75. Bonnet, F.; Decker, G.; Dugan, L.; Kurz, M.; Misiak, Z.; Ringuette, S. Making BPMN a true lingua franca. BPM Trends. 2014. Available online: http://www.bptrends.com/making-bpmn-a-true-lingua-franca/ (accessed on 2 August 2018).
  76. Kluza, K.; Nalepa, G.J.; Lisiecki, J. Square complexity metrics for business process models. In Advances in Business ICT; Springer: Cham, Switzerland, 2014; pp. 89–107. [Google Scholar]
  77. Lassen, K.B.; van der Aalst, W.M.P. Complexity metrics for Workflow nets. Inf. Softw. Technol. 2009, 51, 610–625. [Google Scholar] [CrossRef]
  78. Wiśniewski, P. Decomposition of business process models into reusable sub-diagrams. ITM Web Conf. 2017, 15, 01002. [Google Scholar] [CrossRef] [Green Version]
  79. Buijs, J.C.; Van Dongen, B.F.; van Der Aalst, W.M. On the role of fitness, precision, generalization and simplicity in process discovery. In OTM Confederated International Conferences “On the Move to Meaningful Internet Systems”; Springer: Berlin/Heidelberg, Germany, 2012; pp. 305–322. [Google Scholar]
  80. Zur Muehlen, M.; Recker, J. How Much Language Is Enough? Theoretical and Practical Use of the Business Process Modeling Notation. In Advanced Information Systems Engineering, Proceedings of the 20th International Conference, CAiSE 2008 Montpellier, France, 16–20 June 2008; Bellahsène, Z., Léonard, M., Eds.; Springer: Berlin/Heidelberg, Germany, 2008; pp. 465–479. [Google Scholar] [CrossRef] [Green Version]
  81. Zur Muehlen, M.; Recker, J. We Still Don’t Know How Much BPMN Is Enough, But We Are Getting Closer. In Seminal Contributions to Information Systems Engineering: 25 Years of CAiSE; Bubenko, J., Krogstie, J., Pastor, O., Pernici, B., Rolland, C., Sølvberg, A., Eds.; Springer: Berlin/Heidelberg, Germany, 2013; pp. 445–451. [Google Scholar]
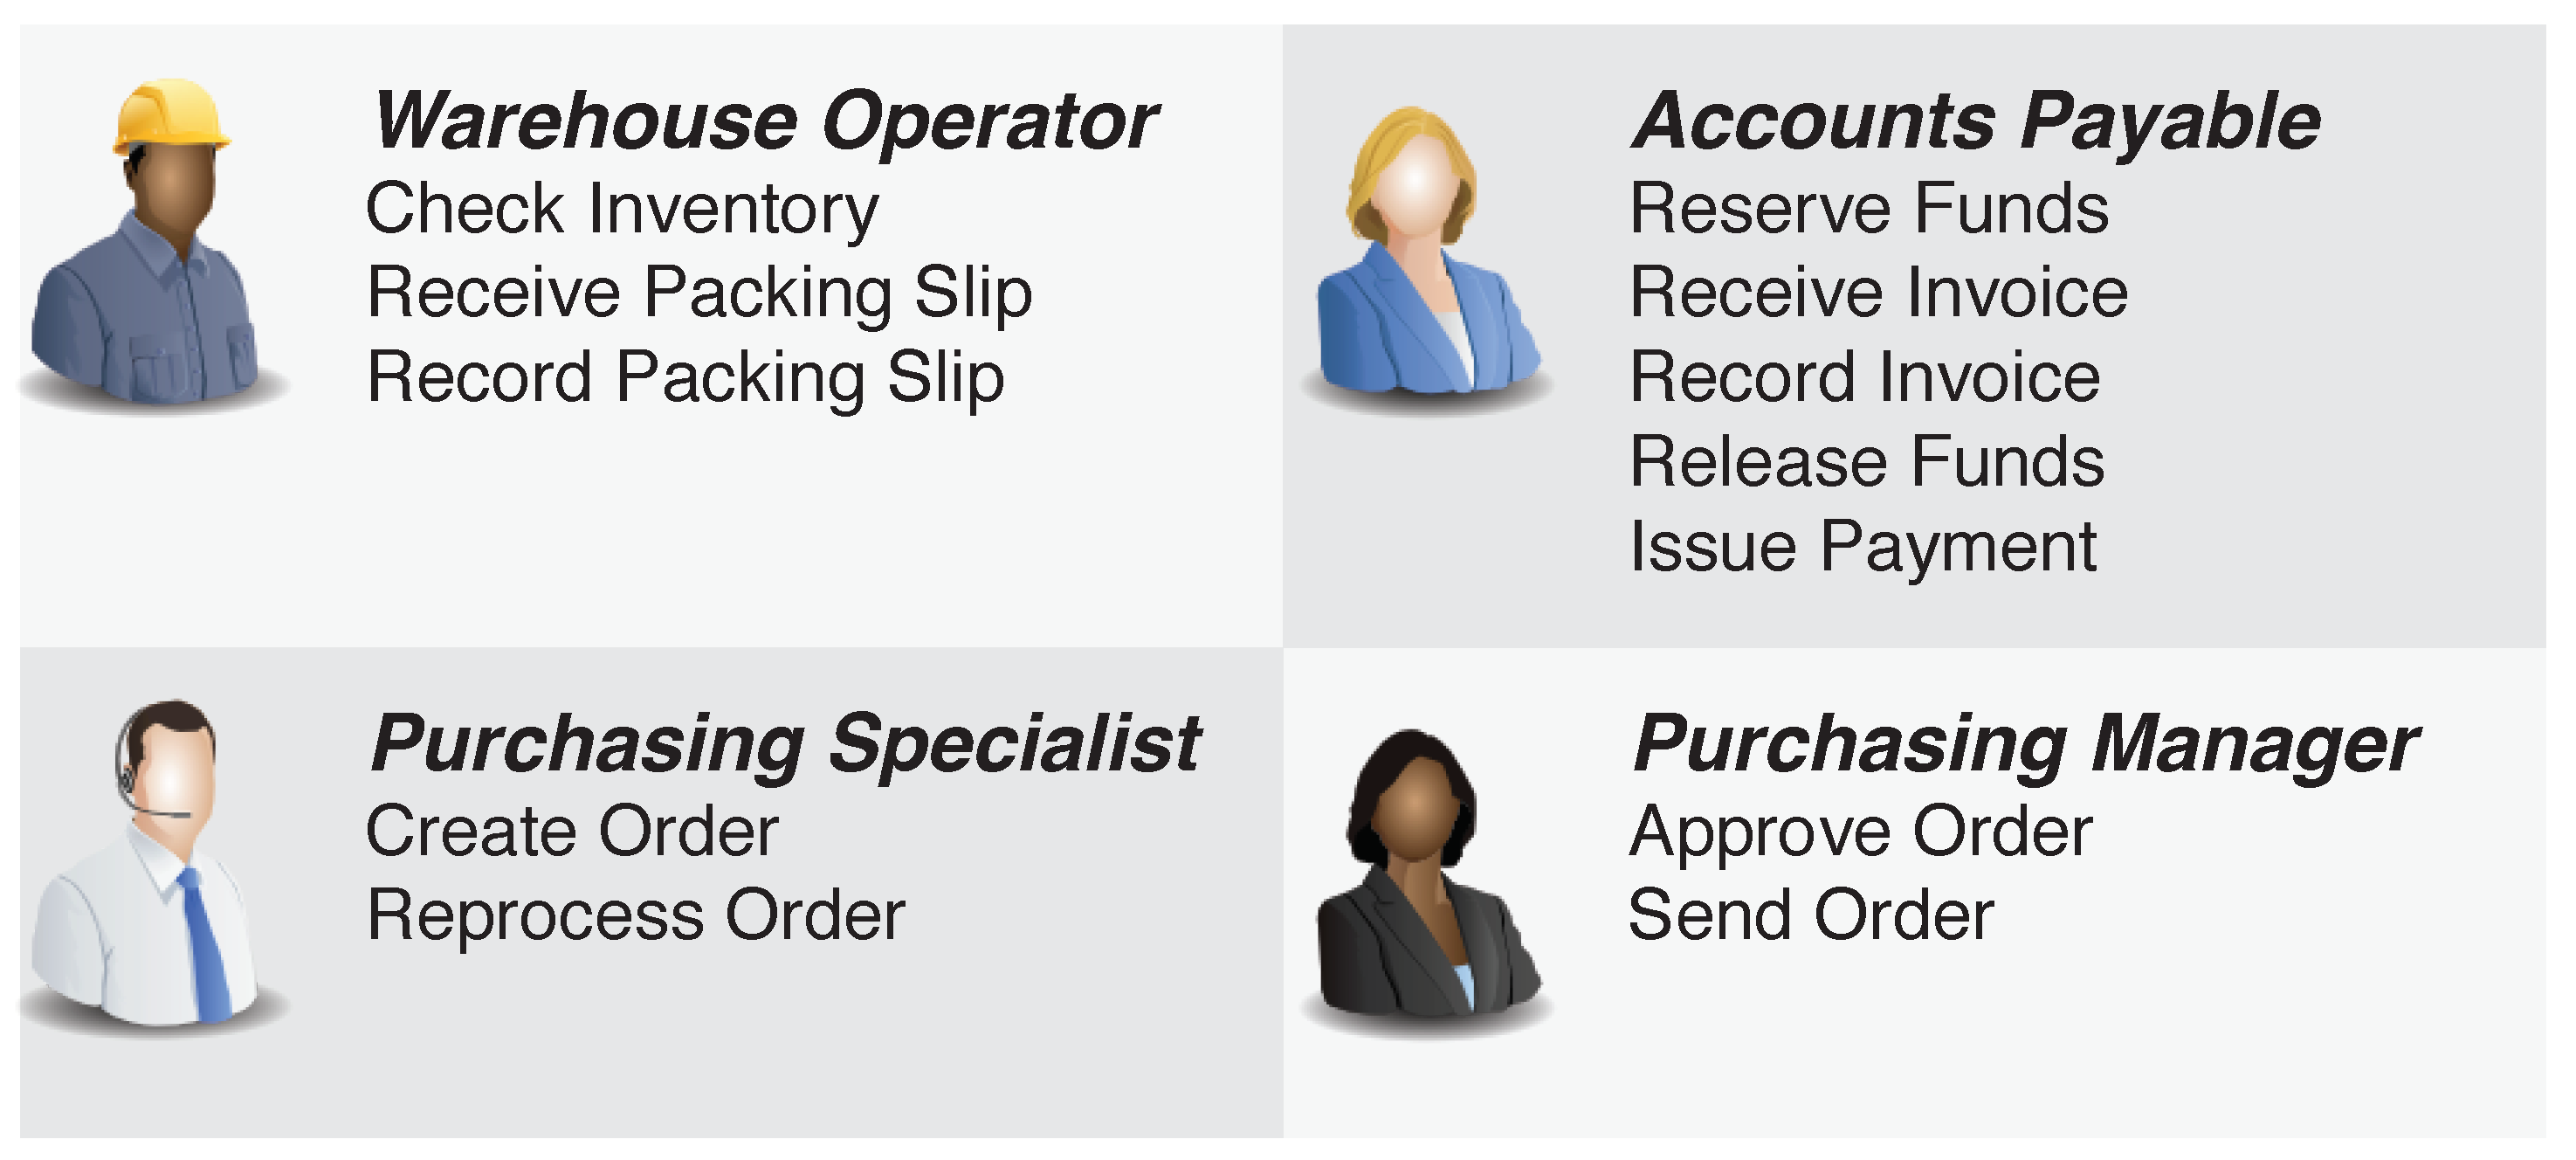
 [Green Version]
Figure 1. Outline of the approach divided into four main phases.
Applsci 08 01428 g001
Figure 2. A core subset of BPMN workflow model elements.
Applsci 08 01428 g002
Figure 3. Five basic control-flow patterns in BPMN models.
Applsci 08 01428 g003
Figure 4. Screenshot of the prototype form for the data acquisition.
Applsci 08 01428 g004
Figure 5. Roles of the participants in the example supply process.
Applsci 08 01428 g005
Figure 6. Activity graphs created from the example workflow logs: (a) W 1 and (b) W 2 .
Applsci 08 01428 g006
Figure 7. Complex gateway structure: (a) as a part of the activity graph; (b) after discovery.
Applsci 08 01428 g007
Figure 8. Metamodel of the supported BPMN subset.
Applsci 08 01428 g008
Figure 9. Example result of applying the graph-based composition algorithm. The graphical layout of flow objects has been enhanced with the Signavio editor [75].
Applsci 08 01428 g009
Figure 10. Comparison of applying different methods for BPMN diagram generation.
Applsci 08 01428 g010
Figure 11. Comparison of applying different methods for BPMN diagram generation.
Applsci 08 01428 g011
Table 1. Activities performed by the warehouse operator.
Task NameRequired DEsCreated DEsExecutions
Check InventoryGoods RequestInventory Checked1
Receive Packing SlipOrder SentPacking Slip1
Record Packing SlipPacking SlipPacking Slip Record1
Table 2. Activities performed by the accounts payable specialist.
Task NameRequired DEsCreated DEsExecutions
Reserve FundsOrder ReviewedFunds Reserved1
Receive InvoiceOrder SentInvoice1
Record InvoiceInvoiceInvoice Record1
Release FundsInvoice RecordFunds Released1
Packing Slip Record
Issue PaymentFunds ReleasedOrder Completed1
Table 3. Activities performed by the purchasing specialist.
Task NameRequired DEsCreated DEsExecutions
Create OrderInventory CheckedOrder Created1
Reprocess OrderOrder ReviewedOrder Reprocessed1
Table 4. Activities performed by the purchasing manager.
Task NameRequired DEsCreated DEsExecutions
Review OrderOrder CreatedOrder Reviewed2
(Order Reprocessed)
Send OrderFunds ReservedOrder Sent1
Table 5. Data entities present in the example business process.
IDNameType
01Goods RequestText/JSON
02Inventory CheckedBoolean
03Order SentBoolean
04Packing SlipText/JSON
05Packing Slip RecordInteger
06Order ReviewedBoolean
07Funds ReservedBoolean
08InvoiceText/JSON
09Invoice RecordInteger
10Funds ReleasedBoolean
11Order CompletedBoolean
12Order CreatedBoolean
13Order ReprocessedBoolean
Table 6. Explanation of process data structure values in the constraint model.
Value M TC M TE M ST s 0
1 not relevantunchangednot relevant
0forbiddendeletedforbiddenforbidden
1requiredcreatedrequiredrequired
Table 7. Comparison of selected process mining approaches present in the ProM environment (●—supported feature, ◐—partially supported feature).
Feature α AlgorithmHeuristic MinerILP MinerInductive Miner
Typeabstractionheuristiclanguageinductive
Construct discovery
Fitness tendencyoverfittingunderfittingoverfittingoverfitting
Generalization
Advantagesimplicitycontrol flowhigh fitnesshigh fitness
discovery
Inconveniencelow qualityhigh generalizationcomplex useblock division
Recommended✓✓✓✓✓
Table 8. Supported BPMN 2.0 XML elements and their attributes.
Element NameAttributes
startEventid, name
endEventid, name
taskid, name
parallelGatewayid, name, gatewayDirection
exclusiveGatewayid, name, gatewayDirection
sequenceFlowid, name, sourceRef, targetRef
Table 9. Example BPMN models used for method evaluation ( T , No. of activities; W , No. of traces). LCM, Log-based Complexity Metric; LD, Looping Depth; CFC, Control-Flow Complexity.
Process Model T W LCMLDCFC
Liability Insurance66101
Supply Management12131.0817
Student Project Evaluation591.819
Employee Hiring7365.1427
Bank Account Opening1416011.4308
Intricate Example3110,700345.16225
Table 10. Support for the most commonly-used BPMN elements based on ranking presented in [80] (●—supported, ◐—partially supported ○—not supported).
Element TypeSupport
Sequence Flow
Task
End Event
Start Event
Pool
Data-based XOR
Start Message
Text Annotation
Message Flow
Parallel Split/join
Lanes
Association

