1. Introduction
PCC pile is developed using a new technique combining the advantages of pre-stressed concrete (PC) pile, drilled pile, and steel pile for ground improvement of highway and railway engineering [
1]. Compared with other rigid concrete pile such as square pile, the PCC pile is simple in conformation, fast to construct, less concrete and more cost-efficient [
2]. It has been widely used for pile foundation in China, it has yielded great social and economic benefits. Liu H.L. and many other researchers have carried out a series of studies on PCC pile, including studying its bearing behavior under vertical and horizontal loads, its characteristics of negative friction, the squeezing soil effect and so on [
3,
4,
5,
6,
7,
8]. The deformation characteristics of PCC pile are important for optimum design and construction. Now, the standard for measuring the strain of pile is based upon electronic gauges; this method has the disadvantages of difficult layout, low survival rate, poor stability, and low precision. Furthermore, this method cannot measure the deformation of the pile accurately and comprehensively. In order to obtain the deformation of PCC pile, a new measuring method should be used to monitor the strain.
Distributed Optical Fiber Sensor (DOFS) technologies have been responsible for tremendous advances in strain measurement. The optical fiber is both a sensor and a transmission channel along the entire length of the fiber [
9]. DOFS technologies have been developed for monitoring geotechnical engineering, such as Optical Frequency Domain Reflectometer (OFDR), Fiber Bragg Grating (FBG), Brillouin Optical Time Domain Reflectometer (BOTDR), Brillouin Optical Time Domain Analysis (BOTDA), Brillouin Optical Frequency Domain Analysis (BOFDA), Brillouin Optical Correlation Domain Analysis (BOCDA), and so on. Compared with conventional sensors, the fiber optic sensor has benefits including resistance to corrosion, high precision, and small size. Among these technologies, the BOTDR, BOTDA, BOFDA, and BOCDA technologies are fully distributed, while FBG technology is quasi-distributed. The spatial resolutions are: OFDR (1 mm in the sensing range of 50–70 m), BOTDR (1 m in the sensing range of 50 km), BOTDA (2 cm in the sensing range of 2 km and 2 m in the sensing range of 150 km), BOFDA (20 cm in the sensing range of 3 km), BOCDA (7 cm in the sensing range of 5 km). The strain precisions are OFDR (1 με), BOTDR (40 με), BOTDA (20 με), BOFDA (2 με), BOCDA (10 με), FBG (1 με). The OFDR is a type of DOFS technologies which has shorter measuring time, higher sensitivity, and higher spatial resolution than other frequently-used DOFS technologies like BOTDR, BOTDA, BOFDA, BOCDA, and so on [
10,
11,
12,
13,
14,
15,
16,
17,
18,
19,
20,
21,
22,
23].
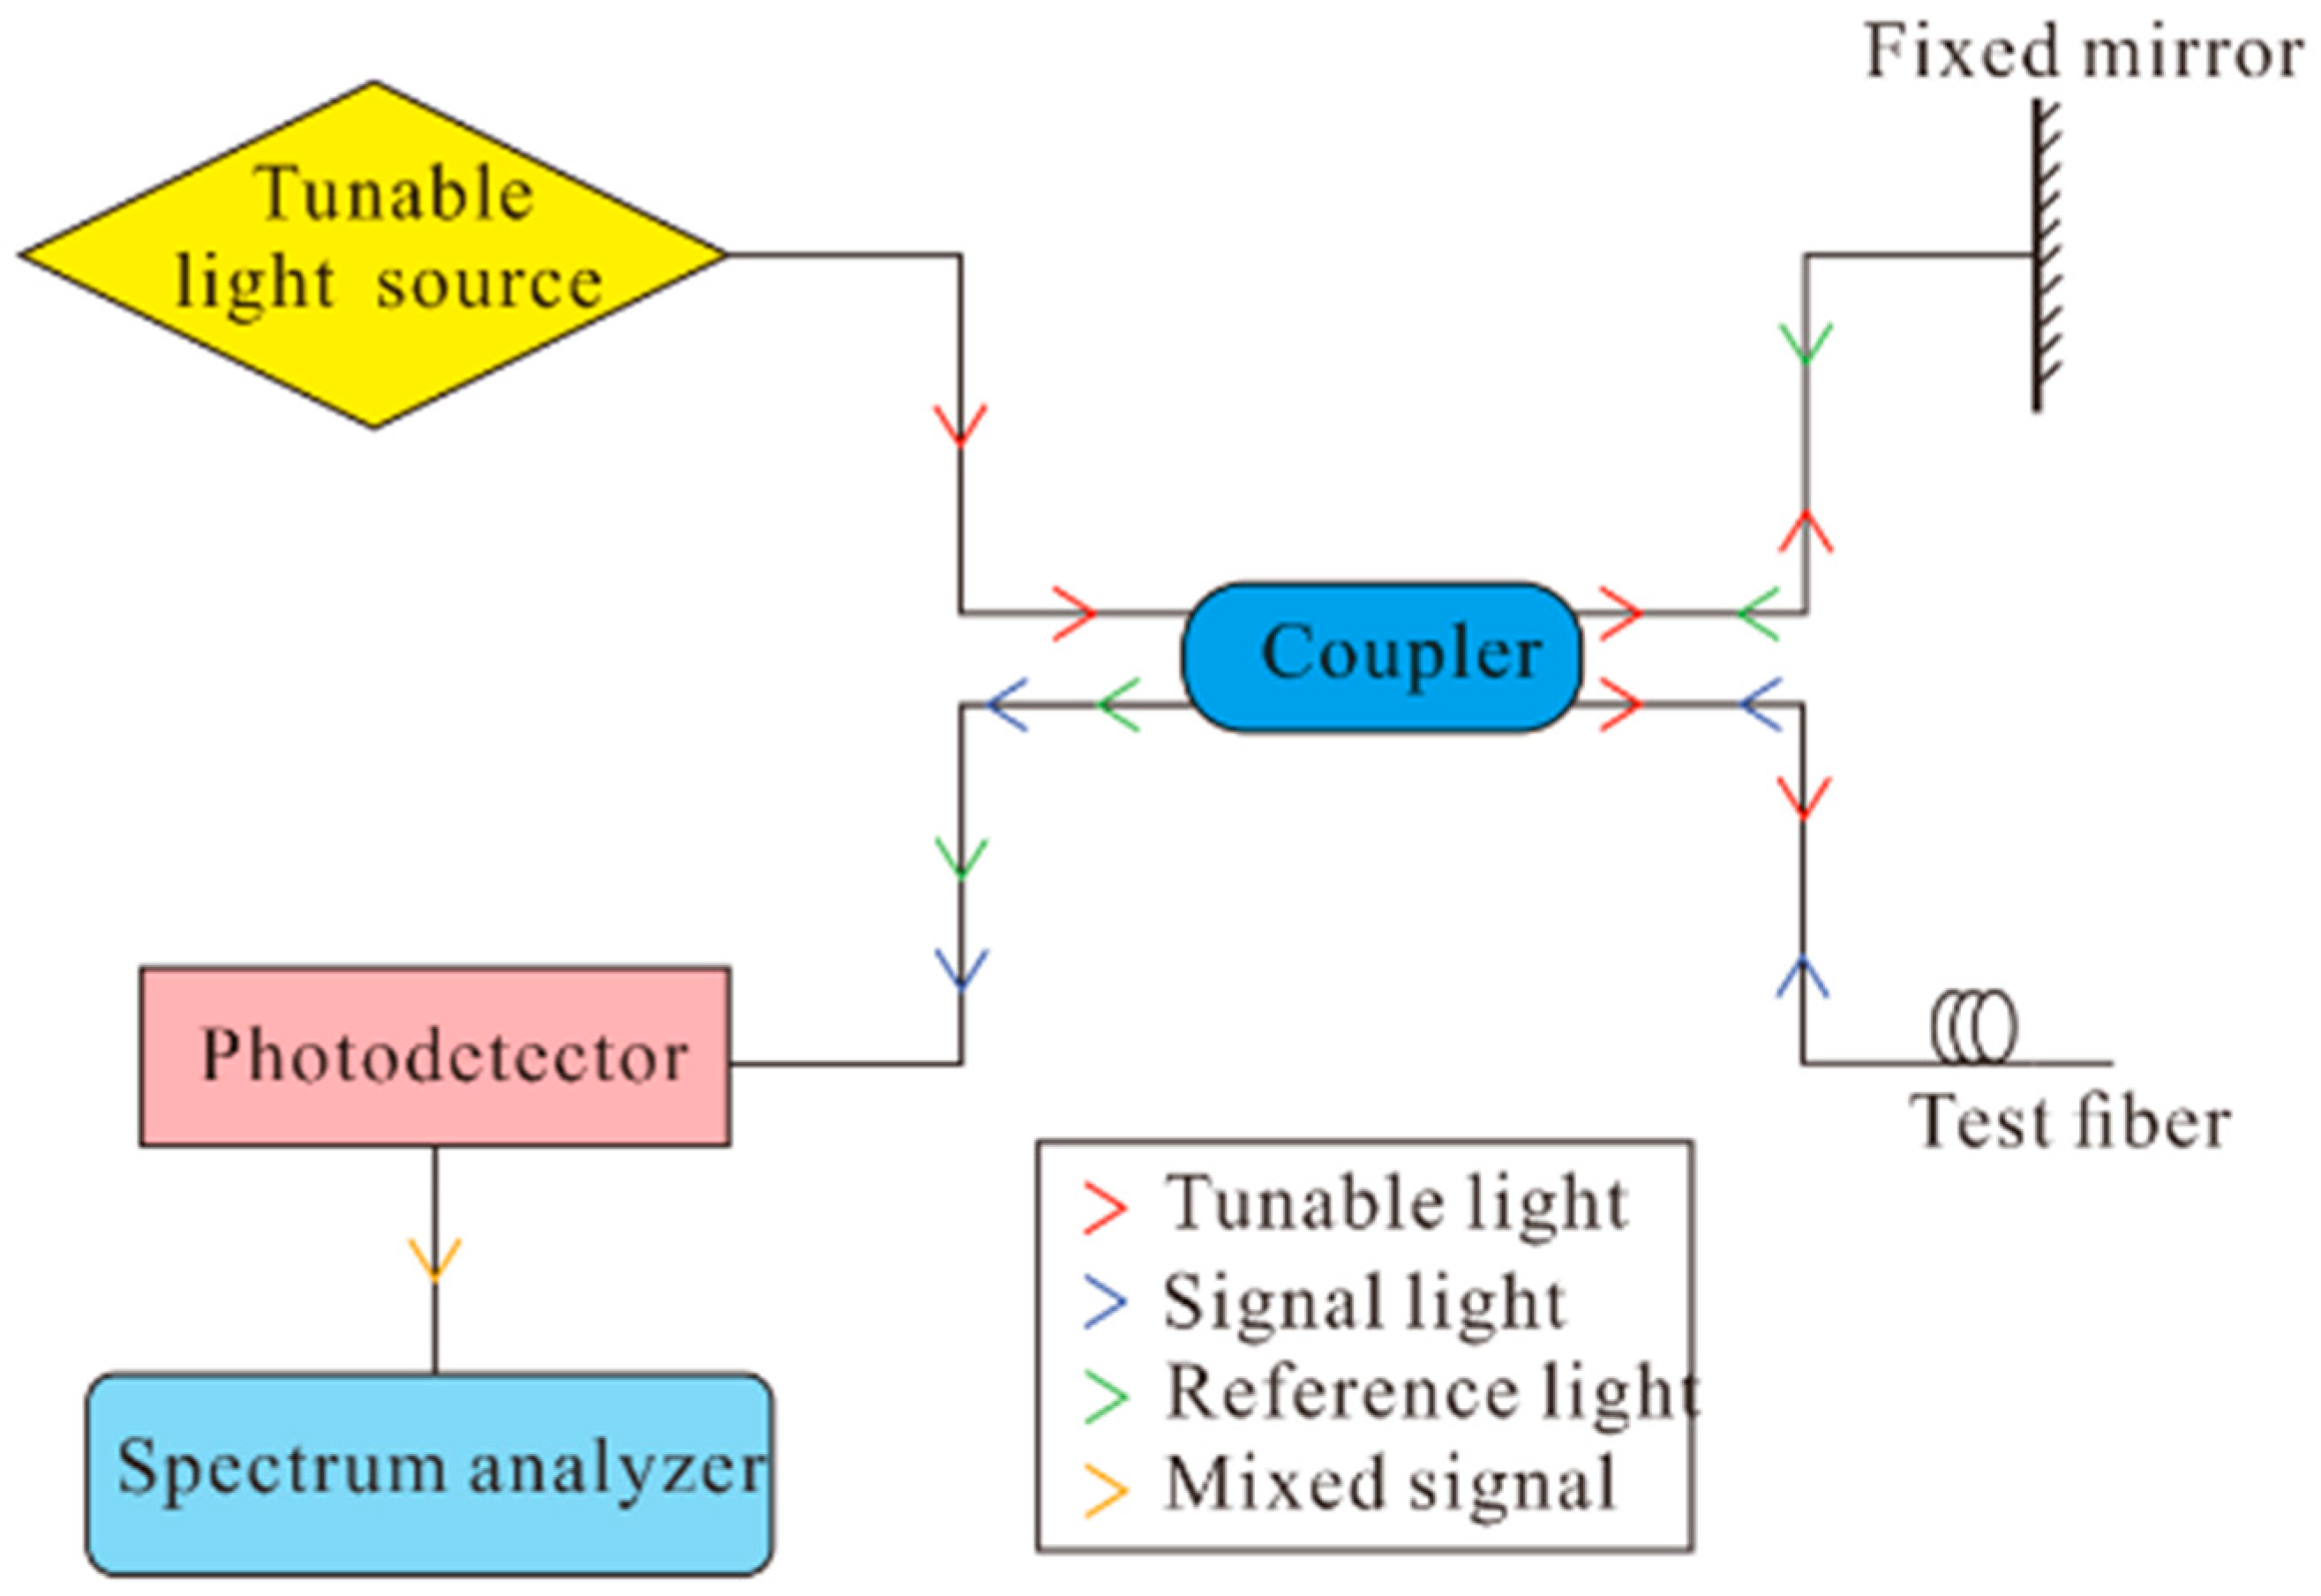
OFDR technology was developed by Eickhoff in 1981 [
24]. The basic principle of OFDR is shown in
Figure 1. The continuous light emitted by a tunable light source is divided into two parts: one is sent out into the test fiber, producing Rayleigh backscattering light, which passes through the coupler as signal light, the light is coupled in the photodetector; the other is reflected back to the coupler as a reference light, and the reference light is coupled in the photodetector. In the spectrum analyzer, the mixed signal of reference light and backward Rayleigh scattering light from the photo detector are measured. The optical frequency of the backward Rayleigh scattering light at different position of the optical fiber is different because the laser light source of OFDR technology is tunable to that light source. The position information of the optical fiber can be obtained by detecting the light frequency, while the strain/temperature information of the optical fiber can be achieved by comparing the spectrum of reference and signal lights respectively.
The optical backscatter reflectometry (OBR) instrument is based on OFDR technology, manufactured by LUNA company. It has successfully been applied in different areas for strain and temperature measurement. Henault et al. [
25] used OBR to monitor the mechanical behavior of a representative-scale reinforced concrete structural element. It was found that the strain measured by OBR was consistent with both the experimental data obtained from conventional vibrating wire gauges and the theoretical predicted strain. Nguyen et al. [
26] measured the transient temperature inside a single channel of a wash-coated monolith reactor using OBR. The capability of OFDR technology in temperature monitoring has been tested successfully. Villalba et al. [
27] bonded optical fibers to the surface of a concrete slab. The OBR was then used to measure the strain of the concrete under load. The result verified the potential of OFDR in Structural Health Monitoring (SHM). Grave et al. [
28] embedded a distributed fiber-optic sensing sensor within a composite joint, and used OBR to monitor the strain. The monitoring results agreed well with the results of Finite Element Analysis. Sierra-Pérez et al. [
29] used FBG, OBR, and strain gauges to measure the blades of a 13.5 m wind turbine blade prototype. The results were compared, and showed that OBR could define sensors every 10 μm. The resolution and accuracy of OBR presented a strong inverse dependency of the defined sensors. Andrea et al. [
30] monitored crack initiation and propagation in the glue line by FBG and OBR respectively. The experimental results showed that the great advantage of the OBR was that the entire length of fiber could be used for sensing strain, thus providing better spatial resolution compared to conventional FBG arrays.
The feasibility of OFDR in aeronautical construction and structural engineering has been verified. However, the OFDR in strain and temperature measurement of geotechnical engineering has not been widely reported on to date. The deformation of concrete pile is very important in the refinement of geotechnical engineering. Compared with aeronautical materials such as steel, aluminum, and so on, concrete material has rough surface; as such, the bonding of optical fiber is difficult. Its roughness makes it hard to maintain fastness. When compared with concrete structures such as slab, girder, and so on, the pile is buried in soil where the optical fiber needs protection due to the friction and pressure from the surrounding soil. The application of OFDR to concrete pile is worthy of further study.
The deformation of pile is important for foundation. In order to measure the deformation of PCC pile, a small-scale model test of a single PCC pile was carried out. OFDR technology was used to measure the strain of PCC pile. The method and process of laying the optical fiber, applying vertical loads, dealing with data, etc. are introduced in detail. The strain curves were analyzed according to the experimental situation, a numerical model was established by COMSOL Multiphysics, and the experimental results and numerical results are compared. Finally, the potential for the application of OFDR to PCC pile and PCC energy pile in situ was discussed.
2. Small-Scale Model Test
2.1. Model Test Equipment
The small-scale model test equipment was composed of a fairly rigid model container, a loading device, and a measuring device. The small-scale model test equipment is shown in
Figure 2. The internal size of the model container was 265 × 200 × 230 cm (104.331 × 78.740 × 90.551 inch) (length × width × height).
As shown in
Figure 3a, there are two main beams and two secondary beams, which are both made of special steel. They are fixed over the test tank by four I-shaped pillars. The beams were embedded partly into the test tank when the concrete was poured. The length of main beams is 235 cm, and they are 150 cm (59.055 inch) apart. The length of secondary beams is 150 cm (59.055 inch), and they are 100 cm (39.370 inch) apart. The loading device (see
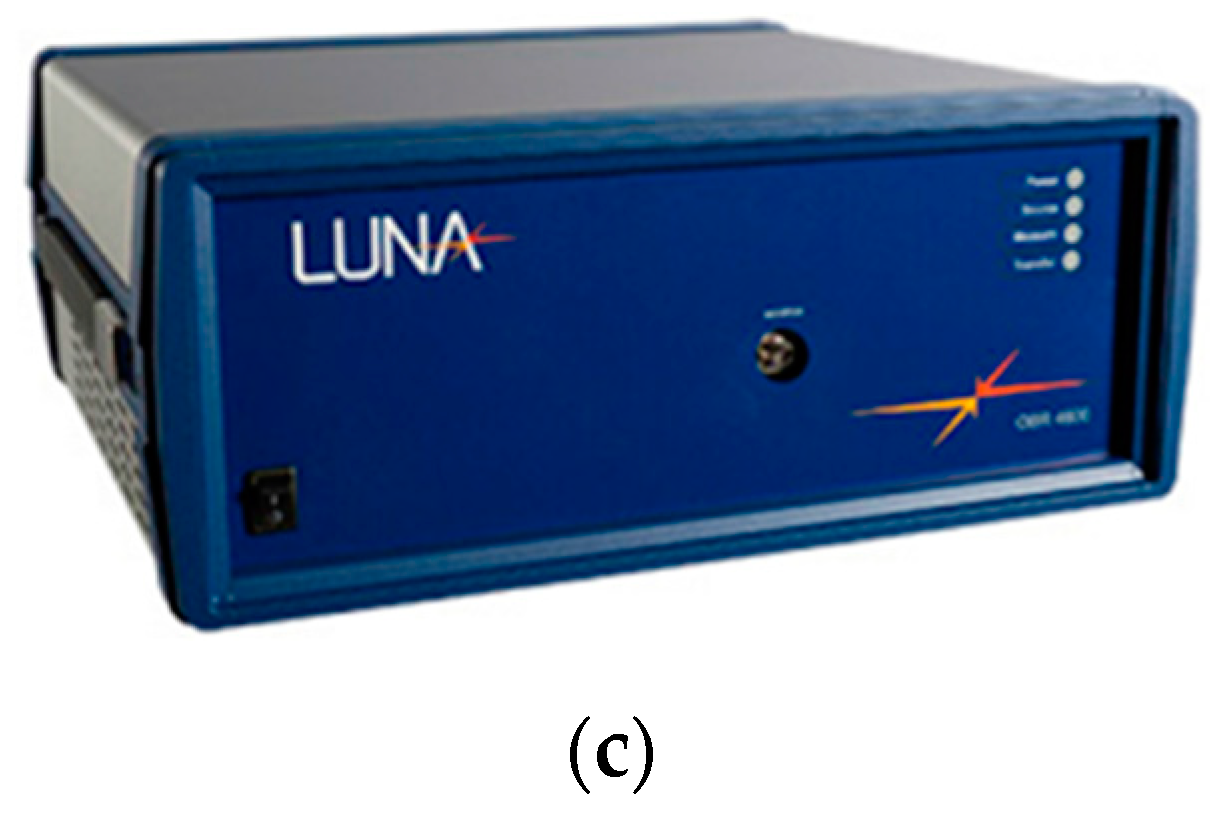
Figure 3b) mainly consists of the pressure equipment, the mechanics column, and the base plate. The pressure equipment was a mechanical jack with a height of 300 mm, the piston had a diameter of 80 mm, a maximum stroke of 200 mm, and a maximum loading of 250 kN. The pressure applied to the PCC pile is shown on the screen of a digital display through the pressure sensor. The measuring device comprises the single mode optical fiber, LUNA OBR4600 (see
Figure 3c), a computer, and the software. This model test is used for single PCC pile experiment.
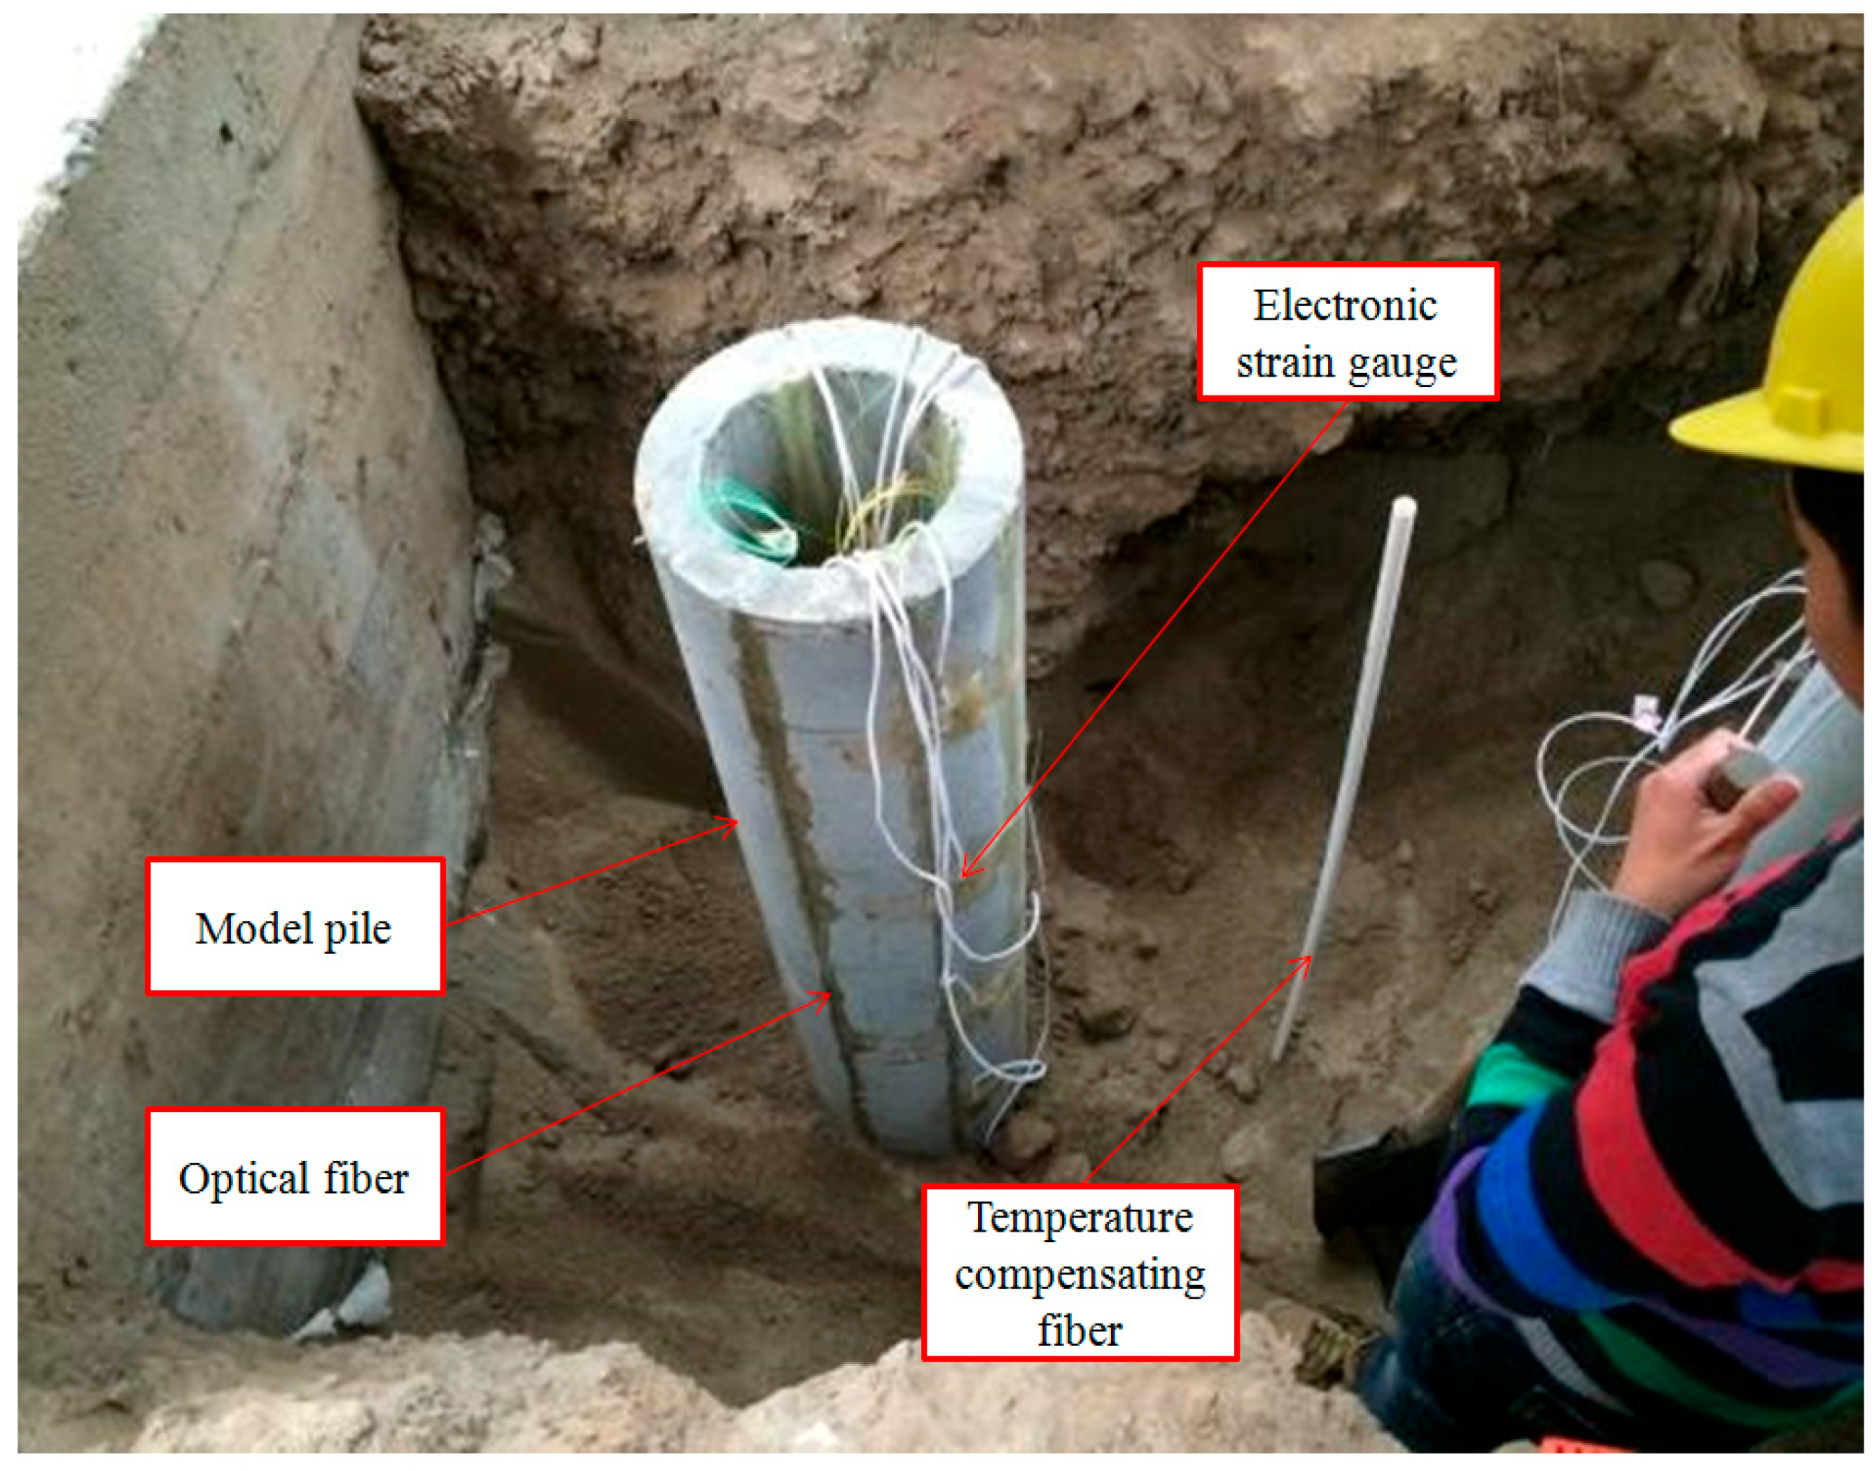
2.2. Model Pile and Soil
The PCC model pile is shown in
Figure 4. The pile was cast with C20 concrete without a reinforcement cage in a mould made of large-diameter PVC pipes. Its size is: length (L) 1.5 m (59.055 inch), inner diameter (d) 0.2 m (7.874 inch), and the outer diameter (d) 0.315 m (12.402 inch).
When the burying of the model pile was finished, the head of the pile is 0.1 m above ground. In order to ensure that the pile is able to bear the load uniformly and avoid stress concentration on the head under vertical load, a cubical base plate cast with C30 concrete was used under the jack. To simulate the foundation, two kinds of soil were filled into the model container. The top soil layer was clay of 0.6 m (23.622 inch) depth, and the lower layer was sand of 1.6 m (62.992 inch) depth. Both clay and sand were taken from Hexi District of Nanjing, China. The soil was placed into the model container artificially and compacted once each 0.2 m (7.874 inch). The basic physical and mechanical parameters of the soil and pile are shown in
Table 1. The uniaxial compressive strength of the pile was 2.8 MPa, and the biaxial compressive strength of pile was 2.36 MPa. These parameters were obtained by laboratory tests and from the National standard of the People’s Republic of China (GB50021-2001) Code for the Investigation of Geotechnical Engineering.
2.3. Layout of Optical Fiber Sensor
The layout and protection of the optical fiber sensor is important for data acquisition and reliability. The surface of the concrete is rough; therefore, the optical fiber cannot be adhered to directly and tightly. During the process of burying and loading of pile, the optical fiber suffers the friction from surrounding soil, which may cause it to break off. A feasible method of material packaging and protection was developed after several attempts (see
Figure 5). The main steps are introduced in detail, as follows.
A line was drawn along the axis of the pile, and the notch was cut along the line at a depth of 2~3 mm. The notch protected the optical fiber from breaking off due to friction and collisions during the process of backfilling soil and loading. The notch was cleaned with a brush and blower, because dust and particles in the notch might cause damage. After cleaning, the optical fiber was laid and gently stretched; it was fixed in the notch at fixing several points with a quick drying adhesive, similar to glue 502. A thin layer of epoxy resin was smeared into the notch to make the surface smooth; complete solidification of the epoxy resin takes 24 h. The surface of the epoxy resin was ground to reduce the friction between the resin and soil during the process of loading. The optical fiber left exposed was protected by a special protective sheath of 0.9 mm in diameter. The optical fiber was laid along the pile in a U shape. The advantage of this was that data can be obtained from both ends of the optical fiber. In case one end is damaged during the experiment, the data can be obtained from the other; the symmetrical layout of optical fiber allowed us to check whether the load is applied with eccentricity or not.
2.4. Data Acquisition
Before data acquisition, the fiber had to be welded to the fiber connector cable. It was necessary to remove the sheath of the optical fiber and clean the core of the fiber. To keep the stability of the light signal in the measurement, as far as possible, the light loss during connection must be no more than 2 dB. A thermal expansion pipe was used to reinforce the connection and the light path was checked. The calibration constants of optical fiber were set in the data acquisition software. The initial data was obtained before loading. When the loading was applied, the strain data were acquired. The data acquisition of OBR is very convenient.; the required time is in the order of a few seconds.
3. Numerical Simulation
In order to study the deformation of the model pile under vertical loads, a numerical model is established by COMSOL Multiphysics software. The software realizes the simulation of real physical phenomena by solving partial differential equations or partial differential equations based on the finite element method. COMSOL Multiphysics is widely used in scientific research and engineering calculations owing to its efficient computational performance and outstanding multi-field direct-coupling analysis capabilities [
31,
32]. Compared with other FE software, the COMSOL Multiphysics software is superior in multi-field coupling calculation. This model test is prepared for single PCC pile and PCC energy pile experiments. Considering the advantages of the software, and the characteristics of the experiment, the COMSOL Multiphysics software was used to conduct an equal-sized numerical model of soil and pile (see
Figure 6).
In this simulation, soil and pile are both regarded as incompressible materials. The soil is an elastoplastic material, and the constitutive model uses the Drucker-Prager (D-P) model. The pile is a homogeneous isotropic linear elastomer, and subject to the William-Warnke (W-W) criterion. The pile body and the soil body were continuously coordinated and deformed. Creep was not considered. The physical and mechanical parameters used in the numerical simulation are shown in
Table 1.
The meshes of the model include two parts with soil meshes and pile meshes, which are all tetrahedral meshes, the meshes arranged by free subdivision. The maximum size of a mesh unit is 0.367 m, and the minimum is 0.0661 m; the maximum growth rate is 1.5. The curvature factor is 0.6 and the resolution of the narrow region is 0.5. When calculating, the number of iteration meshes is 4, and the maximum depth of the unit is 4 m. There were 6 areas, 33 boundaries, 65 sides, and 42 vertices in the numerical calculations, and the freedom degree of the solution was 199,401.
In the stress field, the lower boundary of the sand was under fixed constraint, i.e., without displacement in three directions. The boundaries around the two layers of soil were all under horizontal constraints (roller bearing). The displacement only occurs in the direction of the Z axis, which is along the length of the pile. The top of the clay layer had a free boundary in which was contact with the surface of pile. The load was applied to the head of pile.
4. Results
The axial strain of PCC model pile at different depths under a vertical load was measured using a OBR4600 instrument. The strain curves were obtained using OFDR technology. With the obtained data, the deformation characteristics of the PCC pile could be analyzed. The strain data measured by the U-shape part of the optical fiber was affected by optical loss. The effect of optical loss should get rid of from the measure data. Additionally, traditional electronic strain gauges were bonded to the surface of model pile near the optical fiber cable, as shown in
Figure 4; however, the strain gauges broke. This proves the high survival rate of the optical fiber sensor.
Figure 7 shows the strain curves of the left and right sides of the model pile at 16 kN and 24 kN. The measurement results from the optical fiber by OBR can be analyzed. The strain of the model pile at depths from 0.1 m to 1.3 m was measured without any breaks. This illuminates the effectiveness of the layout, packaging, and protection of the optical fiber. The strain data of the model pile at depths from 0.0 m to 0.1 m was not recorded, because of the influence of the outer environment. Every datum is 1 με, it shows the advantage of OFDR in measuring strain along the optical fiber with high spatial resolution and accuracy. The strain curves of the left side of the pile at 16 kN and 24 kN have similar variation trends. The strain gets smaller from the top to the bottom of the pile, which corresponds with the deformation characteristic of the pile at a vertical load in general. These results confirm the stability and accuracy of OFDR technology indirectly.
The strain of both sides on the same load, which should be the same in an ideal situation, had obvious differences. This may have been caused by the small eccentricity of the load. There are many fluctuations on curves, which are bigger than those on the strain curves of metal and the composite; this was because the concrete had a rougher surface than that of the metal or the composite. In addition, the pile was subjected to the friction from surrounding soil during loading. The fluctuations of both sides are different in position and range, which is due to the local heterogeneity of the concrete material.
Figure 8 shows the average strain curves of model pile at 16 kN and 24 kN. The strain of the pile gets larger with load increasing. The two curves have the same variation trend. There is an abnormal fluctuation below the position of 1.05 m, which gets larger with load increasing; this is because the model pile was given the small load twice for testing the feasibility of loading and the monitoring devices. The loading caused movement of the model pile and disturbance of the surrounding soil.
Due to the properties of the equipment, the features of the signal, and effects of the environment, the obtained data contained much signal noise; this is a barrier for analyzing the deformation characteristics. There are many methods to deal with the optical fiber data with a noisy signal, e.g., wavelet transform. The wavelet transform is a signal analysis method of time–frequencies. It has the characteristics of a multi-resolution analysis (MRA), and the ability to describe the local features of a signal both in time and the frequency domain. Therefore, this method is suitable for resolving the data obtained by OBR to eliminate the signal noise.
Figure 9 shows the process of using wavelet transform to deal with the amplitude data obtained by OBR on 3 levels. From
Figure 9, the signal noise reduces notably, i.e., from level 1 to 3.
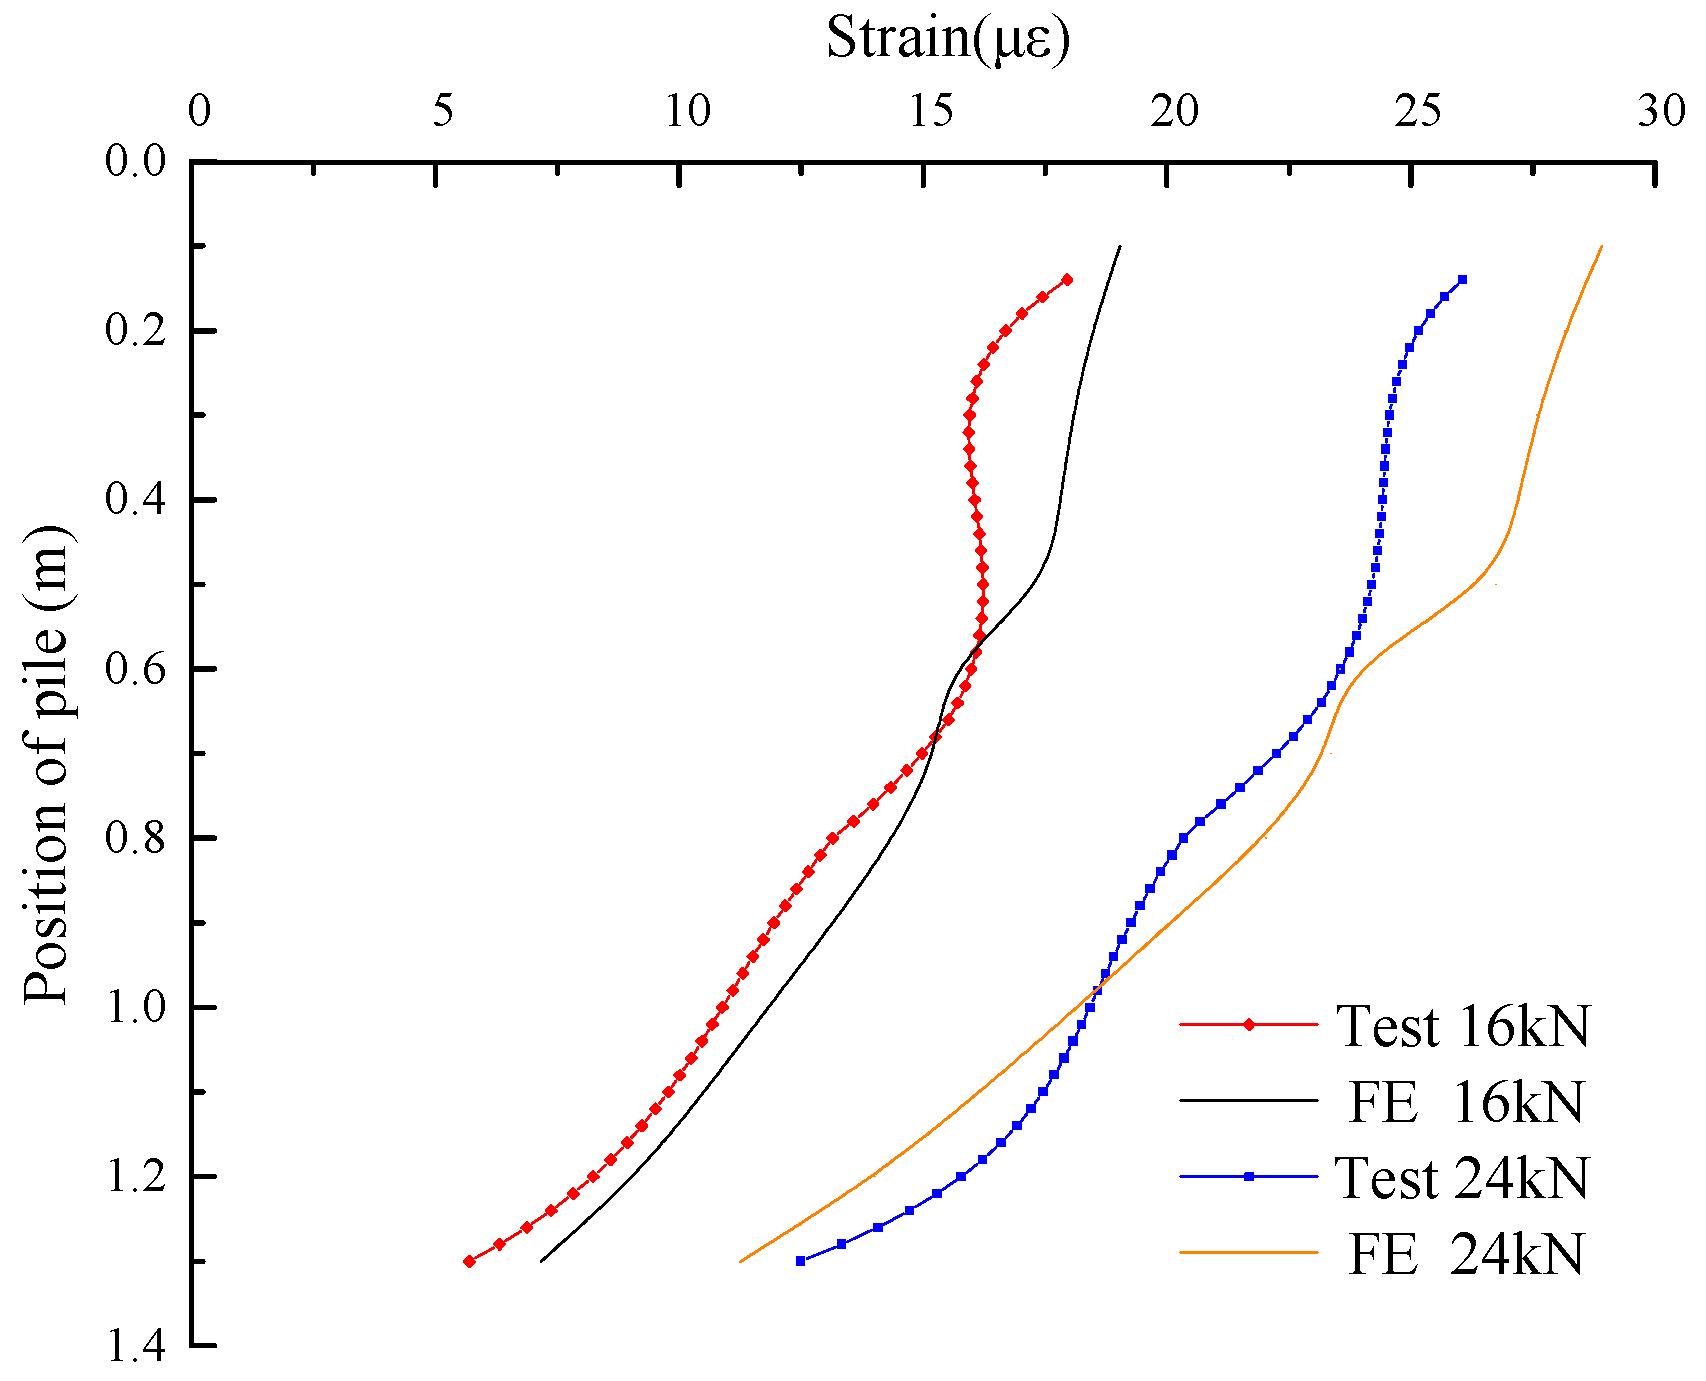
The spatial resolution of OFDR technology is high. The data passing through the wavelet transform is very fluctuant, especially for material with tough surfaces; as such, it was difficult to find a variation trend. The polynomial fitted method is a good way to match the curve with many data. The strain curves are smoothed out with a wavelet transform, and matched with a polynomial. The test results are shown in
Figure 10, with a comparison of the Finite Element (FE) analysis results.
From
Figure 10, the FE curves of 16 kN and 24 kN have the same trend where the strain gets smaller from the top to the bottom of the pile. These trends are consistent with the test curves of 16 kN and 24 kN. The matched curves of the test results agree well with those of FE analysis. The average difference between them is less than 20%. This verifies the parameter accuracy of the numerical model.
The measurement of OBR is very sensitive; a slight external disturbance can affect the measurement result significantly. Movement of the device during the measurement process may disturb the data. The effect of temperature was not considered in this short time measurement, i.e., only two hours, but the temperature was still the cause of poor correlations, especially in the upper part. The results of the test are smaller than those of the FE analysis in most parts of the pile, particularly in the upper part. Because the load was applied using a jack, and little settlement of pile could occur during the process of loading, the loading on the top of the pile was smaller than the designed value. The difference between results of the test and FE gradually gets smaller from the top to the bottom of the pile at the same load, the loading becomes smaller when transferring along the pile, due to the friction from surrounding soil. The test results were bigger than those of the FE analysis in the lower parts of the pile at 24 kN. This may be due to the abnormal deformation of the lower parts of the pile, which were caused by loading. The strain of the pile increases with load increasing. In addition, the variations of strain curves under different loads are in consistent. This shows that the PCC pile is a kind of friction pile, it illuminates the effectiveness of wavelet transform and polynomial fitting in the process of obtaining data using OFDR technology.
5. Discussion
When the OFDR technology is used to measure the strain of PCC pile, the optical fiber length and spatial resolution need to be carefully considered. The strain of the optical fiber is calculated as an average change of the reflective spectrum along the fiber. Regarding heterogeneous and tough concrete materials, the length and spacing of the optical fiber were chosen during post processing; as such, many peaks appear intensively on the strain curves, which make it difficult to show the variation trend. The spatial resolution and strain resolution of the OBR 4600 are 1 cm and 1μεrespectively; this satisfies the requirement of strain measurement for engineering construction. It can detect the strain with distributed measurement along the entire optical fiber. It is an ideal method to study the mechanical behavior and engineering properties of PCC pile using the optical fiber sensor. Real-time measurement can be carried out. Once the load is applied, the curve of strain changes immediately. Thedeformation characteristics of PCC pile can be obtained.
In engineering construction, the PCC pile is casted in place by vibrating and pulling out of the mould, with a maximum length of 25 m, diameter of 1.0–1.5 m, and tube thickness of 0.12–0.2 m. When OFDR technology is used, the optical fiber can be bonded to the reinforced rebar on strain measurement, through the test demonstrated by Henault [
25]. This provides a new method for strain measurement and integrity evaluation of PCC pile in situ. The optical fiber used is a commercially-available product manufactured for the telecommunications industry, and without any specific protective layer. With the development of optical fiber technology, the price of equipment and software for OFDR will get lower and lower, which is beneficial for the wide application of OFDR technology in monitoring the strain of pile. OFDR technology is very sensitive to the outer environment; the special protection should be used for application in the engineering field.
Since Rayleigh effects are both temperature and strain sensitive, the PCC energy pile was developed based on the PCC pile. It can make full use of inner space by installing equipment for heat exchange inside the PCC pile. The PCC energy pile provides support for the upper structure, and keeps a stable temperature for the structure. The measurement for temperature and strain of the PCC energy pile is difficult, because it involves the multi-field coupling problem, including the temperature field, strain field, seepage field, and so on. Considering the advantages of OFDR technology, the bearing mechanism and engineering characteristics of PCC pile and PCC energy pile can be studied using OFDR technology.
6. Conclusions
OFDR technology was used to measure the strain of PCC pile. A model test for a PCC pile was carried out. The numerical model was established using COMSOL, and the following conclusions were obtained.
(1) Based on the model test, the method of layout, packaging, and protection of the optical fiber bonded to the surface of the PCC pile were developed and introduced in detail. The strain of the PCC pile was successfully monitored by OFDR technology. The strain curves of the PCC pile at different vertical loads have the same variation trends, and agree well with the results of finite element calculation.
(2) The OFDR has higher spatial resolution and measuring accuracy, both of which can reflect the deformation characteristics of pile. The weak section and abnormal position of the pile can easily be detected. The strain gets smaller from the top to bottom of pile, and increases with loading. These show the superiority of OFDR in the strain monitoring of pile.
(3) Wavelet transform is an effective method to deal with the data obtained by using OFDR, in terms of deleting noise signal. Combined with polynomial matching method, the variations of strain can be clearly shown.


