Phase-Coded and Noise-Based Brillouin Optical Correlation-Domain Analysis

Faculty of Engineering and Institute for Nano-Technology and Advanced Materials, Bar-Ilan University, Ramat-Gan 5290002, Israel
*
Author to whom correspondence should be addressed.
Appl. Sci. 2018, 8(9), 1482; https://doi.org/10.3390/app8091482
Submission received: 2 August 2018
/
Revised: 18 August 2018
/
Accepted: 23 August 2018
/
Published: 28 August 2018
(This article belongs to the Special Issue Optical Correlation-domain Distributed Fiber Sensors)
Abstract
:Featured Application
Structural health monitoring.
Abstract
Correlation-domain analysis has enabled distributed measurements of Brillouin gain spectra along optical fibers with high spatial resolution, up to millimeter-scale. The method relies on the joint modulation of counter-propagating Brillouin pump and signal waves so that their complex envelopes are correlated in select positions only. Brillouin optical correlation-domain analysis was first proposed nearly 20 years ago based on frequency modulation of the two waves. This paper reviews two more recent variants of the concept. In the first, the Brillouin pump and signal waves are co-modulated by high-rate binary phase sequences. The scheme eliminates restricting trade-offs between the spatial resolution and the range of unambiguous measurements, and may also suppress noise due to residual Brillouin interactions outside the correlation peak. Sensor setups based on phase coding addressed 440,000 high-resolution points and showed potential for reaching over 2 million such points. The second approach relies on the amplified spontaneous emission of optical amplifiers, rather than the modulation of an optical carrier, as the source of Brillouin pump and signal waves. Noise-based correlation-domain analysis reaches sub-millimeter spatial resolution. The application of both techniques to tapered micro-fibers and planar waveguides is addressed as well.
1. Introduction
Distributed analysis of Brillouin gain spectra along optical fibers was first proposed as a means for temperature and strain sensing nearly 30 years ago [1,2]. The first and most widely employed architectures of stimulated Brillouin scattering (SBS) sensors are based on time-domain analysis: a Brillouin pump pulse is launched from one end of the fiber, and the amplification of a counter-propagating Brillouin signal wave is being monitored as a function of time [1,2]. The spatial resolution of the basic configuration of such Brillouin optical time-domain analysis (B-OTDA) protocols equals the duration of the pump pulse multiplied by the group velocity of light in the fiber [1,2]. The pulse duration, in turn, must exceed the lifetime associated with the stimulation of hypersonic acoustic waves in the core of the fiber, on the order of 5–10 ns [3]. Consequently, the spatial resolution of the fundamental B-OTDA technique is restricted to the order of 1 m or longer [3]. Over the last decade, much progress has been made in pushing the spatial resolution of B-OTDA towards a few centimeters using a variety of techniques [4,5,6,7,8,9,10,11,12]. Nevertheless, the resolution of distributed Brillouin analysis remains a significant and active area of research.
In 1999 and 2000, Prof. Kazuo Hotate and co-workers at the University of Tokyo proposed and demonstrated an alternative paradigm towards high-resolution Brillouin analysis [13,14]. Their proposition is based on the following property: The instantaneous electro-strictive driving force for the stimulation of the acoustic wave at a given fiber location is proportional to the inner product between the optical pump and signal fields at that particular point [15]. Consequently, one may show that the strength of the SBS process is closely related to the temporal cross-correlation function between the complex modulation envelopes of the two waves at a point of interest [13,14]. Judicious, joint modulation of the two waves can confine their cross-correlation function to discrete locations, referred to as correlation peaks. The SBS interaction is largely restricted to these peaks, and it is strongly inhibited everywhere else [13,14]. The spatial extent of the correlation peaks equals half the correlation length of the modulated common source of the pump and signal waves [13,14]. Distributed sensing based on this principle came to be known as Brillouin optical correlation-domain analysis, or B-OCDA [13,14].
The first realizations of B-OCDA involved joint frequency modulation of the two waves by sinusoidal waveforms [13,14]. The spatial resolution of the analysis in this case improves with the magnitude of frequency modulation [13,14]. The protocol provided distributed analysis with extremely high spatial resolution: up to 1.6 mm in a standard optical fiber [16]. At the time of writing, this resolution remains unmatched by time-domain Brillouin sensing protocols. One drawback, however, of the initial B-OCDA approach has been the periodicity of the cross-correlation function between pump and signal waves that are frequency modulated by a single sine-wave function. This periodicity restricted the spatial range of measurements that could be performed without ambiguity and limited the number of spatial resolution points to several hundred only [13,14]. The number of resolution points was since extended using more elaborate frequency-modulation patterns involving multiple rates [17]. Nevertheless, frequency modulation provides only partial flexibility in the synthesis of the cross-correlation function between pump and signal. In addition, frequency modulation of a laser source is limited by practical considerations to a magnitude on the order of 50 GHz [16], corresponding to a spatial resolution of about 1.5 mm in a fiber [16]. The realization of higher modulation rates, and higher resolution, has proven challenging.
This paper reviews two strategies that were proposed and demonstrated since 2012 as partial solutions to the above difficulties. In the first approach, the Brillouin pump and signal waves are jointly phase-modulated by high-rate binary sequences. The spatial extent of the correlation peaks scales with the duration of a single bit in the sequence. At the same time, the periodicity of the cross-correlation function is determined by the length of the sequence, which may by arbitrarily long. Consequently, phase-coded B-OCDA removes the constraint between measurement range and resolution. A first demonstration of this technique was provided in a joint work of the Zadok group of Bar-Ilan University, and the Thevenaz group at the École Polytechnique Fédérale de Lausanne (EPFL) [18]. The first experiments addressed 4000 resolution points with a 1-cm resolution [18]. The performance of phase-coded B-OCDA was since enhanced to successfully address 440,000 resolution points [19], and a system with over 2 million potential resolution points was demonstrated as well [20].
In Section 2 of this paper, the principle of phase-coded B-OCDA is introduced, and several extensions of the concept are discussed. These include the employment of carefully constructed phase codes for stronger suppression of the off-peak SBS interactions [21]; the overlay of pump pulses for addressing a large number of resolution points in a single trace [20,22]; use of double-pulse acquisition [23]; elimination of frequency scanning through transient analysis of Brillouin gain [24]; and the combination of amplitude codes alongside phase sequences in the same protocol [19,25]. Lastly, the application of phase-coded B-OCDA in structural health monitoring [26,27,28], and towards the mapping of acoustic waves along micro-fibers [29,30], is presented as well.
Another new variant of B-OCDA aims to remove the restrictions on modulation bandwidth. Rather than degrade the coherence of narrowband light sources through modulation, one may draw the Brillouin pump and signal waves from broadband, incoherent amplified spontaneous emission (ASE). The bandwidth of ASE sources can reach, in principle, several THz. Based on this concept, Cohen et al. demonstrated ASE B-OCDA over a small-core, commercially available fiber with a spatial resolution of 4 mm [31]. The main challenge associated with this sensing protocol is low signal-to-noise ratios (SNRs) due to the weak SBS amplification over ultra-short segments and the inherent intensity fluctuations of ASE [32]. Despite this difficulty, the technique was successfully implemented in distributed Brillouin analysis along photonic integrated circuits in chalcogenide glass [33]. A record-breaking spatial resolution of 800 µm has been achieved [33]. Section 3 of the paper presents the ASE B-OCDA concept and includes previously unpublished analysis of a standard fiber with a spatial resolution of 2 mm. The recent application of the protocol to planar waveguides is addressed [33], and a related concept of B-OCDA based on a chaotic laser source [34,35] is noted as well.
The vast majority of the results discussed below are already published in multiple separate papers by several groups. References are provided for complete details. This review aims to give a unified perspective on the development process and the state of the art of these two analysis protocols, which find increasing roles in applications of Brillouin sensors. Concluding remarks are given in Section 4.
2. Phase-Coded Brillouin Optical Correlation-Domain Analysis
2.1. Principle of Operation
Consider a Brillouin pump wave that is propagating in the positive direction along an optical fiber under test, and a counter-propagating Brillouin signal wave in the negative direction. The central optical frequency of the pump wave is higher than that of the signal by an offset , which is close to the Brillouin frequency shift (BFS) of the fiber under test . The two waves are drawn from a common optical source. The complex envelope of the pump wave at position and time may be expressed as follows:
Here, is a constant amplitude, is the group velocity of light in the fiber, and denotes a modulation function of the optical source with an average norm of unity. The corresponding complex envelope of the counter-propagating signal wave is given by:
In Equation (2), is a constant amplitude which may be different from that of the pump, and is the length of the fiber under test.
In most cases of interest for phase-coded and ASE-based B-OCDA, the Brillouin interactions are confined to short sections of fiber. As a first-order approximation, the changes in the magnitudes of the pump and signal waves due to the SBS interactions are neglected below. Linear losses along the fiber are omitted as well for simplicity. Subject to these conditions, the magnitude of the stimulated acoustic wave is given by the following expression [36]:
In Equation (3), is an electro-strictive parameter of the fiber, is a position-dependent time lag, and denotes a complex linewidth that is position-dependent through possible local changes in . The complex linewidth reduces to half the inherent Brillouin linewidth: , when . The inherent linewidth is on the order of 2π × 30 MHz.
Let us denote the auto-correlation function of the modulation waveform as , where is a delay variable. Equation (3) suggests that the magnitude of the stimulated acoustic wave at , and hence the strength of the local SBS coupling between pump and signal, is closely related with . This characteristic is at the basis of all variants of B-OCDA [13,14,18,22,31,36]. Note, however, that the acoustic wave magnitude does not perfectly follow the auto-correlation function due to the exponential weighing window that is associated with Brillouin stimulation.
In phase-coded B-OCDA, the modulation function is chosen as a binary phase sequence, with symbol duration and a period of bits:
Here, if and equals zero otherwise, and is the value of bit in the sequence. A magnitude of unity is retained at all times. The bit duration is taken to be considerably shorter than the Brillouin lifetime . In the first proposition of this concept, the values of were those of a pseudo-random bit sequence (PRBS), in which each symbol assumes a value of either +1 or −1 with equal probabilities [18]. Given this modulation sequence, a correlation peak forms at the center of the fiber under test with a fixed magnitude of the stimulated acoustic wave: . The width of the correlation peak is . Periodic, higher-order correlation peaks appear at positions , where is a positive or negative integer.
Outside the correlation peaks, the magnitude of the stimulated acoustic waves is rapidly fluctuating, as the integrand in Equation (3) may assume positive or negative values. The expectation value of equals zero for all times. Therefore, in principle, measurements of the SBS gain at the output end of the signal wave may retrieve the Brillouin gain spectrum at the position of the correlation peak only. Note, however, that even though off-peak Brillouin interactions are zero on average, their instantaneous magnitudes are non-zero with a finite variance. Off-peak Brillouin interactions may contribute significant noise to the measurements of output SBS gain, and they have to be taken into consideration.
Phase-coded B-OCDA measurements of Brillouin gain spectra are unambiguous for fiber lengths that are shorter than . Since the repeating phase-modulation sequence can be chosen at any length, the measurement range of phase-coded B-OCDA may be arbitrarily long, with no effect on spatial resolution. In many realizations of the concept, the fiber paths leading the pump and signal waves into the measurement section of interest are deliberately imbalanced so that a high-order correlation peak is in overlap with the section of interest. With this choice, the position of the correlation peak can be conveniently scanned through small-scale variations in the bit duration . A map of Brillouin gain spectra as a function of position can be obtained by scanning the location of the correlation peak position, one resolution point at a time, and scanning the frequency at each position. Environmental drifts in the group delays along the pump and signal paths may be compensated for and stabilized based on chromatic dispersion [37].
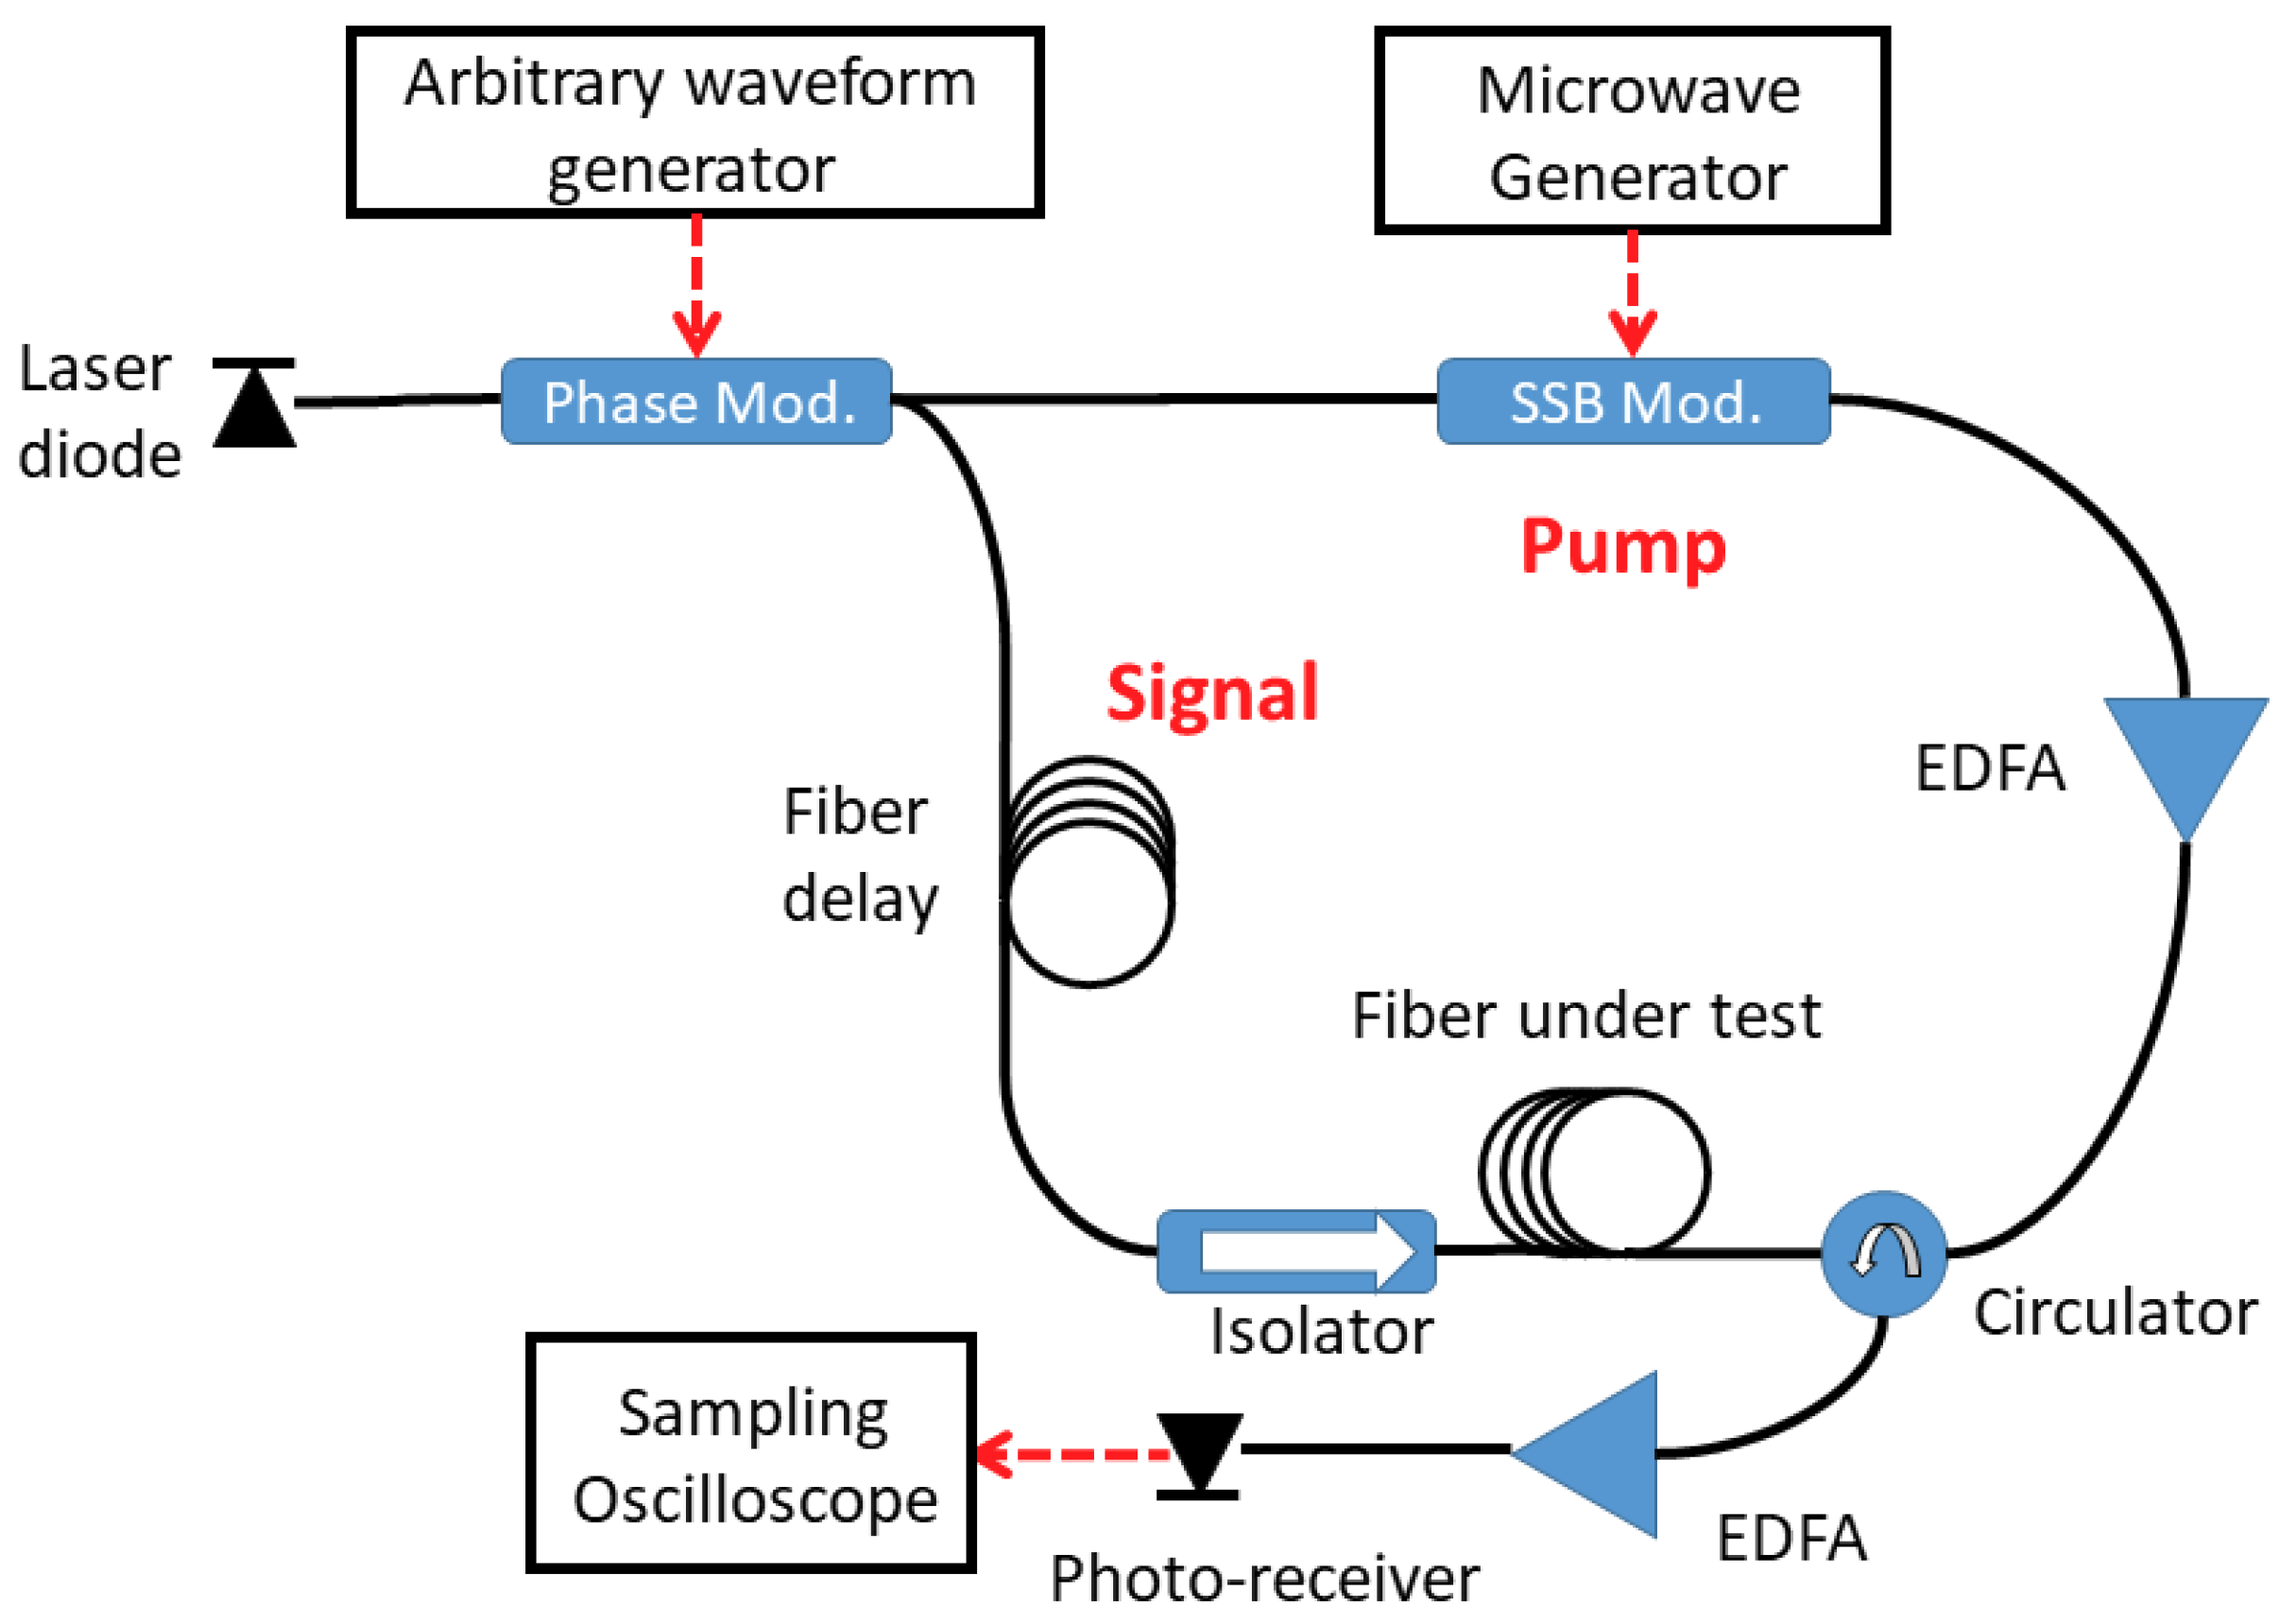
A schematic illustration of a phase-coded B-OCDA measurement setup is provided in Figure 1. A single laser diode is typically used as the source of both pump and signal waves. The laser light passes through an electro-optic phase modulator, which is driven by the output voltage of an arbitrary waveform generator. The instrument is programmed to repeatedly generate the bit sequence of choice. The modulated waveform is then split into pump and signal paths. Pump light is upshifted in frequency through a single-sideband electro-optic modulator. The modulator is driven by sine-wave voltage from a microwave generator of frequency . The pump wave is then amplified by an erbium-doped fiber amplifier and launched into one end of a fiber section under test through a circulator. The signal path typically includes long fiber-optic delay as discussed above. An isolator is used to restrict the interaction between pump and signal to the fiber segment of interest. The Brillouin-amplified signal wave is routed through the circulator towards a photo-receiver.
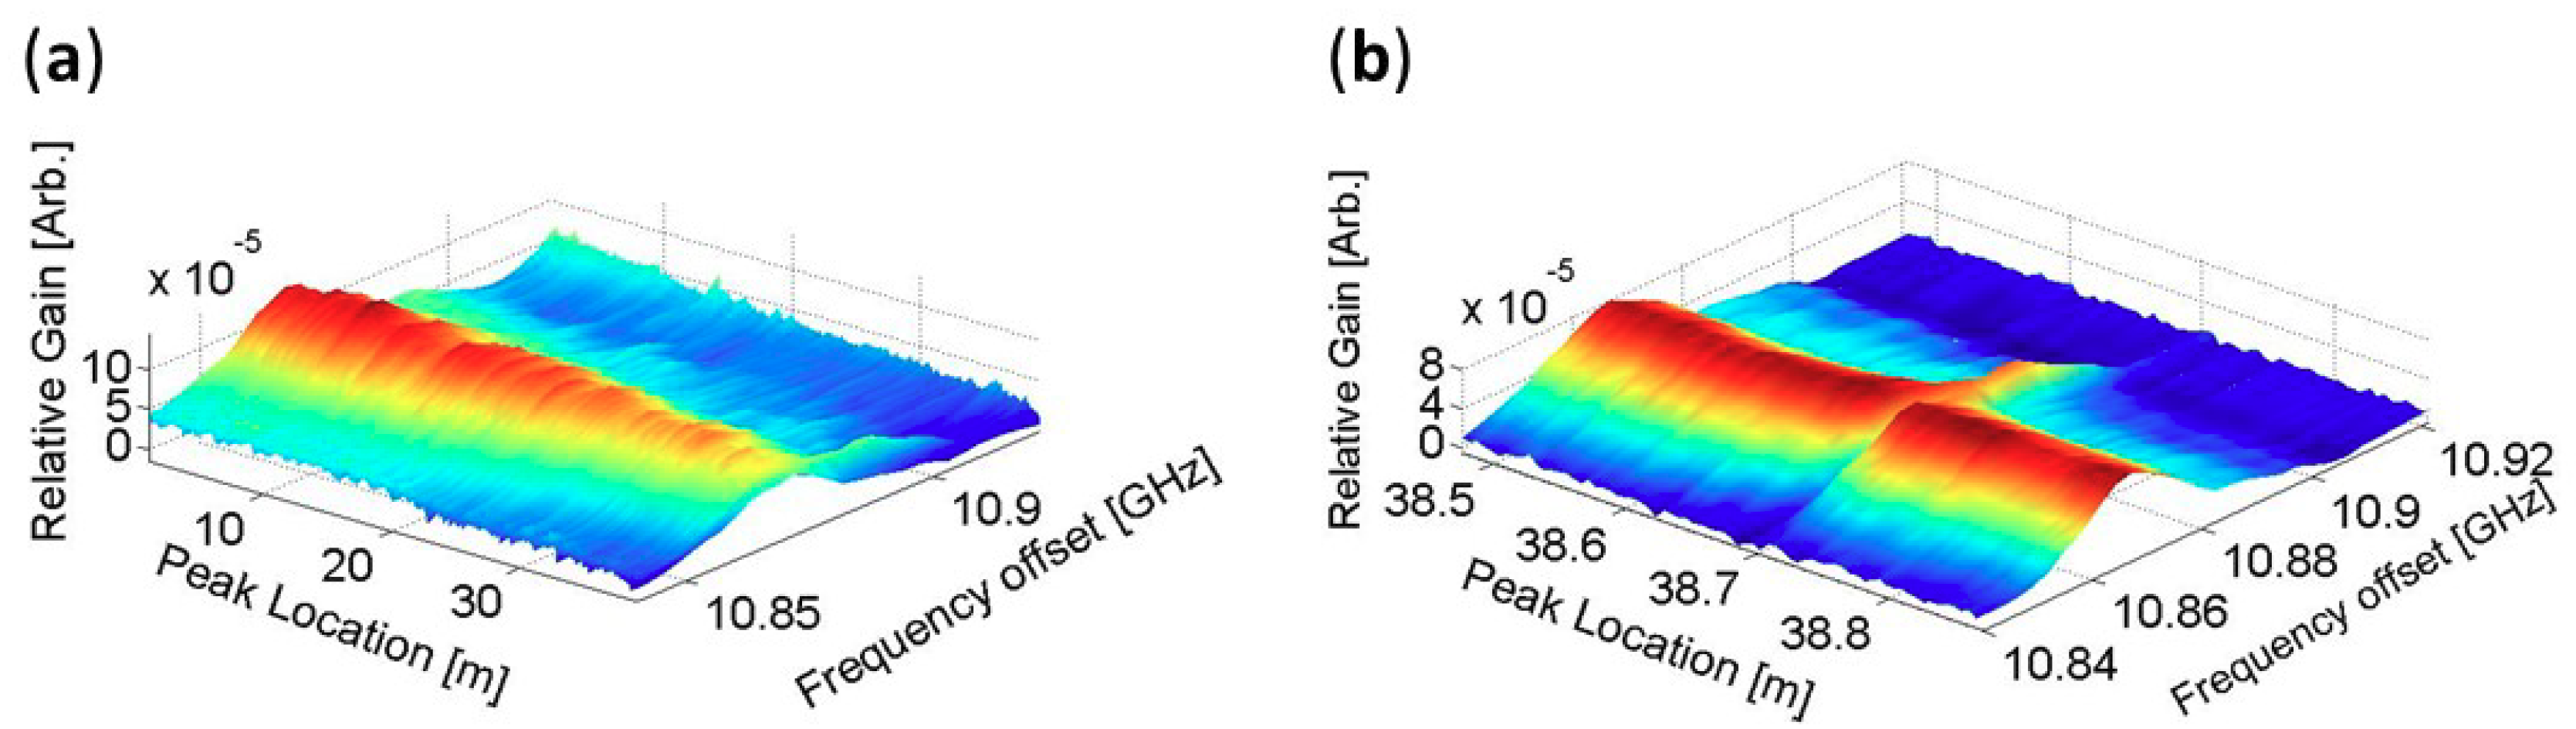
Figure 2 presents the first data of a phase-coded B-OCDA, reported in 2012 [18]. The SBS gain is shown as a function of position and frequency detuning [18]. The measurement range was 40 m, and the measurement resolution was 1 cm. All 4000 resolution points were addressed in the analysis. A 1-cm-long hot-spot towards the end of the fiber under test was properly identified in the measurements [18]. The experimental uncertainty in the estimates of local BFS values was ±0.5 MHz [18].
2.2. Optical Signal-to-Noise Ratio and the Choice of Codes
When the frequency detuning matches the BFS at the correlation peak position, the fixed magnitude of the stimulated acoustic wave is given by [21]. If a high-rate PRBS is used in phase-coded B-OCDA measurements, the variance of the acoustic wave magnitude at off-peak locations for the same may be estimated as [21]. Off-peak SBS interactions accumulate over the entire length of the fiber under test and lead to undesirable fluctuations in the power of the output Brillouin signal wave. These variations can become the dominant noise mechanism in phase-coded B-OCDA and might mask out the Brillouin gain within the short correlation peak. The corresponding limitation on the optical signal-to-noise ratio (OSNR) is defined as the ratio between the coupling of power inside the correlation peak and the variance in output signal power due to the combined effect of all off-peak interactions. For PRBS phase modulation, the OSNR is estimated by a simple relation [21]:
The OSNR is inversely proportional to the length of the fiber under test, and it is independent of the analysis resolution. The OSNR is on the order of unity for a 2-m-long fiber. Consequently, the initial demonstrations of phase-coded B-OCDA over tens of meters of fiber required the averaging of collected traces over many repeating acquisitions and/or long integration durations at the detector [18].
The OSNR can be improved if carefully synthesized phase codes are used instead of a PRBS. For example, Prof. Solomon Golomb of the University of Southern California (USC) developed a class of phase codes with cyclic auto-correlation values of exactly zero for all off-peak delays [38]. The employment of such perfect Golomb codes does not entirely eliminate off-peak SBS interactions, since the exponential windowing involved in Brillouin stimulation does not perfectly replicate the cyclic correlation operation [21,39]. Nevertheless, both analysis and experiments show that the OSNR in Brillouin gain measurements may be improved by a factor of 3–4 when Golomb codes are used instead of a PRBS, depending on the sequence period [21,39,40]. Figure 3 shows an example of calculated maps for a Golomb code and a PRBS of equal rates and periods [21]. Off-peak stimulation of the acoustic waves is significantly suppressed when the Golomb code is used. Perfect Golomb codes were also employed in demonstrations of all-optical variable delay of communication data and in microwave photonic filtering using Brillouin dynamic gratings [40,41].
2.3. The Overlay of Pump Pulses
The initial phase-coded B-OCDA scheme suffers from two main drawbacks that are common to many correlation-based sensing protocols. The OSNR is degraded due to the accumulated contributions of multiple off-peak interactions, and the mapping of the entire fiber one point at a time may require prohibitively long experimental durations. While the former concern is partially addressed with the application of carefully synthesized phase codes, the OSNR over long fibers under test remains insufficient.
A breakthrough in addressing both issues has been achieved with the overlaying of a single amplitude pulse on the phase-modulated pump wave. The input waveform of the pump wave in this case is given by [20,22]:
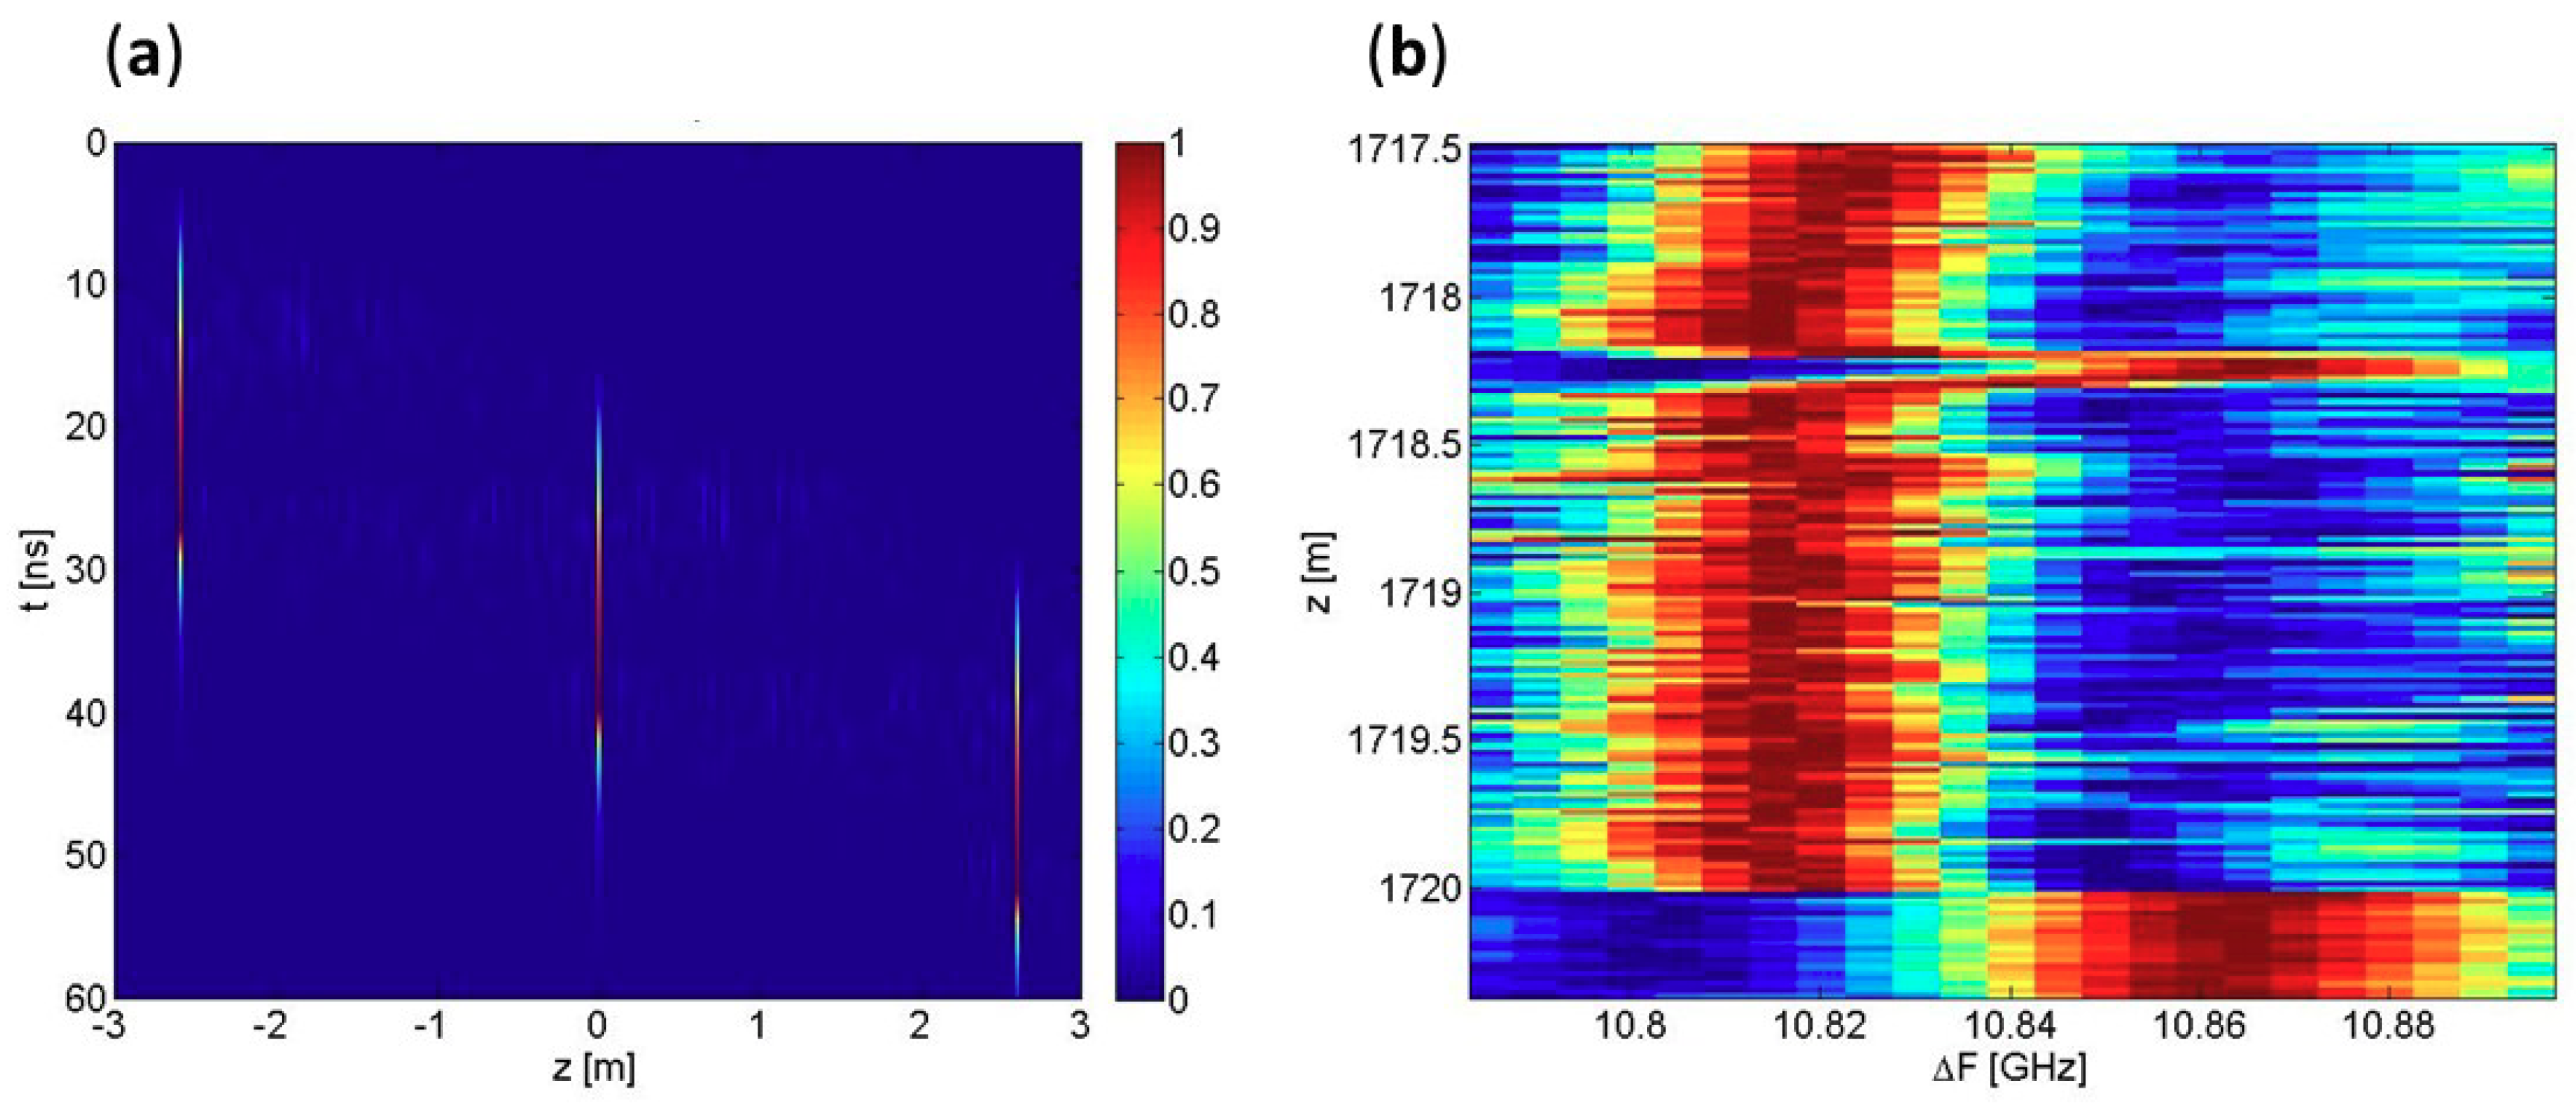
where is the duration of a pulse centered at and the modulation function is otherwise unchanged. The complex envelope of the Brillouin signal wave remains that of Equation (2). The pulse duration is chosen to be shorter than the phase code period: , but sufficiently longer than the Brillouin lifetime [22]. The length of the fiber under test may be much longer than the separation between adjacent correlation peak locations. With these choices of parameters, acoustic waves are stimulated in multiple positions along the fiber. However, the SBS interaction in each peak is restricted to the duration of the pump pulse. The amplification of the signal wave at any given moment takes place at a single location at most (see Figure 4a, [22]). Local Brillouin gain spectra may be unambiguously resolved through the analysis of the output signal power in the time domain, similar to B-OTDA. The spatial resolution of the analysis, however, is determined by the short phase-code symbol duration rather than by the longer pump pulse duration .
Pulse amplitude modulation of the pump wave brings about two significant advantages. First, the Brillouin gain spectra along the entire fiber may be mapped with only scans of correlation peaks positions, regardless of the fiber length. Figure 4b shows one of the earlier implementations of this principle [42]. B-OCDA was performed over a 1600-m-long fiber with a spatial resolution of 2 cm. All 80,000 resolution points were addressed using only 127 position scans. The figure shows a magnified view of the SBS gain map in the final 3 m of the fiber. A few-centimeters-long heated region is clearly identified in the measurements. Compared with the first proposition of phase-coded B-OCDA (Figure 1), the number of resolution points was already increased 20-fold.
No less important is the effect of pulse modulation on the off-peak SBS interactions. Rather than accumulate over the entire length of the fiber under test, these interactions are confined to the spatial extent of the pump pulse only, which is typically on the order of few meters (see for example the calculations in Figure 4a). The OSNR of the output signal power measurements may be estimated as , an improvement of 2 orders of magnitude compared to that of Equation (5). The OSNR no longer degrades with the measurement range.
In a more recent example, phase-coded B-OCDA with a pulsed pump was successfully demonstrated over 17.5 km of fiber with a spatial resolution of 8.3 mm (see Figure 5, [20,43]). The number of potential resolution points, over 2 million, is arguably the largest such set among all Brillouin sensors reported to date [20,43]. This milestone result highlights the importance and potential of bringing together correlation-domain and time-domain analysis principles. It should be noted that similar pulse-amplitude modulation of the pump wave was also successfully introduced to frequency-modulation-based B-OCDA [44].
2.4. Combination of Amplitude and Phase Sequence Coding
The acquisition duration of a phase-coded B-OCDA map is determined by the number of repeating acquisitions that must be averaged in the collection of each raw trace, by the number of position scans that are necessary to address the entire fiber under test, and by the number of frequency offsets used between pump and signal. As noted above, the overlay of an amplitude pulse on the continuously phase-coded pump wave reduces the first two of these values drastically. Yet, additional attempts were made to further reduce the necessary number of repeating averages, position scans, and frequency scans. The approaches taken towards these objectives are presented in the next three sub-sections.
The number of repeating acquisitions is discussed first. When noise due to off-peak Brillouin interactions is sufficiently suppressed through amplitude pulse modulation and/or the application of Golomb codes, the OSNR is typically limited by additive noise sources associated with the measurement setup. Repeating pulses that are used for the averaging of collected traces must be separated in time by the two-way time-of-flight along the fiber under test to remove ambiguity. The OSNR can be improved, at least in principle, by using stronger pump pulses. However, the pump power is ultimately limited by the onset of competing nonlinear effects and depletion [45,46]. Alternatively, the pump power may be spread in time among a large number of weaker pulses, representing an amplitude coding sequence [19,25]:
The value for each symbol in the amplitude sequence may be 1 or 0 according to design. The acoustic wave at the location of each peak position is repeatedly stimulated by each pump pulse, and may decay between successive pulses. Each stimulated event is associated with local SBS amplification of the signal wave. Therefore, the Brillouin interaction at each peak location imprints a delayed replica of the pulse amplitude sequence on the instantaneous power of the signal wave [19,25]. Since the pump pulses are closely spaced, and many correlation peaks take place along the fiber, a large number of such replicas are superimposed on the signal wave power, with large overlap in time. Nevertheless, the Brillouin amplification events at individual peak locations may be resolved through proper post-processing of the collected data [19,25]. The protocol effectively compresses each replica of the extended code into a short and intense virtual pulse, with weak residual side-lobes. The analysis of compressed traces is therefore analogous to a hypothetic measurement with a single intense pulse, which cannot be transmitted in practice. The amplitude codes are designed to achieve a non-cyclic auto-correlation function with minimal off-peak values [47].
Figure 6a shows a Brillouin gain map of 8.8 km of fiber obtained with a spatial resolution of 2 cm [19]. Both pump and signal waves were phase-modulated by a perfect Golomb code with a period of 211 bits and symbol duration of 200 ps. In addition, the amplitude of the pump wave was modulated by a 9785-bits-long sequence with a pulse duration of 20 ns. All 440,000 resolution points are addressed in the analysis. This number remains the largest set of data points measured by a correlation-domain Brillouin sensor [19]. As many as 2000 correlation peaks are simultaneously and unambiguously monitored in each B-OCDA trace. A magnified view of the Brillouin gain in a 2-m-long section located towards the far end of the fiber under test is shown in Figure 6b. A 7-cm-long heated region is identified in the measurements.
2.5. Double Pulse-Pair Analysis
The remainder of Section 2 relates to phase-coded B-OCDA protocols that use a single pump pulse along the lines of Section 2.3. The effective stimulation of the acoustic wave requires that the duration of the pump pulse is several times longer than the Brillouin lifetime . The period of the phase code , in turn, must be longer still. These considerations suggest that the minimum number of correlation peak position scans equals several multiples of . For high-resolution setups that involve short phase code symbols, that number is between 50 and 200.
A variant of phase-coded B-OCDA with a reduced number of position scans was proposed in 2016 [23]. In that system, the phase code period was deliberately chosen to be shorter than . Consequently, the Brillouin amplification events of the signal wave in multiple correlation peak positions overlap in time, and the Brillouin interactions at individual locations cannot be separated directly. To work around this difficulty, each trace is acquired twice with pump pulse durations of and , respectively. While exceeds the phase code period , the differential pulse width does not. The two measurements of the output signal power are subtracted, and the difference trace unambiguously retrieves the Brillouin interactions at individual correlation peak positions.
The measurement technique combines double pulse-pair analysis, which is often used in B-OTDA [12], and correlation-domain analysis. The detection bandwidth that is necessary in the double pulse-pair B-OCDA case corresponds to . That bandwidth is narrower than that of double pulse-pair time-domain analysis, which corresponds to the shorter time intervals . On the other hand, double pulse-pair B-OTDA maps the entire fiber under test with only a single pair of scans per choice of .
Figure 7 shows an example of double pulse-pair, phase-coded B-OCDA analysis [23]. The fiber under test was 43 m long, and the spatial resolution of the analysis was 2.7 cm. Only 11 pairs of correlation peak position scans were necessary for addressing all 1600 resolution points. The durations of the pair of pulses were 29 ns and 30 ns, whereas the period of the phase code was only 2.9 ns. The double pulse-pair analysis successfully removes the ambiguity introduced by the short code period. Three 8-cm-wide hot-spots are clearly seen in the measurements.
2.6. Transient Analysis of the Brillouin Signal Wave
The construction of local Brillouin gain spectra typically requires the measurement of the output signal wave at several tens of different values of the frequency detuning . The output signal power is recorded when it approaches a steady state after the SBS interaction has already taken place over several acoustic lifetimes. Alternatively, in 2016 Preter and co-workers were able to show that the BFS can also be extracted from transient analysis of the instantaneous signal power during the stimulation process [24].
Consider a single pump pulse that is launched at into a uniform fiber under test of short length and a uniform BFS , and a continuous counter-propagating signal wave with a central optical frequency that is lower than that of the pump by a difference . The temporally varying output power of the Brillouin-amplified signal wave may be expressed in terms of an instantaneous gain coefficient : [24]. The functional form of is uniquely determined by the difference in frequencies [24]:
Here, is the steady-state SBS gain coefficient for , , and the expression is valid for . The instantaneous gain coefficient approaches its known steady-state, frequency-dependent value when .
In the proposed transient analysis protocol, an arbitrary value of is chosen, and the instantaneous output power of the signal wave is recorded. The measured trace of is then compared against a set of reference functions calculated through Equation (8) to identify the value of that best fits the experimental results. The procedure can therefore recover an unknown BFS with no frequency scanning. Sign ambiguity may be removed by repeating the experiment with two different random choices of .
Transient analysis of SBS requires that the interaction is confined to short fiber sections with a uniform BFS. These conditions are automatically met in correlation-domain analysis. Figure 8 presents an example of transient, phase-coded B-OCDA [24]. The output signal power is shown as a function of time in nine different correlation peaks, each 4 cm wide. One of the positions was in overlap with a local hot-spot. A different functional form of the transient output signal power is clearly observed at the heated segment. A standard phase-coded B-OCDA map of the SBS gain as a function of position and frequency is presented as well for comparison [24]. The BFS estimates of transient analysis are in quantitative agreement with those of traditional Brillouin sensing. An average error of 2.9 MHz between transient and steady-state analyses was found in a set of calibration B-OCDA experiments with 4 cm spatial resolution [24].
2.7. Applications of Phase-Coded Brillouin Optical Correlation-Domain Analysis
Phase-coded B-OCDA was used in a series of experiments in which fibers under test were embedded in layers of composite materials [26]. The measurement resolution varied between 2 and 4 cm [26]. The analysis was employed in temperature and strain monitoring during and following the production of a composite material beam and in stiffness estimates of a loaded beam in a three-point bending configuration [26]. Figure 9 shows strain maps across the upper surface of a model wing of an unmanned aerial vehicle made with an outer skin of carbon composite layers. Static load was applied to one end of the wing [26]. Three fibers under test were placed underneath the outer-most structural layer of the model surface. The measured strain profile is presented alongside corresponding finite-element, structural analysis calculations [26]. Good agreement is obtained between simulation and experiment. In another recent study, phase-coded B-OCDA was used to monitor strain in composite material cylinders following impact [27,28].
Phase-coded B-OCDA also finds novel application in the mapping of opto-mechanical interactions along tapered glass micro-wires [29,30]. Optical fibers that are tapered down to micron-scale diameter support a rich variety of bulk, surface, and hybrid guided acoustic modes [48,49]. The spectrum of stimulated Brillouin scattering through multiple acoustic modes strongly depends on the geometry of the micro-fiber [48,49]. In 2015, Chow and co-authors used phase-coded B-OCDA to measure the local diameter of a 13-cm-long chalcogenide glass micro-wire with a spatial resolution of 1.3 mm [29]. The experimental uncertainty in the estimate of the local micro-wire diameter was only ±5 nm [29]. Very recently, the same groups applied phase-coded B-OCDA to the distributed analysis of SBS through multiple acoustic modes of a silica micro-fiber [30]. The diameter of the fiber was gradually tapered over several cm down to a minimum waist of 0.9 µm. Maps of SBS gain spectra as a function of position and a broad range of frequencies are shown in Figure 10. The spatial resolution of the analysis was 5 cm. Multiple surface and hybrid acoustic modes are observed [30].
3. Brillouin Optical Correlation-Domain Analysis Based on Amplified Spontaneous Emission Noise
3.1. Principle of Operation
In nearly all Brillouin analysis schemes, the pump and signal waves are drawn from a common, narrowband light source. To begin with, the magnitude of the cross-correlation function between the complex envelopes of the pump and signal waves is appreciable over a long range of relative delays. Correlation-domain analysis protocols deliberately degrade the initial coherence of the light source through broad-bandwidth frequency or phase modulation. However, the modulation bandwidth is restricted to several tens of GHz by technological limitations. The scaling of B-OCDA resolution below 1 mm of silica fiber requires bandwidths of 100 GHz and higher.
A different approach was taken for the first time by Cohen and co-workers in 2014 [31]. Rather than reduce the coherence of laser light, they used the polarized ASE of an erbium-doped fiber amplifier, which is highly incoherent to begin with, as the source of the Brillouin pump and signal [31]. The modulation function in this case is no longer deterministic. It is fluctuating in both amplitude and phase, and may be described in terms of a stationary circular-Gaussian random process [31,32]. The magnitude of the stimulated acoustic wave, at a certain position and a given time, can be predicted only in the statistical sense. Following an initial buildup (), the expectation value of becomes independent of time [31]:
The SBS interaction is therefore effectively confined to a single correlation peak, with a spatial extent that equals half the coherence length of the ASE source [31]. That length can be controlled by spectral filtering of the ASE source. In principle, it might be as short as tens of microns. The spatial resolution of B-OCDA based on an ASE source can be scaled beyond those of systems that employ frequency modulation or phase coding.
The spatial resolution of ASE-based B-OCDA is restricted in practice by poor SNRs. Two factors limit the SNR of the measurements. First, the relative power gain of the signal wave over ultra-short resolution points is very weak: on the order of 1 × 10⁻⁴ for 1 mm of standard fiber with 1 W of pump power. The weak gain would be the same for ASE-based and phase-coded setups of equal resolution. The second restriction, however, is specific to ASE-based realizations: the power of the output signal wave is inherently stochastic, due to amplitude fluctuations of the optical source, regardless of SBS [31,32]. In contrast, the power of the signal wave in all other Brillouin sensors can be regarded as deterministic, and intensity noise of the laser source has little effect on the measurements. This noise mechanism sets a fundamental limitation on the measurement SNR, which cannot be overcome by simply raising the average signal power. The SNR of signal power gain measurements, over detector integration time , can be estimated as [31,32]:
ASE B-OCDA encounters an additional difficulty. Unlike phase-coding with periodic sequences, the ASE source forms only a single correlation peak at . The position scanning of high-order correlation peaks, which is routinely performed in phase-coded B-OCDA [37], is inapplicable. The correlation peak may only be moved through the introduction of physical variable delay lines in the fiber paths leading either the pump or signal waves into the measurement section of interest [31].
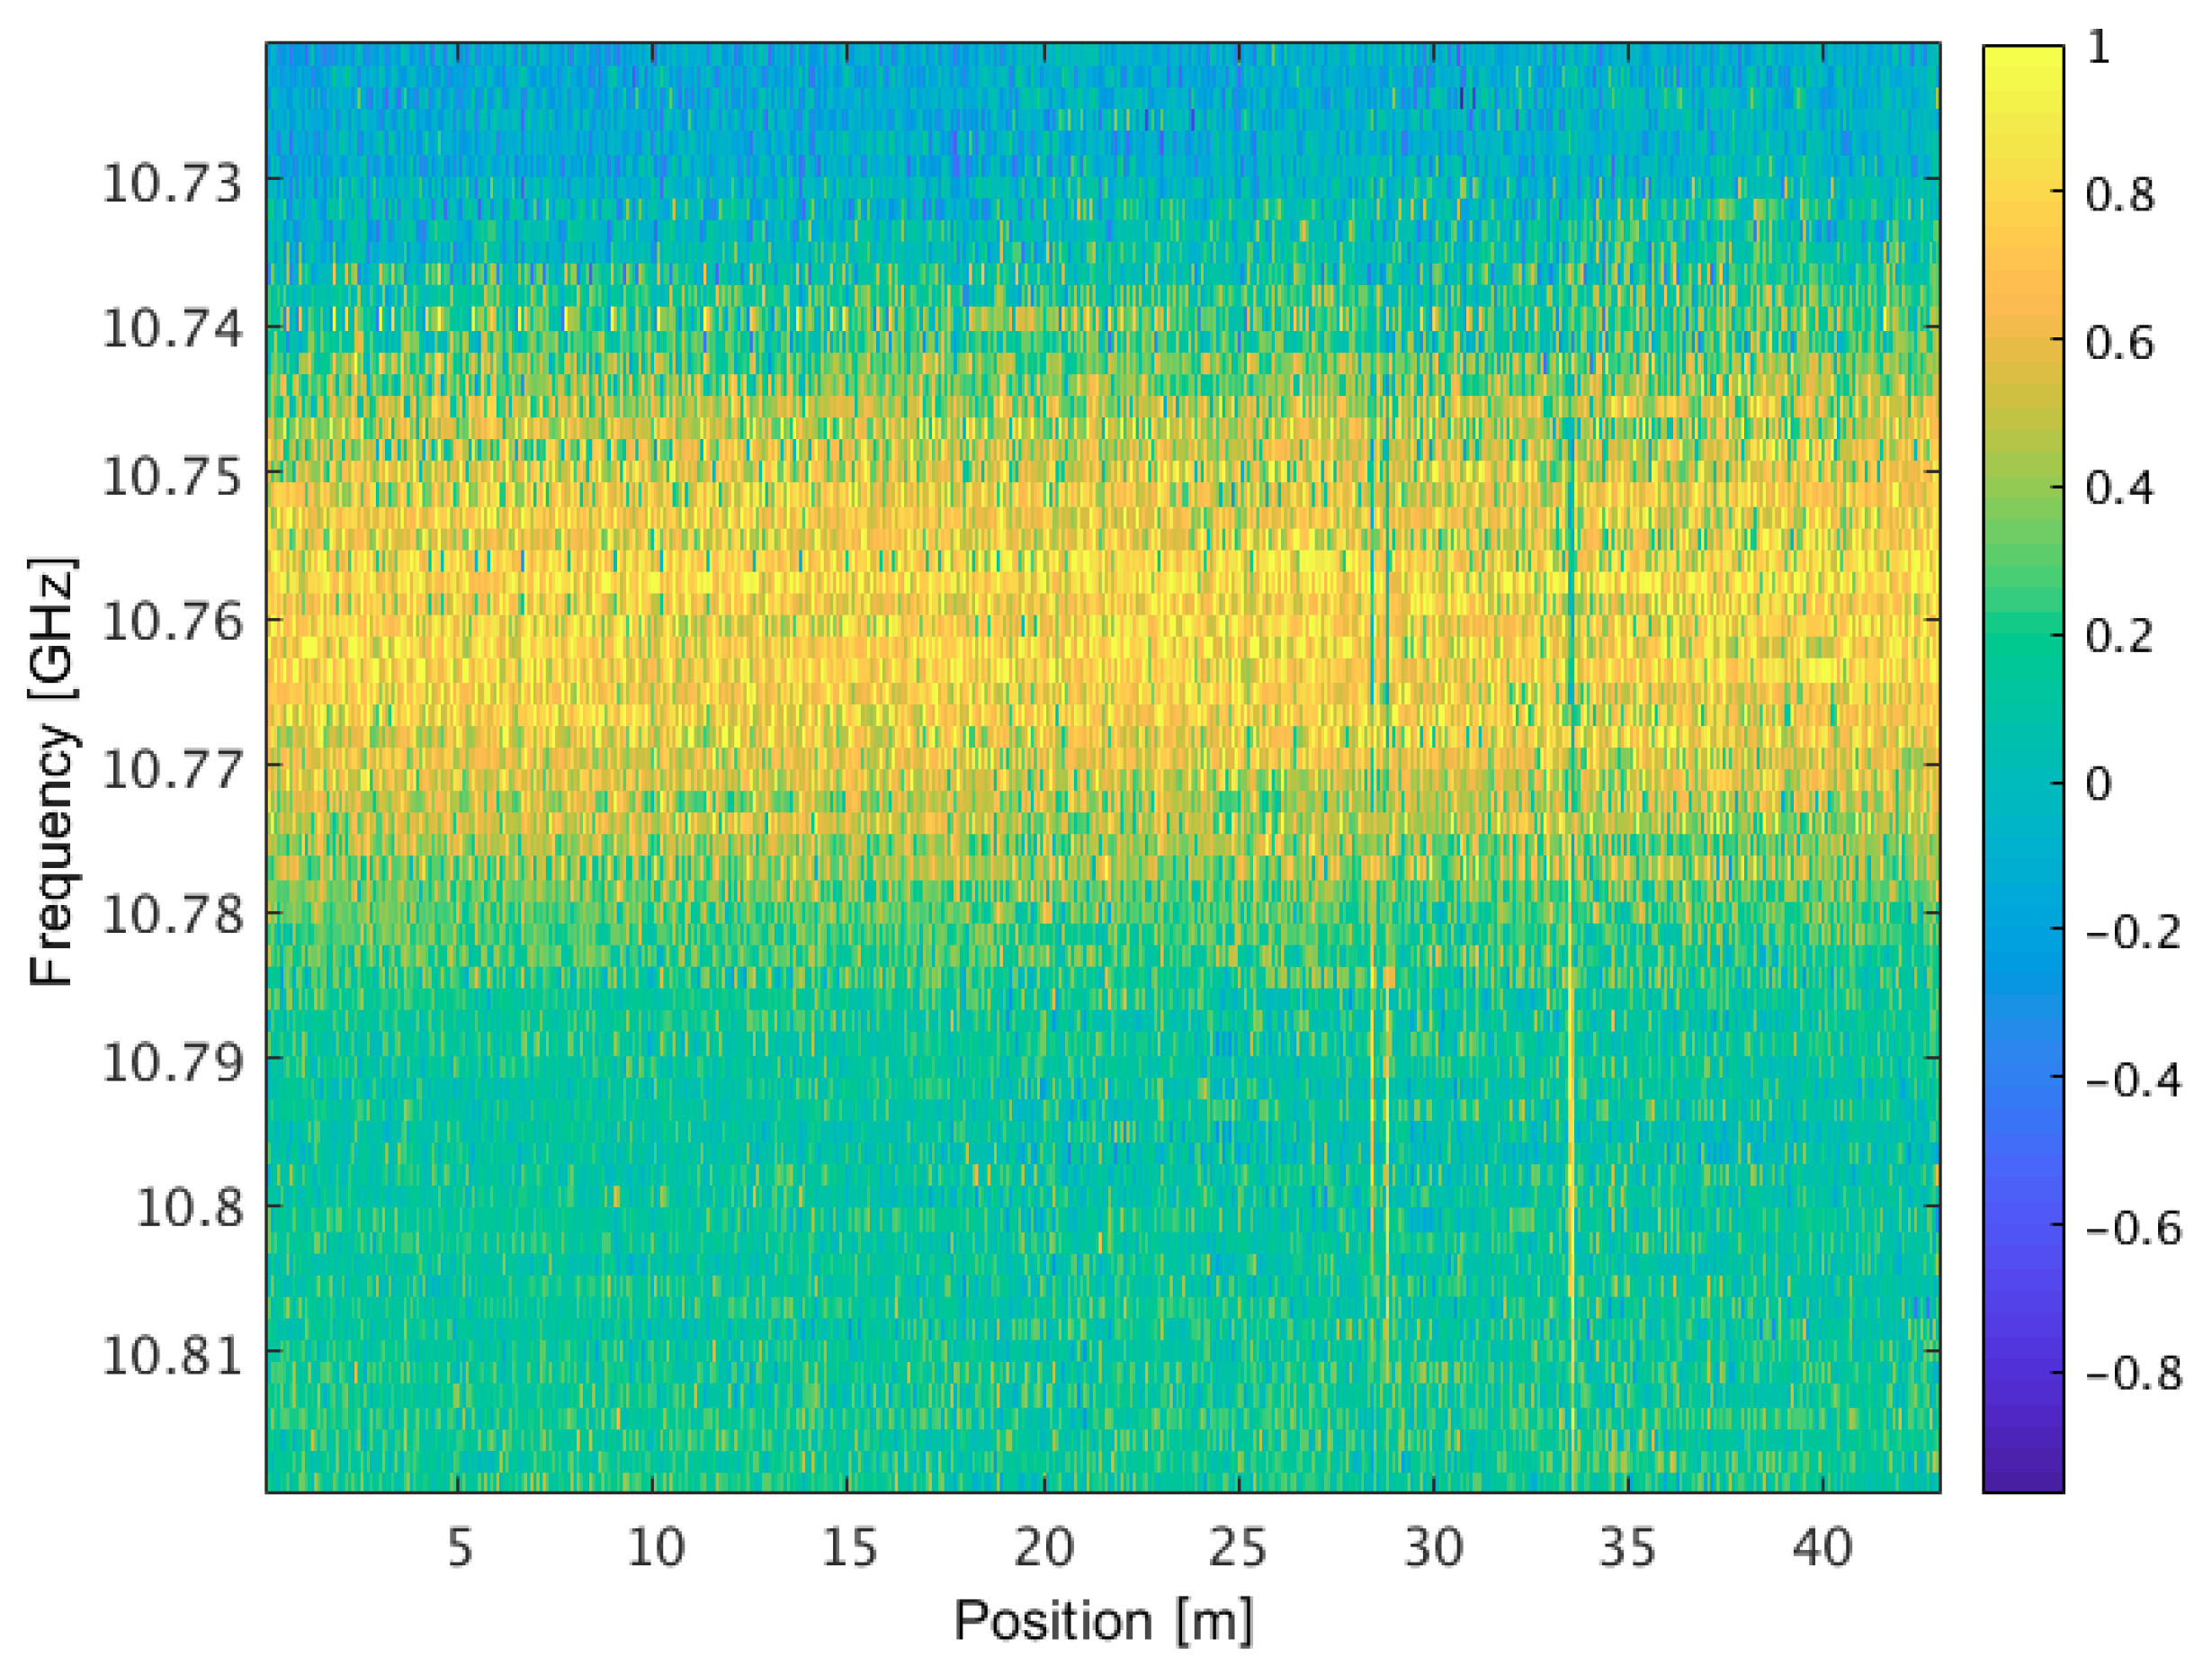
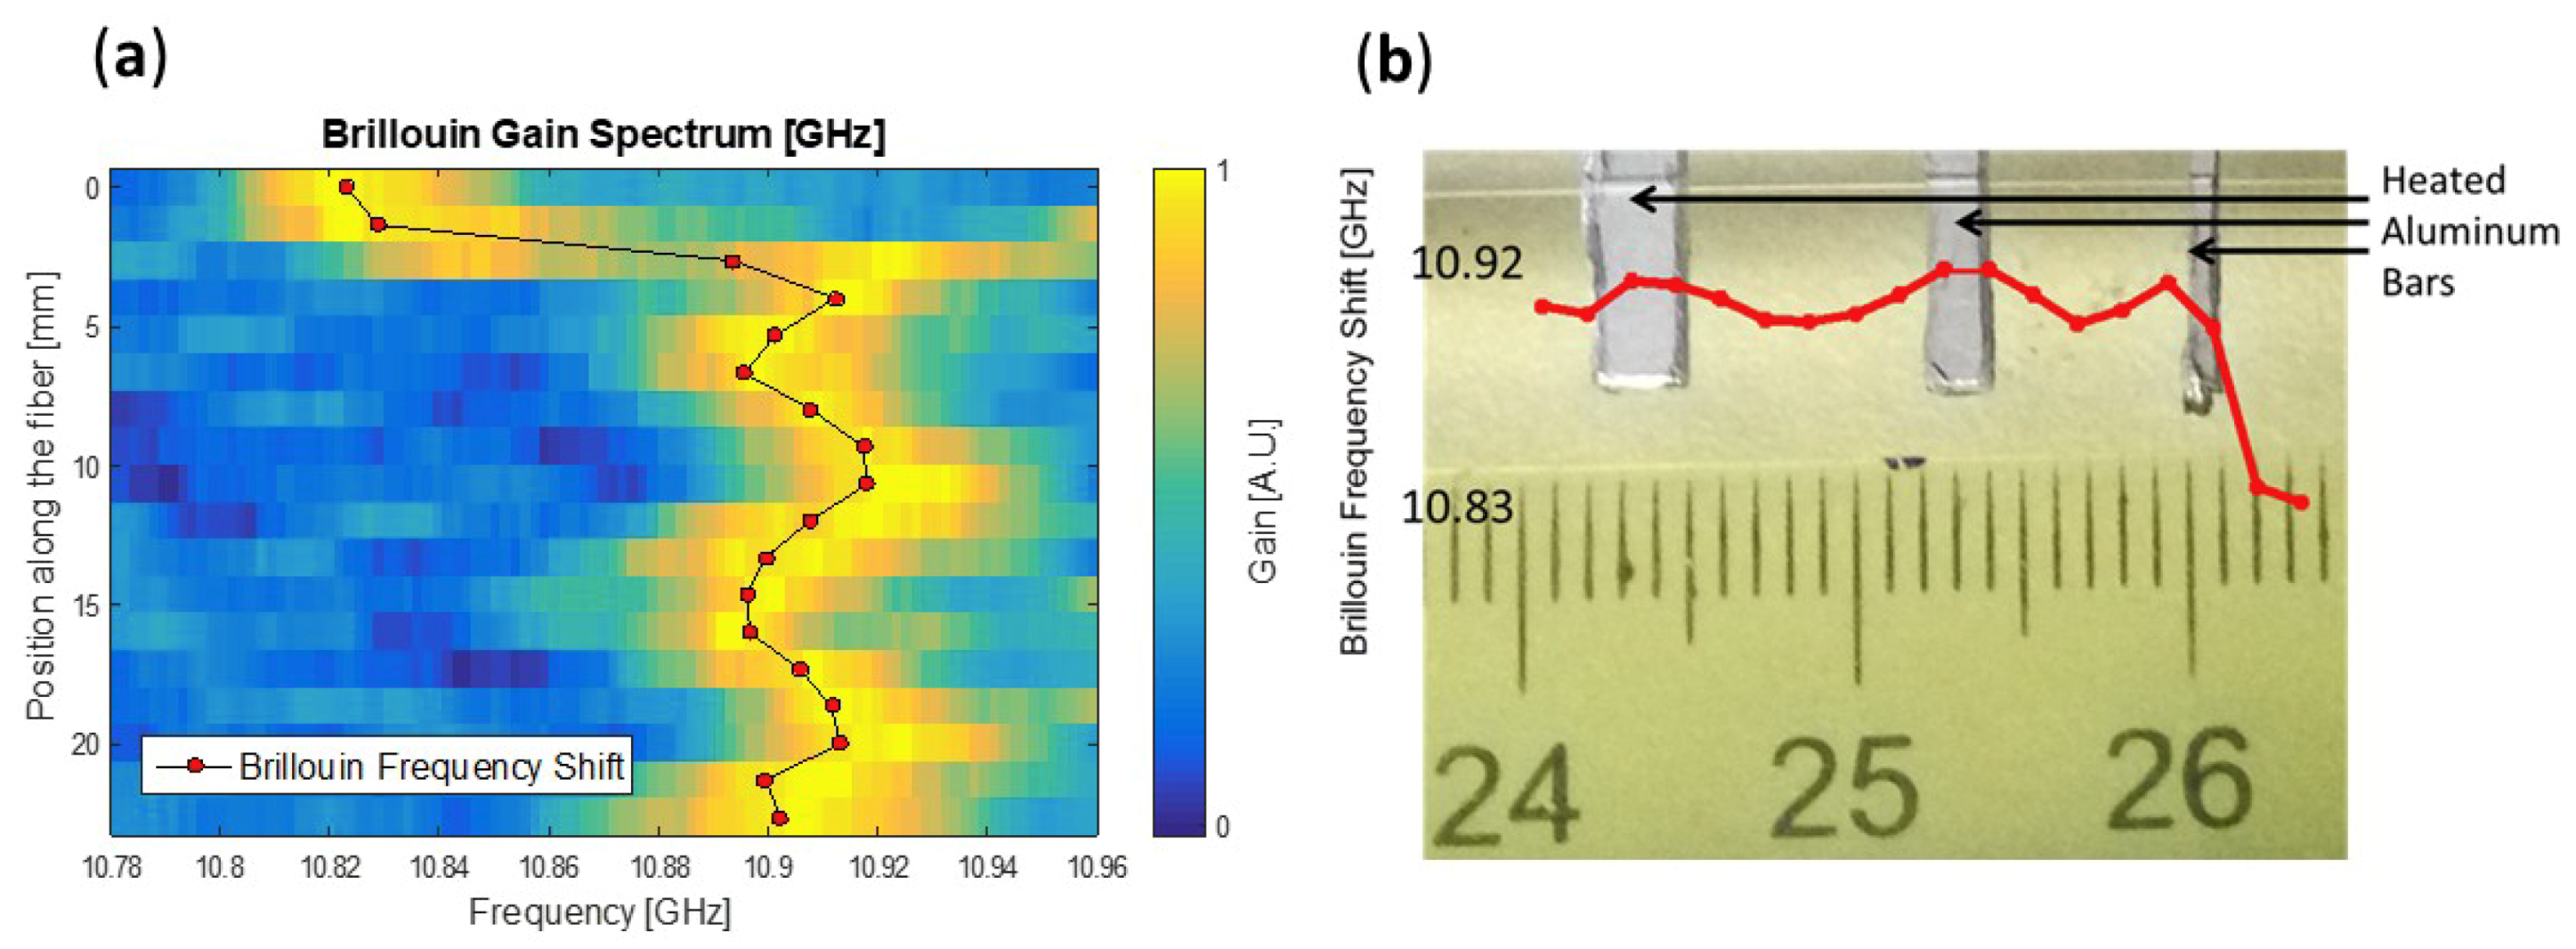
Despite the above issues, ASE B-OCDA was successfully demonstrated with a measurement range of 50 mm and a spatial resolution of 4 mm [31]. That first experiment was conducted over a commercially available small-core fiber with a that is twice larger than that of standard single-mode fiber [31]. Figure 11 below shows previously unpublished follow-up results, in which a section of standard SMF-28 fiber is analyzed with a spatial resolution of 2 mm. Local hot-spots that are 3 mm and 2 mm wide are properly identified, whereas a 1 mm wide heated region is not clearly recognized. The spatial resolution in this experiment comes close to the state-of-the-art of B-OCDA over fiber [16].
Recently, another version of B-OCDA that shares some of the characteristics of the ASE-based approach was proposed and demonstrated by Zhang et al. from Taiyuan University of Technology [34,35]. In this technique, a semiconductor laser diode is placed within an external feedback cavity, which drives the source into a chaotic regime of operation [34,35]. Noise-like waveforms of GHz-scale linewidths are obtained and used in the generation of the Brillouin pump and signal waves. The proposition builds upon an earlier suggestion that was raised in the context of Brillouin dynamic gratings over polarization-maintaining fibers [50]. Similar to ASE-based B-OCDA, high-rate external modulation of the laser light is unnecessary, and is a complex-valued random process. Care was taken to minimize secondary peaks in the auto-correlation function of the chaotic source [34]. As in phase-coded B-OCDA, pulse amplitude modulation of the pump waves was successfully introduced to suppress off-peak Brillouin interactions [35]. In the latest demonstration of this method, a 10.2-km-long fiber under test was monitored with a spatial resolution of 9 cm [35]. Position scanning relied on a long-range programmable optical delay line.
3.2. Distributed Brillouin Analysis over Planar Photonic Waveguides
The demonstration of ASE B-OCDA over fiber serves as a useful proof of concept. However, the resolution achieved thus far does not exceed that of frequency modulation B-OCDA, the measurement SNR is inherently worse, and the scanning of position is more difficult. The poor SNR keeps ASE B-OCDA over fiber from reaching the ultra-high resolution that could be provided by the short coherence length of the source. Such demonstrations had to wait for a different, more suitable platform.
SBS was first demonstrated in a planar optical waveguide in As2S3 chalcogenide glass in 2011 [51]. The Brillouin gain coefficient in this material is 2 orders of magnitude larger than that of silica [51]. In addition, the waveguide design provides effective guiding of both optical and acoustic modes in a tight cross-section and with large spatial overlap [52]. Due to these properties, the Brillouin gain per unit length in chalcogenide glass waveguides is far larger than that of standard fiber: signal power amplification by as much as 52 dB has been achieved on-chip [53,54]. Large SBS gain at the device level provides opportunities for many all-optical and microwave-photonic signal processing applications [55,56]. Among those, distributed Brillouin analysis may now be preformed with unprecedented, ultra-high spatial resolution.
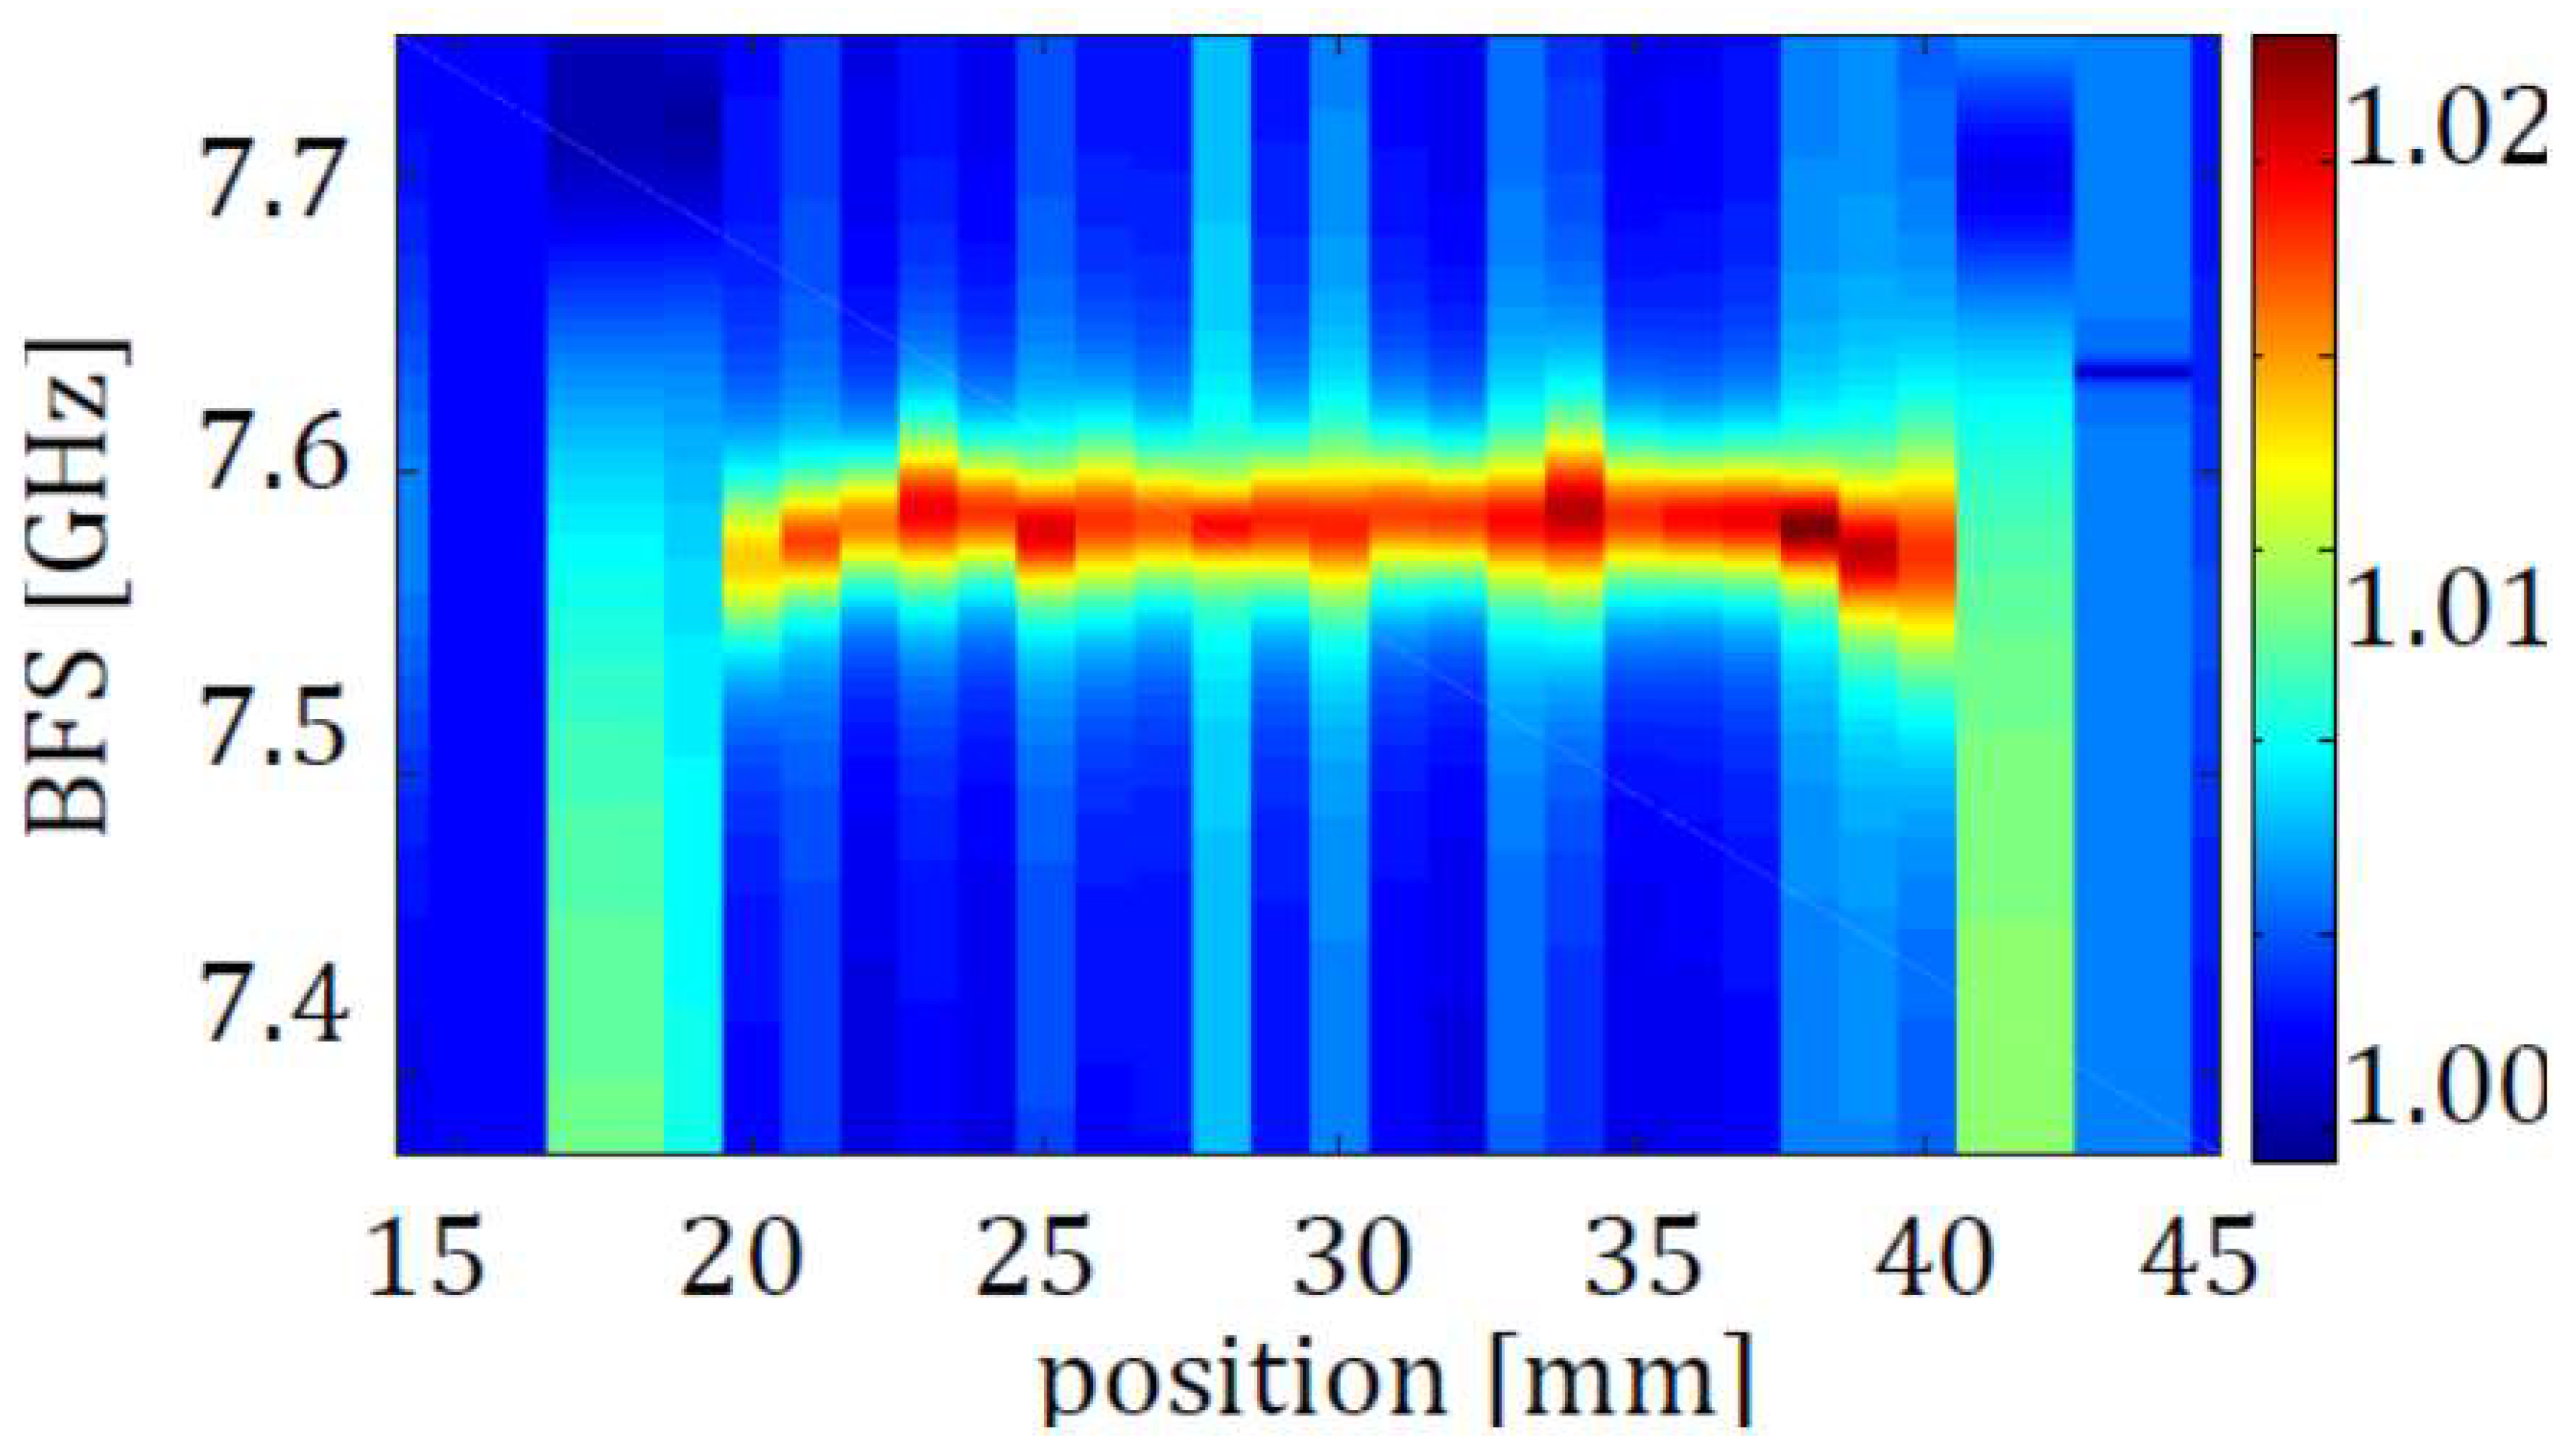
A first striking demonstration of ASE B-OCDA on-chip was provided earlier this year by Zarifi et al. [33]. Figure 12 shows an SBS gain map taken with a spatial resolution of 800 µm [33]. The results represent a new record for Brillouin sensing resolution. The ASE source used was filtered to a bandwidth of almost 90 GHz (note that the group velocity of light in the waveguide is slower than in silica fibers). Similar bandwidths are difficult to achieve with modulation of laser light. This work conquers new ground for Brillouin sensing, and it is likely to be the first of many analyses of photonic integrated circuits.
4. Conclusions
B-OCDA was first proposed 20 years ago to provide random-access measurements of strain and temperature with high resolution that is not restricted by the acoustic lifetime [13]. This review addressed two variants of the basic concept, which are meant to increase the flexibility in the synthesis of the correlation function. The first approach is based on the joint coding of the pump and signal waves by high-rate phase sequences [18]. Careful choice of codes can lead to significant reduction of residual off-peak Brillouin interactions [21]. The suppression of correlation side-lobes would be advantageous in slope-assisted implementation of phase-coded B-OCDA, which was recently demonstrated [57]. Phase-coded B-OCDA is successfully combined with pulse modulation of the pump wave, reaching the largest sets of resolution points of all correlation-domain sensors [20,22]. Further extensions aimed to reduce the number of averaged traces [19,25], cover the entire fiber with fewer position scans [23], or eliminate frequency scanning [24]. In a different variant of B-OCDA, modulated laser light is replaced by incoherent ASE noise [31]. That concept was used in the first Brillouin sensing experiment to break the millimeter resolution barrier [33].
Despite these advances, the majority of commercial Brillouin sensor systems continue to employ time-domain protocols. B-OTDA is conceptually simpler than B-OCDA and offers faster acquisition. Modulation of the light source in B-OCDA increases complexity. Furthermore, structures that require high-resolution monitoring are often smaller in size, and might not be compatible with the size and cost of Brillouin analyzers. Other fiber-sensing concepts, such as optical frequency-domain reflectometry (OFDR) [58,59], are making ground faster. OFDR can provide very high spatial resolution and excellent sensitivity [58,59]. The main drawback of OFDR, like many sensors that are based on Rayleigh backscatter, is the indirect assessment of temperature and strain. Measurements of the BFS provide more direct reading of both quantities. Phase coding with standard telecommunication modulators might make B-OCDA more accessible. The technique begins to find foothold in the monitoring of comparatively small structures, where high resolution is significant [26,27,28]. More examples are likely to follow. Noise-based B-OCDA may provide resolution that time-domain protocols cannot reach.
In a broader context, the study of SBS is undergoing a change in perspective in recent years. Coupling between light and sound waves draws increasing interest as a means for fundamental study of light–matter interactions, as a potential platform for quantum information technology, and as a basis for analog signal processing [53,54,55,56,60,61,62,63,64,65,66,67]. SBS over fiber, which involves a single, longitudinal bulk-like acoustic mode and a single spatial optical mode, is regarded as a specific case of a much broader portfolio of possible configurations of light and sound interactions [62]. Research on SBS in micro-wire and integrated-photonic platforms is flourishing, with exciting results in silica [30,48,49,63,64], chalcogenide glasses [29,33,53,54,55,56], silicon-nitride [65], and even silicon [66,67]. In parallel with these advances, analysis techniques that were developed for the purpose of sensing over fibers are being adapted by the broader opto-mechanics community. The mapping of opto-mechanical interactions over integrated devices naturally calls for higher spatial resolution. Two such examples are referenced in this review: the distributed analysis of SBS over silica and chalcogenide glass micro-wires [29,30] and in chalcogenide glass waveguides [33]. In both cases, B-OCDA was instrumental in the mapping of local geometry. As device-level opto-mechanics continues to grow in significance, one may expect that B-OCDA may take up new and increasing roles. The two specific schemes discussed here, phase-coding and ASE-based B-OCDA, are particularly suitable to these new tasks.
Author Contributions
E.P. and Y.L. performed the experiments and analyzed the data reported in Figure 11. A.Z. wrote the review paper.
Funding
The research presented in Figure 11 was supported in part by the ALTIA consortium for the development of high-power fiber lasers through the MAGNET program of the Israeli Innovation Authority.
Acknowledgments
The authors thank Andrey Denisov, formerly with EPFL, Switzerland for permission to reproduce Figure 5; Luc Thevenaz of EPFL, Switzerland and Kein Phan Hui and Jean-Charles Beugnot of Université de Franche-Comté, France for permission to reproduce Figure 10; and Benjamin J. Eggleton and Atiyeh Zarifi of the University of Sydney, Australia for permission to reproduce Figure 12.
Conflicts of Interest
The authors declare no conflict of interest.
References
- Kurashima, T.; Horiguchi, T.; Tateda, M. Distributed-temperature sensing using stimulated Brillouin scattering in optical silica fibers. Opt. Lett. 1990, 15, 1038–1040. [Google Scholar] [CrossRef] [PubMed]
- Nikles, M.; Thévenaz, L.; Robert, P.A. Simple distributed fiber sensor based on Brillouin gain spectrum analysis. Opt. Lett. 1996, 21, 758–760. [Google Scholar] [CrossRef] [PubMed]
- Fellay, A.; Thévenaz, L.; Facchini, M.; Niklès, M.; Robert, P.A. Distributed sensing using stimulated Brillouin scattering: towards ultimate resolution. In Proceedings of the 12th International Conference on Optical Fiber Sensors (OFS-12), Williamsburg, VA, USA, 28–31 October 1997. [Google Scholar]
- Lecoeuche, V.; Webb, D.J.; Pannell, C.N.; Jackson, D.A. Transient response in high-resolution Brillouin-based distributed sensing using probe pulses shorter than the acoustic relaxation time. Opt. Lett. 2000, 25, 156–158. [Google Scholar] [CrossRef] [PubMed] [Green Version]
- Brown, A.W.; Colpitts, B.G.; Brown, K. Distributed sensor based on dark-pulse Brillouin scattering. IEEE Photonic Technol. Lett. 2005, 17, 1501–1503. [Google Scholar] [CrossRef]
- Wang, F.; Bao, X.; Chen, L.A.; Li, Y.; Snoddy, J.; Zhang, X. Using pulse with a dark base to achieve high spatial and frequency resolution for the distributed Brillouin sensor. Opt. Lett. 2008, 33, 2707–2709. [Google Scholar] [CrossRef] [PubMed]
- Li, W.; Bao, X.; Li, Y.; Chen, L.A. Differential pulse-width pair BOTDA for high spatial resolution sensing. Opt. Express 2008, 16, 21616–21625. [Google Scholar] [CrossRef] [PubMed]
- Foaleng Mafang, S.; Tur, M.; Beugnot, J.C.; Thevenaz, L. High spatial and spectral resolution long-range sensing using Brillouin echoes. J. Lightwave Technol. 2010, 28, 2993–3003. [Google Scholar] [CrossRef]
- Sperber, T.; Eyal, A.; Tur, M.; Thevenaz, L. High spatial resolution distributed sensing in optical fibers by Brillouin gain-profile tracing. Opt. Express 2010, 18, 8671–8679. [Google Scholar] [CrossRef] [PubMed]
- Beugnot, J.C.; Tur, M.; Foaleng Mafang, S.; Thevenaz, L. Distributed Brillouin sensing with sub-meter spatial resolution: modeling and processing. Opt. Express 2011, 19, 7381–7397. [Google Scholar] [CrossRef] [PubMed]
- Bao, X.; Chen, L.A. Recent progress in Brillouin scattering based fiber sensors. Sensors 2011, 11, 4152–4187. [Google Scholar] [CrossRef] [PubMed]
- Dong, Y.; Zhang, H.; Chen, L.A.; Bao, X. 2 cm spatial-resolution and 2 km range Brillouin optical fiber sensor using a transient differential pulse pair. Appl. Opt. 2012, 51, 1229–1235. [Google Scholar] [CrossRef] [PubMed]
- Hotate, K. Measurement of Brillouin gain spectrum distribution along an optical fiber with a high spatial resolution using a novel correlation-based technique: demonstration of 45 cm spatial resolution. In Proceedings of the 13th International Conference on Optical Fiber Sensors (OFS-13), Kyongju, Korea, 12–16 April 1999. [Google Scholar]
- Hotate, K.; Hasegawa, T. Measurement of Brillouin gain spectrum distribution along an optical fiber using a correlation-based technique-proposal, experiment and simulation. IEICE Trans. Electron. 2000, E83-C, 405–412. [Google Scholar]
- Boyd, R.W. Nonlinear Optics, 3rd ed.; Academic Press: Cambridge, MA, USA, 2008. [Google Scholar]
- Song, K.Y.; He, Z.; Hotate, K. Distributed strain measurement with millimeter-order spatial resolution based on Brillouin optical correlation domain analysis. Opt. Lett. 2006, 31, 2526–2528. [Google Scholar] [CrossRef] [PubMed]
- Mizuno, Y.; He, Z.Y.; Hotate, K. Measurement range enlargement in Brillouin optical correlation-domain reflectometry based on double-modulation scheme. Opt. Express 2010, 18, 5926–5933. [Google Scholar] [CrossRef] [PubMed]
- Zadok, A.; Antman, Y.; Primrov, N.; Denisov, A.; Sancho, J.; Thévenaz, L. Random-access distributed fiber sensing. Laser Photonics Rev. 2012, 6, L1–L5. [Google Scholar] [CrossRef] [Green Version]
- London, Y.; Antman, Y.; Preter, E.; Levanon, N.; Zadok, A. Brillouin optical correlation domain analysis addressing 440,000 resolution points. J. Lightwave Technol. 2016, 34, 4421–4429. [Google Scholar] [CrossRef]
- Denisov, A.; Soto, M.A.; Thevenaz, L. Going beyond 1000000 resolved points in a Brillouin distributed fiber sensor: Theoretical analysis and experimental demonstration. Light Sci. Appl. 2016, 5, e16074. [Google Scholar] [CrossRef]
- Antman, Y.; Levanon, N.; Zadok, A. Low-noise delays from dynamic Brillouin gratings based on perfect Golomb coding of pump waves. Opt. Lett. 2012, 37, 5259–5261. [Google Scholar] [CrossRef] [PubMed]
- Elooz, D.; Antman, Y.; Levanon, N.; Zadok, A. High-resolution long-reach distributed Brillouin sensing based on combined time-domain and correlation-domain analysis. Opt. Express 2014, 22, 6453–6463. [Google Scholar] [CrossRef] [PubMed]
- Shlomi, O.; Preter, E.; Ba, D.; London, Y.; Antman, Y.; Zadok, A. Double-pulse pair Brillouin optical correlation-domain analysis. Opt. Express 2016, 24, 26867–26876. [Google Scholar] [CrossRef] [PubMed]
- Preter, E.; Ba, D.; London, Y.; Shlomi, O.; Antman, Y.; Zadok, A. High-resolution Brillouin optical correlation domain analysis with no spectral scanning. Opt. Express 2016, 24, 27253–27267. [Google Scholar] [CrossRef] [PubMed]
- London, Y.; Antman, Y.; Cohen, R.; Kimelfeld, N.; Levanon, N.; Zadok, A. High-resolution long-range distributed Brillouin analysis using dual-layer phase and amplitude coding. Opt. Express 2014, 22, 27144–27158. [Google Scholar] [CrossRef] [PubMed]
- Stern, Y.; London, Y.; Preter, E.; Antman, Y.; Diamandi, H.H.; Silbiger, M.; Adler, G.; Levenberg, E.; Shalev, D.; Zadok, A. Brillouin Optical Correlation Domain Analysis in Composite Material Beams. Sensors 2017, 17, 2266. [Google Scholar] [CrossRef] [PubMed]
- Choi, B.H.; Seo, D.C.; Kwon, I.B. Detecting impact traces on a composite pressure vessel with aluminum-coating optical fiber using a phase-modulated BOCDA sensor. Compos. Sci. Technol. 2017, 142, 264–274. [Google Scholar] [CrossRef]
- Choi, B.H.; Kwon, I.B. Strain pattern detection of composite cylinders using optical fibers after low velocity impacts. Compos. Sci. Technol. 2018, 154, 64–75. [Google Scholar] [CrossRef]
- Chow, D.M.; Tchahame, J.C.; Denisov, A.; Beugnot, J.C.; Sylvestre, T.; Li, L.; Ahmad, R.; Rochette, M.; Tow, K.H.; Soto, M.A.; Thévenaz, L. Mapping the Uniformity of Optical Microwires Using Phase-Correlation Brillouin Distributed Measurements. In Proceedings of the Frontiers in Optics Conference (FiO), San Jose, CA, USA, 18–22 October 2015. [Google Scholar]
- Chow, D.M.; Beugnot, J.C.; Godet, A.; Huy, K.P.; Soto, M.A.; Thévenaz, L. Local activation of surface and hybrid acoustic waves in optical microwires. Opt. Lett. 2018, 43, 1487–1490. [Google Scholar] [CrossRef] [PubMed] [Green Version]
- Cohen, R.; London, Y.; Antman, Y.; Zadok, A. Brillouin optical correlation domain analysis with 4 millimeter resolution based on amplified spontaneous emission. Opt. Express 2014, 22, 12070–12078. [Google Scholar] [CrossRef] [PubMed]
- Goodman, J.W. Statistical Optics; Wiley Classics Library Edition; John Wiley & Sons: New York, NY, USA, 2000. [Google Scholar]
- Zarifi, A.; Stiller, B.; Merklein, M.; Li, N.; Vu, K.; Choi, D.-Y.; Ma, P.; Madden, S.J.; Eggleton, B.J. Highly localized distributed Brillouin scattering response in a photonic integrated circuit. Appl. Phys. Lett. Photonics 2018, 3, 036101. [Google Scholar] [CrossRef]
- Zhang, J.; Feng, C.; Zhang, M.; Liu, Y.; Wu, C.; Wang, Y. Brillouin optical correlation domain analysis based on chaotic laser with suppressed time delay signature. Opt. Express 2018, 26, 6962–6972. [Google Scholar] [CrossRef] [PubMed]
- Zhang, J.; Wang, Y.; Zhang, M.; Zhang, Q.; Li, M.; Wu, C.; Qiao, L.; Wang, Y. Time-gated chaotic Brillouin optical correlation domain analysis. Opt. Express 2018, 26, 17597–17607. [Google Scholar] [CrossRef] [PubMed]
- Antman, Y.; Primerov, N.; Sancho, J.; Thevenaz, L.; Zadok, A. Localized and stationary dynamic gratings via stimulated Brillouin scattering with phase modulated pumps. Opt. Express 2012, 20, 7807–7821. [Google Scholar] [CrossRef] [PubMed] [Green Version]
- Ben-Amram, A.; Stern, Y.; London, Y.; Antman, Y.; Zadok, A. Stable closed-loop fiber-optic delay of arbitrary radio-frequency waveforms. Opt. Express 2015, 23, 28244–28257. [Google Scholar] [CrossRef] [PubMed]
- Golomb, S.W. Two-valued sequences with perfect periodic autocorrelation. IEEE Trans. Aerosp. Electron. Syst. 1992, 28, 383–386. [Google Scholar] [CrossRef]
- Antman, Y.; Yaron, L.; Langer, T.; Tur, M.; Zadok, A. Variable delay of Gbit/s data using coded Brillouin dynamic gratings. In Proceedings of the Advances in Slow and Fast Light VII Conference, SPIE Photonics West, San Francisco, CA, USA, 21–26 January 2014. [Google Scholar]
- Antman, Y.; Yaron, L.; Langer, T.; Tur, M.; Levanon, N.; Zadok, A. Experimental demonstration of localized Brillouin gratings with low off-peak reflectivity established by perfect Golomb codes. Opt. Lett. 2013, 38, 4701–4704. [Google Scholar] [CrossRef] [PubMed]
- Sancho, J.; Primerov, N.; Chin, S.; Antman, Y.; Zadok, A.; Sales, S.; Thévenaz, L. Tunable and reconfigurable multi-tap microwave photonic filter based on dynamic Brillouin gratings in fibers. Opt. Express 2012, 20, 6157–6162. [Google Scholar] [CrossRef] [PubMed] [Green Version]
- Elooz, D.; Antman, Y.; Zadok, A. Combined time-domain and correlation-domain Brillouin analysis with 1600 meters range and 2 centimeters resolution. In Proceedings of the 23rd Optical Fiber Sensors Conference (OFS-23), Santander, Spain, 2–6 June 2014. [Google Scholar]
- Denisov, A. Brillouin Dynamic Gratings in Optical Fibres for Distributed Sensing and Advanced Optical Signal Processing. Doctoral Dissertation, École Polytechnique Fédérale de Lausanne, Lausanne, Switzerland, 10 September 2015. [Google Scholar]
- Ryu, G.; Kim, G.-T.; Song, K.Y.; Lee, S.B.; Lee, K. Brillouin Optical Correlation Domain Analysis Enhanced by Time-Domain Data Processing for Concurrent Interrogation of Multiple Sensing Points. J. Lightwave Technol. 2017, 35, 5311–5316. [Google Scholar] [CrossRef]
- Alasia, D.; González Herráez, M.; Abrardi, L.; Martin-López, S.; Thévenaz, L. Detrimental effect of modulation instability on distributed optical fiber sensors using stimulated Brillouin scattering. In Proceedings of the 17th Optical Fiber Sensors Conference, 23 May 2005; SPIE: Bellingham WA, USA, 2005. [Google Scholar]
- Minardo, A.; Bernini, R.; Zeni, L. A simple technique for reducing pump depletion in long-range distributed Brillouin fiber sensors. IEEE Sens. J. 2009, 9, 633–634. [Google Scholar] [CrossRef]
- Levanon, N. Noncoherent pulse compression. IEEE Trans. Aerosp. Electron. Syst. 2006, 42, 756–765. [Google Scholar] [CrossRef]
- Florez, O.; Jarschel, P.F.; Espinel, Y.A.; Cordeiro, C.M.B.; Alegre, T.M.; Wiederhecker, G.S.; Dainese, P. Brillouin scattering self-cancellation. Nat. Commun. 2016, 7, 11759. [Google Scholar] [CrossRef] [PubMed] [Green Version]
- Godet, A.; Ndao, A.; Sylvestre, T.; Pecheur, V.; Lebrun, S.; Pauliat, G.; Beugnot, J.C.; Huy, K.P. Brillouin spectroscopy of optical microfibers and nanofibers. Optica 2017, 4, 1232–1238. [Google Scholar] [CrossRef]
- Santagiustina, M.; Ursini, L. Dynamic Brillouin gratings permanently sustained by chaotic lasers. Opt. Lett. 2012, 37, 893–895. [Google Scholar] [CrossRef] [PubMed]
- Pant, R.; Poulton, C.G.; Choi, D.-Y.; Mcfarlane, H.; Hile, S.; Li, E.; Thevenaz, L.; Luther-Davies, B.; Madden, S.J.; Eggleton, B.J. On-chip stimulated Brillouin scattering. Opt. Express 2011, 19, 8285–8290. [Google Scholar] [CrossRef] [PubMed]
- Poulton, C.G.; Pant, R.; Eggleton, B.J. Acoustic confinement and stimulated Brillouin scattering in integrated optical waveguides. J. Opt. Soc. Am. B 2013, 30, 2657–2664. [Google Scholar] [CrossRef]
- Choudhary, A.; Morrison, B.; Aryanfar, I.; Shahnia, S.; Pagani, M.; Liu, Y.; Vu, K.; Madden, S.J.; Marpaung, D.; Eggleton, B.J. Advanced integrated microwave signal processing with giant on-chip Brillouin gain. J. Lightwave Technol. 2017, 35, 846–854. [Google Scholar] [CrossRef]
- Morrison, B.; Casas-Bedoya, A.; Ren, G.; Vu, K.; Liu, Y.; Zarifi, A.; Nguyen, T.G.; Choi, D.-Y.; Marpaung, D.; Madden, S.J.; et al. Compact Brillouin devices through hybrid integration on silicon. Optica 2017, 4, 847–854. [Google Scholar] [CrossRef]
- Marpaung, D.; Roeloffzen, C.; Heideman, R.; Leinse, A.; Sales, S.; Capmany, J. Integrated microwave photonics. Laser Photonics Rev. 2013, 7, 506–538. [Google Scholar] [CrossRef]
- Merklein, M.; Stiller, B.; Vu, K.; Madden, S.J.; Eggleton, B.J. A chip-integrated coherent photonic-phononic memory. Nat. Commun. 2017, 8, 574. [Google Scholar] [CrossRef] [PubMed] [Green Version]
- Morosi, J.; Ferrarlo, M.; Boffi, P.; Martinelli, M. Double slope-assisted Brillouin optical correlation domain analysis. In Proceedings of the Lasers and Electro-Optics Europe & European Quantum Electronics Conference (CLEO/Europe-EQEC, 2017), Munich, Germany, 25–29 June 2017. [Google Scholar]
- Bao, X.; Chen, L. Recent progress in distributed fiber-optic sensors. Sensors 2012, 12, 8601–8639. [Google Scholar] [CrossRef] [PubMed]
- Soller, B.J.; Gifford, D.K.; Wolfe, M.S.; Froggatt, M.E. High resolution optical frequency domain reflectometry for characterization of components and assemblies. Opt. Express 2005, 13, 666–674. [Google Scholar] [CrossRef] [PubMed]
- Kippenberg, T.J.; Vahala, K.J. Cavity optomechanics: back-action at the mesoscale. Science 2008, 321, 1172–1176. [Google Scholar] [CrossRef] [PubMed]
- Aspelmeyer, M.; Kippenberg, T.J.; Marquardt, F. Cavity optomechanics. Rev. Modern Phys. 2014, 86, 1391–1452. [Google Scholar] [CrossRef] [Green Version]
- Van Laer, R.; Baets, R.; van Thourhout, D. Unifying Brillouin scattering and cavity optomechanics. Phys. Rev. A 2016, 93, 053828. [Google Scholar] [CrossRef]
- Tomes, M.; Carmon, T. Photonic micro-electromechanical systems vibrating at X-band (11-GHz) rates. Phys. Rev. Lett. 2009, 102, 113601. [Google Scholar] [CrossRef] [PubMed]
- Bahl, G.; Zehnpfennig, J.; Tomes, M.; Carmon, T. Stimulated optomechanical excitation of surface acoustic waves in a microdevice. Nat. Commun. 2011, 2, 403. [Google Scholar] [CrossRef] [PubMed] [Green Version]
- Shin, H.; Qiu, W.; Jarecki, R.; Cox, J.A.; Olsson, R.H., III; Starbuck, A.; Wang, Z.; Rakich, P.T. Tailorable stimulated Brillouin scattering in nanoscale silicon waveguides. Nat. Commun. 2013, 4, 2943. [Google Scholar] [CrossRef] [PubMed] [Green Version]
- Kittlaus, E.A.; Otterstrom, N.T.; Rakich, P.T. On-chip inter-modal Brillouin scattering. Nat. Commun. 2017, 8, 15819. [Google Scholar] [CrossRef] [PubMed] [Green Version]
- Van Laer, R.; Kuyken, B.; van Thourhout, D.; Baets, R. Interaction between light and highly confined hypersound in a silicon photonic nanowire. Nat. Photonics 2015, 9, 199–203. [Google Scholar] [CrossRef] [Green Version]
Figure 1.
Schematic illustration of a phase-coded Brillouin optical correlation domain setup. EDFA, erbium-doped fiber amplifier; Phase Mod., electro-optic phase modulator; SSB Mod., electro-optic single-sideband modulator.
Figure 1.
Schematic illustration of a phase-coded Brillouin optical correlation domain setup. EDFA, erbium-doped fiber amplifier; Phase Mod., electro-optic phase modulator; SSB Mod., electro-optic single-sideband modulator.

Figure 2.
Phase-coded Brillouin optical correlation-domain analysis (B-OCDA) measurements [18]. (a) Brillouin gain mapping of a 40-m-long fiber with 1-cm resolution, corresponding to 4000 resolved points. A 1-cm-long section of the fiber was locally heated. (b) Magnified view of the Brillouin gain map in the vicinity of the heated section. Reproduced with permission from [18], Wiley, 2012.

Figure 3.
Calculated magnitude of the stimulated acoustic wave density fluctuations (in units of kg/mm3, see color bar) as a function of time and position within 1 m of fiber [21]. The pump and signal waves were jointly modulated by a high-rate binary phase sequence. A pseudo-random bit sequence (PRBS) was used in the left panel, and a perfect Golomb code was used in the right panel. Both codes were 63 bits long with bit duration of 100 ps. Stationary stimulation of the acoustic wave may be observed at a narrow correlation peak at the center of the fiber. The magnitude of residual off-peak acoustic waves is considerably reduced with the employment of the Golomb code. Reproduced with permission from [21], Optical Society of America, 2012.

Figure 4.
Phase-coded B-OCDA with overlaid pulse modulation of the pump wave. (a) Calculated normalized magnitude of the stimulated acoustic wave density fluctuations as a function of time and position along 6 m of fiber. Both pump and signal waves are co-modulated by a perfect Golomb phase code that is 127 bits long with a symbol duration of 200 ps. The pump wave is further modulated by a single amplitude pulse of 26 ns duration. The acoustic wave is confined to discrete and periodic narrow correlation peaks. Acoustic waves at peak locations are stimulated sequentially, one after another, with no temporal overlap. Reproduced with permission from [22], Optical Society of America, 2014. (b) Measured normalized Brillouin gain as a function of correlation peak position and frequency offset between the pump and signal waves. The fiber under test was over 1600 m long. Phase-coded B-OCDA with an overlaid pump pulse was performed with a spatial resolution of 2 cm. All 80,000 resolution points were successfully addressed. The gain map shows a magnified view of 3 m towards the far end of the fiber, containing a few-centimeters-long hot spot. The heated region is clearly identified in the measurements. Reproduced with permission from [42], SPIE, 2014.

Figure 5.
Measured normalized Brillouin gain as a function of correlation peak position and frequency offset between the pump and signal waves [43]. A magnified view of a 130-mm-long section of fiber is presented. The section is located at the far end of a 17.5-km-long fiber under test. A 14-mm-wide hot-spot is clearly identified in the measurements. Reproduced with permission from [43], Andrey Denisov, EPFL, 2015.

Figure 6.
(a) Measured normalized Brillouin gain as a function of correlation peak position and frequency offset between the pump and signal waves [19]. The fiber under test was 8.8 km long. Measurements were performed with a spatial resolution of 2 cm. All 440,000 resolution points were successfully addressed. The Brillouin pump and signal waves were jointly phase-modulated by a repeating perfect Golomb code of 211 symbols period and a bit duration of 200 ps. The pump wave was also amplitude-modulated by a sequence of 9785 pulses with symbol duration of 20 ns. (b) Magnified view of the Brillouin gain map in a 2-m-long section located towards the output end of the fiber under test [19]. A 7-cm-long heated region is identified by the Brillouin analysis. Reproduced with permission from [19], IEEE, 2016

Figure 7.
Double pulse-pair, phase-coded B-OCDA map of Brillouin gain as a function of position along a fiber under test and the frequency offset between the pump and signal waves [23]. A 43-m-long fiber was monitored with 2.7 cm resolution. All 1600 resolution points were addressed in only 11 scans of correlation peak positions [23]. Three 8-cm-wide heated regions are well identified in the measurements. Reproduced with permission from [23], Optical Society of America, 2016.

Figure 8.
(a) Measured normalized steady-state Brillouin gain as a function of correlation peak position and frequency offset between pump and signal waves in a phase-coded B-OCDA experiment over 360 mm of fiber [24]. A 4-cm-wide segment 160 mm from the input end was locally heated. (b) Measured normalized transient Brillouin gain of the same fiber as a function of correlation peak position and time [24]. The frequency offset was arbitrarily chosen as 2π × 10.733 GHz. Reproduced with permission from [24], Optical Society of America, 2016.

Figure 9.
Strain profiles across the upper surface of a composite model wing of an unmanned aerial vehicle subject to a static loading of 550 N. (a) Strain map extrapolated from high-resolution phase-coded B-OCDA traces [26]. (b) Predicted strain map obtained by numerical, structural analysis [26]. Reproduced with permission from [26], MDPI, 2017.

Figure 10.
Phase-coded B-OCDA spectra along a silica micro-wire as a function of position for multiple frequency ranges [30]: (a) 5.5–5.7 GHz, (b) 8.5–9.0 GHz, (c) 9.5–10.0 GHz, (d) 10.0–10.5 GHz, (e) 10.5–11.0 GHz, and (f) 11.0–11.5 GHz. Position 0 cm is the center of the tapered fiber waist [30]. Reproduced with permission from [30], Optical Society of America, 2018.

Figure 11.
Amplified spontaneous emission (ASE)-based B-OCDA. (a) Map of normalized Brillouin gain as a function of correlation peak position and frequency offset between pump and signal waves. Red dots indicate the estimated local Brillouin frequency shifts in each measurement location. (b) Top view image of the fiber under test alongside a scale bar (in cm). Three local hot-spots are introduced through the attachment of the fiber to heated aluminum bars. The red trace shows the measured local Brillouin frequency shifts (same as panel (a)) as a function of position on the same scale. The left and central hot-spots, with widths of 3 mm and 2 mm, respectively, are properly identified in the measurements.

Figure 12.
ASE B-OCDA map of Brillouin gain as a function of frequency offset between pump and signal waves and correlation peak position [33]. Measurements were performed over a 20-mm-long chalcogenide glass waveguide with a spatial resolution of 800 µm [33]. Reproduced with permission from [33], American Institute of Physics, 2018.

© 2018 by the authors. Licensee MDPI, Basel, Switzerland. This article is an open access article distributed under the terms and conditions of the Creative Commons Attribution (CC BY) license (http://creativecommons.org/licenses/by/4.0/).
Share and Cite
MDPI and ACS Style
Zadok, A.; Preter, E.; London, Y. Phase-Coded and Noise-Based Brillouin Optical Correlation-Domain Analysis. Appl. Sci. 2018, 8, 1482. https://doi.org/10.3390/app8091482
AMA Style
Zadok A, Preter E, London Y. Phase-Coded and Noise-Based Brillouin Optical Correlation-Domain Analysis. Applied Sciences. 2018; 8(9):1482. https://doi.org/10.3390/app8091482
Chicago/Turabian StyleZadok, Avi, Eyal Preter, and Yosef London. 2018. "Phase-Coded and Noise-Based Brillouin Optical Correlation-Domain Analysis" Applied Sciences 8, no. 9: 1482. https://doi.org/10.3390/app8091482
Note that from the first issue of 2016, this journal uses article numbers instead of page numbers. See further details here.