Article

Electrochemical-QCMD Control over S-Layer (SbpA) Recrystallization with Fe2+ as Specific Ion for Self-Assembly Induction

Department of Nanobiotechnology, Institute for Biophysics, University of Natural Resources and Life Sciences Vienna (BOKU), Muthgasse 11, A-1190 Vienna, Austria
*
Authors to whom correspondence should be addressed.
These authors contributed equally to this work.
Appl. Sci. 2018, 8(9), 1460; https://doi.org/10.3390/app8091460
Submission received: 30 July 2018 / Revised: 21 August 2018 / Accepted: 22 August 2018 / Published: 25 August 2018
(This article belongs to the Special Issue Self-Assembly Peptide Nanostructures)

Abstract

:
The critical role of divalent ions (M²+) in the self-assembly of SbpA S-layer proteins (from Lysinibacillus sphaericus CCM 2177) into crystalline structures has been reported in several studies. Hence, ions such as magnesium, barium, nickel and, most commonly, calcium (Ca²+) have proven to trigger both protein-protein and protein-substrate interactions involved in the two-stage non-classical pathway recrystallization followed by SbpA units. As a result, two dimensional, crystalline nanometric sheets in a highly ordered tetrameric state (p4) can be formed on top of different surfaces. The use of iron in its ferrous state (Fe2+) as self-assembly inducing candidate has been omitted so far due to its instability under aerobic conditions, tending to natural oxidation to the ferric (Fe3+) state. In this work, the potentiality of assembling fully functional S-layers from iron (II) salts (FeCl2 and FeSO4) is described for the first time. A combination of chemical (oxidation retardants) and electrical (−1 V potential) factors has been applied to effectively act against such an oxidizing trend. Formation of the respective crystalline films has been followed by means of Electrochemical Quartz Crystal Microbalance with Dissipation (EQCM-D) measurements and complementary Atomic Force Microscopy (AFM) topography studies, which prove the presence of squared lattice symmetry at the end of the recrystallization process. Both techniques, together with additional electrochemical tests performed over the ion permeability of both types of S-layer coatings formed, show the influence of the counterion chosen (chloride vs. sulphate) in the final packing and performance of the S-layer. The presence of an underlying Secondary Cell Wall Polymer (SCWP) as in the natural case contributes to pair both systems, due to the high lateral motility freedom provided by this biopolymer to SbpA units in comparison to uncoated substrates.

Graphical Abstract

1. Introduction

Bacterial surface layers (S-layers) represent the outermost cell envelope component in archaea and many bacteria, being the simplest biological membranes which have developed during evolution [1,2,3]. S-layers are composed of (glyco)proteins which self-arrange in nanometric repeating unit cells (of varying lattice symmetries) with sizes of 3 to 30 nm, thicknesses of 5 to 10 nm (up to 70 nm in archaea) and pore sizes of 2 to 8 nm. One of the most fascinating features of many S-layer proteins is that they can be extracted from the bacterial cell wall, subsequently purified and still maintain the ability of forming recrystallization products with identical lattice properties as on the native bacterial cell [4]. These unique self-assembly properties have been employed to functionalize very diverse supports with such monomolecular crystalline lattices [5,6]. Furthermore, the introduction of either chemical groups or biologically active moieties via genetic engineering (fusion proteins) opened new biotechnological and biomedical applications [1].
Divalent ions have been described in several studies as a key factor in S-layer formation process, not only during the self-assembly of protein subunits but also for incorporating those S-layer monomers onto the hosting surface [7]. In most of them, CaCl2 has been by far the most widely used compound to trigger S-layer assembly [8]. Alternatively, some authors reported on the use of other salts like BaCl2 and MgCl2 for the particular case of recrystallizing SbpA proteins [9,10] or also Nomellini et al. [11] who broadened the ion list to SrCl2, MnCl2, NiCl2, AlCl3, CuCl2, CdCl2, ZnCl2, CoCl2, NaCl, KCl, LiCl and FeCl3 for their recrystallization studies on Caulobacter crescentus paracrystalline S-layer, with rather diverse results. Interestingly, none of these studies considered the use of iron in its ferrous state (Fe2+) even though its electrochemical similarities with Ca2+ are known, as well as their comparable ionic radii. A proper justification could be that, despite the large abundance of iron in nature, such ferrous state is unstable under aerobic conditions and oxidizes into the ferric (Fe3+) state which, in turn, aggregates into insoluble hydroxides. Therefore, combination of S-layers with iron was uniquely investigated in the field of biosorption and mineralization of heavy metals on biomass [12,13], or defined in terms of iron acquisition by binding and transferring heme [14,15]. Indeed, the redox potential of the Fe2+/Fe3+ pair (+0.77 V) makes iron extremely versatile when incorporated into proteins as a catalytic centre or as an electron carrier, acquiring an important role for many biological processes. From a mere ‘paleo-geo-chemical’ view, it can also be assumed that iron might have played an important role in S-layer self-assembly in an early (anaerobic) stage of biological evolution [1]. Indeed, the redox state of iron on earth is correlated with the emergence and availability of oxygen. In the earliest days of life on earth iron was most often found in the water-soluble Fe2+ state as a result of an O2-free environment. After the oxygenation events caused by cyanobacterial photosynthesis atmospheric oxygen increased, thus limiting iron existence to solely the Fe3+ state [16]. This might have forced bacteria to find alternative ways in order to activate the S-layer self-assembly, since this complete coverage resulted crucial for their development and perpetuation.
In this work, we have investigated for the first time the potentiality of two different iron (II) salts (FeCl2 and FeSO4) for the recrystallization of the well-known S-layer protein SbpA from Lysinibacillus sphaericus CCM2177 [17,18,19]. SbpA follows a non-classical two-step recrystallization (first adsorption, second assembly) to reassemble into arrays with square (p4) lattice symmetry and a lattice spacing of a = b = 13.1 nm [7,20,21]. The reduced oxidation of Fe2+ could be achieved by two different approaches: a merely chemical one (based on oxidation-retarding DTT, bulk pH control, and degassing) and its combination with electrochemical tools (which enable controlling the bulk potential). The latter was performed by means of Electrochemical Quartz Crystal Microbalance with Dissipation (EQCMD), which allows not only an on demand external control of the electrical settings inside the chamber but also the real-time monitoring of the film formation. The use of ‘simple’ QCMD measurements, in the absence of electrochemistry, has been proven in the past to be very useful to follow the assembly and structural transition towards recrystallization of SbpA protein films in standard (CaCl2) conditions [22]. First attempts on combining QCMD and electrochemistry in the field of S-layers regarded the manipulation of metal surfaces to generate varying charging states on the substrate to trigger formation of different protein-protein and protein-surface bonds [23] and in this way already highlighted the suitability of the combined technique. Together with the recent development of new and more sophisticated sensors EQCMD can become a powerful tool for monitoring simultaneous electrical and optical properties [24,25].
In this particular study, the potential value inside the reaction chamber could be fixed along the entire process (injection/adsorption + recrystallization/rinse) to –1 V –iron (II) formation conditions-, in order to prevent side interactions. QCMD data allowed monitoring changes in ∆f and ∆D parameters which relate to variations in the deposited mass (in the order of a few ng/cm²) and elasticity of the assembling layer. The resulting topography and crystallinity of the SbpA S-layer at the end of the process was determined by Atomic Force Microscopy (AFM), a extensively used technique for investigating the interactions and assembly dynamics of proteins on solid supports [5]. Complementarily, studies about both the electrical stability of the structure-trapped Fe²+ and the ion permeability of the film were performed. While the former relates to the overall vulnerability, the latter describes the packing degree of the protein film and its influence on its insulating capability when acting as peripheral membrane.
Results show a successful assembly of homogeneous SbpA S-layers under the aforementioned conditions and in the presence of both iron (II) salts. Nevertheless, the choice of the counterion (either chloride of sulphate) turns critical for the resulting structure and its final activity, something to undoubtedly take into account for further technological applications.

2. Materials and Methods

2.1. Production of wtSbpA S-Layer Protein Solutions

B. sphaericus CCM 2177 was grown in continuous culture as described in a previous study [17]. After downstream processing cell wall fragments were obtained and used as starting point for the production of a monomeric wtSbpA protein solution [1]. The protein was extracted with 5M guanidine hydrochloride (GHCL, Gerbu Biotechnik GmbH, Heidelberg, Germany) and after a centrifugation step dialyzed (membrane Biomol cut-off: 12–16 kD; pore size 25A) against 3 L Milli-Q water containing 2 mM EDTA. The protein solution was adjusted to a final concentration of 1 mg/mL. To confirm the recrystallization properties onto solid surfaces the so obtained monomeric protein solution was controlled by means of AFM as described previously [5]. The protein solution was then stored at 4 °C for a maximum of 4 weeks.

2.2. Secondary Cell Wall Polymer (SCWP) Preparation

SCWP was prepared from peptidoglycan-containing sacculi as described elsewhere [17]. The SCWP was chemically modified by introducing thiol groups which allow binding to the gold surface of the QCMD wafers (QSX 301, Q-Sense, Biolin Scientific, Västra Frölunda, Sweden) following the procedure described in [6].

2.3. Recrystallization of S-Layer Proteins on Silicon wafers

As solid phase for the recrystallization studies silicon wafers (Si-Mat Silicon Materials e. K., Kaufering, Germany) were used. After cleaning with acetone, ethanol and Milli-Q water they were dried in a stream of nitrogen gas and incubated with wtSbpA at a concentration of 100 µg/mL diluted in the respective buffer systems. Routinely, the monomeric wtSbpA protein solution was diluted with 5 mM Tris buffer having 10 mM CaCl2 added at a pH of 9.0. In the text, wtSbpA will be simply referred as SbpA.
To investigate the role of iron for S-layer assembly CaCl2 in the recrystallization buffer was replaced by FeCl2 4 H2O (Sigma-Aldrich Handels Gmbh, Vienna, Austria) or FeSO4·7H2O (Fluka-Honeywell, VWR International GmbH, Vienna, Austria). To confirm the importance of the reduced ferrous state, ferric iron in the form of FeCl3 (Fluka-Honeywell, VWR International GmbH, Vienna, Austria) was used as blank. The iron salts were applied in different concentrations (1–10 mM) and diluted in 0.1 M Hepes (=N–(2-Hydroxyethyl) piperazine-2-ethanesulfonic Acid; Gerbu Biotechnik GmbH, Heidelberg, Germany) as recrystallization buffer. The influence of the pH was investigated (range between 6.0 and 8.15) as well as the importance of having the buffers degassed or not and whether 1,4-Dithiothreitol (DTT; Roche Austria GmbH, Vienna, Austria) supports S-layer recrystallization. All buffers were prepared with ultrapure Milli-Q water, immediately before the recrystallization experiments.
The silicon wafers were immersed into the S-layer protein solution and incubation was allowed to take place for 60, 120 or 210 min at RT or overnight at 4 °C. The success of the recrystallization process was monitored by AFM and evaluated by the visibility of the crystalline square lattice structure, typical for SbpA. For the assembly under electrochemical control, wafers were glued to QCMD chips and the recrystallization process proceeded as explained below (see Section 2.5).

2.4. Atomic Force Microscopy

Atomic force microscopy (AFM) was performed with a Multimode AFM (Bruker AXS, Santa Barbara, CA, USA) equipped with a Nanoscope-V controller and an E-scanner with a scan range up to 12 µm. In this study silicon-nitride probes (MSNL-10, Bruker, Camarillo, CA, USA) with a nominal spring constant of 0.2 N/m were used. The actual spring constants were determined by the thermal tuning method [26,27]. Samples were investigated in aqueous 0.1 M NaCl solution, in contact mode by applying low loading force (<1 nN) to avoid sample damaging and under a scan rate of 1–4 Hz.

2.5. Quartz Crystal Microbalance with Dissipation (QCM-D) Monitoring

QCM-D experiments were performed in a Q-Sense E4 instrument (Q-Sense, Biolin Scientific, Västra Frölunda, Sweden) with the use of a QEM 401 electrochemistry module, externally controlled by means of a ChI660 C Potentiostat (CH Instruments Inc., Austin, TX, USA). Prior to their use in the experiments, gold coated quartz sensors (QSX 301, Q-Sense, Biolin Scientific) were sonicated in 2% (w/w) SDS solution for 20 min and thoroughly rinsed with ultrapure water and ethanol. The crystals were dried in a stream of nitrogen, subsequently treated with UV/Ozone (BioForce Nanosciences, Ames, IA, USA) for 30 min and incubated for 1 h in a 1 mM solution of octanethiol in ethanol to ensure their hydrophobicity. Afterwards, the octanethiol-coated sensors were sonicated in ethanol and finally mounted into the QCM-D chamber. Experiments were performed at 25 °C. Real time variations of Frequency (∆f) and dissipation (∆D) parameters were observed at several overtones (n = 3, 5, 7...,13) throughout the experiments. Injection of SbpA protein (50 µg/mL), all washing steps as well as the addition of the different buffers were performed by means of a peristaltic Pump (Ismatec, Cole-Parmer GmbH, Wertheim, Germany) operating at a flow rate of 0.3 mL/min. Conditions for the electrochemical running protocols (i-t Amperometry, Cyclic Voltammetry) and the corresponding applied values were defined by means of the CH660C software (version 14.08, CH Instruments, Inc., Austin, TX, USA).

2.6. Measurement of the Contact Angle

The crystalline state of the protein layer was also investigated by determining the contact angle of S-layer coated silicon wafers. S-layer solution was applied at a concentration of 100 µg/mL in the distinct crystallization buffers. After recrystallization took place, the substrates were washed with crystallization buffer and Milli-Q water. Subsequently, the wafers were dried in a stream of nitrogen gas followed by a drying step in air at RT for 120 min. Contact angle values were determined with a Kruess EasyDrop instrument (Kruess, Hamburg, Germany) using 8 µL Milli-Q water droplets.

3. Results and Discussion

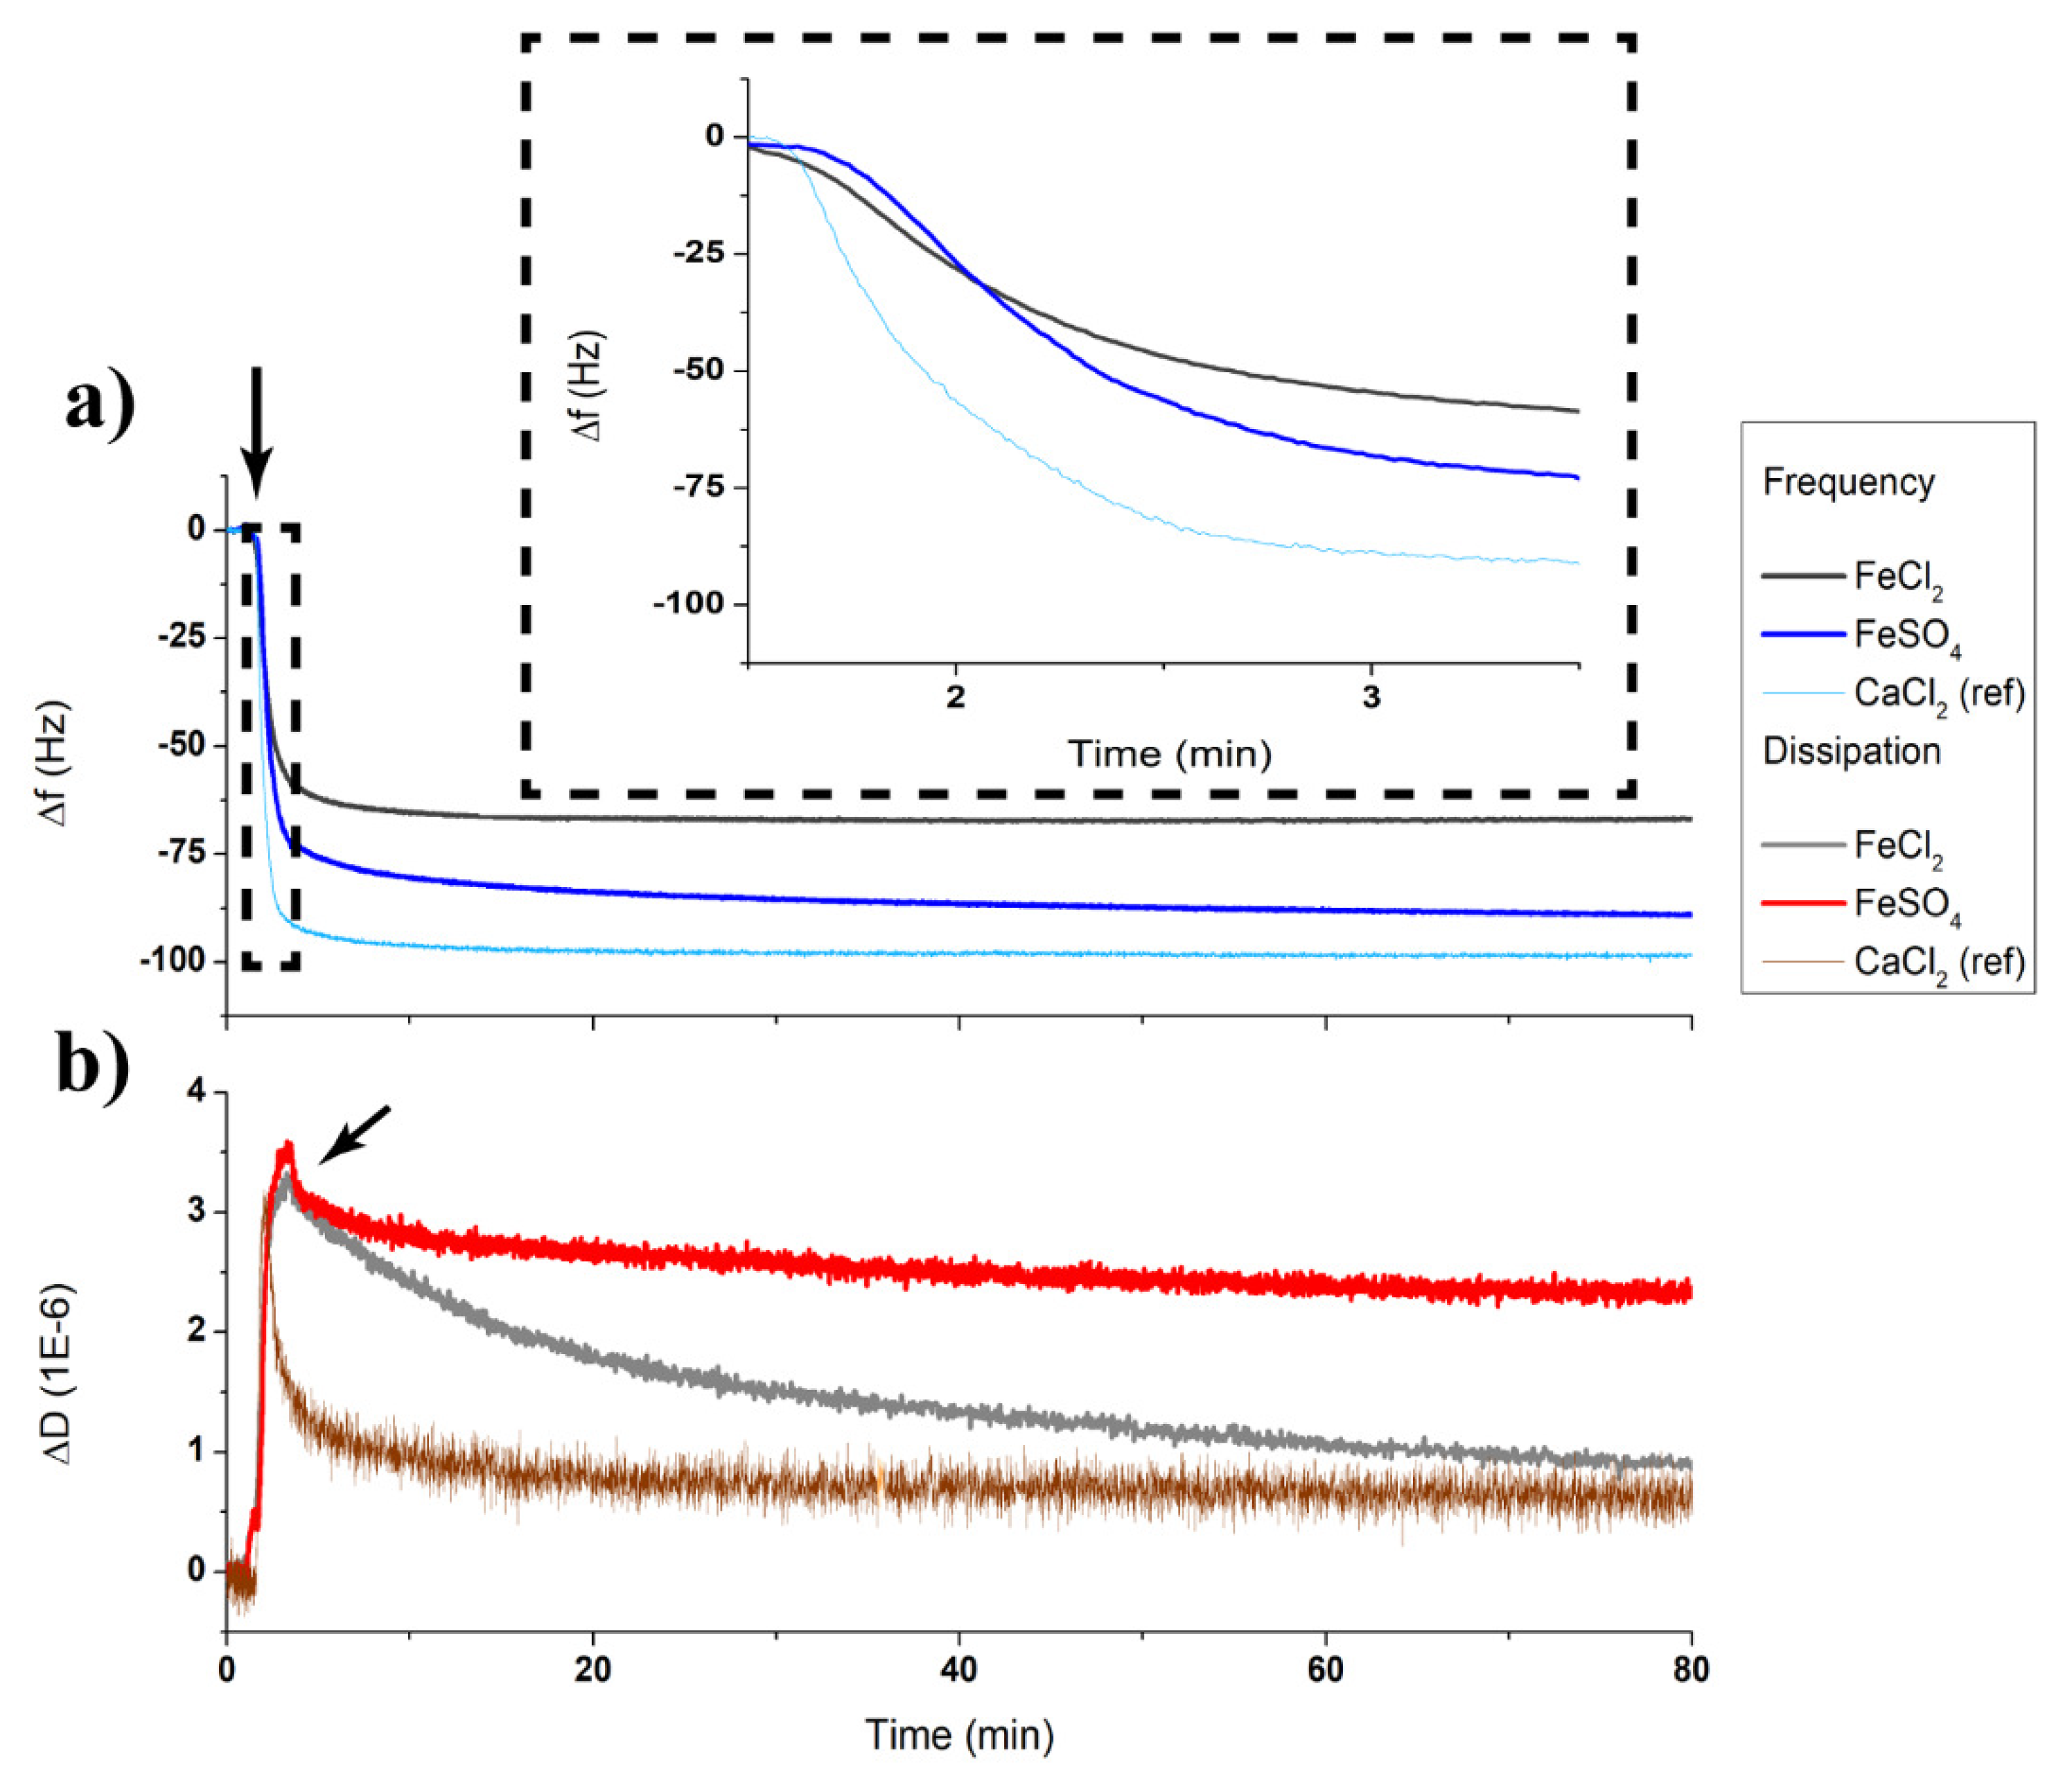
3.1. Sbpa Recrystallization in Fe (II): Chemical Control

In order to test the potentiality to induce S-layer formation in the presence of Fe²+ ions, the recrystallization process was firstly attempted without any type of applied electrical (potential) control. Instead, recrystallization was performed by incorporating chemical additives (DTT) which act as retardant of the naturally occurring oxidation process. The usual CaCl2 was then replaced by FeCl2 or FeSO4 and the routinely used Tris buffer was also replaced by HEPES, since formation of precipitates was observed with the former. Furthermore, HEPES had already been reported in literature to prevent auto-oxidation and to stabilize Fe2+ for a considerable length of time [28].
A first experimental issue to overcome corresponded to the finding of optimal conditions which would allow iron salts to form a transparent, aggregate-free solution in HEPES buffer, as summarized in Figure 1.
The solubility of iron strongly depends on pH making iron less available at neutral-to-basic pH than at acidic ones. As can be observed, HEPES solutions of both Fe (II) salts show increasing turbidity at pH values above 6.4, together with the formation of large green coloured aggregates (Figure 1a) which sediment and attach onto the underlying silicon wafers. The appearance of such aggregates compromises the formation of a homogeneous film both because of the blocking of large substrate areas and, in addition, the partial conversion of Fe2+ into Fe3+ ions taking place, a critical limiting factor for the reaction intended. Therefore, employment of a final pH of 6.3 was approved, attending to the optimal performance of this solution and still being in the range of parameters to maintain SbpA protein intact and active ( >> pI).
The stability of the prepared Fe²+/HEPES solution upon oxidation was also tested over a time range of 18 hours, maximum recrystallization time required under some particular conditions [22]. Figure 1b shows the evolution in both colouring and turbidity of an iron sulphate sample (n° 2–5) in comparison to a positive control (n°1), featured by its strong yellow colour, where DTT was not incorporated nor the buffer degassed prior to the iron salt addition. Even though the chemistry-driven control turns certainly effective for quite some time, where DTT gets oxidized instead of iron (II), subsequent oxidation remains uncontrolled, leading to Fe³+ formation over time anyway. Thus, such an oxidation kinetics led to the election of hydrophobic substrates for the follow-up of the process, so SbpA recrystallization could take place more rapidly (<3 h, when performed with CaCl2) and while the amount of Fe (III) in the recrystallization buffer stayed as low as possible. In such conditions, SbpA was recrystallized from both FeCl2 and FeSO4 containing solutions over 210 min and the resulting topographies analysed by Atomic Force Microscopy, as shown in Figure 1c,d. In these micrographs, the crystal lattice can be visually determined although in a rather faint manner. However, Fourier domain analysis over each image (see insets) confirms the existence of a repeated pattern, which appears somehow more distorted than for the Ca (II) case (see Appendix A, Figure A1).
In addition, contact angle measurements were employed to validate the influence of the redox state of iron on the formation of a crystalline S-layer (Appendix A, Figure A2) as wettability properties are known to be changed by the presence/lack of a crystalline SbpA structure. A contact angle of 92° (typical for crystalline SbpA [7]) was measured for the S-layer formed from FeSO4, thus confirming the crystallinity of the formed layer (strengthening the AFM observations). Employment of iron in its Fe3+ state induced the formation of a hydrophilic surface, caused by protein binding in an amorphous state lacking the highly ordered crystalline structure.
Hence, the capability of forming a SbpA S-layer from Fe (II)-containing salts could be proven, despite the lack of real control over the oxidation state.

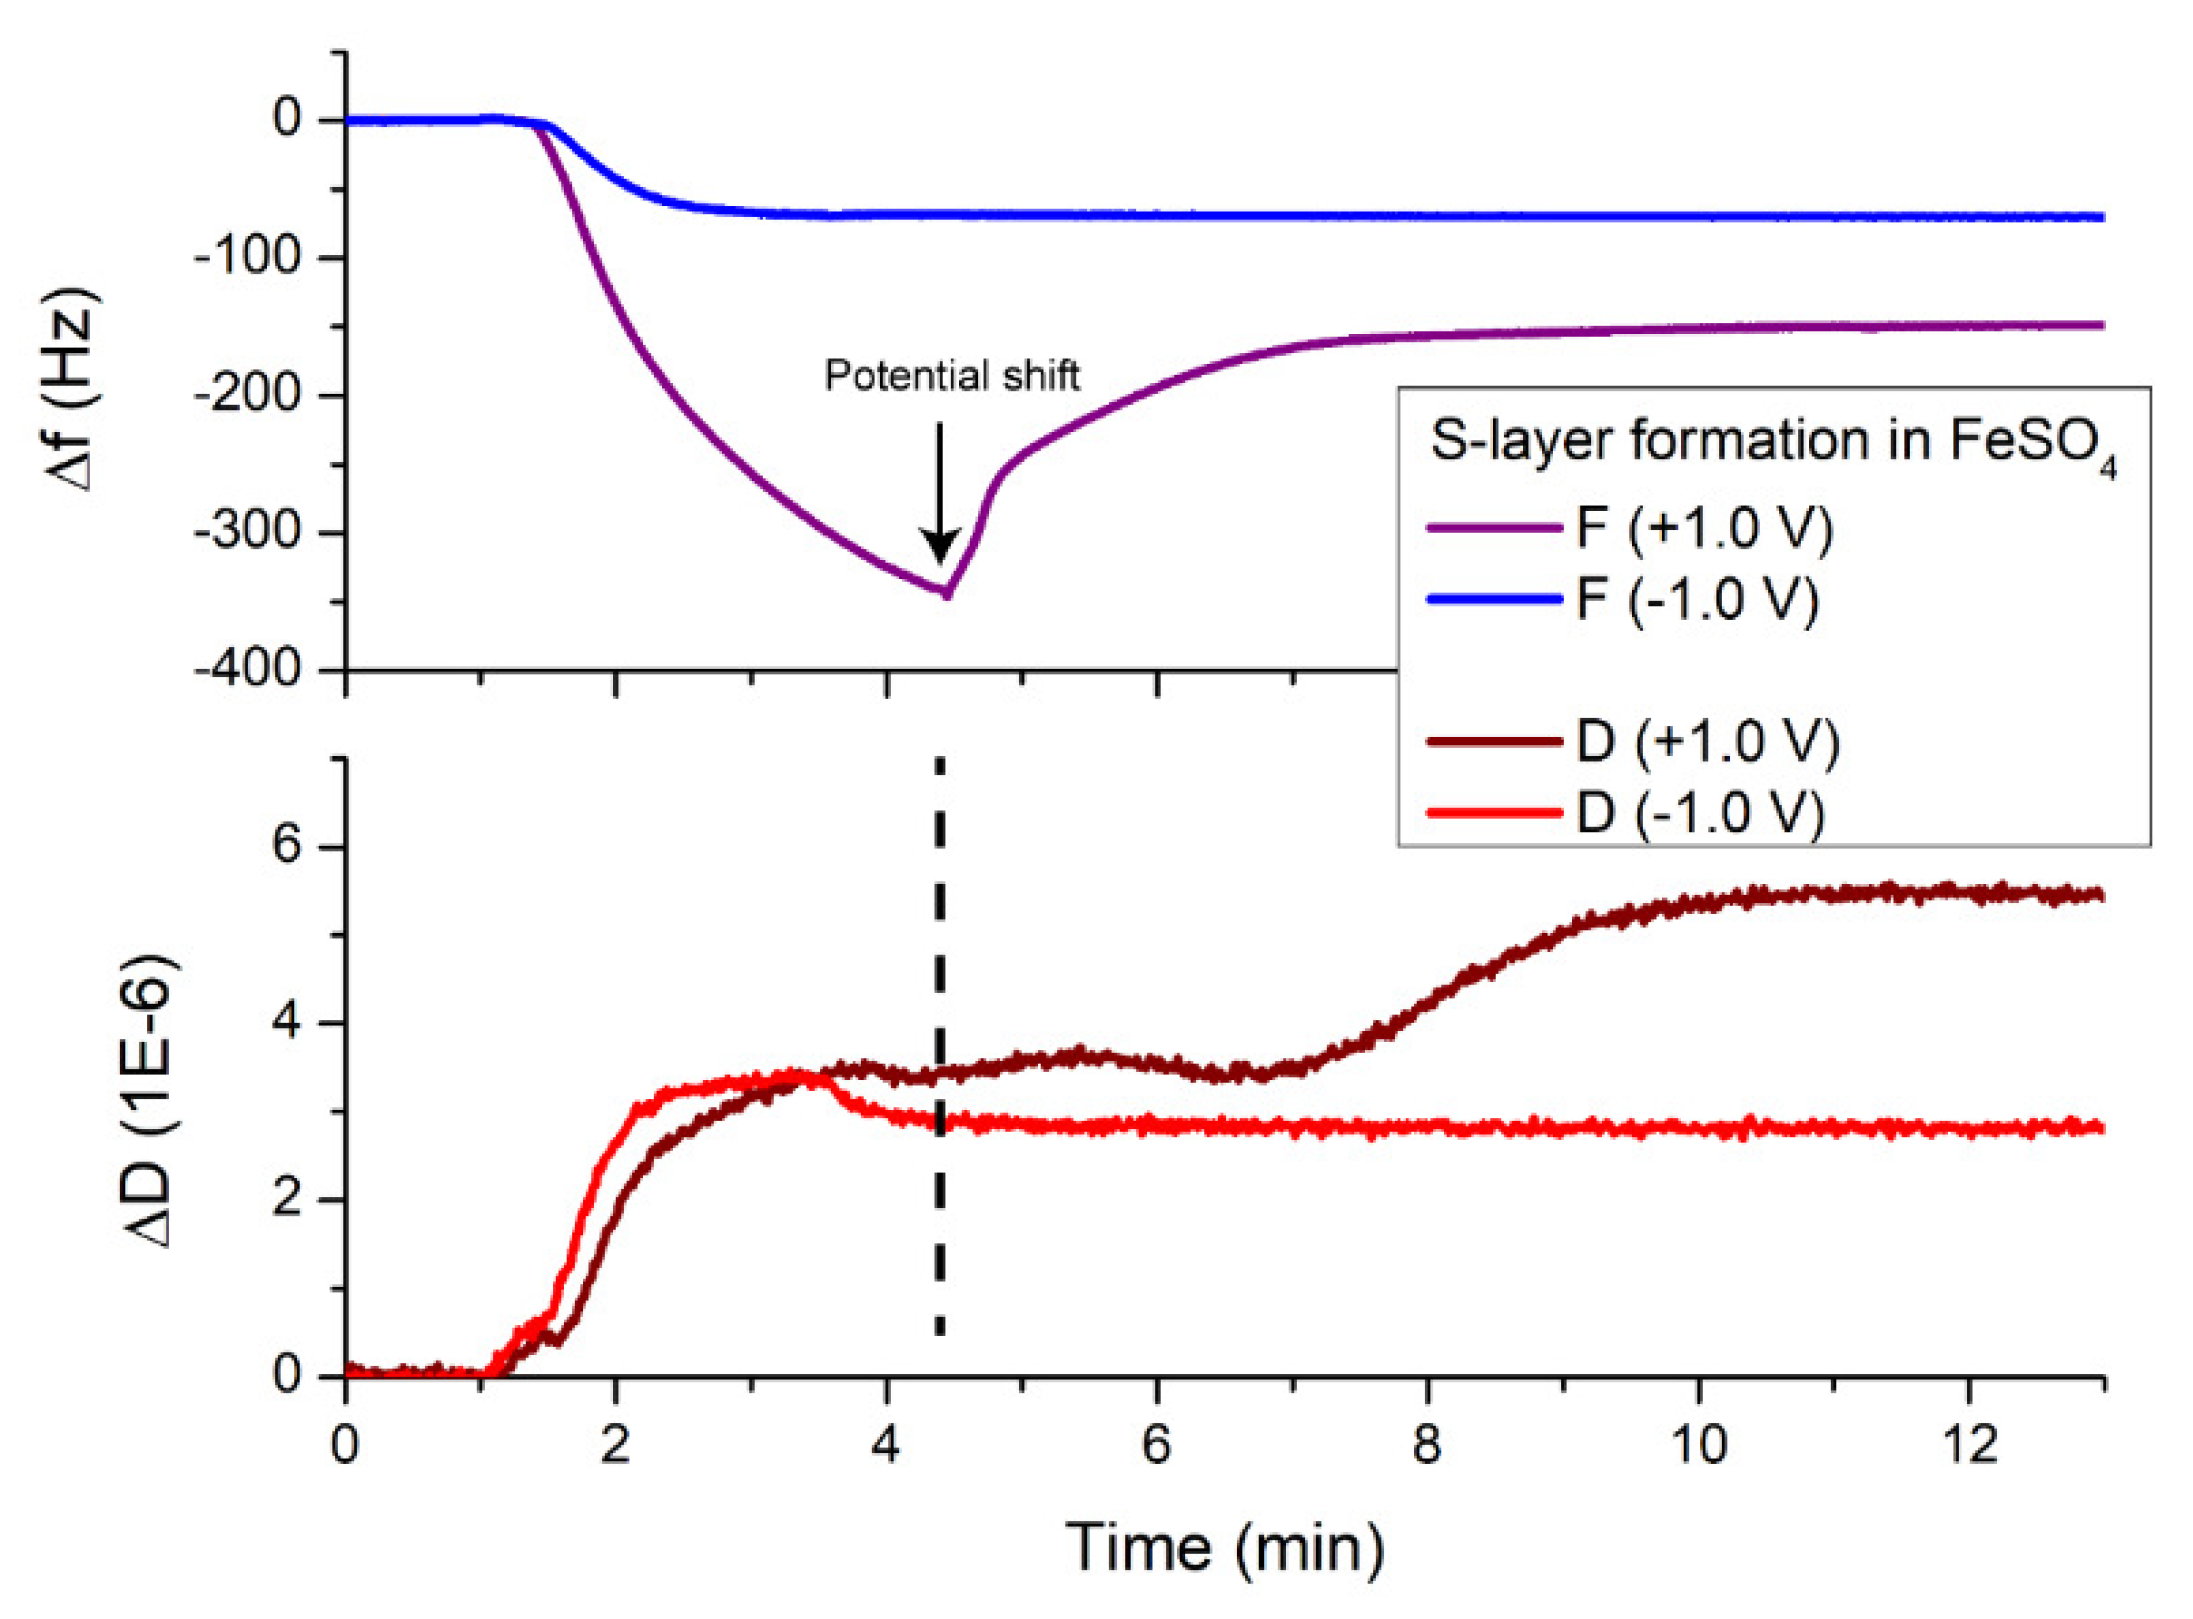
3.2. Sbpa Recrystallization in Fe (II): Electrical Control and Real Time Monitoring

The electrochemical version of a QCMD chamber (EQCM) allows establishing a three-electrode system. Obviously, such a feature turned highly relevant when attempting to exert full control over the oxidation state of the Fe²+ containing solutions. The use of this module, in addition to its capability of setting an external voltage throughout the SbpA adsorption and recrystallization steps (–1 V in our case, as established by the Fe²+/Fe³+ redox potential), permits the real-time monitoring of the process in terms of kinetics and changes in both adsorbed mass and film viscoelasticity, as defined by variations in frequency (∆f) and dissipation (∆D) factors, respectively. As aforementioned, this second approach of QCMD technique has extensively been employed by our group to follow-up the formation of S-layers with CaCl2 on top of very diverse substrates [6,22] and, therefore, it constitutes a perfect tool for comparative purposes between Ca²+ and Fe²+ derived films. The resulting ∆f versus time and ∆D versus time plots of the SbpA recrystallization on hydrophobic-gold, under a controlled potential, are depicted in Figure 2.
The formation of the SbpA layer is observed to exhibit certain differences between the Ca²+ film acting as reference and those generated from Fe (II) salts, even though the general trend seems to be rather similar. Overall, the most relevant outcomes would be the following: (1) the total mass adsorbed differs depending on the divalent ion employed and also the counterion (Cl vs. SO42–) turns crucial for the final performance recorded, (2) dissipation values show in all the three cases the transition state-indicating peak towards a more rigid film, which connects to first crystal formation and (3) the kinetics of the process are slowed down in the presence of Fe²+ salts.
Attending to the combined analysis of time-dependent frequency and dissipation factors (see also Appendix A, Figure A3), films produced from FeCl2 yielded lower adsorption in wet mass at the end of the binding process, when compared to their SO4²-containing partners (ca. 70%). On the contrary, the former system underwent a surprisingly faster structural arrangement, as derived from the continuous post-peak drop in dissipation down to 1 × 10⁶ at the end of the incubation time, which resembles the properties of Ca²+/SbpA layers. In turn, the transition peak for S-layers derived from FeSO4 led to a much smoother drop in viscosity as incubation went by. At this point and since the employed divalent ion is the same, the role played by either chloride or sulphate is undoubtedly of main relevance. Thus, ferrous sulphate (FeSO4) is known to easily dissociate in the individual molecules and to form water-complexes when dissolved in water. This means that strong water coordination takes place, which might explain the larger mass deposition sensed by QCMD. Furthermore, SO4²appears as one of the most kosmotropic ions, attending to the Hofmeister series [29,30], which reinforces the high hydration theory. Contrarily and following same classification criteria, chloride falls into a more chaotropic level of Hofmeister series, meaning that its affinity for water molecules is low enough and, therefore, the wet mass should decrease. Chaotropic ions are also defined by their protein-destabilizing capabilities, a factor that might also induce an easier refolding of SbpA as required for crystal formation. This effect could be responsible for the quick structural re-arrangement taking place as first crystal formation is triggered (transition peak). The topographical features of both SbpA films obtained from Fe²+ ions were subsequently visualized by means of Atomic Force Microscopy at the end of the recrystallization stage (210 min), as shown in Figure 3.
Micrographs show a more defined crystal lattice than those in Figure 1, a fact which confirms the need and success of an additional control to the mere chemical one attempted above. A clear indication of the enhanced SbpA recrystallization is observed at the Fourier spectra on the top corner insets. Hence, both films clearly show repeated square units which appear more ordered (mono-directional) and flattened in the case of FeCl2 (Figure 3b), while the S-layer built in the presence of FeSO4 shows the usual halo-like Fourier spectrum indicative of multi-oriented lattices (Figure 3a). The latter, together with the higher roughness observed at the topography image correlates pretty well to observations from QCMD results. Therefore, the uneven appearance of the patches could be explained by a higher hydration degree.

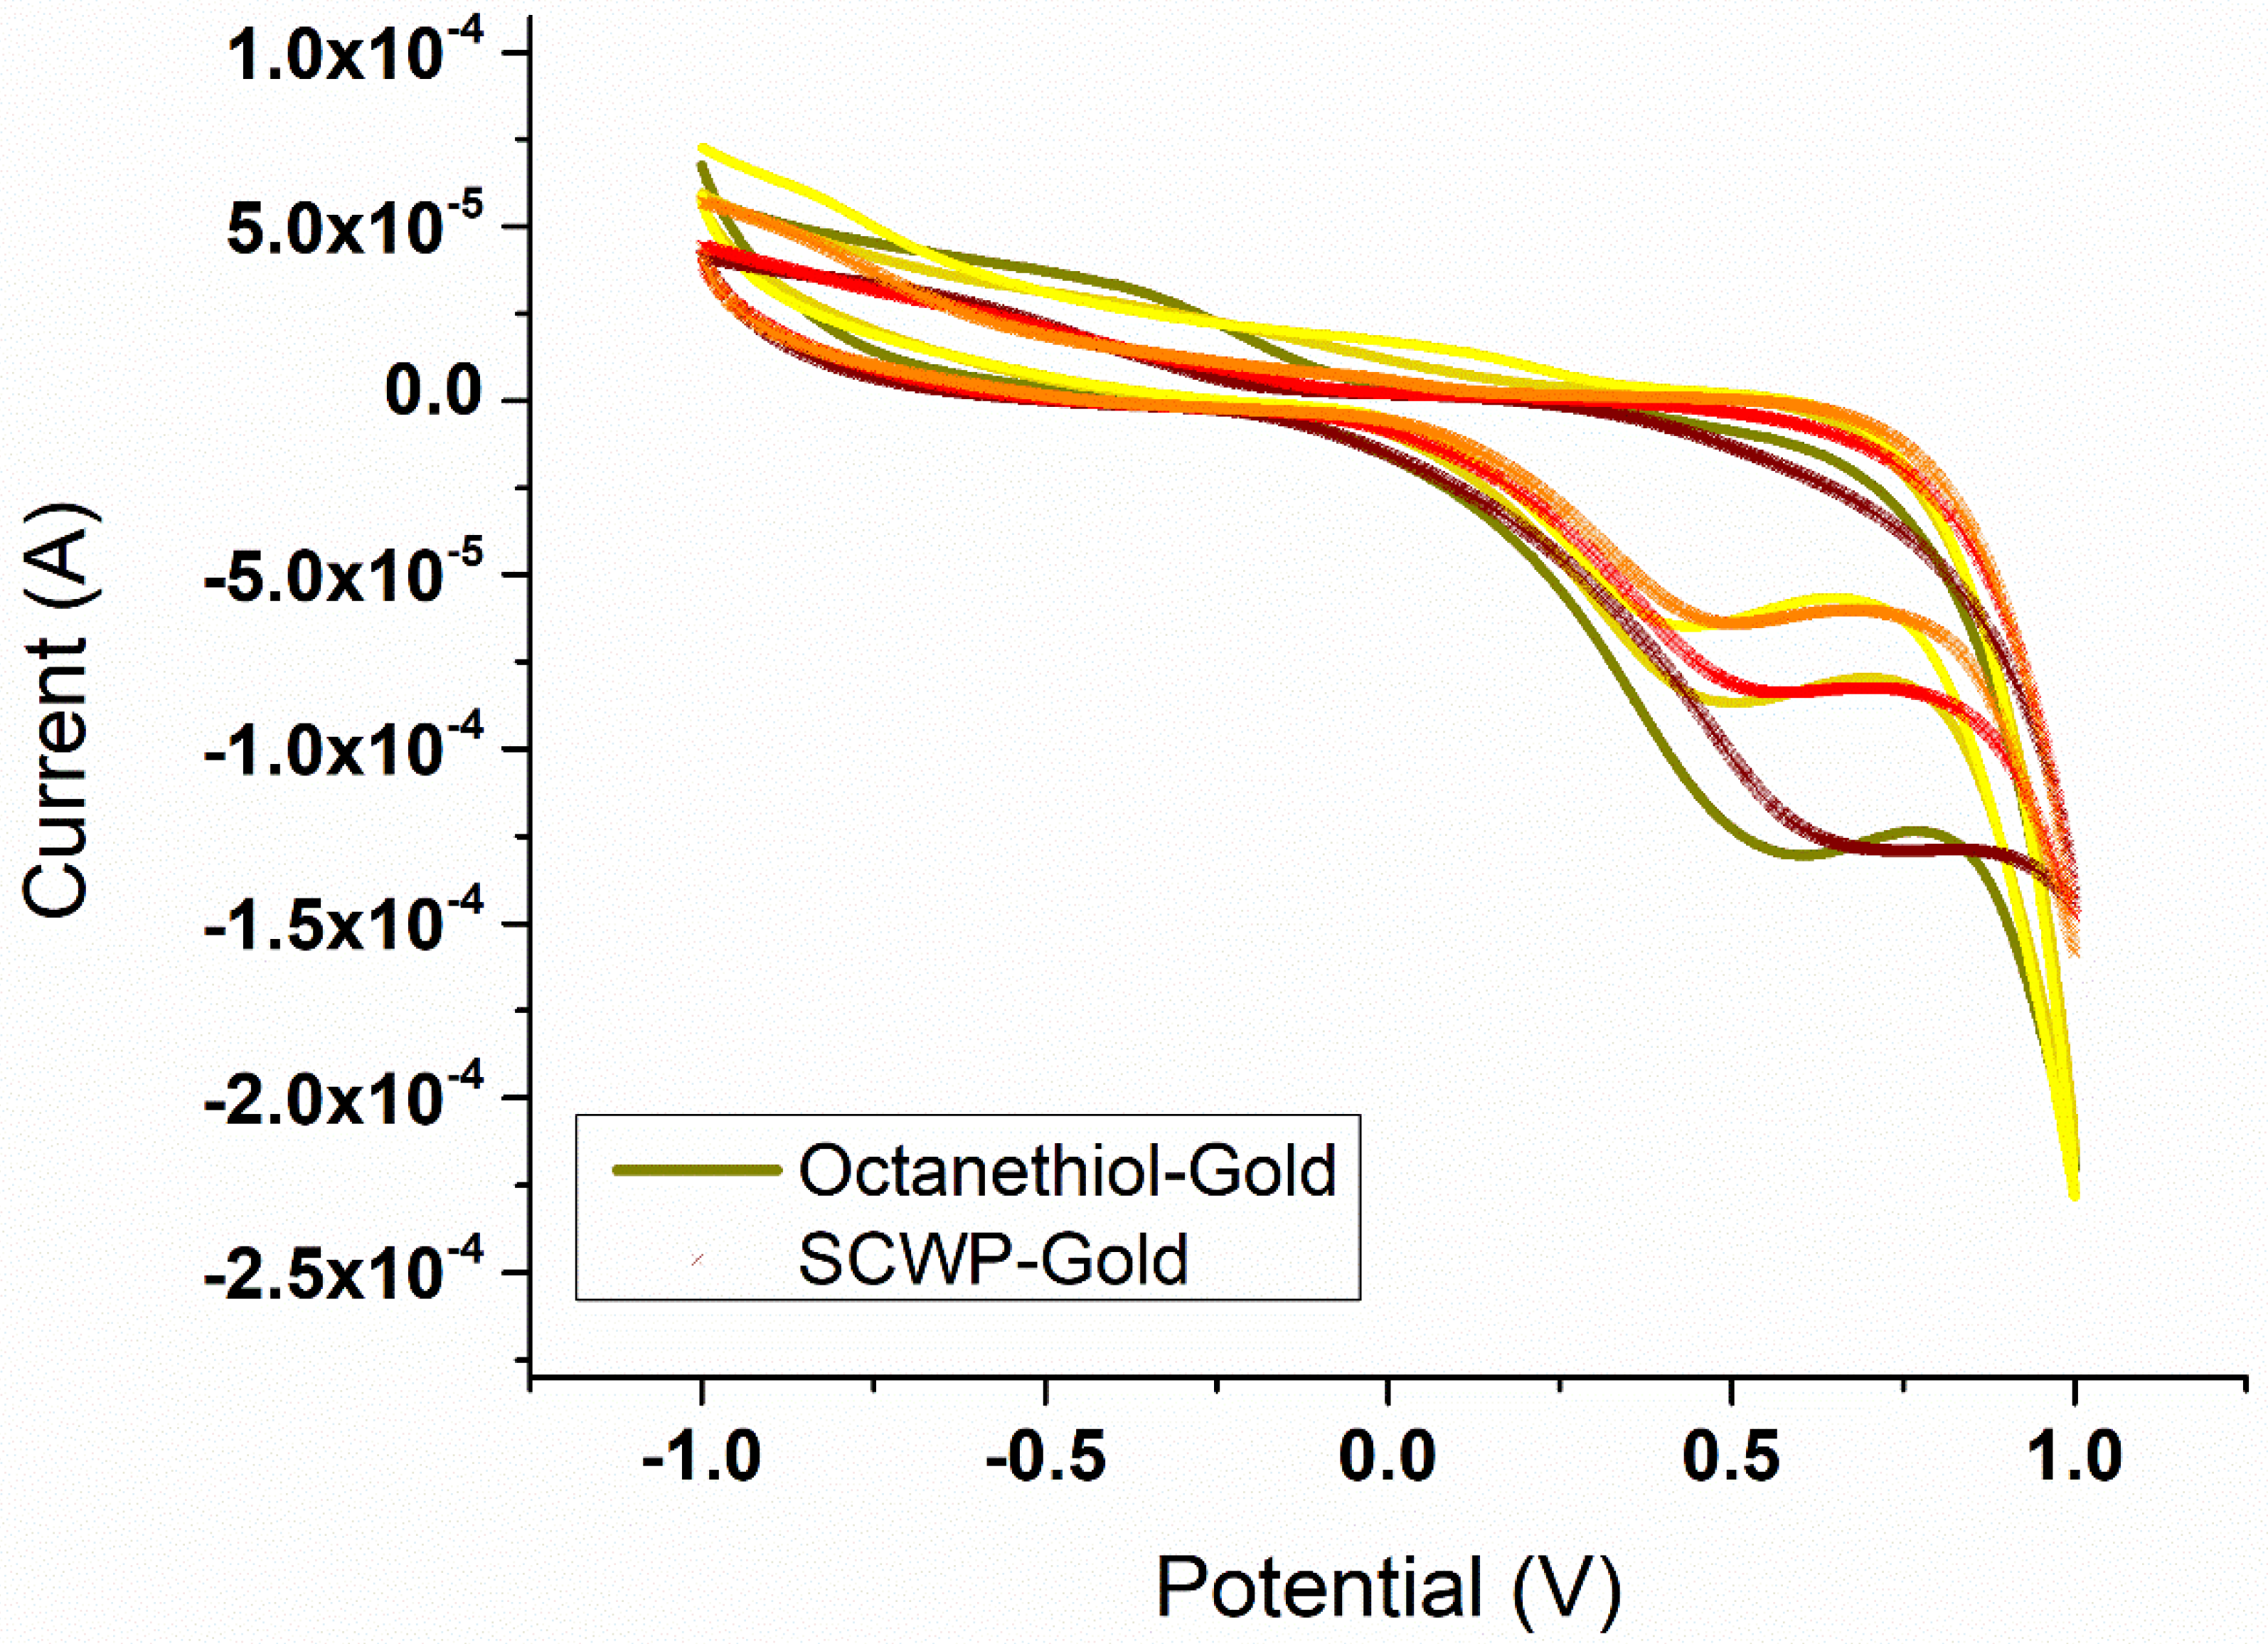
3.3. Electrical Stability of the Fe²+-Containing S-Layer

Film resistance of HEPES-cleaned SbpA films was subsequently tested upon sudden shifts in the environmental potential from –1 to +1 V (covering the Fe²+/Fe³+ redox pair). By application of such pulses the resistance of the inner, structure-trapped, Fe (II) ions to externally-induced oxidation could be determined. This effect turned critical when test experiments under same conditions were performed during the protein adsorption step (Appendix A, Figure A4). The real-time response was monitored by EQCMD, as depicted in Figure 4.
Starting from 0 V (t = 0), each of the potential pulses applied lasted a minimum of 5 min. Response of the Fe²+ containing S-layer was compared to that from SbpA built from Ca²+, which acted as negative control. Interestingly, S-layer remained inert during the initial frame (ca. 2 min) upon application of an oxidizing potential, then a rather abrupt linear drop of the frequency values took place down to –90 Hz, until the potential shifted to iron reducing conditions (–1 V). At this point, an immediate increase of ∆f was triggered and frequency values reached a constant plateau of around −15 Hz. Reversibility of the process could be demonstrated by a second round of pulses. Although the explanation to such a response is not yet optimally defined, one could speculate with the possibility of inducing local Fe (II) to Fe (III) transformations in areas where the recrystallization did not reach a final stage and iron would thus be more accessible. By this effect, the layer might partially lose the high packing degree when Fe³+ occupies those positions. Therefore, water molecules might fill those vacancies, which would explain the increase in wet mass. As soon as reduction from Fe (III) (ferric) to a Fe (II) (ferrous) state is triggered, water is released and the starting situation is almost achieved. The permanent frequency change taking place might correspond to water that got trapped in the film structure along those cycles.

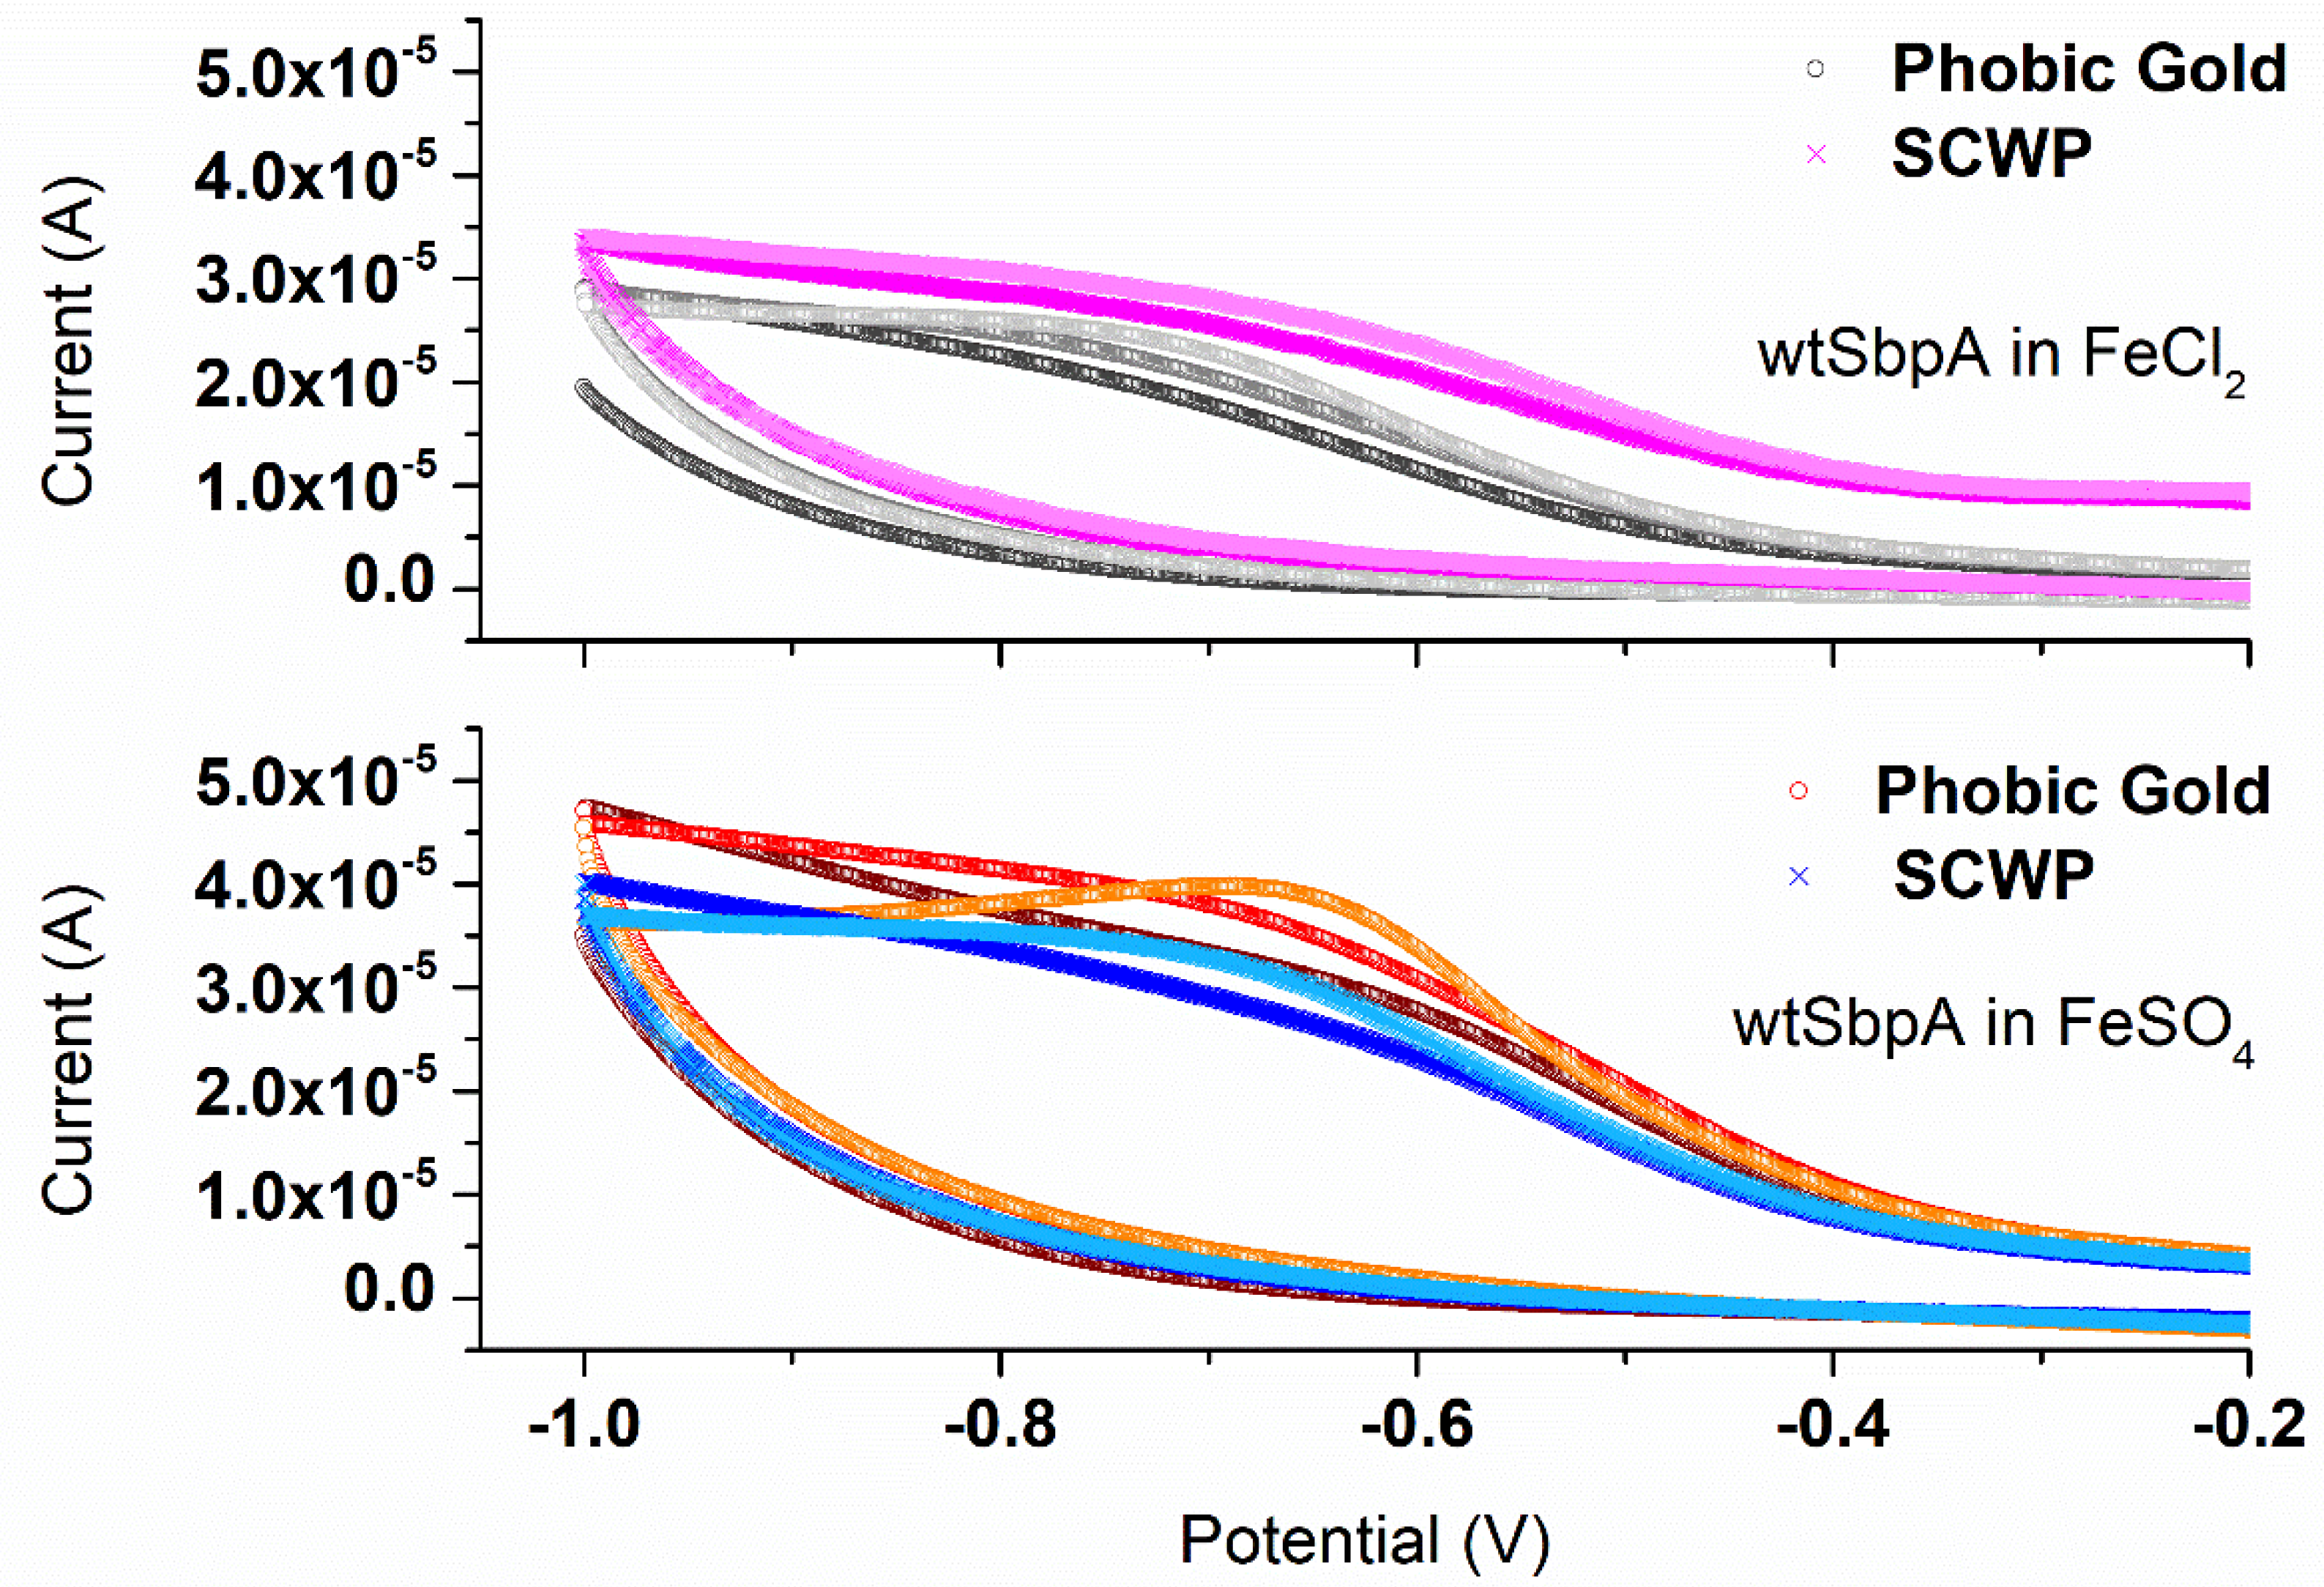
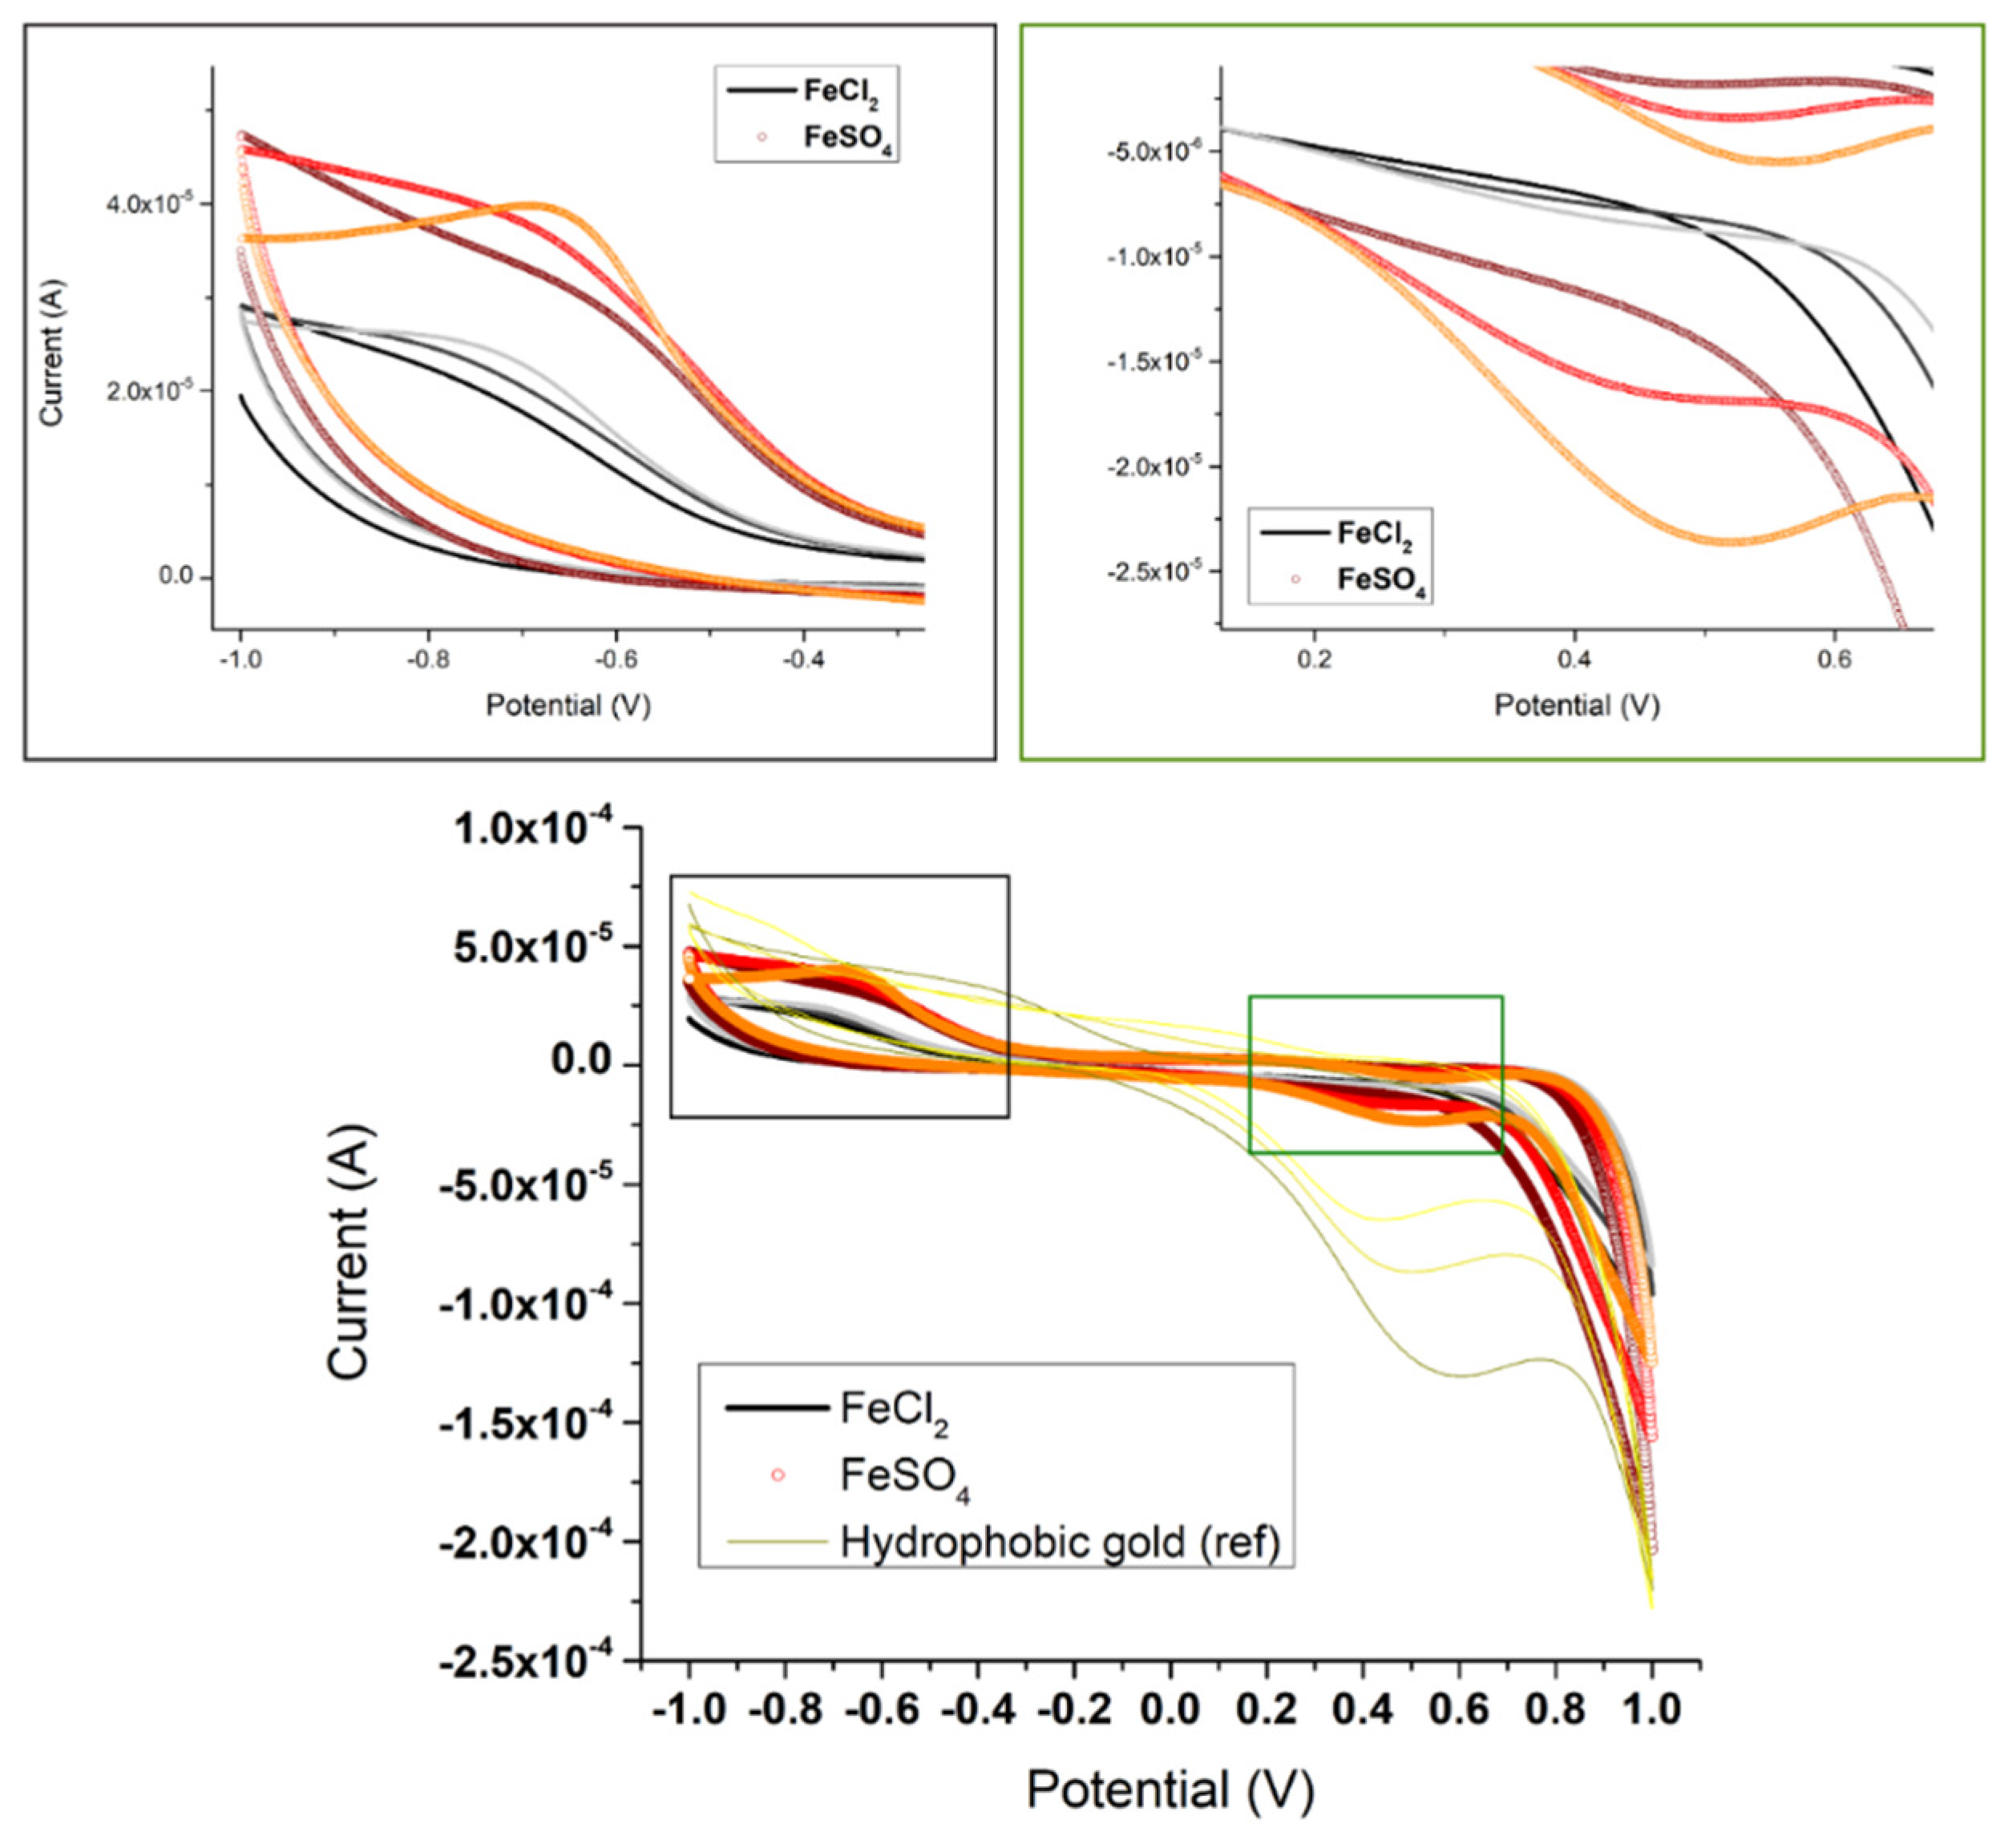
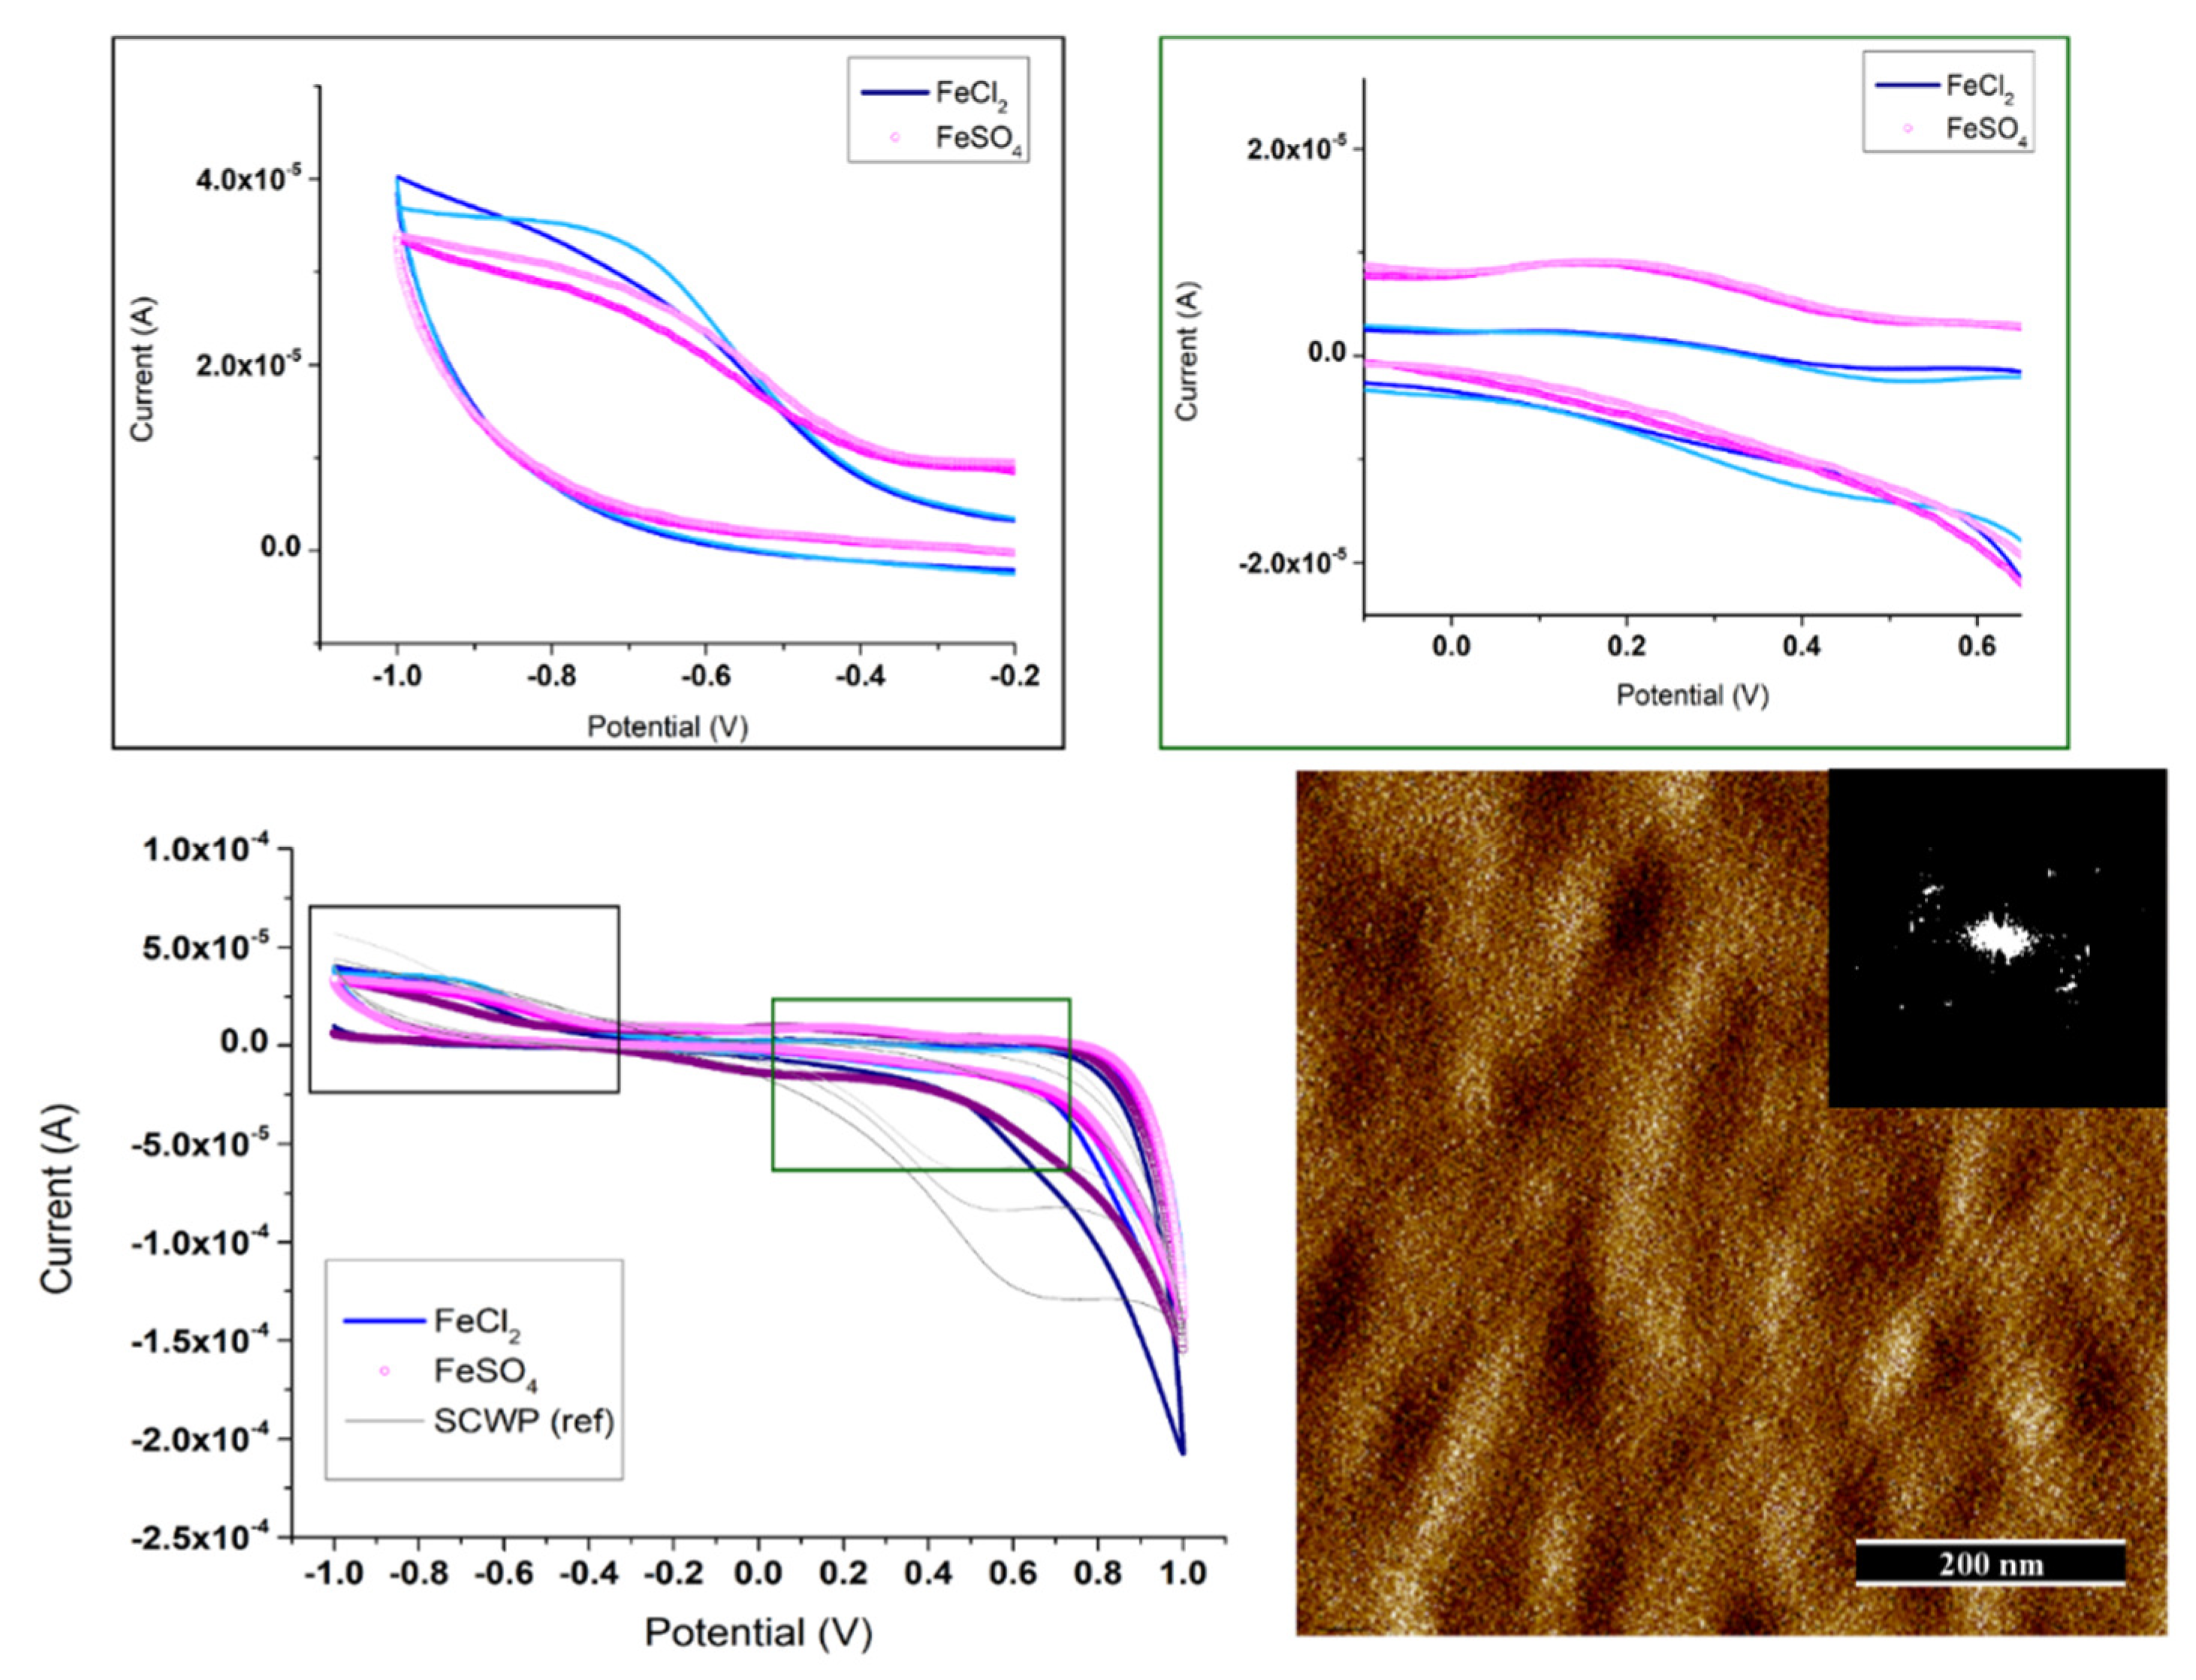
3.4. Determination of the S-Layer Ion Permeability by Cyclic Voltammetry

Cyclic Voltammetry (CV), the measurement of the running electrical current intensity as the potential varies cyclically between two extreme values, is an electrochemical tool of high usefulness whenever the packing of a layer has to be determined. In our particular case, this technique was envisaged to complement the observations from the previous section. Indeed, more light might be shed on the different features of S-layers assembled from two types of iron salts, such as chloride or sulphate. Since S-layers act, by definition, as protective outermost membranes (in bacteria) and so does their technological application meant to be for, characterization of their ion permeability turns certainly relevant (among others). Figure 5 shows the respective Cyclic Voltammograms (three cycles each) recorded from both Fe²+-containing SbpA films, when sweeping the +1/–1 V range. The octanethiol-coated gold system represents the current intensity measured in the absence of a protective layer.
At first glimpse, the current intensity damping caused by the presence of any of the S-layers under study is detected straightforward. Such behaviour confirms the great isolating capability of these films in spite of their nanometric thickness. Obviously, the presence of multiple pores all over the structure (at the central position in between the four subunits forming the square) enables a higher transfer of sufficiently small ions than, for instance, a homogeneous polymer film [31,32]. A more detailed observation of the plots, as offered by the insets on top, allows a clear distinction between films built in the presence of different counterions. Hence, SbpA crystalline film assembled from FeCl2 attenuates much more effectively the passage of ions from the bulk (around a 50% lower current at the extreme potentials), compared to its sulphate-based homologous structure. Such a performance totally matches the QCMD/AFM results from Section 3.2, where the S-layer built in the presence FeSO4 already appeared as a more loosely packed film.
Since in their natural environment S-layers usually appear attached to an underlying secondary cell-wall polymer (SCWP) film, which contributes to their high stability (because of specific protein-carbohydrate interactions) and homogeneity, it was decided to employ such a biopolymer as hosting substrate for the recrystallization of SbpA with iron salts. The enhancement induced in the final structure by the presence of SCWP has already been reported by our group [22]. Following the abovementioned measuring protocol, the ion permeability of the prepared samples was studied by means of Cyclic Voltammetry and the obtained voltammograms (three cycles each) are depicted in Figure 6.
As main outcome, the presence of an underlying SCWP seems to pair the performance of both SbpA films in terms of ion permeability. The resulting attenuation of the current intensity shown by the iron (II) sulphate is obviously a contribution of not only a better packing of the S-layer (as shown by the topography micrograph and the derived Fourier spectra analysis) but also the presence of the polymer underneath. However, the insulation provided by this SCWP film is not sufficient to block the ion passage, as determined by its characteristic cyclic voltammogram (see Appendix A, Figure A5). Therefore, these results highlight how a better arrangement of the protein film might turn of higher relevance in its final permeability performance. In turn, for S-layers recrystallized in the presence of FeCl2 a supporting SCWP seems not to influence much their already demonstrated filtering activity, an indication of their better adaptability to various types of hosting substrates. Such a versatility and ease to handle could become a triggering factor for the employment of FeCl2-derived SbpA crystalline films in other technological applications.

4. Conclusions

This work describes for the first time the potentiality of assembling fully functional S-layers from iron (II) salts (FeCl2 and FeSO4). Such structures could only be achieved when exerting an external control over the naturally occurring oxidation of Fe²+ to Fe³+. In this regard, a combination of chemical (DTT, degassing) and electrical (fixed bulk potential) factors have been shown to most effectively act against such oxidizing trend. Formation of the respective crystalline films has been followed by means of both QCMD measurements, offering real time monitoring over the process of assembly and the ongoing structural transition and complementary Atomic Force Microscopy topography studies, which demonstrate the presence of squared lattice symmetry usually featuring SbpA films at the end of the process. Hence, FeCl2 has been shown to induce the formation of a very compact and smooth protein layer which resembles that produced in the presence of CaCl2. For FeSO4 salts, contrarily, the packing of the resulting crystal layer is clearly compromised by its water content, because of the kosmotropic counterion involved, which also impacts its final performance. Hence, cyclic voltammetry studies have proven these observations by testing the ion permeability of both types of S-layer coatings. The higher isolation shown by FeCl2-driven films in the –1 to +1 V range (up to a 50% more effective), could only be paired by sulphate-containing homologous samples when a supporting SCWP layer was placed underneath. This fact highlights the relevance of the homogeneous arrangement of the protein film on the final performance achieved. Then, new paths seem to open for the construction of crystalline S-layers in the presence of alternative divalent ions. Most important, it has to be remembered that S-layer morphogenesis might follow the theoretically simplest mechanism for a dynamic process of assembly of a closed container composed of monomolecular arrays of identical macromolecules. In addition, these results would confirm the paleo-geo-chemical hypothesis by which a simple protein membrane capable of dynamic growth in the presence of bivalent iron (Fe²+) would fulfil barrier and supporting functions in an early (anaerobic) stage of biological evolution.

Author Contributions

J.I. and A.B. conceived and designed the experiments; J.I. and A.B. performed the experiments; J.I. and A.B. analysed the data; D.P. contributed with image analysis tools; J.I. and A.B. wrote the paper; D.P., U.B.S. and J.L.T.H. proof-read the manuscript, contributed with the final discussions (data analysis) and complementary information.

Funding

This research was funded by AFOSR Agreement Award, grant number Nr. FA9550-15-1-0459.

Conflicts of Interest

The authors declare no conflict of interest. The founding sponsors had no role in the design of the study; in the collection, analyses, or interpretation of data; in the writing of the manuscript and in the decision to publish the results.

Appendix A

Figure A1. AFM height micrographs of SbpA films assembled in the presence of either CaCl2 (left) or FeCl3 (right), which act as positive or negative control images, respectively. Insets show the resulting Fourier spectra analysis from the respective images. Scale bars = 200 nm.
Applsci 08 01460 g0a1
Figure A2. Water contact angle measurements on SbpA films formed from Fe2+ (a) or Fe3+ (b). Note the wettability change of the film as cause by the structural differences between both samples.
Applsci 08 01460 g0a2
Figure A3. Df plot (∆D vs. ∆f) showing the full binding process (adsorption + structural re-arrangement) of SbpA onto octanethiol-coated gold chips in the presence of different salts: Calcium chloride (crosses), Iron (II) sulfate (open circles), and Iron (II) chloride (filled circles). The color scale indicates the time elapsed after protein injection (in 10 min color steps).
Applsci 08 01460 g0a3
Figure A4. Real-time monitoring of SbpA adsorption onto hydrophobic gold, under two different potential values (−1 vs. +1 V) being applied. The black arrow indicates the moment at which the oxidative value (+1 V) the potential is changed to reducing values (−1 V), which completely influences the protein-substrate interaction.
Applsci 08 01460 g0a4
Figure A5. Cyclic Voltammetry measurements (−1 to +1 V, 3x cycles) comparing the ion permeability of octanethiol-gold (yellow to green, solid line) and SCWP-gold reference systems (orange to maroon, crosses). Experiments were performed in 0.1M HEPES.
Applsci 08 01460 g0a5
Figure A6. Comparison between the Cyclic Voltammograms (negative range) obtained from SbpA films built in the presence of either FeCl2 (top) or FeSO4 (bottom), when the underlying substrate was changed from octanethiol-coated to a SCWP-coated gold chip.
Applsci 08 01460 g0a6

References

  1. Sleytr, U.B.; Schuster, B.; Egelseer, E.M.; Pum, D. S-layers: Principles and applications. FEMS Microbiol. Rev. 2014, 38, 823–864. [Google Scholar] [CrossRef] [PubMed]
  2. Pavkov-Keller, T.; Howorka, S.; Keller, W. Chapter 3 – the structure of Bacterial S-layer proteins. Prog. Mol. Biol. Transl. Sci. 2011, 103, 73–130. [Google Scholar] [CrossRef] [PubMed]
  3. Albers, S.-V.; Meyer, B.H. The archaeal cell envelope. Nat. Rev. Microbiol. 2011, 9, 414–426. [Google Scholar] [CrossRef] [PubMed]
  4. Teixeira, L.M.; Strickland, A.; Mark, S.S.; Bergkvist, M.; Sierra-Sastre, Y.; Batt, C.A. Entropically driven self-assembly of lysinibacillus sphaericus S-layer proteins analysed under various environmental conditions. Macromol. Biosci. 2010, 10, 147–155. [Google Scholar] [CrossRef] [PubMed]
  5. Eleta-Lopez, A.; Moreno-Flores, S.; Pum, D.; Sleytr, U.B.; Toca-Herrera, J.L. Surface dependence of protein nanocrystal formation. Small 2010, 6, 396–403. [Google Scholar] [CrossRef] [PubMed]
  6. Iturri, J.; Moreno-Cencerrado, A.; Toca-Herrera, J.L. Polyelectrolyte brushes as supportive substrate for bacterial s-layer recrystallization: Polymer charge and chain extension factors. Colloids Surf. A 2017, 526, 56–63. [Google Scholar] [CrossRef]
  7. Breitwieser, A.; Iturri, J.; Toca-Herrera, J.L.; Sleytr, U.B.; Pum, D. In vitro characterization of the two-stage non-classical reassembly pathway of s-layers. Int. J. Mol. Sci. 2017, 18. [Google Scholar] [CrossRef] [PubMed]
  8. Baranova, E.; Fronzes, R.; Garcia-Pino, A.; Van Gerven, N.; Papapostolou, D.; Péhau-Arnaudet, G.; Pardon, E.; Steyaert, J.; Howorka, S.; Remaut, H. SbsB structure and lattice reconstruction unveil Ca2+ triggered S-layer assembly. Nature 2012, 487, 119–122. [Google Scholar] [CrossRef] [PubMed]
  9. Rad, B.; Haxton, T.K.; Shon, A.; Shin, S.-H.; Whitelam, S.; Ajo-Franklin, C.M. Ion-Specific control of the self-assembly dynamics of a nanostructured protein lattice. ACS Nano 2015, 9, 180–190. [Google Scholar] [CrossRef] [PubMed]
  10. Liu, J.; Falke, S.; Drobot, B.; Oberthuer, D.; Kikhney, A.; Guenther, T.; Fahmy, K.; Svergun, D.; Betzel, C.; Raff, J. Analysis of self-assembly of s-layer protein slp-B53 from lysinibacillus sphaericus. Eur. Biophys. J. 2017, 46, 77–79. [Google Scholar] [CrossRef] [PubMed]
  11. Nomellini, J.F.; Kupcu, S.; Sleytr, U.B.; Smit, J. Factors controlling in vitro recrystallization of the caulobacter crescentus paracrystalline S-layer. J. Bacteriol. 1997, 179, 6349–6354. [Google Scholar] [CrossRef] [PubMed]
  12. Kish, A.; Miot, J.; Lombard, C.; Guigner, J.-M.; Bernard, S.; Zirah, S.; Guyot, F. Preservation of archaeal surface layer structure during mineralization. Sci. Rep. 2016, 6, 26152. [Google Scholar] [CrossRef] [PubMed]
  13. Velasquez, L.; Dussan, J. Biosorption and bioaccumulation of heavy metals on dead and living biomass of bacillus sphaericus. J. Hazard. Mater. 2009, 167, 713–716. [Google Scholar] [CrossRef] [PubMed]
  14. Schneewind, O.; Missiakas, D.M. Protein secretion and surface display in gram-positive bacteria. Philos. Trans. R. Soc. B 2012, 367, 1123–1139. [Google Scholar] [CrossRef] [PubMed]
  15. Tarlovsky, Y.; Fabian, M.; Solomaha, E.; Honsa, E.; Olson, J.S.; Maresso, A.W. A bacillus anthracis S-layer homology protein that binds heme and mediates heme delivery to isdc. J. Bacteriol. 2010, 192, 3503–3511. [Google Scholar] [CrossRef] [PubMed]
  16. Ilbert, M.; Bonnefoy, V. Insight into the evolution of the iron oxidation pathways. Biochim. Biophys. Acta Biophys. 2013, 1827, 161–175. [Google Scholar] [CrossRef] [PubMed]
  17. Ilk, N.; Kosma, P.; Puchberger, M.; Egelseer, E.M.; Mayer, H.F.; Sleytr, U.B.; Sára, M. Structural and functional analyses of the secondary cell wall polymer of bacillus sphaericus CCM 2177 that serves as an S-layer-specific anchor. J. Bacteriol. 1999, 181, 7643–7646. [Google Scholar] [PubMed]
  18. Norville, J.E.; Kelly, D.F.; knight, T.F., Jr.; Belcher, A.M.; Walz, T. 7 Å projection map of the S-layer protein sbpA obtained with trehalose-embedded monolayer crystals. J. Struct. Biol. 2007, 160, 313–323. [Google Scholar] [CrossRef] [PubMed]
  19. Comolli, L.R.; Siegerist, C.E.; Shin, S.-H.; Bertozzi, C.; Regan, W.; Zettl, A.; De Yoreo, J. Conformational transitions at an s-layer growing boundary resolved by Cryo-TEM. Angew. Chem. 2013, 125, 4929–4932. [Google Scholar] [CrossRef]
  20. Chung, S.W.; Shin, S.-H.; Bertozzi, C.R.; De Yoreo, J.J. Self-catalyzed growth of S layers via an amorphous-to-crystalline transition limited by folding kinetics. Proc. Natl. Acad. Sci. USA 2010, 107, 16536–16541. [Google Scholar] [CrossRef] [PubMed] [Green Version]
  21. Shin, S.-H.; Chung, S.M.; Sanii, B.; Comolli, L.R.; Bertozzi, C.R.; De Yoreo, J.J. Direct observation of kinetic traps associated with structural transformations leading to multiple pathways of S-layer assembly. Proc. Natl. Acad. Sci. USA 2012, 109, 12968–12973. [Google Scholar] [CrossRef] [PubMed] [Green Version]
  22. Iturri, J.; Vianna, A.C.; Moreno-Cencerrado, A.; Pum, D.; Sleytr, U.B.; Toca-Herrera, J.L. Impact of surface wettability on S-layer recrystallization: A real-time characterization by QCM-D. Beilstein J. Nanotechnol. 2017, 8, 91–98. [Google Scholar] [CrossRef] [PubMed]
  23. Handrea, M.; Sahre, M.; Neubauer, A.; Sleytr, U.B.; Kautek, W. Electrochemistry of nano-scale bacterial surface protein layers on gold. Bioelectrochemistry 2003, 61, 1–8. [Google Scholar] [CrossRef]
  24. Bhalla, N.; Lee, D.; Sathish, S.; Shen, A.Q. Dual-mode refractive index and charge sensing to investigate complex surface chemistry on nanostructures. Nanoscale 2017, 9, 547–554. [Google Scholar] [CrossRef] [PubMed]
  25. Okuda, S.; Ono, T.; Kanai, Y.; Ikuta, T.; Shimatani, M.; Ogawa, S.; Maehashi, K.; Inoue, K.; Matsumoto, K. Graphene surface acoustic wave sensor for simultaneous detection of charge and mass. ACS Sens. 2018, 3, 200–204. [Google Scholar] [CrossRef] [PubMed]
  26. Butt, H.-J.; Jaschke, M. Calculation of thermal noise in atomic force microscopy. Nanotechnology 1995, 6, 1. [Google Scholar] [CrossRef]
  27. Hutter, J.L.; Bechhoefer, J. Calibration of atomic-force microscope tips. Rev. Sci. Instrum. 1993, 64, 1868–1873. [Google Scholar] [CrossRef]
  28. Tadolini, B. Iron autoxidation in mops and hepes buffers. Free Radic. Res.Commun. 1987, 4, 149–160. [Google Scholar] [CrossRef]
  29. Hofmeister, F. Zur lehre von der wirkung der salze. Arch. Exp. Pathol. Pharmakol. 1888, 24, 247–260. [Google Scholar] [CrossRef]
  30. Okur, H.I.; Hladilkova, J.; Rembert, K.B.; Cho, Y.; Heyda, J.; Dzubiella, J.; Cremer, P.S.; Jungwirth, P. Beyond the hofmeister series: Ion-specific effects on proteins and their biological functions. J. Phys. Chem. B 2017, 121, 1997–2014. [Google Scholar] [CrossRef] [PubMed]
  31. Cortez, M.L.; Lorenzo, A.; Marmisolle, W.A.; von Bilderling, C.; Maza, E.; Pietrasanta, L.; Battaglini, F.; Ceolin, M.; Azzaroni, O. Highly-organized stacked multilayers via layer-by-layer assembly of lipid-like surfactants and polyelectrolytes. Stratified supramolecular structures for (bio)electrochemical nanoarchitectonics. Soft Matter 2018, 14, 1939–1952. [Google Scholar] [CrossRef] [PubMed]
  32. Fenoy, G.E.; Giussi, J.M.; von Bilderling, C.; Maza, E.M.; Pietrasanta, L.I.; Knoll, W.; Marmisolle, W.A.; Azzaroni, O. Reversible modulation of the redox activity in conducting polymer nanofilms induced by hydrophobic collapse of a surface-grafted polyelectrolyte. J. Colloid Interface Sci. 2018, 518, 92–101. [Google Scholar] [CrossRef] [PubMed]
Figure 1. (a) S-layer recrystallization on hydrophobic silicon wafers in the presence of a 2 mM FeSO4·7H2O solution in degassed 0.1M HEPES buffer (+5mM DTT) at different pH values. (b) Time course (images 2–5) of Fe²+ auto-oxidation (2 mM FeSO4·7H2O/5 mM DTT in 0.1 M HEPES at pH 6.3). Pictures were taken after 30 min (2), 180 min (3), 420 min (4) and overnight (5). Sample 1 acts as positive control in the absence of DTT and without previous degassing (image taken after 30 min). (Right) AFM topography micrographs of SbpA recrystallized onto silicon wafers under degassed solutions of either FeSO4 (c) or FeCl2 (d). The crystalline character of the S-layer patches could further be confirmed through Fourier domain analysis (insets). The multiple first order spots reflect the highly disordered paving of the small crystalline domains. Their reciprocal spacing of ca. 13 nm corresponds to the lattice constant of the SbpA S-layer lattice with its square lattice symmetry. Scale bars = 200 nm.
Applsci 08 01460 g001
Figure 2. EQCMD measurements showing ∆f (a) and ∆D (b) time evolution for the recrystallization of SbpA protein in the presence of Fe²+ (chloride and sulphate) and of Ca²+ divalent ions. Injection was performed on octanethiol-modified gold chips and under controlled bulk potential (–1 V). The black arrow (above) indicates the exact protein injection time. The inset highlights the kinetics of the diffusion/adsorption process. The arrow below points out the appearance of the characteristic structure transition peak observed in ∆D.
Applsci 08 01460 g002
Figure 3. AFM micrograph of crystalline SbpA films onto silicon wafers under electrochemical control of the bulk potential (–1 V). The recrystallization buffer contained either FeSO4 (a) or FeCl2 (b). Recrystallization was checked after 210 min at RT. Insets show the resulting Fourier spectra from the respective images. Scale bars = 200 nm.
Applsci 08 01460 g003
Figure 4. Fe-SbpA crystalline film electrical responsiveness. EQCMD measurements allow monitoring the real time ∆f variation upon potential shifts between oxidation (+1 V) and reduction (−1 V) inducing conditions. A calcium-containing S-layer was used as negative control. 0.1 M HEPES was employed as running buffer.
Applsci 08 01460 g004
Figure 5. Cyclic Voltammetry measurements (−1 to +1 V) reflecting the ion permeability variation of the Fe²+ containing S-layers, attending to the corresponding counterion (Cl, black to grey solid lines versus SO42−, red to orange open circles). Experiments were performed in 0.1 M HEPES and the octanethiol-gold system (yellow to green solid lines) was employed as signal reference.
Applsci 08 01460 g005
Figure 6. Influence of an underlying SCWP film on the SbpA film packing and ion permeability measured by Cyclic Voltammetry measurements (−1 to +1 V) on Fe²+ –containing S-layers (FeCl2, dark to light blue solid lines versus FeSO4, purple to pink open circles). Experiments were performed in 0.1 M HEPES and the SCWP-coated gold system (grey) was employed as signal reference. Inset at the AFM topography micrograph shows the resulting Fourier spectra from the SbpA recrystallized film in the presence of FeSO4 salt.
Applsci 08 01460 g006

