Article

A Hybrid State Estimator Based on SCADA and PMU Measurements for Medium Voltage Distribution System

1
Key Laboratory of Smart Grid of Ministry of Education, Tianjin University, Tianjin 300072, China
2
Electric Power Research Institute of China Southern Power Grid, Guangzhou 510080, China
*
Author to whom correspondence should be addressed.
Appl. Sci. 2018, 8(9), 1527; https://doi.org/10.3390/app8091527
Submission received: 25 July 2018 / Revised: 12 August 2018 / Accepted: 17 August 2018 / Published: 1 September 2018
(This article belongs to the Special Issue Distribution Power Systems)

Abstract

:
With the increasing importance of renewable energy and flexible loads, the operation of the distribution system is becoming more stochastic and complex, and it is necessary to monitor the power system in real-time. Considering the gradual applications of intelligent electronic devices in the distribution systems, a hybrid state estimator based on supervisory control and data acquisition (SCADA) and phasor measurement unit (PMU) measurements is proposed in this paper, which consists of the improved robust estimation and linear state estimation. At the time of SCADA data acquisition, the improved robust estimation combining the SCADA measurements with PMU measurements is performed. To eliminate the effect of bad data, the internal student residual method is introduced, and the robust thresholds are adjusted adaptively. Then the linear state estimation is performed at the time of PMU data acquisition based on the results of the previous estimation time and the PMU measurements, which can quickly correct the robust estimation results and track the changes of the distribution system. Finally, the effectiveness and performance of the proposed method are verified in a modified IEEE 33-bus distribution system and a real distribution system in China.

1. Introduction

As more and more distributed generation (DG) and electric vehicles are connected to the distribution networks, the operational characteristics of the distribution system have been changed [1]. The bidirectional power flow occurs when the generation from distributed units exceeds the local load, and the voltage profile of the distribution network will be influenced strongly. Furthermore, the network configuration of the smart distribution network will be changing dynamically to achieve minimum power loss and voltage deviations. The real-time monitoring of the distribution network is becoming more and more challenging due to the increasing dynamics and changing behavior of actors in distribution systems [2]. The operating condition needs to be perceived first and a key technology obtained to achieve the reliable and accurate system condition awareness is known as the distribution system state estimation (DSSE). The DSSE is used to calculate the real-time measurement data according to some optimal estimation criterion, thus improving the accuracy of the data and obtaining a credible state for the whole system. The traditional real-time measurement data in the distribution system mainly comes from the supervisory control and data acquisition (SCADA) system, whose sampling period is 2–5 s. The three-phase voltage and power measurements are mainly configured at the high- and low-voltage sides of the distribution substation and some critical buses. Only the current amplitude measurements are configured at the sub section post (SSP), ring main unit (RMU), cable branch boxes, and column switches with no voltage and power measurements [3].
Different from the SCADA system, the sampling period of the phasor measurement units (PMUs) is 30–40 ms so that PMUs can capture the dynamic changes of the distribution system. PMUs can not only measure voltage phasors and current phasors accurately, but also provide synchronized real-time measurements (with reference to the global position system (GPS) time). In the transmission systems, the PMUs and wide area monitoring systems are applied to constantly monitor grid stability, detecting power faults, and supporting power system restoration. While in the distribution systems, with the development of an active distribution network and the effect of a bidirectional power flow, measurement instruments, such as PMUs, have become increasingly useful. The unbalanced and uncertain characteristics of the distribution network and the small angle differences between the bus voltage and line current phasors require higher phase measurement accuracy. As a result, PMUs are indispensable in distribution systems and one of the most known examples used in distribution systems is the micro-PMU [4]. Originally, the PMUs in the distribution system are mainly installed for the advanced applications, such as fault diagnosis and islanding detection, instead of the DSSE [5,6]. Considering the economics and infrastructure of the distribution system, it is not necessary to configure the PMU at each bus. At present, the research on the configuration scheme of PMUs in the distribution system is mainly focused on the complete observability of the network, improvement of the state estimation accuracy and the observability of the system power flow [2,4,7,8].
In the SCADA system, overhead lines, coaxial cables, and power line carriers are fundamental equipment to transmit measurement data, while in the PMUs, the wireless and wireline communication infrastructures, such as the Wi-Fi, Bluetooth, ZigBee, and fiber optics, are used to carry measurement information [9,10,11,12]. In Reference [13], a Cloud-based architectural solution is proposed to decouple the handling of PMU measurement data from the underlying physical devices. In DSSE, the measurement data is treated as uncertainty data, and the uncertainty of PMU measurement data is smaller than that of SCADA measurement data. The state estimation is carried out by using probability statistics or fuzzy analysis [14,15]. Furthermore, the interval linear state estimation model is proposed in References [16,17]. A Monte Carlo method is used in weighted least squares (WLS) to deal with the uncertainty of the measurement data [18,19,20,21,22,23,24,25,26].
Due to the increasing dynamics and changing behavior of actors in distribution systems, it is necessary to study how to effectively utilize the PMU measurement data with millisecond update rates in the DSSE. Some references utilize the high accuracy of the PMU measurements and the increased measurement redundancy to improve the performance of DSSE. In Reference [8], the numerical results show that a high level of accuracy in the state estimation task can be achieved with a much fewer number of PMUs than voltage magnitude meters. In References [18,19], the root node voltage is extended into state variables, which can effectively deal with the voltage phasor and voltage amplitude measurements to improve the estimation accuracy. In Reference [20], an estimator is added for processing the PMU measurements, treating the SCADA measurements as prior information to obtain the final estimation results. However, the state estimation period of the above methods is still second-level, which is the same as the sampling period of the SCADA, and a great quantity of PMU measurement data are ignored.
For the integration of measurements with different sampling periods in the distribution system, the researchers have proposed some different solutions. Reference [21] combines SCADA measurements with advanced metering infrastructure (AMI) measurements, whose sampling period ranges from 15 min to 24 h and converts DSSE into the power flow matching. Reference [22] uses SCADA, PMU, AMI, and load forecast (LF) data to perform DSSE. The AMI information is combined with SCADA, LF, and PMU to perform the static state estimation every 1 h. The unscented Kalman filter (UKF) is used to dynamically estimate the system states between polling periods, and to predict the estimated values every 15 min using SCADA, LF, and PMU measurements. Reference [23] proposes a hybrid method combined with nonlinear static state estimation, static state estimation, and linear dynamic state estimation. Nonlinear static state estimation is carried out every 1 min with AMI, remote terminal unit (RTU), and PMU measurements, while static state estimation is carried out every 10s with RTU and PMU measurements. Static state estimation and linear dynamic state estimation is carried out every 10s. There are some studies focusing on the data fusion of SCADA and PMU measurements in the transmission network such as References [24,25,26]. However, in the distribution system, there are not much research done on this problem.
In the distribution system, bad data may be caused by communication, transducer failures, or third parties tampering. When it comes to the problem of bad data elimination during iterations, a robust estimation model based on an exponential objective function is adopted in Reference [27]. A weighted least absolute value (WLAV) estimator, Schweppe-type Huber generalized M (SHGM) estimator, and improved WLS are also introduced to the DSSE. Reference [28] compares the performance of the conventional WLS, WLAV, and SHGM in DSSE. The distribution system solves the observability problem by adding the pseudo-measurements with large errors, but the WLAV and SHGM estimators treat the pseudo-measurements as bad data and there are not enough redundant measurements to eliminate these bad data. Therefore, the estimation performance of the WLAV and SHGM estimators in the distribution system is not ideal, while the WLS has a better fitness. However, the WLS estimator is only optimal for the measurement data obeying a Gaussian distribution, while the bad data does not obey a Gaussian distribution. Considering the above shortcoming, References [29,30] adopt the equivalent weight theory to improve the robust performance of the conventional WLS. In Reference [31], WLAV is converted into the WLS, and the denominator of the weight function is modified by an exponential function with the square of the normalized residuals to improve the robustness of the estimator. Furthermore, the residuals are normalized by the internal student residual method.
In the current distribution system, SCADA-based state estimators are not accurate enough to capture the system states because of the second-level refresh rates. Although PMU measurements provide millisecond update rates, the system observability cannot be guaranteed. Meanwhile, there may be bad data in SCADA and PMU measurements. To ensure the accuracy of DSSE and effectively track system state changes, a hybrid state estimator for a medium voltage distribution network is proposed based on SCADA and PMU measurements in this paper. At the time of SCADA data acquisition, the improved robust estimation combining the SCADA and PMU measurements is performed. During each iteration, the internal student residual method is used to unite the accuracy of the residuals at the same scale and the robust thresholds are adjusted by the normalized residuals adaptively to further eliminate the effect of bad data. Then according to the fast refresh frequency characteristics of the PMUs, the linear state estimation (LSE) is performed at the time of PMU data acquisition based on the results of the previous estimation time and the PMU measurements, which can quickly capture the changes of operation states in the distribution system.
The main contributions of this paper include:
(1)
To solve the problems of measurements with different refresh frequencies, a hybrid state estimator based on the improved state estimation and LSE is proposed, which makes full use of the PMU measurements to fast track distribution system states and guarantee the timeliness of real-time measurements.
(2)
To eliminate the influence of the bad data, the normalized residuals and adaptive thresholds are introduced to improve the conventional robust estimation method. Furthermore, the performance of the improved robust estimation method is compared with other robust estimation methods.
The following parts of this paper are organized as follows: Section 2 introduces the multi-sampling period data fusion in the distribution system. Section 3 introduces the proposed method and Section 4 shows the simulations, followed by conclusions in Section 5.

2. Multi-Sampling Period Data Fusion in the Distribution System

The traditional distribution system shown in Figure 1 uses the telemetry function of the SCADA to measure and transmit measurement data. The function mainly measures the three-phase current ( I r ϕ m ) and branch power ( P B i ϕ m , Q B i ϕ m ), the power injection ( P L i ϕ m , Q L i ϕ m ) and the three-phase voltage ( V r ϕ m ), while the PMUs mainly measure the voltage phasor ( V ˙ r ϕ m ) and some or all the connected branch current phasor ( I ˙ r ϕ m ). ϕ represents a phase in A, B or C.
As mentioned above, the SCADA data acquisition period is generally 2–5 s, and the PMU data acquisition period is generally 30–40 ms. If only using the SCADA measurement data, the state estimation interval time is at least 2 s, and the PMU measurement data during the SCADA data acquisition period will not participate in the state estimation, resulting in a waste of PMU data, which are more accurate and have a higher refresh rate. In this paper, the interval time of SCADA data acquisition is TSCADA, while the interval time of PMU data acquisition is TPMU. Besides, TSCADA is divided into n portions, and P is the PMU data acquisition time during the SCADA data acquisition period.
According to the data acquisition time, the state estimator switches between the robust estimator and the linear estimator to fast track states. As shown in Figure 2, at the SCADA data acquisition time, the SCADA and PMU measurements are combined in the robust estimation with pseudo-measurements, which can filter the bad data in measurements and prepare for the next state estimation. In the distribution system, the observability is guaranteed by pseudo-measurements which are mainly obtained from load forecasting based on AMI measurements [32,33]. Due to a large number of load buses in the distribution system, there is a certain error in the load forecasting, so that the obtained pseudo-measurements have a low precision. At a non-SCADA data acquisition time, namely the PMU data acquisition time P, the LSE is carried out based on estimation results of the previous estimation time and the PMU measurement data, which guarantees the system observability and makes the estimation results continue to update during the SCADA data acquisition period. Besides, the estimation accuracy of PMU installation buses can be close to the PMU measurement accuracy through the high-frequency refresh, including the bad data of the PMU measurements, so that combining the robust estimation with a linear estimation can ensure the estimation accuracy and track the distribution system status in real-time.

3. A Hybrid State Estimator Based on SCADA and PMU Measurements

3.1. State Variables and Measurement Equations in Robust State Estimation

At the time of SCADA data acquisition, the available measurements including the bus voltage amplitude, the bus voltage phasor, the current amplitude, the current phasor and power measurements, and the mathematical observability is guaranteed by pseudo-measurements. This paper follows the method of Reference [19] to deal with the voltage amplitude and voltage phasor measurements. Taking the branch currents as the state variables, the root bus voltage is expanded into the state variables, and the state variables can be expressed in the form of rectangular coordinates as Equation (1):
x ϕ = [ v s l a c k ϕ r , v s l a c k ϕ x , i 1 ϕ r i N ϕ r , i 1 ϕ x i N ϕ x ]
where, v s l a c k ϕ r and v s l a c k ϕ x are the real and imaginary parts of the root bus voltage on phase ϕ, respectively, and i 1 ϕ r i N ϕ r and i 1 ϕ x i N ϕ x are the real and imaginary parts of branch currents on phase ϕ respectively.
Since the phase angle difference between the two ends of the lines in the distribution network is very small, the voltage phase angles of all buses are not much different from that of the root bus [34], so the measurement of the bus voltage amplitude on the phase ϕ can be represented by the state variable as Equation (2):
v h ϕ v s l a c k ϕ r cos ( δ v h ϕ ( k 1 ) ) + v s l a c k ϕ x sin ( δ v h ϕ ( k 1 ) ) l T h ϕ φ = 1 3 ( r l ϕ φ i l ϕ φ r x l ϕ φ i l ϕ φ x ) cos ( δ v h ϕ ( k 1 ) ) l T h ϕ φ = 1 3 ( r l ϕ φ i l ϕ φ x + x l ϕ φ i l ϕ φ r ) sin ( δ v h ϕ ( k 1 ) )
where T h ϕ is the path between the bus h and the root bus. r l ϕ φ and x l ϕ φ are the resistance and reactance of branch l on the path T h ϕ , respectively, and δ v h ϕ ( k 1 ) is the voltage phase angle of the bus h at the (k − 1)th iteration.
The Jacobian matrix elements corresponding to the bus voltage amplitude are given by Equation (3):
{ v h ϕ v s l a c k ϕ r = cos ( δ v h ϕ ( k 1 ) ) v h ϕ v s l a c k ϕ x = sin ( δ v h ϕ ( k 1 ) ) v h ϕ i l ϕ φ r = r l ϕ φ cos ( δ v h ϕ ( k 1 ) ) x l ϕ φ sin ( δ v h ϕ ( k 1 ) ) v h ϕ i l ϕ φ x = x l ϕ φ cos ( δ v h ϕ ( k 1 ) ) r l ϕ φ sin ( δ v h ϕ ( k 1 ) )
The bus voltage phasor measurements can be represented by state variables as Equation (4):
v ˙ h ϕ = v h ϕ r + j v h ϕ x = v s l a c k ϕ r l T h ϕ φ = 1 3 ( r l ϕ φ i l ϕ φ r x l ϕ φ i l ϕ φ x ) + j ( v s l a c k ϕ x l T h ϕ φ = 1 3 ( r l ϕ φ i l ϕ φ x + x l ϕ φ i l ϕ φ r ) )
and the Jacobian matrix elements corresponding to the bus voltage phasor are given by Equation (5):
{ v h ϕ r v s l a c k ϕ r = 1   v h ϕ r v s l a c k ϕ x = 0   v h ϕ x v s l a c k ϕ r = 0   v h ϕ x v s l a c k ϕ x = 1 v h ϕ r i l ϕ φ r = r l ϕ φ   v h ϕ r i l ϕ φ x = x l ϕ φ   v h ϕ x i l ϕ φ r = x l ϕ φ   v h ϕ x i l ϕ φ x = r l ϕ φ
From Equations (2)–(5), it can be seen that the bus voltage measurements will affect the real and imaginary parts of the root bus. As a result, the root bus voltage will not be a fixed reference bus, but an estimated value that is closer to the actual situation based on the actual measurements.
When the measurements in polar coordinates obtained from the PMUs are converted into the rectangular coordinates, and the power measurements are converted into the equivalent current measurements, the measurement error transmission is involved. The covariance of equivalent measurements [35] can be obtained through measurement correlation, and the covariance matrix of the branch current measurements in rectangular coordinate can be expressed as Equation (6):
i h k ϕ = [ i h k ϕ r I h k ϕ i h k ϕ r δ h k ϕ i h k ϕ x I h k ϕ i h k ϕ x δ h k ϕ ] × [ σ I h k ϕ 2 σ δ h k ϕ 2 ] × [ i h k ϕ r I h k ϕ i h k ϕ r δ h k ϕ i h k ϕ x I h k ϕ i h k ϕ x δ h k ϕ ] T
where, i h k ϕ r and i h k ϕ r are the real and imaginary parts of the branch h k after the conversion, respectively. I h k ϕ and δ h k ϕ are the current amplitude and phase angle of branch h k obtained by PMUs, respectively. σ I h k ϕ 2 and σ δ h k ϕ 2 are the current covariance of the amplitude and phase angle, respectively. Both the conversion covariance of the PMU voltage measurements and the power measurements can be obtained by Equation (6), and the weights of the measurements can be expressed as the reciprocal of the covariance.
The correction of state variables can be obtained using Equation (7):
H T W H Δ x ( k ) = H T W ( z h ( x ( k 1 ) ) )
where, H = h / x is the Jacobian matrix, W is the measurement weight matrix considering the delay of SCADA data transmission [36], x k 1 are the state variables obtained by the (k − 1)th iteration, h ( x ) is the measurement function, and z is the real-time measurement data of SCADA and PMU or pseudo-measurements.

3.2. The Improved Robust State Estimation with Normalized Residuals and Adaptive Thresholds

In the traditional WLS, the measurement weight matrix contains the covariance of each measurement error. During the measuring process, due to the reliabilities of sensors or communication, the bad data with errors greater than ±3σ may appear. The traditional WLS does not distinguish normal data from bad data, which will cause a large estimation error, thereby affecting the subsequent decision-making credibility of the distribution system. However, considering the good convergence performance of WLS, this paper uses an improved robust state estimator based on WLS at the time of SCADA data acquisition. The concept of equivalent weight is used to integrate the residuals into measurement weights, and the Institute of Geodesy and Geophysics III (IGGIII) [37] robustness scheme is used to divide the measurement data into normal, suspicious, and harmful segments so that the corresponding weights are divided into the preservation zones, decentralized zones, and elimination zones. Compared with dividing the measurement data into normal measurements and harmful measurements, dividing the measurement data into three segments can make full use of measurement information. The weights are expressed as Equation (8):
w ¯ i = { w i , | r i | k 0 w i k 0 d i 2 | r i | , k 0 < | r i | k 1 0 , | r i | > k 1
where w i is the ith diagonal elements of the measurement weight matrix W in the traditional WLS, k 0 and k 1 are the robust thresholds, and d i is the smooth factor, where d i = ( k 1 | r i | ) / ( k 1 k 0 ) . When the value of ri is smaller than k0, its weight maintains the original measurement weight wi. When the value of ri is between k0 and k1, its weight decreases as ri increases. When the value of ri is larger than k1, its weight is 0.
The validity of the estimation in the robust estimation depends largely on the rationality of the equivalent weight. The efficiency of robust estimation is different from statistics and robust thresholds, especially the rationality of decentralized zone weight threshold and elimination zone weight threshold. For all measurement data, if the thresholds of the robust scheme are the constant experience values, the measurements that originally belong to the normal segment may be defined as the harmful segment or suspicious segment, which will lose a certain amount of efficiency in the state estimation. For this problem, this paper refers to Reference [29] and gives a robust estimation method with variable thresholds. The key to the variable thresholds is that during the iteration process, the thresholds gradually change with the residuals, which can overcome the shortage of the traditional thresholds determined by the experience. The robust thresholds are designed in accordance with Equation (9):
{ k 0 = min ( k t 1 , k t 2 ) k 1 = max ( k t 1 , k t 2 )
where k t 1 = α r i and k t 2 = k t 1 + ( | r i | k t 1 ) / 3 . To make the robust thresholds adapt to the normal condition, α is set to 1.438 [29,38].
The residuals can be expressed as Equation (10):
r = z h ( x ) ( H Δ x ) = Δ z H ( H T W ¯ H ) - 1 H T W ¯ Δ z = [ I H ( H T W ¯ H ) - 1 H T W ¯ ] Δ z = ( I - J ) Δ z
where W ¯ represents the modified measurement weight value and J = H ( H T W ¯ H ) - 1 H T W ¯ .
In the case that real-time measurements are not enough, pseudo-measurements are usually added to ensure the observability. The accuracy of the pseudo-measurements is different from that of the real-time measurements; besides, the measurement accuracy of SCADA and PMU are also different, thus the variances of residuals are not the same. In this paper, we use the internal student residual method to standardize the residuals as given in Equation (11):
{ r s = l 1 J i i + ε R 1 r s ,   i = r i r s = r i R 1 l 1 J i i + ε
where l represents the scale parameter of the standardization and l 2 = r T R 1 r / ( m n ) , m represents the number of measurements, n represents the number of state variables, and ε is a very small number to avoid 1 J i i = 0 .

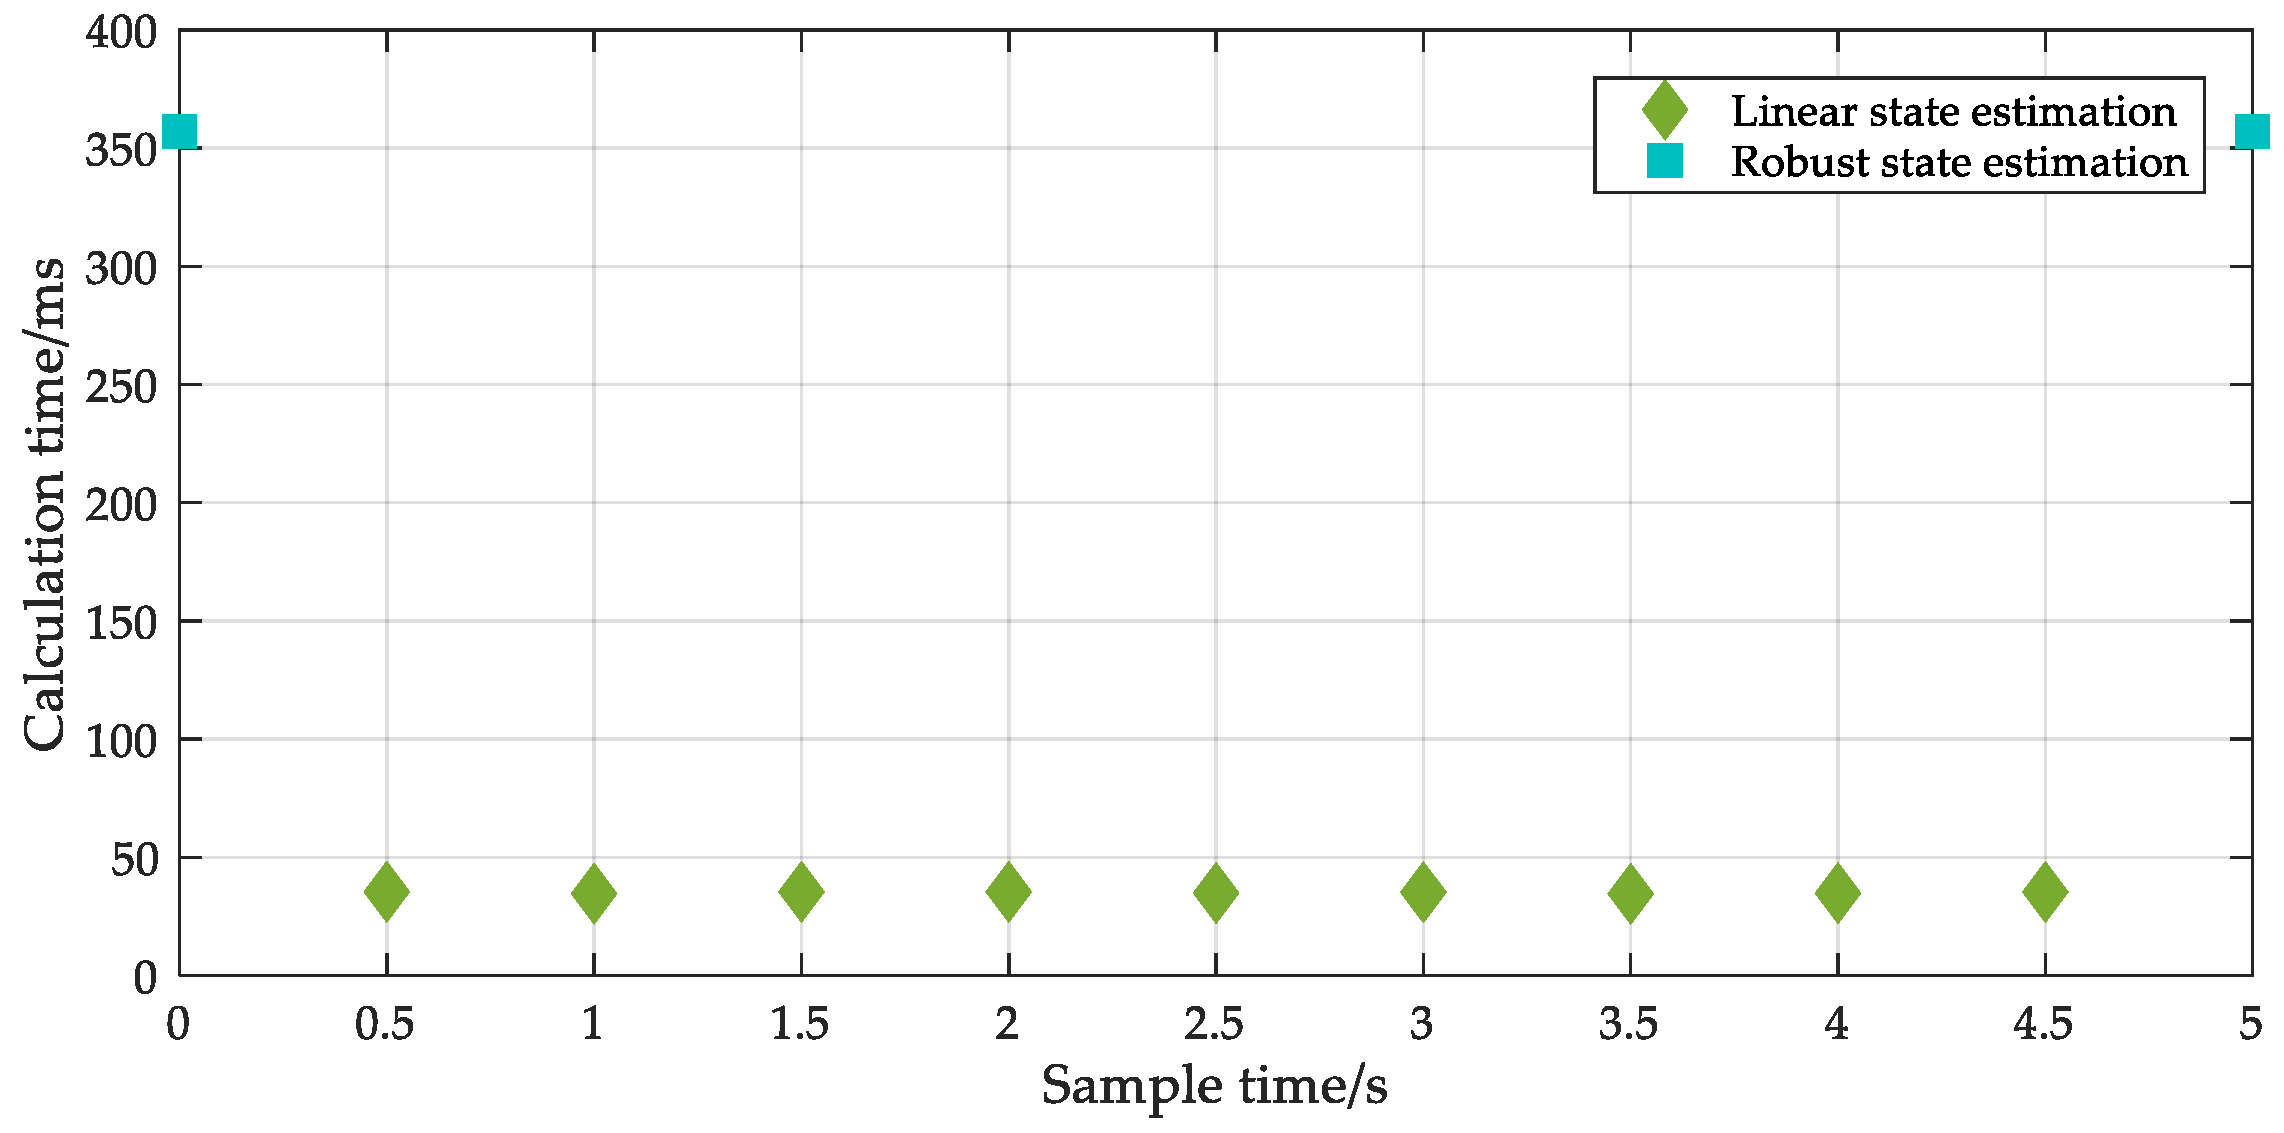
3.3. Fast-State Tracking with PMUs Based on the Linear State Estimation

PMU measurements with millisecond refresh frequency are used to fast track the system states during the SCADA data acquisition period. However, the limited number of PMUs cannot guarantee the observability, so other measurement information at the PMU data acquisition time should be included. In this paper, the estimation results from the previous estimation time (the branch currents) are combined with the PMU measurements (the bus voltage phasors and the branch current phasors) to guarantee the observability. The corresponding measurement weights of the PMU measurements and estimation results of the previous estimation time can be expressed in a matrix block as Equation (12):
W l i n e a r = l i n e a r 1 = [ i S E v P M U i P M U ] 1
where the covariance matrix of the voltage phasors v P M U and the current phasors i P M U in rectangular coordinate are obtained using Equation (6).
The estimation results from the previous estimation time are used as the prior information whose covariance matrix i S E [39] can be obtained using Equation (13):
i S E = ( H T W ¯ H ) 1
The state variables are consistent with that of robust state estimation. Equation (5) can be used to obtain the measurement Jacobian matrix whose elements are constant. Therefore, the LSE can be utilized, and the characteristic of a short execution time can be used to track states with PMU measurements. The LSE results can be obtained using Equation (14):
x = ( H T W l i n e a r H ) 1 H T W l i n e a r z
The whole flowchart of a hybrid estimator based on SCADA and PMU hybrid measurements in the distribution system is shown in Figure 3. If the estimation time Tn is the SCADA sampling time, the robust estimation combining the SCADA measurements with PMU measurements is carried out. Also, the specific flowchart of the improved robust estimation is shown in the left part of Figure 3. Otherwise, the LSE combining the estimation results of the previous estimation time with PMU measurements is carried out.

4. Case Studies

The modified IEEE 33-bus distribution system and measurement configuration are shown in Figure 4. The network parameters and load values provided by Reference [40] were used as the reference condition. PMUs were installed at buses 12 and 30, assuming that all buses had pseudo-power injection measurements and the network reconfiguration was not considered in the state estimation. Note that the measurement configuration was based on the technical reasoning and without considering any optimal placement technique.
In order to prove the validity of the proposed method, the power flow results were taken as the true values. Also, the measurement data are formed by superimposing the corresponding random measurement errors obeying the normal distribution on the basis of the power flow results as given by Equation (15):
X m = X ( 1 + σ )
where, Xm are the measurement values. X are the true values and σ is the random measurement error. The maximum error of the current amplitude measurement and power measurement in SCADA were 3%, while the maximum error of voltage amplitude measurement was 1%. The maximum error of amplitude measurement in PMU was 1%, and the maximum error of the phase angle measurement was 10−2 rad. The maximum error of the pseudo-measurements was 50%. A Monte Carlo method was used to deal with the uncertainty and the number of Monte Carlo trails was 5000 [40].
The dynamic state estimation process of this paper is shown in Figure 5. The period for the improved robust estimation and LSE could be set according to the request of the system and the real refresh frequency of measurement data. In this paper, the period for the improved robust estimation was set to 5 s, while the period for LSE was set to 0.5 s. Taking the SCADA data acquisition time as the starting moment, the improved robust estimation was performed with the SCADA and PMU measurements and pseudo-measurements. When reaching the start time of fast-state tracking with the LSE, the results of the last estimation time were taken as pseudo-measurements, and the estimation results were updated by the PMU measurement data. During the SCADA acquisition data period, a total of nine linear state estimations were performed. When reaching the SCADA data acquisition time again, the above process was repeated. The calculation time of the two state estimators is also shown in Figure 5.
The performance of the proposed hybrid state estimator is verified under the normal condition and bad data condition. At the SCADA data acquisition time, the exponential equivalence robust estimation (EXP) mentioned in Reference [31] and initial IGGIII with no improvement (IGGIII) are used to be compared with the improved IGGIII (IIGGIII). During the dynamic state estimation process, the method in Reference [22] (WLS-UKF) was used to be compared with the proposed hybrid state estimator (IIGGIII-LSE).

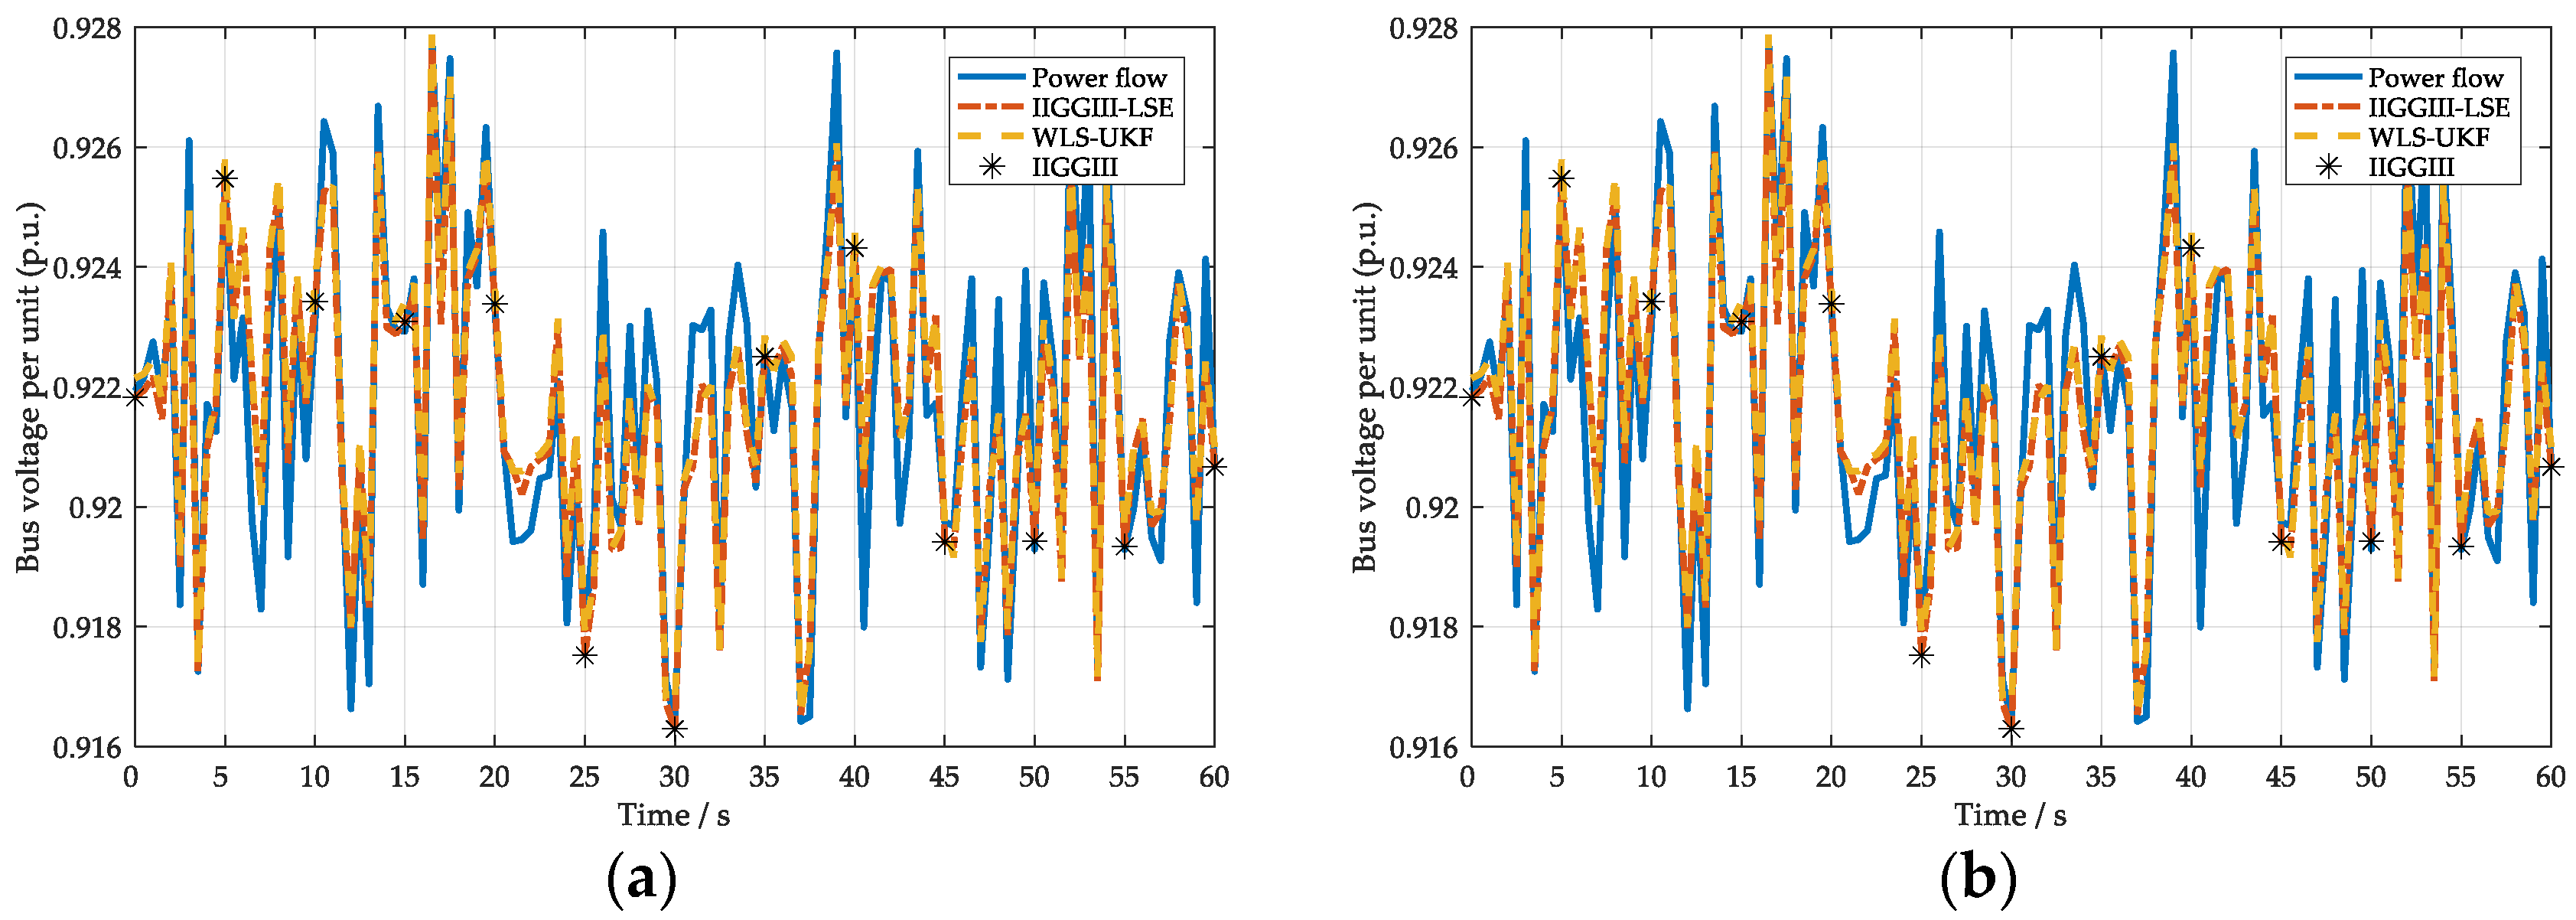
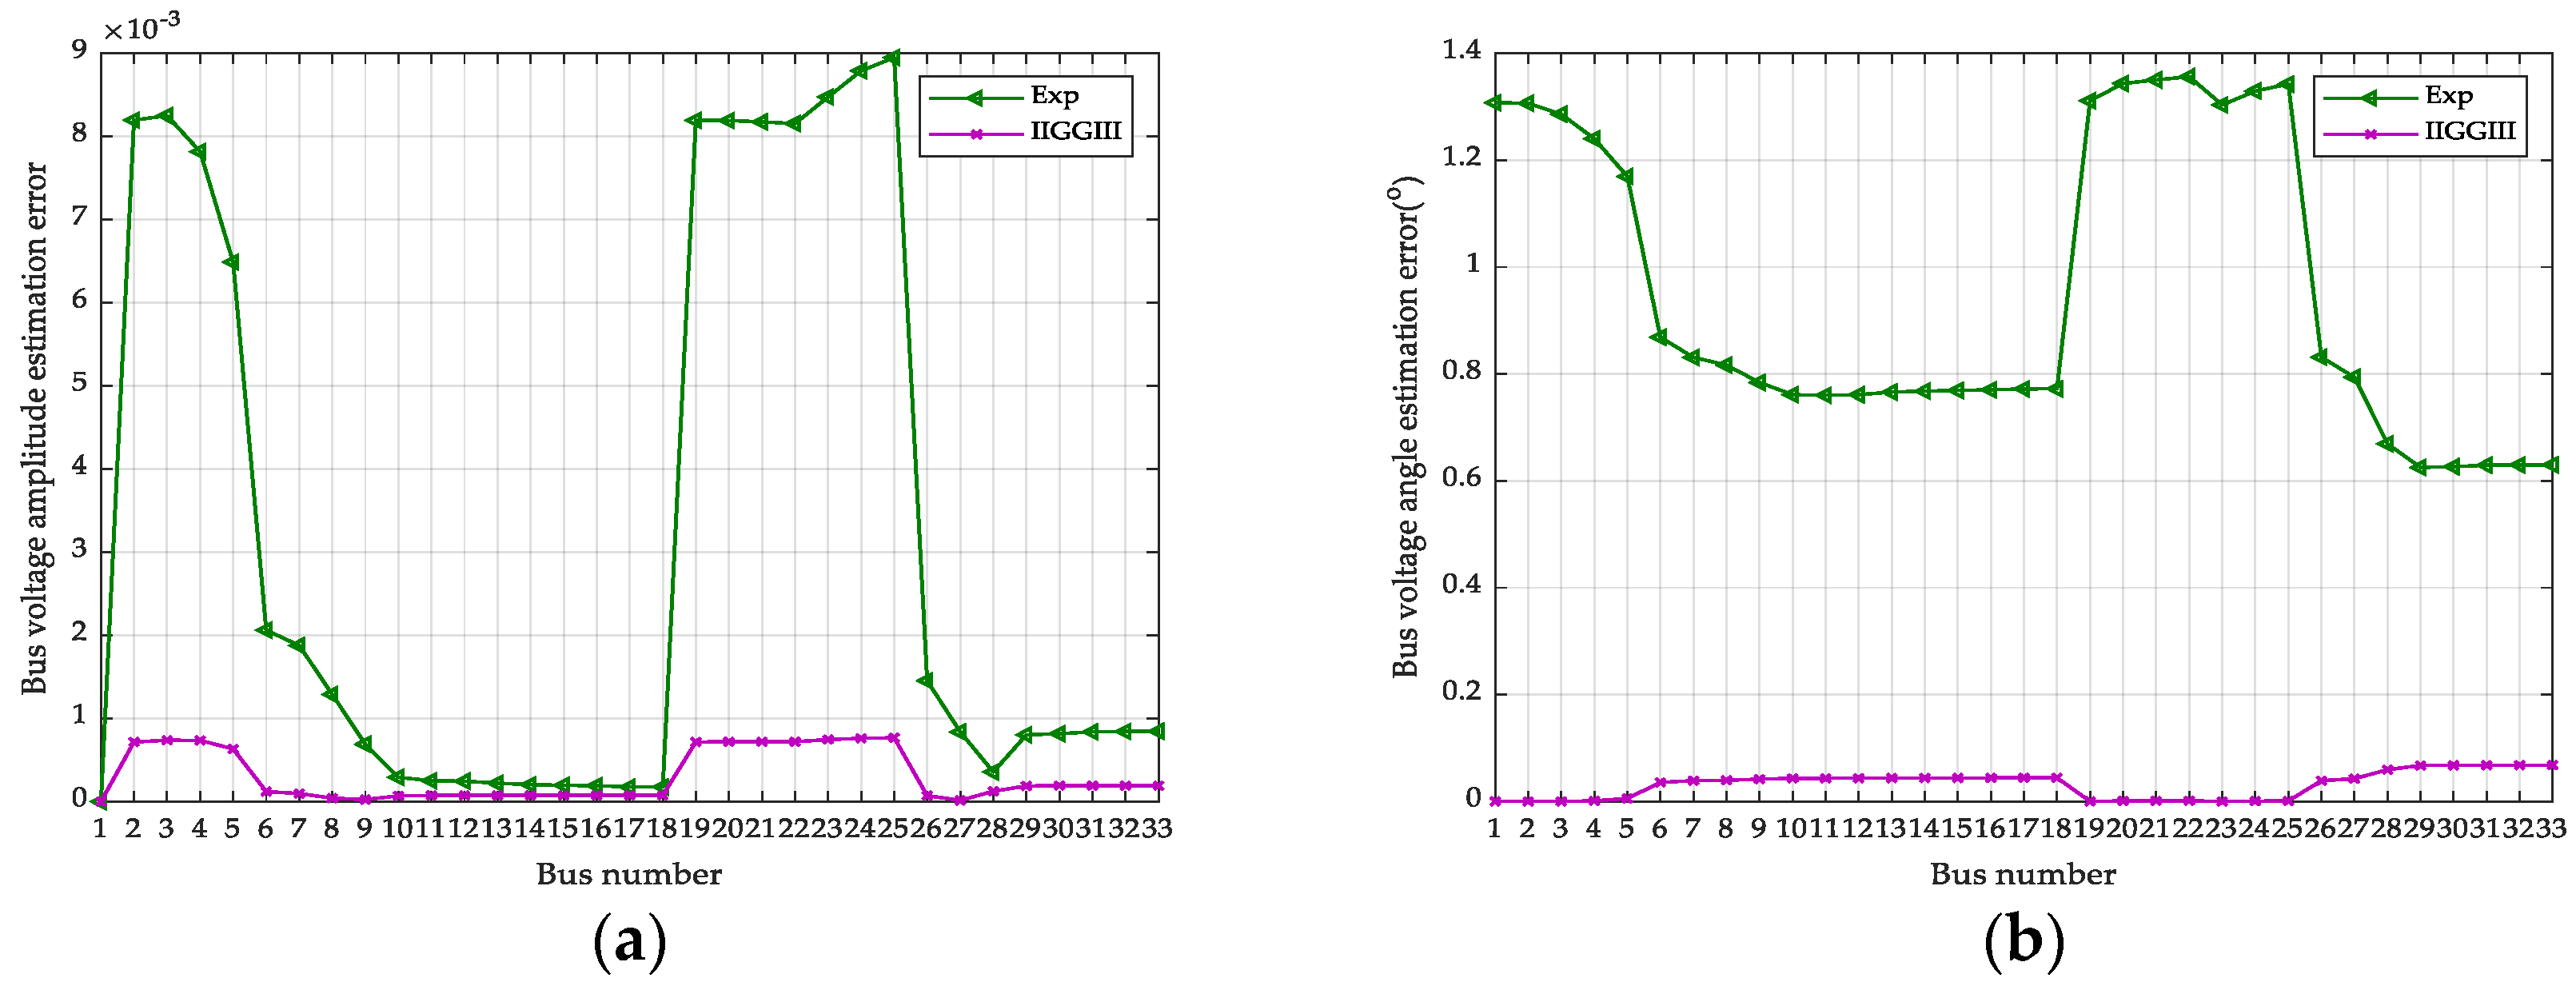
4.1. Comparison of State Estimation Results under the Normal Condition

Table 1 shows a comparison of convergence, iteration, execution time, and the mean absolute error (MAE) of voltage amplitude between the different methods at the SCADA data acquisition time. Also, the MAE of the bus voltage amplitude is defined using Equation (16).
r MAE = | x ^ x p f | / x p f n
where x ^ is the state estimation results and x p f is the power flow results.
Under the normal measurement condition, the four estimation methods could effectively converge in less than 0.5 s, which would not collide with the set time in Figure 5, and the MAE of each method were all less than 10−4, which shows the high estimation accuracy. The improved IGGIII has certain advantages in iterations compared with the exponential equivalence robust estimation. Furthermore, it shows that the reasonable measurement weights could speed up the iteration process. However, the execution time of the improved IGGIII was longer than that of WLS and initial IGGIII. This was because the recalculated weights and robust thresholds in each iteration increased the execution time.
Table 2, Figure 6 and Figure 7 show the dynamic state estimation results at bus 6 (without PMU installation) and 30 (with PMU installation). The proposed IIGGIII-LSE could track the changes of the states, whose effect was similar to the method WLS-UKF. While at the bus with the PMU installation, the proposed IIGGIII-LSE could track the changes more accurately compared to the bus without PMU installation, which indicates the effectiveness of using PMUs.

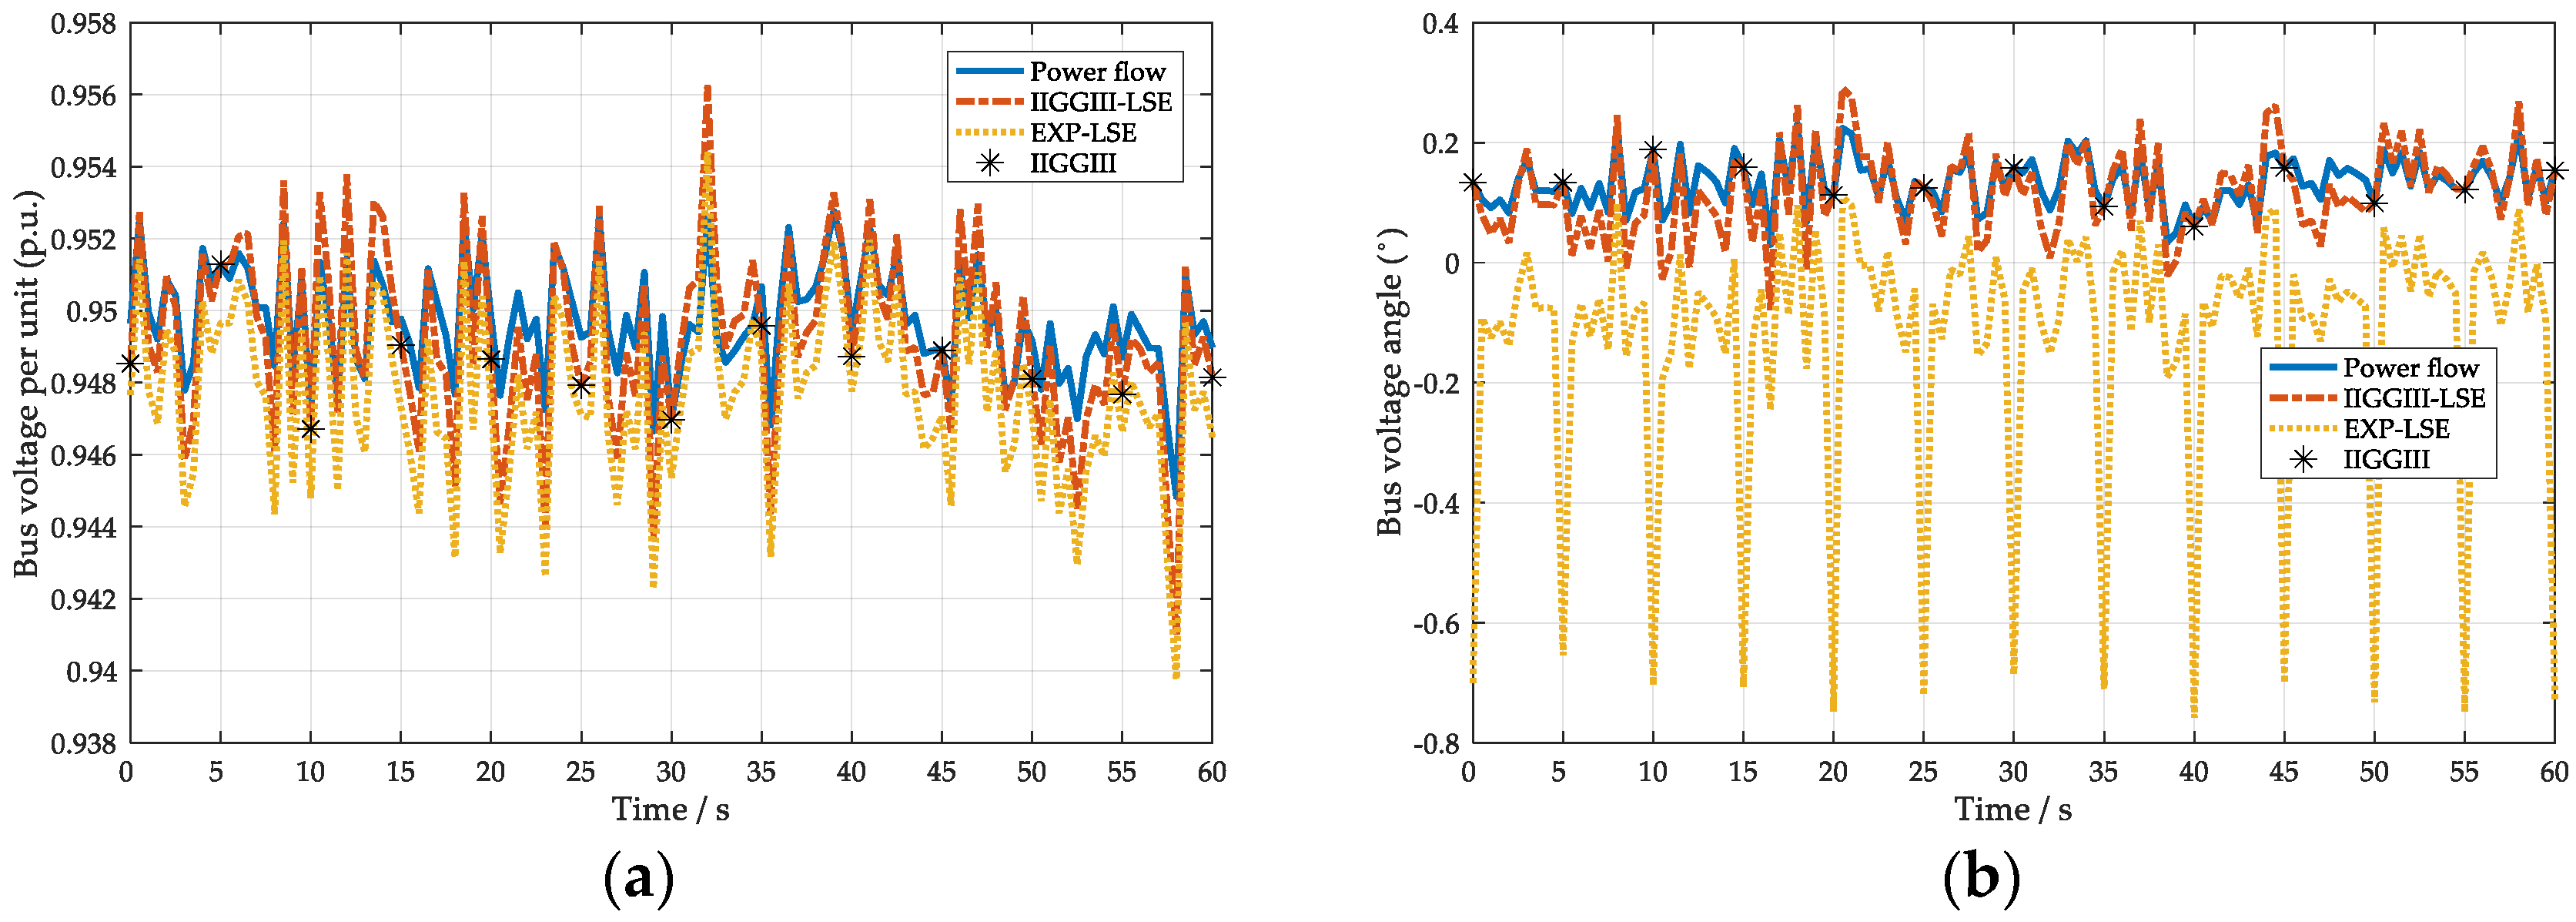
4.2. Comparison of State Estimation Results under the Bad Data Condition

To verify the robustness of the improved IGGIII at the SCADA data acquisition time, the bad data were assumed to appear in the voltage amplitude at bus 6 and the active power of branches 5–6 (measurement error was 75%).
Table 3 shows comparisons of various estimation methods under the conditions of different measurement errors. The errors of bad data always exceed 6–7 σ in the actual situation, and all the four estimation methods could all converge even when the error of bad data reaches 95%. Besides, the execution time was less than 0.5 s, which could ensure that the next state estimation will not be affected and guarantee the timeliness of real-time measurements.
The improved IGGIII was superior to the other three estimation methods in terms of iteration, and MAE of voltage amplitude. And the execution time of the improved IGGIII was shorter than that of WLS and EXP. That was because the robust thresholds can effectively distinguish the bad data from the normal data and the recalculated weights could reduce the effect of bad data on the estimation results. However, the execution time of the improved IGGIII was longer than that of initial IGGIII. That was because the recalculated weights and robust thresholds in each iteration increased the execution time.
Figure 8 and Figure 9 show the comparisons between the two robust estimation methods with a 50% error in voltage amplitude. It can be seen that the voltage amplitude and phasor angle estimated by the EXP deviated from the power flow values in the vicinity of bad data, while the improved IGGIII could make the estimation results closer to the power flow values. Furthermore, it indicates that the normalized residuals and adaptive robust thresholds could eliminate the effect of bad data effectively.
Figure 9 further illustrates the estimation errors of the two robust methods. To characterize the accuracy of state estimation, the absolute error for the estimated voltage amplitude of each bus is defined using Equation (17), and the relative error of the estimated voltage phase of each bus is defined using Equation (18). Because the values of the phase angle were close to zero, to avoid large fluctuation in the absolute error, the relative error was used to reflect the estimation error of the phase angles.
r absolute = | x ^ x p f | / x p f
r relative = | x ^ x p f |
From Figure 9a, the estimation errors of voltage amplitude obtained by the EXP were larger than that obtained by the improved IGGIII, especially in the vicinity of bad data. From Figure 9b, the estimation errors of phase angle in the vicinity of bad data obtained by the EXP were more than 1°, while the improved IGGIII could maintain the estimation error to lower than 0.1°, which highlights the better robustness of the improved IGGIII. The contrast results in Figure 8 and Figure 9 also show that reasonable weights of measurements were very important during the iterations, especially under the bad data condition. Furthermore, the good estimation results obtained by the improved IGGIII indicated that the normalized residuals and adaptive robust thresholds could effectively improve the estimation accuracy under the bad condition. To sum up, the improved IGGIII could converge under the bad data condition with good robustness.
When the bad data appeared, the proposed IIGGIII-LSE could also track the changes in the distribution system, and the dynamic estimation results are shown in Table 4, Figure 10 and Figure 11. To emphasize the advantage of the proposed IIGGIII-LSE, the EXP combined with LSE (EXP-LSE) was used. For EXP-LSE, the estimation results of bus voltage and phase angle at bus 6 without PMU, were unsatisfying, as shown in Figure 10, because bus 6 was in the vicinity of bad data and there were no PMU measurements to update the inaccuracy states. The phase angle estimation results at bus 30 equipped with PMU were inaccurate due to the bad robustness of EXP at the SCADA data acquisition time. However, the estimation results could be corrected by the highly accurate PMU measurements, as shown in Figure 11b.
For the proposed IIGGIII-LSE, the dynamic estimation results under the bad data condition were as accurate as under the normal condition. While at the bus with the PMU installation, the proposed method could track the changes more accurately compared to the bus without the PMU installation, which indicated the effectiveness of using PMU measurements. To sum up, the robust state estimation was indispensable in the dynamic state estimation and the proposed IIGGIII-LSE performed well under the bad data condition. Besides, the estimation results would be less accurate if the estimated bus or area was far from the installation of the PMUs.
The feasibility of the proposed IIGGIII-LSE was also verified by the actual medium voltage distribution system in the suburb of Guangzhou, China. The system included 62 buses and 108 real-time measurements, and the diagram is shown in Figure A1. Figure 12 shows the application results of the proposed method in this system. The mean absolute error of the bus voltage amplitude was less than 0.6%, while the minimum mean absolute error of the bus voltage amplitude was less than 0.1%. The maximum relative error of the voltage phase was less than 0.4°. At the time of 3 min, 6 min, 7.5 min, and 9 min, the bad data were created by adding a disturbance into the measurements, and the proposed IIGGIII-LSE performed well, which indicated the practicability and effectiveness of the method in this paper.

5. Conclusions

In order to improve the accuracy of state estimation and effectively track system states, this paper proposed a hybrid state estimator considering the integration of a limited number of PMU measurements and bad data in the DSSE. The following conclusions were obtained:
(1)
Using the PMU measurements in the DSSE was necessary and fast-state tracking with LSE could guarantee the timeliness of real-time measurements and avoid the waste of the PMU measurements. However, the estimation results would be less accurate if the estimated bus or area was far from the installation of the PMUs.
(2)
The normalized residuals and adaptive thresholds could improve the estimation robustness of dealing with the bad data in real-time measurements.
(3)
The proposed hybrid state estimator could effectively converge and quickly track the system states while ensuring the estimation accuracy.

Author Contributions

X.K. and C.W. conceived the idea of the study and conducted the research. Y.C. and C.Y. analyzed most of the data and wrote the initial draft of the paper. T.X., P.L., and L.Y. contributed to finalizing this paper.

Funding

This research was funded by the National Key Research and Development Program of China grant number 2017YFB0902900 and 2017YFB0902902.

Conflicts of Interest

The authors declare no conflict of interest.

Appendix A

Figure A1. The diagram of an actual medium voltage distribution system in China.
Applsci 08 01527 g0a1

References

  1. Cataliotti, A.; Cosentino, V.; Cara, D.D.; Pierluca, R.; Enrico, T.; Giovanni, T. An Innovative Measurement Approach for Load Flow Analysis in MV Smart Grids. IEEE Trans. Smart Grid 2016, 7, 889–896. [Google Scholar] [CrossRef]
  2. Prasad, S.; Kumar, D.M.V. Optimal Allocation of Measurement Devices for Distribution State Estimation Using Multiobjective Hybrid PSO-Krill Herd Algorithm. IEEE Trans. Instrum. Meas. 2017, 66, 2022–2035. [Google Scholar] [CrossRef]
  3. Primadianto, A.; Lu, C.N. A Review on Distribution System State Estimation. IEEE Trans. Power Syst. 2016, 32, 1–6. [Google Scholar] [CrossRef]
  4. Tosato, P.; Macii, D.; Luiso, M.; Davide, B.; Daniele, G.; Carmine, L. A Tuned Lightweight Estimation Algorithm for Low-Cost Phasor Measurement Units. IEEE Trans. Instrum. Meas. 2018, 67, 1047–1057. [Google Scholar] [CrossRef]
  5. Wu, Z.J.; Xu, J.; Yu, X.H.; Dou, X.; Gu, W. Review on State Estimation Technology of Active Distribution Network. Autom. Electr. Power Syst. 2017, 41, 182–191. [Google Scholar] [CrossRef]
  6. Wang, B.; Sun, H.; Zhang, D. Review on Data Sharing and Synchronized Phasor Measurement Technique with Application in Distribution Systems. Proc. CSEE 2015, 35, 1–7. [Google Scholar] [CrossRef]
  7. Cataliotti, A.; Cosentino, V.; Cara, D.D.; Giovanni, T. LV Measurement Device Placement for Load Flow Analysis in MV Smart Grids. IEEE Trans. Instrum. Meas. 2016, 65, 999–1006. [Google Scholar] [CrossRef]
  8. Damavandi, M.G.; Krishnamurthy, V.; Martí, J.R. Robust Meter Placement for State Estimation in Active Distribution Systems. IEEE Trans. Smart Grid 2015, 6, 1972–1982. [Google Scholar] [CrossRef]
  9. Castello, P.; Ferrari, P.; Flammini, A.; Carlo, M.; Paolo, A.P.; Stefano, R. A Distributed PMU for Electrical Substations with Wireless Redundant Process Bus. IEEE Trans. Instrum. Meas. 2015, 64, 1149–1157. [Google Scholar] [CrossRef]
  10. Parvez, B.; Ali, J.; Ahmed, U.; Muhammad, F. Framework for implementation of AGA 12 for secured SCADA operation in Oil and Gas Industry. In Proceedings of the 2nd International Conference on Computing for Sustainable Global Development (INDIACom), New Delhi, India, 11–13 March 2015; pp. 1281–1284. [Google Scholar]
  11. Chenine, M.; Nordstrom, L. Modeling and Simulation of Wide-Area Communication for Centralized PMU-Based Applications. IEEE Trans. Power Deliv. 2011, 26, 1372–1380. [Google Scholar] [CrossRef] [Green Version]
  12. Chin, W.L.; Li, W.; Chen, H.H. Energy Big Data Security Threats in IoT-Based Smart Grid Communications. IEEE Commun. Mag. 2017, 55, 70–75. [Google Scholar] [CrossRef]
  13. Meloni, A.; Pegoraro, P.A.; Atzori, L.; Benigni, A.; Sulis, S. Cloud-based IoT solution for State Estimation in Smart Grids: Exploiting virtualization and edge-intelligence technologies. Comput. Netw. 2017, 130, 156–165. [Google Scholar] [CrossRef]
  14. Chawasak, R.; Sermsak, U.; Suttichai, P. State estimation of power system considering network parameter uncertainty based on parametric interval linear systems. IEEE Trans. Power Syst. 2012, 27, 305–313. [Google Scholar] [CrossRef]
  15. Brinkmann, B.; Negnevitsky, M. A Probabilistic Approach to Observability of Distribution Networks. IEEE Trans. Power Syst. 2016, 32, 1169–1178. [Google Scholar] [CrossRef]
  16. Wei, Z.; Yan, Q.; Sun, G.; Ni, M. Power System Interval Linear State Estimation Considering Network Parameter Uncertainty. Power Syst. Technol. 2015, 2, 99–110. [Google Scholar] [CrossRef]
  17. Xu, J.; Wu, Z.; Hu, Q.; Xu, Y.Y.; Dou, X.B.; Gu, W. Interval State Estimation Considering Uncertainties of Multiple Types of DGs and Loads in Active Distribution Networks. Proc. CSEE 2017, 29, 1–12. [Google Scholar] [CrossRef]
  18. Pau, M.; Pegoraro, P.A.; Sulis, S. Branch current state estimator for distribution system based on synchronized measurements. In Proceedings of the IEEE International Workshop on Applied Measurements for Power Systems (AMPS) Proceedings, Aachen, Germany, 26–28 September 2012; pp. 1–6. [Google Scholar]
  19. Pau, M.; Pegoraro, P.A.; Sulis, S. Efficient branch-current-based distribution system state estimation including synchronized measurements. IEEE Trans. Instrum. Meas. 2013, 62, 2419–2429. [Google Scholar] [CrossRef]
  20. Liu, J.; Tang, J.; Ponci, F.; Monti, A.; Muscas, C.; Paolo, A.P. Trade-offs in PMU deployment for state estimation in active distribution grids. IEEE Trans. Smart Grid 2012, 3, 915–924. [Google Scholar] [CrossRef]
  21. Gómez-Expósito, A.; Gómez-Quiles, C.; Džafic, I. State estimation in two time scales for smart distribution system. IEEE Trans. Smart Grid 2015, 6, 421–430. [Google Scholar] [CrossRef]
  22. Huang, S.C.; Lu, C.N.; Lo, Y.L. Evaluation of AMI and SCADA Data Synergy for Distribution Feeder Modeling. IEEE Trans. Smart Grid 2015, 6, 1639–1647. [Google Scholar] [CrossRef]
  23. Wang, S.F.; Liu, G.Y.; Huang, R.L.; Qin, S. State Estimation Method for Active Distribution Networks Under Environment of Hybrid Measurements with Multiple Sampling Periods. Autom. Electr. Power Syst. 2016, 40, 30–36. [Google Scholar] [CrossRef]
  24. Gol, M.; Abur, A. A hybrid state estimator for systems with limited number of PMUs. IEEE Trans. Power Syst. 2015, 30, 1511–1517. [Google Scholar] [CrossRef]
  25. Albuquerque, A.; Bez, D.; Simões, A. Multistage strategies to incorporate phasor measurements into power system state estimation. In Proceedings of the IREP Symposium Bulk Power System Dynamics and Control-IX Optimization, Security and Control of the Emerging Power Grid, Rethymno, Greece, 25–30 August 2013; pp. 1–11. [Google Scholar]
  26. Simões, A.; Albuquerque, A.; Bez, D. An estimation fusion method for including phasor measurements into power system real-time modeling. IEEE Trans. Power Syst. 2013, 28, 1910–1920. [Google Scholar] [CrossRef]
  27. Ju, Y.T.; Wu, W.C.; Cheng, X.Q.; Zhang, B.M.; Sun, H.B. Multi-source information based current matching state estimation for distribution network. Autom. Electr. Power Syst. 2012, 36, 53–57. [Google Scholar] [CrossRef]
  28. Barry, H.; Milan, P.; Singh, R. A Comparison of MV Distribution System State Estimation Methods using Field Data. In Proceedings of the IEEE Power & Energy Society General Meeting, Denver, CO, USA, 26–30 July 2015; pp. 1–5. [Google Scholar]
  29. Wu, J.; He, Y.; Jenkins, N. A robust state estimator for medium voltage distribution networks. IEEE Trans. Power Syst. 2013, 28, 1008–1016. [Google Scholar] [CrossRef]
  30. Hayes, B.P.; Gruber, J.K.; Prodanovic, M. A Closed-Loop State Estimation Tool for MV Network Monitoring and Operation. IEEE Trans. Smart Grid 2015, 6, 2116–2125. [Google Scholar] [CrossRef]
  31. Yan, W.; Duan, L.; Yang, H.Y.; Zhao, X.; Yu, J. Robust State Estimation for Three-phase Four-wire Distribution System Using Smart Meters Measurement Data. Proc. CSEE 2015, 35, 60–67. [Google Scholar] [CrossRef]
  32. Wang, F.; Zhen, Z.; Wang, B.; Mi, Z.Q. Comparative Study on KNN and SVM Based Weather Classification Models for Day Ahead Short Term Solar PV Power Forecasting. Appl. Sci. 2017, 8, 28. [Google Scholar] [CrossRef]
  33. Wang, F.; Zhen, Z.; Wang, B.; Peng, J.F. Climate Change and Power Security: Power Load Prediction for Rural Electrical Microgrids Using Long Short Term Memory and Artificial Neural Networks. Appl. Sci. 2018, 8, 749. [Google Scholar] [CrossRef]
  34. Xin, A.; Wang, C.; Zhu, W.G.; Xiao, Y. Derivation and Comparison of Two Versions of Linear Power Flow Method for Distribution Networks. Power Syst. Technol. 2017, 41, 4004–4013. [Google Scholar]
  35. Rafael, S.S.; Thiago, R.F.; Madson, C.A. Specifying angular reference for three-phase distribution system state estimators. IET Gener. Transm. Distrib. 2018, 12, 1655–1663. [Google Scholar] [CrossRef]
  36. Arash, A.; Francis, T.; Djordje, A.; Juri, J.; Ebrahim, V. Distribution system state estimation based on non-synchronized smart meters. IEEE Trans. Smart Grid 2015, 6, 2919–2928. [Google Scholar] [CrossRef]
  37. Wang, B.; Jian, C.L.; Gao, J.; Liu, C. Newton-Gauss Algorithm of Robust Weighted Total Least Squares Model. Acta Geodaetica et Cartographica Sinica 2015, 44, 602–608. [Google Scholar] [CrossRef]
  38. Xue, A.; Zhang, Z.; Bi, T. Online identification of transmission line positive-sequence parameters based on adaptive robust least squares. Trans. Chin. Electrotech. Soc. 2015, 30, 202–209. [Google Scholar] [CrossRef]
  39. Vladan, D.K.; Andrija, T.S. Bad area detection and whitening transformation-based identification in three-phase distribution state estimation. IET Gener. Transm. Distrib. 2017, 11, 2351–2361. [Google Scholar] [CrossRef]
  40. Hong, W.; Wen, Z.; Yu, T.L. A Robust Measurement Placement Method for Active Distribution System State Estimation Considering Network Reconfiguration. IEEE Trans. Smart Grid 2018, 9, 2108–2117. [Google Scholar] [CrossRef]
Figure 1. The radial distribution system.
Applsci 08 01527 g001
Figure 2. Measurement data fusion diagram of SCADA and PMU.
Applsci 08 01527 g002
Figure 3. The flowchart of a hybrid estimator based on SCADA and PMU measurements.
Applsci 08 01527 g003
Figure 4. Measurements configuration diagram of IEEE 33-bus system.
Applsci 08 01527 g004
Figure 5. Schematic diagram of computation procedure and time with regard to two algorithms of state estimation.
Applsci 08 01527 g005
Figure 6. State trace at bus 6 of the 33-bus system under the normal condition: (a) voltage amplitude curve, and (b) voltage angle curve.
Applsci 08 01527 g006
Figure 7. State trace at bus 30 of the 33-bus system under the normal condition: (a) voltage amplitude curve, and (b) voltage angle curve.
Applsci 08 01527 g007
Figure 8. Bus voltage (amplitude and phase angle) profile curves estimated by different methods: (a) voltage amplitude curve, and (b) voltage angle curve.
Applsci 08 01527 g008
Figure 9. Bus voltage (amplitude and phase angle) estimation errors under different methods: (a) the estimation error curve of voltage amplitude, and (b) the estimation error curve of voltage angle.
Applsci 08 01527 g009
Figure 10. State trace at bus 6 of 33-bus system under the bad data condition: (a) voltage amplitude curve, and (b) voltage angle curve.
Applsci 08 01527 g010
Figure 11. State trace at bus 30 of the 33-bus system under the bad data condition: (a) voltage amplitude curve, and (b) voltage angle curve.
Applsci 08 01527 g011
Figure 12. Performance of the proposed method: (a) the estimation error curve of voltage amplitude, and (b) the estimation error curve of voltage angle.
Applsci 08 01527 g012
Table 1. Performance comparison of five estimation methods.
Estimation MethodConvergenceIterationsExecution Time(s)MAE of Bus Voltage Amplitude
WLSYes220.1443.17033 × 10−5
EXPYes370.4966.57133 × 10−5
IIGGIIIYes320.3571.72627 × 10−5
IGGIIIYes260.1829.44840 × 10−5
Table 2. State trace at bus 6 and bus 30 of the 33-bus system under the normal condition.
Time/sMAE of Bus Voltage AmplitudeThe Relative Error of the Estimated Voltage Phase
Bus 6Bus 30Bus 6Bus 30
WLS-UKFIIGGIII-LSEWLS-UKFIIGGIII-LSEWLS-UKFIIGGIII-LSEWLS-UKFIIGGIII-LSE
200.001060.001340.000180.000420.001060.000700.000440.00002
20.50.001420.001240.000100.000560.001190.000910.000550.00019
210.001330.000830.000140.000050.001150.001010.000410.00036
21.50.001270.001240.000410.000140.001320.001120.000590.00044
220.030830.056520.012670.005400.027510.025480.009830.02306
22.50.038600.064210.021050.002600.035070.032900.017280.03056
230.006080.037330.000180.010510.020390.016380.000320.00021
23.50.003750.038750.001600.008750.021580.017450.001350.00115
240.001160.001240.000180.000420.001060.000700.000440.00002
24.50.001320.001140.000100.000560.001190.000910.000550.00019
Table 3. Performance comparisons of various estimation methods.
Measurement Error of Voltage Amplitude at Bus 6Estimation MethodConvergenceIterationsExecution TimeMAE
Normal conditionWLSYes120.2360.00500
EXPYes60.1650.00004
IIGGIIIYes90.1740.00004
IGGIIIYes130.1650.00510
5%WLSYes120.1970.00452
EXPYes70.1670.00008
IIGGIIIYes80.1620.00002
IGGIIIYes130.1750.00449
10%WLSYes120.1900.01125
EXPYes70.1990.00062
IIGGIIIYes80.1930.00004
IGGIIIYes130.1730.01123
50%WLSYes120.1900.06593
EXPYes110.3360.00300
IIGGIIIYes80.1740.00044
IGGIIIYes120.1720.06580
95%WLSYes120.1940.12745
EXPYes120.2010.00353
IIGGIIIYes80.1890.00127
IGGIIIYes110.1630.12723
Table 4. State trace at bus 6 and bus 30 of the 33-bus system under the bad data condition.
Time (s)MAE of Bus Voltage AmplitudeThe Relative Error of the Estimated Voltage Phase
Bus 6Bus 30Bus 6Bus 30
EXP-LSEIIGGIII-LSEEXP-LSEIIGGIII-LSEEXP-LSEIIGGIII-LSEEXP-LSEIIGGIII-LSE
200.001200.000320.001450.000660.859470.011010.639560.01316
20.50.003170.002840.001540.000430.114630.067130.002200.00360
210.002580.001140.000020.001000.119920.061010.003740.00439
21.50.002770.001010.002090.000060.157770.022700.016060.01617
220.002180.001770.000550.000220.160440.020370.001750.00192
22.50.001020.000010.001450.000170.191620.010840.008450.00842
230.003390.002580.000050.000010.153650.027710.019300.01903
23.50.002040.000080.000270.000800.193600.013440.015100.01506
240.001450.000070.000190.001000.219250.038750.017700.01747
24.50.001340.001290.001730.001000.178960.001720.004490.00444

