Analytic Model and the Influence of Actuator Number on the Performance of Plasma Synthetic Jet Actuator Array
by
Shengfang Huang
1, 
Zhibo Zhang
1,*,
Huimin Song
1,*,
Yun Wu
2,
Zhengzhong Sun
3 and
Yinghong Li
1 1
Science and Technology on Plasma Dynamics Laboratory, Air Force Engineering University, Xi'an 710038, China
2
Institute of Aero-engine, School of Mechanical Engineering, Xi’an Jiaotong University, Xi’an 710049, China
3
Department of Mechanical Engineering and Aeronautics, City University London, London, UK
*
Authors to whom correspondence should be addressed.
Appl. Sci. 2018, 8(9), 1534; https://doi.org/10.3390/app8091534
Submission received: 6 August 2018
/
Revised: 28 August 2018
/
Accepted: 29 August 2018
/
Published: 1 September 2018
(This article belongs to the Special Issue Aeroacustic and Vibroacoustic Advancement in Aerospace and Automotive Systems)
Abstract
:Coupled with the multichannel discharge model and plasma synthetic jet actuator (PSJA) aerodynamic model, an analytical model to predict the performance of the PSJA array is put forward. The multichannel discharge model takes these factors into consideration, the delay time in the breakdown process, the electrical transformation of the discharge channel from a capacitor to a resistor induced by the air breakdown, and the varying plasma resistance in the discharge process. The PSJA aerodynamic model is developed based on the conservation equations of mass, momentum, energy, and the lumped capacitance method. The multichannel discharge model can simulate the multichannel discharge process and give the discharge energy in the plasma channel. With a constant heating efficiency, the time-independent heating energy deposition power in a discharge channel is obtained. Importing the heating energy, the PSJA aerodynamic model presents the evolution process of the jet. Simulation results show that the jet strength induced by a single actuator decreases with the number of actuators in the PSJA array. When the actuator number increases from 1 to 20, the weakening extent of mass ejected, peak jet velocity, and jet duration time is 62%, 54%, and 33%, respectively. The discharge efficiency increases with the actuator number, while the thermodynamic efficiency decreases with the actuator number. As a result, the total energy efficiency doesn’t always increase with an increase in the number of actuators. When the discharge efficiency of a conventional one channel discharge has been a relatively large value, the total energy efficiency actually decreases with the growth of actuator number.
1. Introduction
Plasma actuators have attracted a lot of research attention in recent years because of the associated advantages, such as the absence of moving components, fast response, and wide bandwidth. So far promising control outcomes have been revealed in suppressing flow separation [1,2], alleviating turbomachinery stall [3,4], and shock wave/boundary layer interaction [5,6]. A plasma synthetic jet actuator (PSJA) is one of the typical plasma actuators. The PSJA makes use of the heat released from the spark discharge process between electrodes within a small cavity where the electrodes are housed. As the velocity of the resulting jet is high (larger than 100 m/s), the PSJA is suitable for high-speed applications. It should be noted that the dielectric barrier discharge (DBD) plasma actuator with annular electrodes can also generate a vertical jet [7,8], and has the name of plasma synthetic jet actuator too [9]. However, the jet velocity from DBD-PSJA is much less. The present work has focused on the PSJA with the principle of spark discharge.
As the diameter of the PSJA orifice is in the order of millimeters, to enlarge the affected area, an array containing distributed actuators is necessary for practical applications [10]. In 2009, Caruana et al. [11] attempted to reduce the jet exhaust noise using six PSJAs. Unfortunately, little effect was achieved, and it was concluded that this was as a result of an insufficient number of actuators. In 2012, an array of three PSJAs was used to control the unsteadiness of a shock wave/turbulent boundary layer by Narayanaswamy et al. [6]. In 2013, an attempt of using 20 PSJAs is made to reduce the trailing edge separation on a NACA-0015 profile [12,13]. Therefore, it can be found that there is a strong desire to implement more PSJAs in various flow controls to deliver a strong actuation.
The arc discharge channel was revealed to feature negative resistant characteristics [14,15], namely, an increase in the current leads to a decrease in the voltage. As a result, the multichannel discharge circuit is difficult to power when using a single power supply. In 2005, M. Samimy et al. [16] tested the discharge in eight channels connected in parallel by using a 30 kΩ current-limiting resistor. This large current-limiting resistor results in a large energy waste. As introduced above, 20 PSJAs were driven simultaneously, but 20 high power supply systems are used by Caruana [12], which is apparently not suitable for on-board applications. Recently, a multichannel discharge technique based on a voltage relay concept is proposed by the authors’ group [17,18,19]. It allows multi-channel discharge without increasing the input voltage and without adding an additional current-limiting resistor. The new voltage relay circuit is a breakthrough. Despite its initial success in experimental testing, the manner in which the channel number affects the jet flow is still not clear, which is of great importance in optimizing the PSJA array’s aerodynamic performance.
One efficient way to study the effect of actuator number is to use an analytical model. In 2003, Grossman et al. [20] developed a first-order PSJA model. However, it can only predict the basic performance parameter, such as the jet velocity. In 2010, Haack et al. [21] made a further development where the jet generation process is included, but without modeling the recovery process. In 2015, Zong et al. [22] developed a model that can predict a PSJA’s entire working cycle. However, the models introduced above only simulate the operation of a single PSJA. No model is available to predict the performance of a PSJA array, namely a number of PSJAs.
The plasma synthetic jet actuator array (PSJA array) developed by the authors can enlarge the area affected by the actuator greatly, which is more suitable for practical application. A new analytic model is developed in the present work. It consists of two parts: The multichannel discharge model and the PSJA aerodynamic model. The new model enables simulation of the whole working cycle of the PSJA array, and allows the comparison with that of a single PSJA. As the number of PSJAs potentially affects the performance, the effect of the number of PSJAs is also studied using the new model.
2. Analytic Model Development
Same as the conventional PSJA, the working process of the PSJA array consists of three stages: Energy deposition, jet generation, and recovery. However, owing to the disparity in the discharge circuit, the energy deposition process is different. After the energy deposition process, the jet generation and recovery process are similar, which can be described by conservation of mass, momentum, and energy equations. Hence, the analytical model of the PSJA array is divided into two models: A multichannel discharge model and PSJA aerodynamic model. The multichannel discharge model is used to describe the discharge process and calculate the energy deposited in each discharge channel. The PSJA model is used to describe the jet generation and recovery process. The deposited energy of PSJA is obtained from the multichannel discharge model. The multichannel discharge model has been described in reference [23].
2.1. The PSJA Aerodynamic Model
As shown in Figure 1, the PSJA consists of four main parts: Throat, chamber, shell, and electrodes. To simplify the PSJA aerodynamic model, the fluid region including the throat and chamber is treated as two control volumes. The pressure, temperature, and density are averaged over the control volume. Then, the conservation of mass, momentum, and energy equations are manipulated to describe the changes in density, jet velocity, pressure, and temperature in the control volume.
To simplify these conservation equations, some assumptions are adopted in this model.
- (1)
- (2)
- The gas velocity in the chamber is negligible, only the velocity of gas in the throat is taken into consideration. The velocity, temperature, density, and pressure across the throat outlet and throat inlet are uniform and represented by scalar values. As heating in the actuator chamber is assumed to be uniform, the error associated with this assumption is small.
- (3)
- The gas is seen as inviscid. As the ratio of throat length to throat diameter is not large, the role of gas viscosity plays a less important role. If the throat was long and narrow, viscous forces would need to be considered.
2.2. The Conservation Equations
For inviscid flow, the integral form of the conservation equations is given as following:
For the chamber control volume, the gas velocity is negligible. These conservation equations are represented as the following:
For the throat control volume, these conservation equations are represented as the following:
In the Equations (4)–(8), the subscripts c and t represent the averaged parameters over the chamber control volume and the throat control volume, respectively; the subscripts i and o represent the averaged parameters over the throat inlet control face and the throat outlet control face, respectively. The u indicates the averaged gas velocity over the throat control volume.
To solve these equations, these parameters including the pressure, density, and temperature over the throat inlet and outlet control face must be calculated. As shown in Figure 2, in a different working stage, the gas flow direction is the opposite. As a result, the way to calculate the parameters over the throat inlet and outlet control face is different.
In jet stage, the gas flow from the chamber to the outside environment. At this time, the parameters over the throat inlet control face are determined by the gas state parameters in the chamber, and the parameters over the throat outlet control face are determined by the gas state parameters in the throat. Additionally, when the gas flows through the throat, the diameter of the pipeline decreases quickly, which induced the local pressure loss. In this model, the local pressure loss is considered using an engineering method, as shown in Equation (9).
Taking these factors into consideration, the corresponding functions are presented as the following:
However, limiting by the throat geometry, the maximum gas velocity is the local sound speed. That means that the flow condition has two modes: To be chocked and to be unchocked. The criterion for judgment is as follows:
If flow parameters meet this criterion, the flow is considered to be choked. The pressure at the throat outlet face is calculated as follows:
In recovery stage, the gas flows from the outside environment to the chamber. At this time, the parameters over the throat inlet control face are determined by the gas state parameters in the throat; the parameters over the throat outlet control face are determined by the gas state parameters in the external environment. The corresponding functions are presented as follows:
In the above functions, λ indicates the velocity coefficient, which is calculated by the following functions:
ε(λ) and π(λ) are calculated as follows:
2.3. The Thermal Modeling
In Equation (5), Q represents the discharge heating power and the thermal energy loss. The discharge heating power can be represented by Ohm heating easily. The thermal energy loss through the wall and the electrode is modeled based on the lumped capacitance method.
The heat transfer process in the PSJA is shown in Figure 3. Firstly, by forced convection, the heat transfers from the chamber gas to the shell inner wall. Secondly, by heat conduction through the electrodes and shell wall, the heat transfers from the shell inner wall to the shell outer wall. Thirdly, by natural convection, the heat transfers from the shell outer wall to the external air.
Similar to the electric circuit, the heat transfer process can be described as a thermal circuit, as shown in Figure 4. Tc, Tw,in, Tw,out, and T∞ indicate the temperature of chamber gas, shell inner wall, shell outer wall, and external air, respectively. Rin, Re, Rw, and Rout represent the thermal resistance of force convection, electrode conduction, shell conduction, and natural convection. Cw represents the thermal capacitance of the shell.
Based on the theory of engineering thermal transmission, the thermal resistance of force convection, electrode conduction, and natural convection is given as follows.
The structure of the shell wall is complex, and is regarded as a combination of three simple structures, as shown in Figure 5. The upper structure of the shell is seen as a single wall. The middle structure of the shell is seen as a single hollow cylinder wall. The subjacent structure of the shell is also seen as a single wall. The thermal resistance of the three structures is given as follows.
The total thermal resistance of the shell wall is calculated as Equation (18).
With all of the circuit components defined, the differential function obtained from the circuit shown in Figure 4 is used to solve for the wall temperature.
Hence, combined with the discharge heating source, the parameter Q in Equation (10) is given.
It must be pointed out that the energy calculated directly using Ohm heating theory is not the heating energy. The sheath energy loss and radiation energy loss must be taken into consideration. Based on the analysis of Guillaume Dufour [19], a heating efficiency of 50% is adopted.
2.4. Model Validation
To validate the model’s reliability and accuracy, simulation results with ANSYS CFX software are compared with the results calculated from the PSJA aerodynamic model. The computation mesh created by ANSYS ICEM is fully structured, and the boundary type is labeled in Figure 6. The actuator geometry parameters are shown in Figure 7.
The solver is coupled and fully implicit with 2nd order accuracy in both time and space. A variable time step is used, which begins with 5 ns and is increased gradually to 1 μs in the simulation. Considering the high turbulent vortex produced by PSJA, the SST turbulent model is chosen. The heating power is coupled into the Navier-Stokes equations as a heat source and expressed by a CFX expression. As the purpose of this step is only to validate the PSJA model, the discharge heating source is simplified as a constant value, as shown in Equation (21). Qh is the total heating energy; 0.005 J is adopted. T is the heating time; 100 ns is chosen. V is the volume of the chamber; approximately 88e−9 m−3. Additionally, it is assumed the actuator is uniformly heated in this simulation.
The jet velocity at the throat outlet calculated by the ANSYS CFX and PSJA aerodynamic model is shown in Figure 8a. The results obtained from the CFX with different grid number agree well. Therefore, the grid convergence has been reached in CFX. Moreover, the small difference in the results using different turbulent models suggests that the results are not sensitive to the turbulent model. The value obtained by ANSYS CFX is 141 m/s, and the value obtained by the PSJA model is 143 m/s. The difference is only 2 m/s. The disparity of jet termination time is also little, less than 3%. The value obtained by ANSYS CFX is 269 μs, and the value obtained by the PSJA model is 275 μs. The history of gauge pressure in the chamber obtained by the two methods is also similar, as shown in Figure 8b. Overall, the PSJA model can simulate the actuator characteristic with great accuracy.
3. Results and Discussion
3.1. The Discharge Energy and Discharge Efficiency
Based on the multichannel discharge technique, the discharge channel number can be increased greatly. When the energy stored in the discharge capacitor is fixed, the energy deposited in each channel varies with the discharge channel number. As energy is a critical factor determining the performance of the PSJA, the energy characteristic is first investigated.
The discharge capacitor is set as 10 nF, and the initial voltage is set as 6 kV. The discharge voltage of each electrode couple is set as 4 kV. The inductance is 1.65 μH. The sum of wire resistance and the equivalent serial resistance of the capacitor are chosen as 1.89 Ω. The discharge voltage and current waveforms with channel numbers of 1, 5, 10, and 20 are simulated. Based on the current and resistance of each discharge channel, the discharge power and discharge energy can be obtained.
The discharge voltage and current waveforms with different actuator numbers are plotted in Figure 9. As described in [16], the breakdown of each electrode couple happens in sequence, the time to form a complete discharge channel increases with the growth of the actuator number. What’s more, with the increase in the actuator number, the total length of the discharge channel is enlarged, leading to the growth of plasma resistance. As a result, the discharge current decreases. The deposited energy in each actuator ought to decrease.
The energy deposition power and the discharge energy in the first PSJA are obtained from the simulation results, as shown in Figure 10. The energy deposition power (Pdeposition), and discharge energy (Qdischarge) are defined in Equation (22). With the increase in the actuator number, the energy deposition power decreases. However, as shown in Figure 10b, the deposited energy doesn’t decrease linearly. Since the gap distance between electrodes in all actuators is the same, and the actuator works in series, the resistance of the plasma channel in each actuator can be considered as the same. The discharge energy in each actuator can be expressed as Equation (23), where Q is the energy stored in the capacitor, Rarc indicates the resistance of plasma channel, n is the actuator number, and R0 is the external resistance in the discharge circuit. Therefore, if the actuator number increases, the deposited energy in one actuator doesn’t decrease linearly. When the actuator number increases from 1 to 20, the deposited energy in the first actuator decreases 76.7% instead of 95%. In this way, the total energy deposited in all actuators increases, as shown in Figure 11. This means more energy stored in the capacitor is released in the discharge channel, leading to the improvement of discharge efficiency ηd, which is defined in Equation (24).
Figure 12 shows the deposited energy in each actuator with different actuator numbers. This figure shows that in this multichannel discharge mode, the deposited energy in a different actuator is almost the same. The coefficient of variation with 5, 10, and 20 actuators is 3.8%, 3.32%, and 4.77%, respectively. Based on the previous research [18], the breakdown of the electrode couple in each actuator happens in sequence. Coupled with the results shown in Figure 12, it concludes that although the time when the breakdown of the electrode couple in each actuator happens is different, the deposited energy is the same. The breakdown order has little influence on the deposited energy.
3.2. The Characteristics of a Composition of PSJA Array
As shown in Figure 12, with the increase in the actuator number, the energy deposited in a single actuator decreases. As a result, the performance of the actuator ought to slow down. The history of jet velocity and gas density at the throat outlet is shown in Figure 13a,b, respectively. Obviously, the jet velocity and duration decreases with the increase in the actuator number. However, the gas density at the throat outlet increases with the increase of actuator number. As the gas kinetic energy is proportional to the gas density, the growth of gas density benefits the gas kinetic energy.
The jet peak velocity, duration time, and mass ejected with different numbers of PSJA are calculated and results are as shown in Figure 14a. The peak velocity is defined as the maximum velocity at the throat outlet. The definition of the jet duration time can be found in Figure 8a. The mass ejected means the total mass of gas left in the PSJA chamber throughout the ejection process. These parameters decrease with the increase in the actuator number, but the rate at which they decline slows. These parameters are normalized by dividing the value with that of only one actuator, as shown in Figure 14b. This figure shows that the mass ejected is greatly influenced by the actuator. The influence of actuator number on jet duration time is weakest compared with the other two parameters. When the actuator increases to 20, the jet duration time decreases by 33%, while the peak velocity and mass ejected decrease by 54% and 62%, respectively.
The jet kinetic energy can be calculated as shown in Equation (25), where ρo(t) and u(t) are the jet density and velocity at the throat outlet face; At indicates the throat outlet area; Tjet represents the jet duration time. The variation of jet kinetic energy of a single actuator with actuator numbers is shown in Figure 15. As it is proportional to the third power of the velocity, the kinetic energy decreases quickly with the increase in the actuator number. When the actuator number increases to 20, the jet kinetic energy decreases by 92%.
3.3. The Energy Characteristics of PSJA Array
The total kinetic energy of all actuators is calculated using Equation (26), which varies with the actuator number, as shown in Figure 16. In Equation (26), k is the concrete actuator; and n is the number of PSJA actuators in the PSJA array. Firstly, the total kinetic energy increases with the number of actuators. Then it begins to decrease, suggesting that the maximum total kinetic energy is not necessarily produced by the array containing more PSJAs and an optimal number of PSJAs exists. The characteristic of total kinetic energy is different from that of the total discharge energy, as shown in Figure 11, which will be investigated below.
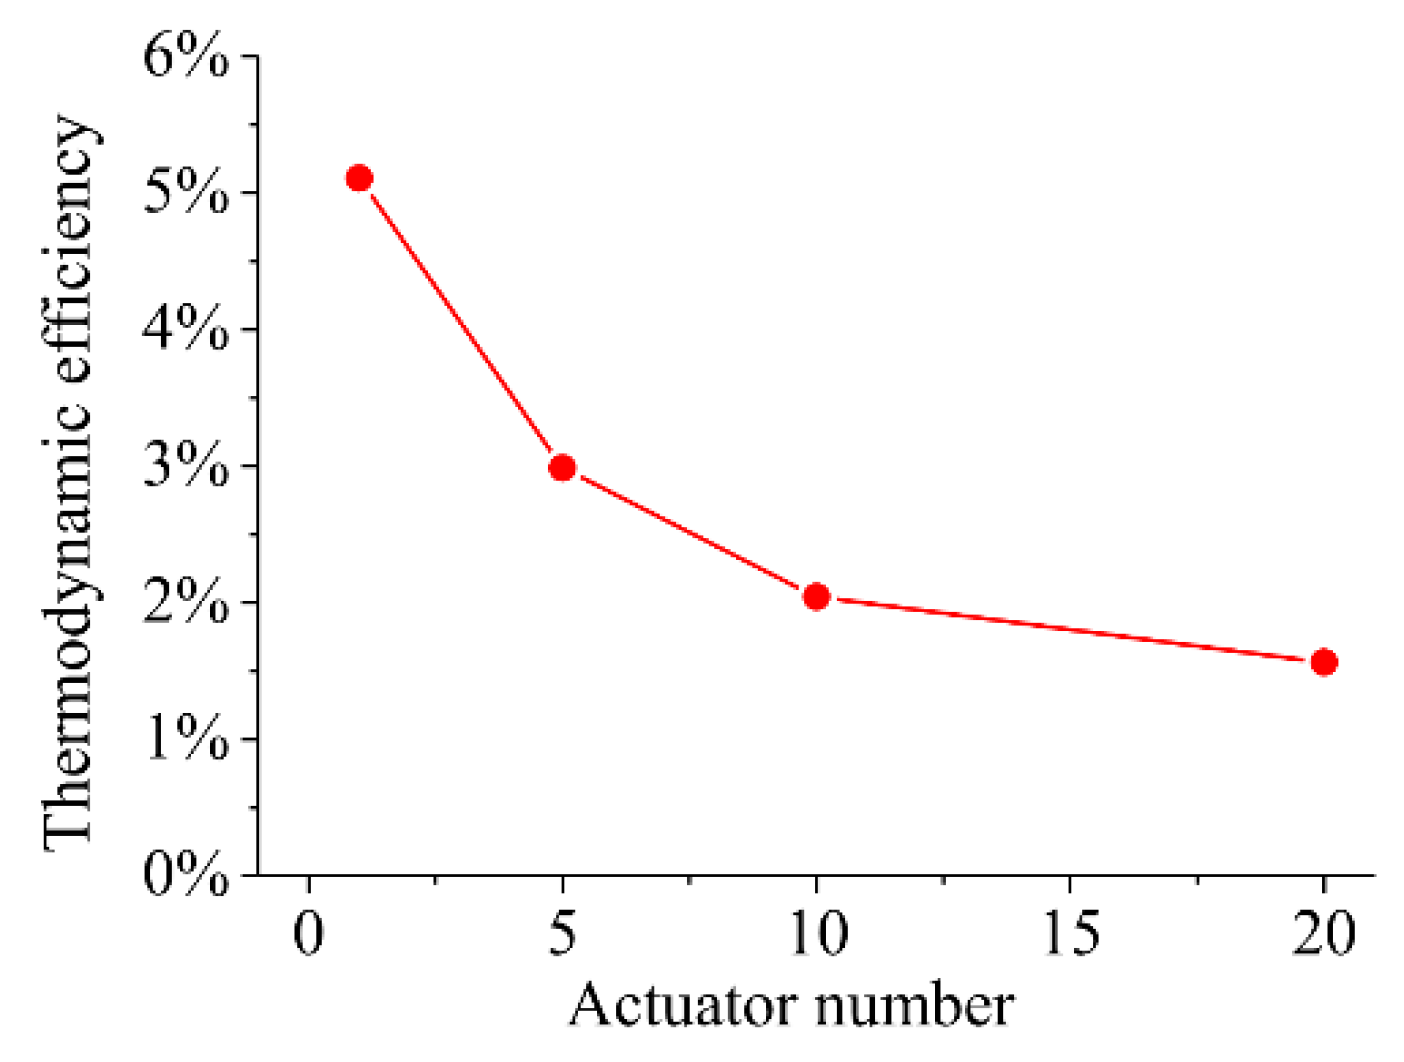
In the whole working process of the actuator, the energy stored in the capacitor transforms to the kinetic energy indirectly, as shown in Figure 17. The thermodynamic recycle efficiency ηt is defined in Equation (27) follows. The variation of ηt with different actuator number is shown in Figure 18. As the actuator number increases, the energy deposited in an actuator decreases. Based on the research results of Zong et al. [26], the thermodynamic efficiency decreases with the decrease of heating energy. With the increase of actuator number, the heating energy decreases. Therefore, the thermodynamic efficiency decreases when there are more PSJAs. As a result, the total gas kinetic energy doesn’t always increase with an increase of actuator number.
3.4. The Influence of Extra Resistance
It is observed that the total extra resistance, including the wire resistance and the equivalent serial resistance of the discharge capacitor, affects the performance of the PSJA array greatly. In this part, these factors are studied. The extra resistance is set as 0.1 Ω and 10 Ω in case 1 and case 2 respectively.
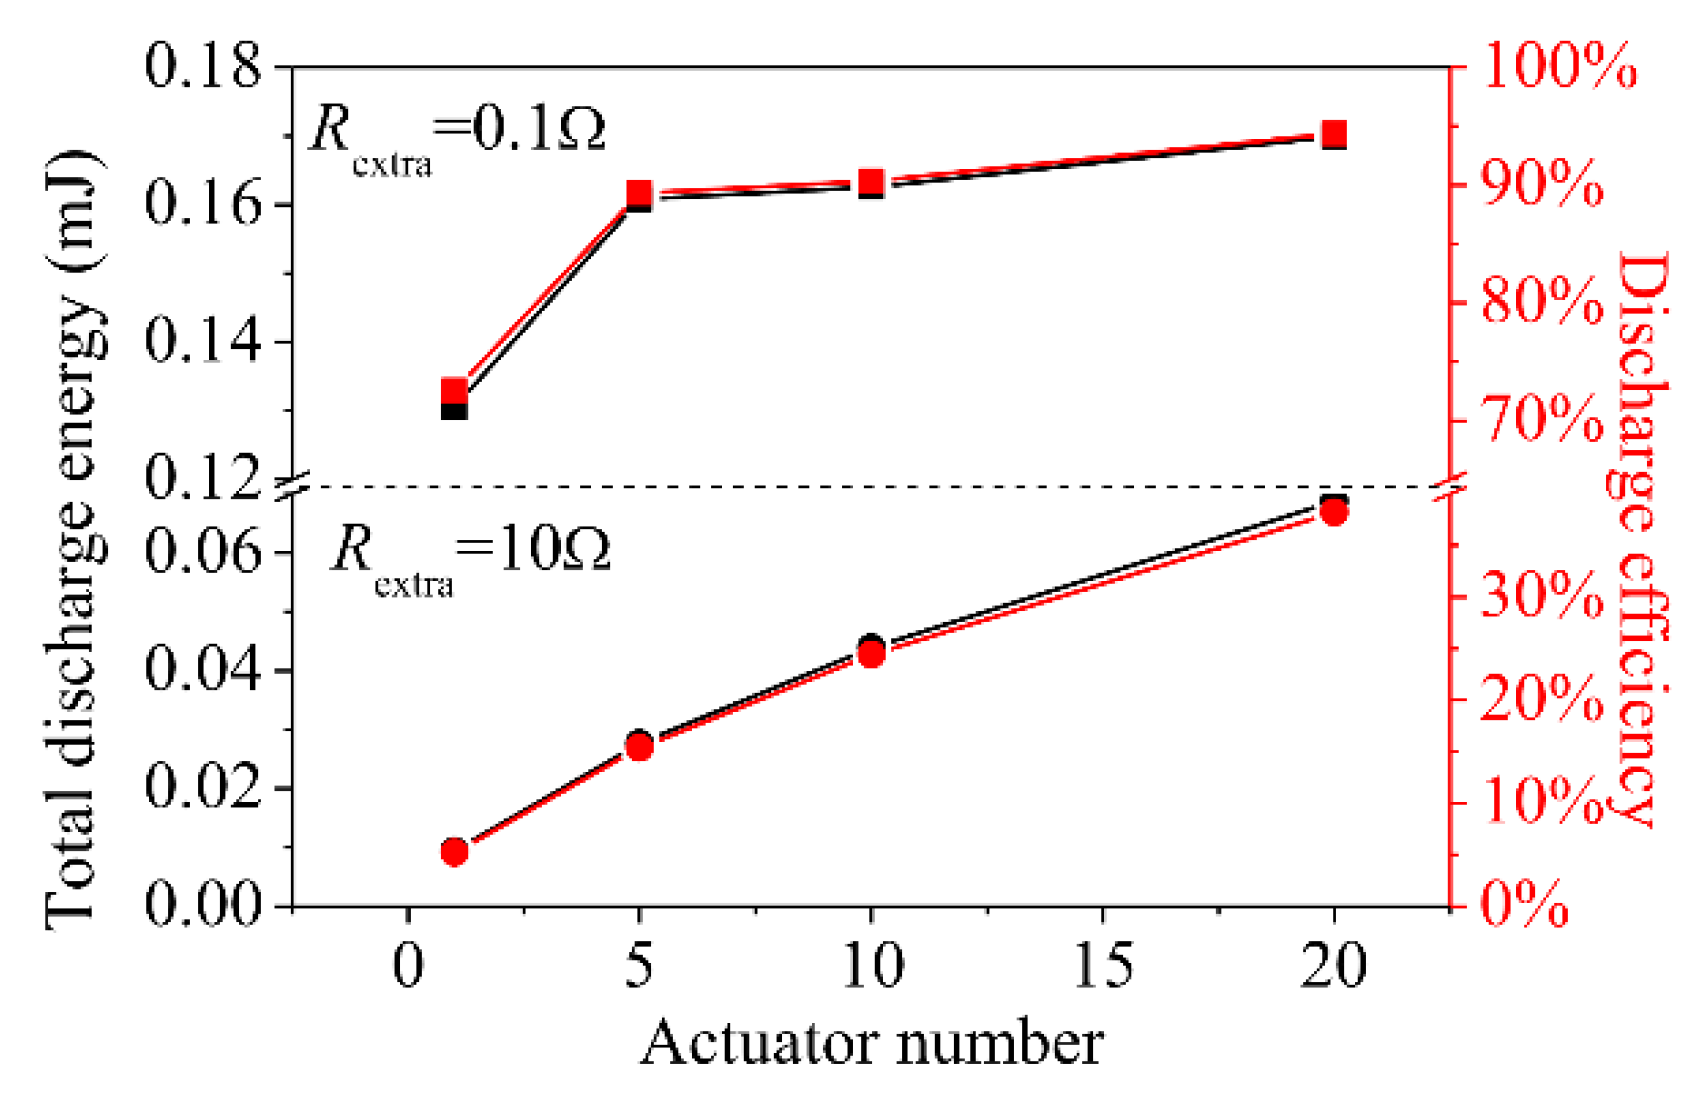
The total discharge energy and discharge efficiency versus actuator number with different extra resistance are shown in Figure 19. In case 1, the extra resistance is only 0.1 Ω, and the discharge efficiency of one actuator is 72%. In contrast, the discharge efficiency of one actuator in case 2 (larger extra resistance) is as low as 5%. With the increase in the actuator number, the discharge efficiency in the two cases increases. However, the increased levels are different. When the actuator number increases to 20, the discharge efficiency in case 1 increases to 94%, which is 30% larger than the initial discharge efficiency (72%). But in case 2, the discharge efficiency increases to 38%, which is almost six times larger than the initial discharge efficiency (5%).
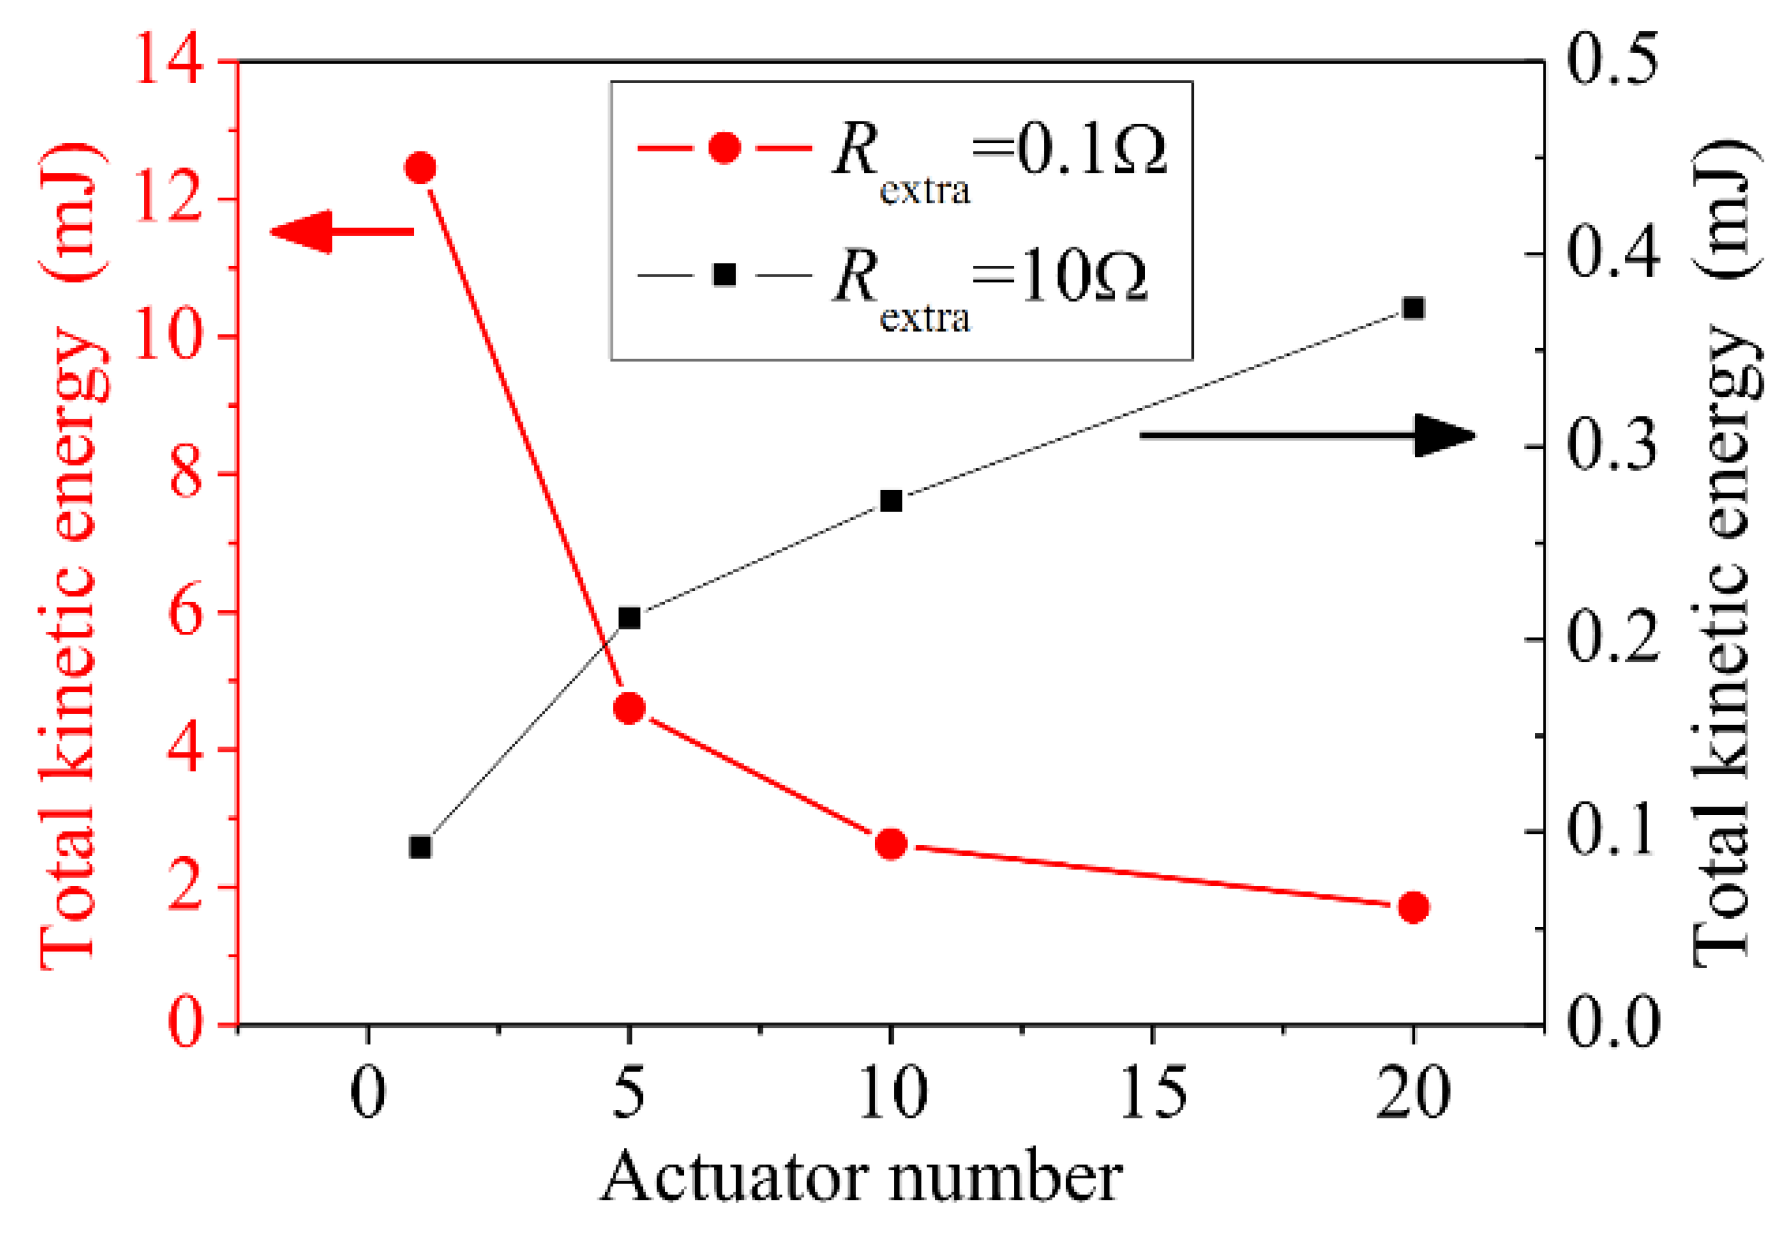
The variation of total gas kinetic energy with actuator number under different extra resistance is shown in Figure 20. The revealed trends are completely different when different extra resistance is used. In case 1, the total gas kinetic energy decreases with the increase in the actuator number. However, in case 2, the opposite trend happens. Instead of decreasing, the total kinetic energy increases when more actuators are used. In case 2, the total gas kinetic energy with 20 actuators is nearly four times of that with one actuator.
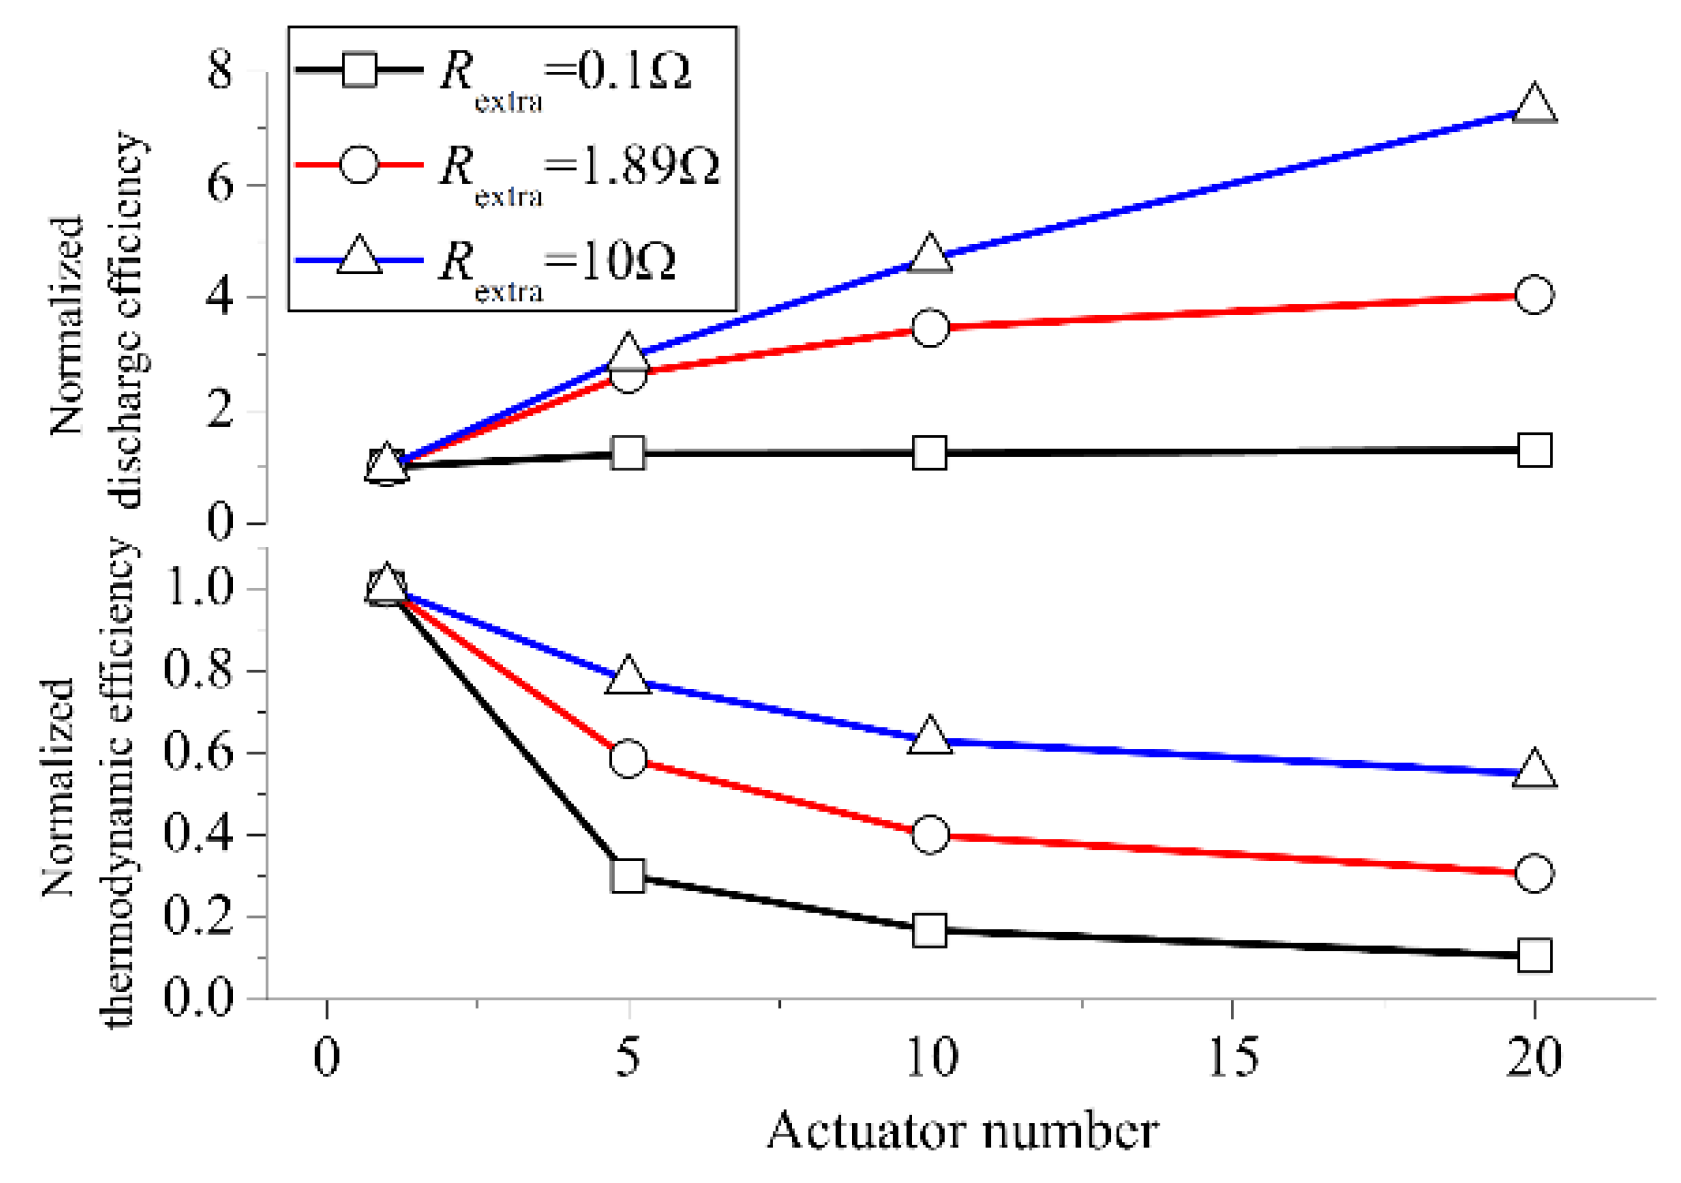
The reason for the distinctive variations revealed in Figure 20 is given as follows. The discharge efficiency increases with actuator number, but the thermodynamic efficiency decreases, while the variation speed is different. The discharge efficiency and thermodynamics efficiency with different actuator numbers are normalized by that with only one actuator, as shown in Figure 21. The larger the extra resistance is, the larger the increase in the discharge efficiency is, and the smaller the decrease in the thermodynamic efficiency is. As a result, with a large extra resistance, the total efficiency grows with the increase in the actuator number. However, with a small extra resistance, the total efficiency decreases with the increase in the actuator number.
In conclusion, when the extra resistance is large, the energy efficiency of the PSJA array is higher than that of conventional PSJA. Actually, in the practical application, the extra resistance is relatively large. In the experiment on control of the shock boundary layer interaction using PSJA by Greene et al. [27], a resistance (max 1.5 kΩ) is adopted in the discharge circuit. In the experiment of Narayanaswamy et al. [26,28,29], a ballast resistance is also adopted in the discharge circuit. In the experiment of Jichul Shin [30,31], a ballast resistance (max several kilo Ohm) is adopted in the discharge circuit as well. Therefore, there is reason to believe the PSJA array driven by the multichannel discharge technology can play an important role in the practical flow control application.
4. Conclusions
In this paper, based on the electronic theory, the conservation equations of mass, momentum, energy, and the lumped capacitance method, the multichannel discharge model, and plasma synthesis jet actuator model are put forward. Coupled with the two models, an analytical model to simulate the characteristics of the PSJA array is developed. Based on this model, the influence of actuator number in the PSJA array is investigated. The main conclusions are as follows.
With the increase in the actuator number, the discharge energy in a single actuator decreases. As a result, the jet strength induced by a single actuator decreases. When the actuator number increases from 1 to 20, the weakening extent of mass ejected, peak jet velocity, and jet duration time is 62%, 54%, and 33%, respectively. Therefore, the influence of the actuator number on the jet duration time is the weakest.
As the actuator increases, the discharge efficiency and thermodynamic efficiency show different tendencies. The discharge efficiency increases, while the thermodynamic efficiency decreases. As a result, the total energy efficiency doesn’t always increase with the increase in the actuator number. However, in practical application, the extra resistance in the discharge circuit is large (to the order of kilo Ohms), and the discharge efficiency of one channel discharge is low. Therefore, it can be concluded that the PSJA array is more suitable to the practical application.
Author Contributions
Formal analysis, H.S.; Investigation, S.Z.; Supervision, Z.Z. and S.H.; Validation, W.Y. and L.Y.
Funding
This research was funded by the National Natural Science Foundation of China (91541120, 91641204, and 51790511) and Royal Society (IE150612).
Conflicts of Interest
The authors declare no conflicts of interest.
References
- Corke, T.C.; Post, M.L.; Orlov, D.M. Single dielectric barrier discharge plasma enhanced aerodynamics: physics, modeling and applications. Exp. Fluids 2008, 46, 1–26. [Google Scholar] [CrossRef]
- Little, J.; Samimy, M. High-lift airfoil separation with dielectric barrier discharge plasma actuation. AIAA J. 2010, 48, 2884–2898. [Google Scholar] [CrossRef]
- Saddoughi, S.; Bennett, G.; Boespflug, M.; Puterbaugh, S.L.; Wadia, A.R. Experimental investigation of tip clearance flow in a transonic compressor with and without plasma actuators. J. Turbomach. 2014, 137, 041008. [Google Scholar] [CrossRef]
- Jothiprasad, G.; Murray, R.C.; Essenhigh, K.; Bennett, G.A.; Saddoughi, S.; Wadia, A.; Breeze-Stringfellow, A. Control of tip-clearance flow in a low speed axial compressor rotor with plasma actuation. J. Turbomach. 2012, 134, 021019. [Google Scholar] [CrossRef]
- Webb, N.; Clifford, C.; Samimy, M. Control of oblique shock wave/boundary layer interactions using plasma actuators. Exp. Fluids 2013, 54, 1545. [Google Scholar] [CrossRef]
- Narayanaswamy, V.; Raja, L.L.; Clemens, N.T. Control of unsteadiness of a shock wave/turbulent boundary layer interaction by using a pulsed-plasma-jet actuator. Phys. Fluids 2012, 24, 076101. [Google Scholar] [CrossRef]
- Santhanakrishnan, A.; Jacob, J. Characterization of linear plasma synthetic jet actuators. In Proceedings of the 46th AIAA Aerospace Sciences Meeting and Exhibit, Reno, NV, USA, 7–10 January 2008. [Google Scholar]
- Santhanakrishnan, A.; Reasor, D.A.; LeBeau, R.P. Characterization of linear plasma synthetic jet actuators in an initially quiescent medium. Phys. Fluids 2009, 21, 043602. [Google Scholar] [CrossRef]
- Santhanakrishnan, A.; Jacob, J. Effect of plasma morphology on flow control using plasma synthetic jet actuators. In Proceedings of the 45th AIAA Aerospace Sciences Meeting and Exhibit, Reno, NV, USA, 8–11 January 2007. [Google Scholar]
- Cybyk, B.; Wilkerson, J.; Simon, D. Enabling high-fidelity modeling of a high-speed flow control actuator array. In Proceedings of the 14th AIAA/AHI Space Planes and Hypersonic Systems and Technologies Conference, Canberra, Australia, 6–9 November 2006. [Google Scholar]
- Caruana, D.; BARRICAU, P.; Hardy, P. The “Plasma Synthetic Jet” Actuator. Aero-thermodynamic characterization and first flow control applications. In Proceedings of the 47th AIAA Aerospace Sciences Meeting including The New Horizons Forum and Aerospace Exposition, Orlando, FL, USA, 5–8 January 2009. [Google Scholar]
- Caruana, D.; Barricau, P.; Gleyzes, C. Separation control with plasma synthetic jet actuators. Int. J. Aerodyn. 2013, 3, 71. [Google Scholar] [CrossRef]
- Caruana, D.; Rogier, F.; Dufour, G.; Gleyzes, C. The plasma synthetic jet actuator, physics, modeling and flow control application on separation. AerospaceLab 2013, 1–13. [Google Scholar]
- Raizer, Y.P. Gas Discharge Physics; Springer: Berlin, Germany, 1991; pp. 1–449. [Google Scholar]
- Schavemaker, P.H.; Van der Slui, L. An improved mayr-type arc model based on current-zero measurements [circuit breakers]. IEEE Trans. Power Delivery 2000, 15, 580–584. [Google Scholar] [CrossRef]
- Samimy, M.; Bridges, J. Flow and noise control in high speed and high reynolds number jets using plasma actuators. In Proceedings of the 3rd AIAA Flow Control Conference, San Francisco, CA, USA, 5–8 June 2006. [Google Scholar]
- Zhang, Z.; Wu, Y.; Jia, M.; Song, H.; Sun, Z.; Zong, H.; Li, Y. The multichannel discharge plasma synthetic jet actuator. Sens. Actuators A Phys. 2017, 253, 112–117. [Google Scholar] [CrossRef] [Green Version]
- Zhang, Z.; Wu, Y.; Jia, M.; Song, H.; Sun, Z.; Li, Y. Mhd-rlc discharge model and the efficiency characteristics of plasma synthetic jet actuator. Sens. Actuators A 2017, 261, 75–84. [Google Scholar] [CrossRef]
- Huang, S.; Wu, Y.; Song, H.; Zhu, J.; Zhang, Z.; Song, X.; Li, Y. Experimental investigation of multichannel plasma igniter in a supersonic model combustor. Exp. Therm Fluid Sci. 2018, 99, 315–323. [Google Scholar] [CrossRef]
- Grossman, K.R.; Cybyk, B.Z.; VanWie, D.M. Sparkjet actuators for flow control. In Proceedings of the 41st Aerospace Sciences Meeting and Exhibit, Reno, NV, USA, 6–9 January 2003. [Google Scholar]
- Haack, S.; Taylor, T.; Emhoff, J.; Cybyk, B. Development of an analytical sparkjet model. In Proceedings of the 5th Flow Control Conference, Chicago, IL, USA, 28 June–1 July 2010. [Google Scholar]
- Zong, H.; Wu, Y.; Li, Y.; Song, H.; Zhang, Z.; Jia, M. Analytic model and frequency characteristics of plasma synthetic jet actuator. Phys. Fluids 2015, 27, 027105. [Google Scholar] [CrossRef]
- Zhang, Z.; Wu, Y.; Jia, M.; Song, H.; Sun, Z.Z.; Li, Y.H. Modeling and optimization of the multichannel spark discharge. Chin. Phys. B 2017, 26, 244–253. [Google Scholar] [CrossRef]
- Shin, J. Characteristics of high speed electro-thermal jet activated by pulsed dc discharge. Chin. J. Aeronaut. 2010, 23, 518–522. [Google Scholar] [CrossRef]
- Sary, G.; Dufour, G.; Rogier, F.; Kourtzanidis, K. Modeling and parametric study of a plasma synthetic jet for flow control. AIAA J. 2014, 52, 1591–1603. [Google Scholar] [CrossRef]
- Zong, H.; Wu, Y.; Song, H.; Jia, M. Efficiency characteristic of plasma synthetic jet actuator driven by pulsed direct-current discharge. AIAA J. 2016, 54, 3409–3420. [Google Scholar] [CrossRef]
- Martin, T.H. An empirical formula for gas switch breakdown delay. In Proceedings of the 7th Pulsed Power Conference, Monterey, CA, USA, 11–14 June 1989. [Google Scholar]
- Dufour, G.; Hardy, P.; Quint, G.; Rogier, F. Physics and models for plasma synthetic jets. Int. J. Aerodyn. 2013, 3, 47. [Google Scholar] [CrossRef]
- Greene, B.; Clemens, N.; Micka, D. Control of shock boundary layer interaction using pulsed plasma jets. In Proceedings of the 51st AIAA Aerospace Sciences Meeting including the New Horizons Forum and Aerospace Exposition, Grapevine, TX, USA, 7–10 January 2013. [Google Scholar]
- Narayanaswamy, V.; Raja, L.L.; Clemens, N.T. Control of a shock/boundary-layer interaction by using a pulsed-plasma jet actuator. AIAA J. 2012, 50, 246–249. [Google Scholar] [CrossRef]
- Narayanaswamy, V.; Clemens, N.; Raja, L. Investigation of a pulsed-plasma jet for shock/boundary layer c cntrol. In Proceedings of the 48th AIAA Aerospace Sciences Meeting Including the New Horizons Forum and Aerospace Exposition, Orlando, FL, USA, 4–7 January 2010. [Google Scholar]
Figure 1.
The structure of plasma synthetic jet actuator (PSJA).

Figure 2.
The schematic diagram of the two working stages of PSJA.

Figure 3.
The schematic diagram of the heat transfer process.

Figure 4.
Electrical representation of the thermal heat transfer process.

Figure 5.
The disassembly structure of the shell wall.

Figure 6.
Computation grid.

Figure 7.
The geometry parameters of actuator.

Figure 8.
The comparison between the CFD results and model results. (a) is the jet velocity at the throat outlet and (b) is the gauge pressure in the chamber.
Figure 8.
The comparison between the CFD results and model results. (a) is the jet velocity at the throat outlet and (b) is the gauge pressure in the chamber.

Figure 9.
The discharge waveforms with different actuator numbers. (a) shows the the voltage waveforms and (b) shows the current waveforms.
Figure 9.
The discharge waveforms with different actuator numbers. (a) shows the the voltage waveforms and (b) shows the current waveforms.

Figure 10.
The discharge characteristics with different actuator numbers. (a) is the energy deposition power and (b) is the discharge energy in one actuator.
Figure 10.
The discharge characteristics with different actuator numbers. (a) is the energy deposition power and (b) is the discharge energy in one actuator.

Figure 11.
The total discharge energy and discharge efficiency versus actuator number.

Figure 12.
The deposited energy in each actuator versus actuator number.

Figure 13.
The history of gas velocity and gas density at the throat outlet versus actuator number. (a) is the gas velocity and (b) is the gas density.
Figure 13.
The history of gas velocity and gas density at the throat outlet versus actuator number. (a) is the gas velocity and (b) is the gas density.

Figure 14.
The gas parameters versus actuator number. (a) is the real value and (b) is the normalized value.
Figure 14.
The gas parameters versus actuator number. (a) is the real value and (b) is the normalized value.

Figure 15.
The gas kinetic energy versus actuator number.

Figure 16.
The total gas kinetic energy versus actuator number.

Figure 17.
The total gas kinetic energy versus actuator number.

Figure 18.
The thermodynamic efficiency versus actuator number.

Figure 19.
The total discharge energy and efficiency versus actuator number with different extra resistance.
Figure 19.
The total discharge energy and efficiency versus actuator number with different extra resistance.

Figure 20.
The total gas kinetic energy versus actuator number with different extra resistance.

Figure 21.
The normalized discharge efficiency and normalized thermodynamic efficiency versus actuator number with different extra resistance.
Figure 21.
The normalized discharge efficiency and normalized thermodynamic efficiency versus actuator number with different extra resistance.

© 2018 by the authors. Licensee MDPI, Basel, Switzerland. This article is an open access article distributed under the terms and conditions of the Creative Commons Attribution (CC BY) license (http://creativecommons.org/licenses/by/4.0/).
Share and Cite
MDPI and ACS Style
Huang, S.; Zhang, Z.; Song, H.; Wu, Y.; Sun, Z.; Li, Y. Analytic Model and the Influence of Actuator Number on the Performance of Plasma Synthetic Jet Actuator Array. Appl. Sci. 2018, 8, 1534. https://doi.org/10.3390/app8091534
AMA Style
Huang S, Zhang Z, Song H, Wu Y, Sun Z, Li Y. Analytic Model and the Influence of Actuator Number on the Performance of Plasma Synthetic Jet Actuator Array. Applied Sciences. 2018; 8(9):1534. https://doi.org/10.3390/app8091534
Chicago/Turabian StyleHuang, Shengfang, Zhibo Zhang, Huimin Song, Yun Wu, Zhengzhong Sun, and Yinghong Li. 2018. "Analytic Model and the Influence of Actuator Number on the Performance of Plasma Synthetic Jet Actuator Array" Applied Sciences 8, no. 9: 1534. https://doi.org/10.3390/app8091534
Note that from the first issue of 2016, this journal uses article numbers instead of page numbers. See further details here.