Bearing Capacity Model of Corroded RC Eccentric Compression Columns Based on Hermite Interpolation and Fourier Fitting


1
School of Civil Engineering, Chongqing Jiaotong University, Chongqing 400074, China
2
School of Civil Engineering, Chongqing University, Chongqing 400045, China
3
School of Engineering, University of Guelph, Guelph, ON N1G 2W1, Canada
4
Chongqing Yapai Bridge Engineering Quality Inspection Co., Ltd., Chongqing 401120, China
*
Authors to whom correspondence should be addressed.
Appl. Sci. 2019, 9(1), 24; https://doi.org/10.3390/app9010024
Submission received: 3 December 2018
/
Revised: 14 December 2018
/
Accepted: 16 December 2018
/
Published: 21 December 2018
Abstract
:With an extension in service years, bridges inevitably suffer from performance deterioration. Columns are the main components of bridge structures, which support the superstructure. The damage of pier columns is often more harmful to bridges than that of other components. To accurately evaluate the time-varying characteristics of corroded columns, this paper proposes a new model for the bearing capacity evaluation of deteriorated reinforced concrete (RC) eccentric compression columns based on the Hermite interpolation and Fourier function. Firstly, the axial compression point, the pure bending point and the balanced failure point were selected as the basic points, and the deteriorated strength of these basic points was calculated by considering factors such as concrete cracking, reduction of reinforcement area, buckling of the steel bar, bond slip and strength reduction of confined concrete. After that, the interpolation points were generated by a piecewise cubic Hermite interpolating polynomial, and the explicit expression of the interpolation points fitting function was realized by the trigonometric Fourier series model. Finally, comparison studies based on measured data from forty-five corroded RC eccentric compression columns were conducted to investigate the accuracy and efficiency of the proposed method. The results show that: (1) the prediction results for bearing capacity of corroded RC columns are in good agreement with the measured data, with the average ratio of predicted results to test results at 1.06 and the standard deviation at 0.14; (2) the proposed model unifies the three stress states of axial compression, eccentric compression and pure bending, and is consistent with the continuum mechanics characteristics; (3) the decrements of axial load carrying capacity for 10% and 50% of the corrosion rate are 31.4% and 45.2%, while in flexure they are 25.4% and 77.4%, respectively; and (4) the test data of small-scale specimens may overestimate the negative effect of corrosion on the bearing capacity of actual structures. The findings in this paper could lay a solid starting point for structural life prediction technologies based on nondestructive testing.
1. Introduction
As the key node of interoperability of traffic systems, the bridge is a vital guarantee for the development of the economy and social safety [1]. However, the problem of deterioration of bridge structures has become acute as time goes on [2,3,4]. According to the Federal Highway Administration report, nearly 40% of the 61,5002 bridges in the United States have been in service for more than 50 years by the end of 2017, and 54,560 bridges are defective [5]. The capital requirement for repairing these bridges is over $123 billion. Similarly, the safety situation of bridges in China is not optimistic. At present, about 13% of bridges in China have serious problems caused by structural damage and natural deterioration [6]. Steel corrosion is recognized as one of the most severe deterioration factors that affect the durability of reinforced concrete (RC) bridges. Thus, the research on bearing capacity time-varying evolution of corroded structures is of great scientific significance and engineering application value in order to determine the operation status of existing bridges, as well as reduce the maintenance costs.
The multiple effects of reinforcement corrosion on structures mainly include three aspects, that is, the deterioration of reinforcement performance [7], the concrete cover cracking and spalling [8], and the failure of the bonding mechanism between concrete and reinforcement [9]. Many studies have taken into account the above effects on the capacity assessment, such as nondestructive testing methods, which can use direct approaches, e.g., Mak et al. [10] and Bossio et al. [11] investigated the correlation between corrosion-induced surface crack width and level of internal corrosion; or indirect methods, e.g., Bossio et al. [12] examined the corrosion effects on the seismic capacity of reinforced concrete structures, which often requires a transition from material damage to structural performance degradation.
In bridge structures, eccentric compression members such as piers and main arches often act as the crucial bearing units. The damage of these eccentric compression members is often more unacceptable than that of other components. AASHTO 2011 (American code) [13] and JTG/T J21-2011 (Chinese code) [14] provide the evaluation methods for existing bridges, which are introduced briefly in Appendix A and Appendix B. However, in the methods provided, the deteriorated resistance of serving RC bridges is simulated as a product of initial resistance and deterioration coefficients. The deterioration coefficients depend on detection data, which reflect the geometric characteristics, damage status and state parameters. Although the deterioration coefficients are quantified by a fixed rating table, the calculation process is still descriptive. The calculation results inevitably include the effects of the subjectivity of state rating and uncertainty of weight division. There is still a certain gap between the descriptive assessment and quantitative evaluation in the practical engineering application.
To quantitatively evaluate the time-varying characteristics of the corroded RC columns bearing capacity, experimental research [15,16,17] has been carried out. Moreover, the bearing capacity models of corroded RC columns have been developed, which can be generally classified into two categories. One is the piecewise calculation method, which divides RC eccentric compression columns into an axial column, small eccentric compression column and large eccentric compression column. According to the different stress state of the components, the formulas for calculating the bearing capacity of corroded RC columns are segregated. For example, Xia et al. [18] examined the relationships between the average cross-sectional area loss of the steel bar, the average and maximum crack widths of concrete cover, and the strength loss of the RC columns, and proposed the load-carrying capacity model of large eccentric and small eccentric columns, respectively. Li et al. [19] built an analytical framework regarding the strength of a uniaxial short column considering the concrete cover spalling, reduction of concrete strength and supporting role of stirrup to longitudinal reinforcement caused by a corrosion stirrup. According to the process of concrete cracking induced by the longitudinal rebar corrosion, Zhang et al. [20] divided the bearing capacity degeneration into three stages: pre-cracking, cracking and splitting, and the assessment model of the bearing capacity for the small eccentric compressive members was established, considering the biaxial stress condition in the stage of pre-cracking, the shear-tensile stress condition in the stage of cracking and the failure of the cover in the stage of splitting. Such models focus on the mechanism of materials deterioration on the structure under a single mechanical state. The essence is to modify the residual strength of a dangerous section under the specific eccentricity, which keeps good consistency with the calculation formulas for uncorroded members. In fact, the eccentric compression component is a member carrying both the bending moment and axial force. The effect of the axial force and bending moment is mutually restrictive. When the axial force is given, there is a unique bending moment corresponding to it [21]. A continuous moment–axial force (M–N) curve is the complete expression of the bearing capacity of members whose geometrical dimensions and physical properties are determined. The second type is the model based on the M–N curve. Tapan et al. [22,23] presented a bridge pier column strength evaluation method utilizing a numerical procedure based on the layer method. The method uses damaged material properties, and accounts for amount of corrosion and exposed bar length for each reinforcement, concrete loss, bond failure, and type of stresses in the corroding reinforcement. Guo et al. [24] established a numerical model to obtain a time-varying moment–axial domain of sound and corroded bridge piers by discretizing the cross-sections into a series of fiber cells. Akiyama et al. [25] built a semi-quantitative assessment framework for the interaction diagrams development using a simplified nonlinear finite element method. Campione et al. [26] developed a simplified model to calculate the interaction diagrams of RC columns subjected to corrosion processes, which was constituted by three branches and four points. Compared to the single point calculation mode of the first type models, an M–N curve formed by multi-points connection can more comprehensively and intuitively reflect the corrosion effect on the degradation of bearing capacity of components under different loading conditions. However, how to construct the M–N curve of corroded members has not yet reached a unified consensus. More work is required to further understand and improve the bearing capacity evaluation method of RC components.
This paper mainly focuses on the bearing capacity evaluation method for corroded RC columns based on M–N curves. With consideration of the mathematical thoughts in [27,28], a new federated bearing capacity evaluation method is established by integrating Hermite interpolation and Fourier fitting, which unifies the three stress states of axial compression, eccentric compression and pure bending. Unlike the existing calculation approaches, there are only three feature points that need to be computed to obtain continuous smooth M–N curves in this paper, which has obvious advantages in computational complexity. The performance of the proposed method is demonstrated by experimental data from forty-five RC columns. Compared with the prediction accuracy of the existing model, the proposed method can achieve satisfactory prediction results.
2. The Proposed Model
For RC members whose sectional dimension, reinforcement arrangement and material strength are determined, the pure compression and pure bending can be regarded as two ultimate states of eccentric compression. From a continuum mechanics point of view, the transition between three mechanical states of pure compression, eccentric compression and pure bending should be continuous. The curves of eccentric compression members should be smooth without breaking points. Based on the above properties, this paper presents a bearing capacity evaluation model of deteriorated eccentric members based on a unified formula (Figure 1). First, the axial compression point, the pure bending point and the balanced failure point are selected as the basic points because of the definite stress states. The deteriorated strength of the basic points is calculated by considering various deterioration factors caused by steel corrosion. Second, the interpolation points are generated by the piecewise cubic Hermite interpolating polynomial (PCHIP). Third, the explicit expression of interpolation points fitting function is realized by the trigonometric Fourier series model. The flowchart of the proposed model is shown in Figure 2.
The rest of this section is organized as follows. In Section 2.1, the residual strength of the corroded axial compression point, considering concrete cracking, reduction of reinforcement area, buckling of the steel bar and strength reduction of confined concrete, is elaborated. The model for prediction of pure bending bearing capacity, considering reduction of reinforcement area, buckling of the steel bar and bond slip, is provided in Section 2.2. Section 2.3 presents the model for computing the balanced failure point by considering buckling of the steel bar, bond slip, reduction of reinforcement area and strength reduction of confined concrete. The Hermite interpolation and Fourier fitting method are addressed in Section 2.4 and Section 2.5, respectively.
2.1. Axial Compression Point
The cross section of a corroded RC column under axial compression can be decomposed into four different regions (Figure 3), i.e., the cracking area of unconfined concrete , cracking area of confined concrete , no cracking area of confined concrete and the longitudinal reinforcement area considering the buckling effect [29].
The bearing capacity model and strength contribution of the areas can be expressed as
where and represent the compressive strength of the confined concrete and unconfined concrete, respectively; is the strength attenuation factor of concrete under compression; is the yield strength attenuation factor of longitudinal reinforcement considering the buckling effect; and are the diameters of the uncorroded stirrup and longitudinal bar, respectively; and are the height and width of the rectangular column, respectively; and denotes the thickness of the concrete cover.
The attenuation factor describes the characteristics of concrete expansion cracking caused by corrosion of steel bars, which leads to reduction of the concrete compressive strength. The mathematical model can be given as [30]
where is the reduced compressive strength of concrete; is the coefficient related to bar roughness and diameter, as suggested in [30], ; is the volume expansion ratio of corrosion products; denotes the number of bars in the compression area; is the peak strain of normal concrete, ; and is the corrosion depth, which describes the uniform corrosion characteristics of steel bars. According to [31], the reduction in the diameter of a corroding reinforcing bar after years (mm) can be predicted by
where denotes the corrosion current density ().
Due to Poisson’s effect, transverse deformation occurs when concrete is subjected to an axial load. When the axial strain is large enough, the transverse strain is restrained by stirrups, which improve the strength and ductility of concrete. The reinforcement characteristic value is an indispensable one among the many factors that affect the confined concrete. As suggested in [32], the compressive strength of the confined concrete can be calculated by
where is the reinforcement characteristic value. When the corrosion of stirrups is not included,
where is the stirrup ratio without considering the corrosion of stirrups; is the yield strength of uncorroded stirrups; is the length of stirrups; and is the space between stirrups.
When the corrosion of stirrups is not ignored, the stirrup ratio, considering the corrosion of stirrups , can be evaluated as
where represents the reduced area of the corroded stirrup; is the yield stress of corroded reinforcement bar; represents the corrosion rate of reinforcement; and is the influence coefficient of pitting corrosion on bar’s yield strength, when the bar is corroded in the solution, and in a chloride environment [33].
The reduced area of stirrups caused by uniform and pitting corrosion can be derived by
where is the reduced area due to pitting corrosion (see Figure 4), which can be calculated by [31]
where
where is the pitting depth, which can be evaluated as
in which the pitting factor in this work.
It should be emphasized that the failure of reinforcing steels often results from the ductility reduction of the local area caused by pitting corrosion. For longitudinal compressive steel bars, corrosion easily leads to concrete cover peeling, which greatly increases the risk of buckling. In this paper, the maximum allowable stress of compression bars is the minimum between the yield strength and critical stress. The critical stress can be calculated as [34]
with
where is the hardening modulus of the steel bar, , with in the elastic range or assumed to be 0.03 at the yielding stage [29]; is the area of longitudinal reinforcement; is the elastic modulus of the corroded steel bar; is the elastic modulus of the steel bar; and denotes the stiffness parameter, for a corner bar, which can be calculated by
and for a mid-face bar, by
where is the inertia moment of a stirrup, ; is the area of stirrup, ; and is the diameter of stirrup.
The yield stress attenuation coefficient of longitudinal reinforcement caused by buckling can be defined as , and .
2.2. Pure bending point
The reference model for predicting the flexural strength of non-corroded reinforced concrete section is based on the plane section theory and assumes that there is no slip between the steel bar and concrete. When steel corrosion happens, slip appears between the concrete and steel bar, which reduces the effect of strength and ductility. To take into account the slip effect, the reduction factor of bond strength is introduced by assuming that the yield stress of longitudinal reinforcement between two continuous bending cracks decreases uniformly. In addition, is defined here as the ratio of the bond strength of the corroded bars to the bond strength of the uncorroded bars.
A model with consideration of the influence of concrete cover, confinement of stirrups and corrosion current density on the bond strength was proposed by Lin et al. [35], which can achieve satisfactory prediction results. The mathematical form can be expressed by
where is the degradation coefficient; is the stirrup index of confinement, , is the cross-sectional area of the stirrups in the splitting plane in mm2; and are the number and diameter of the tensile steel bar, respectively; and , , and are parameters that can be determined by experience, = 3.23, , , . It should be emphasized that the four empirical parameters are influenced by the test details, such as the specimen form, the corrosion current density, the loading method and the shape of deformed ribs on the surface of steel bars, and more accurate values require further verification and optimization.
In Equation (26), the adverse effect caused by the loss of the stirrup section is considered by introducing , however, the damage of concrete cover and the reduction of restraint capacity due to the corrosion of stirrups are not reflected in the model. To cope with the above problem, the reduction ratio coefficient ( < 1.0), proposed by [35], is adopted in this study to calculate the modified reduction factor of bond strength as
When calculating with Equations (25) and (26), the loss of the stirrup section is not considered, that is, the detrimental effect of stirrup corrosion on bond strength is completely conveyed by , , where is the mass loss rate of stirrups.
The distribution of stress and strain in the pure bending section is shown in Figure 5. According to the equilibrium condition of the force, the equivalent rectangle height of compression zone in concrete can be calculated by
where is the reduced area of the corroded longitudinal bar; is coefficient with when the strength grade of concrete changes from C80 to C50.
The ultimate flexural strength is obtained by
where represents the distance between the resultant force point of reinforcement and the compression edge of the section, .
For symmetric reinforcement, compressed steel bars will not yield when the ultimate strength is reached. The stress of the compressive steel bar is unknown here; assume . In this case, the ultimate flexural strength is obtained by
2.3. Balanced Failure Point
For the eccentric compression member, there is always a point in the M–N curve that makes the steel bars and the compressive concrete reach ultimate strength simultaneously. This point is the so-called balanced failure point, which is also the boundary point between large and small eccentric compression member. At this point, the eccentric compression member achieves the maximum bending moment that it can bear. Thus, the balanced failure point is also termed as the peak point. For the corroded eccentric compression members, how to determine the relative height of the compression zone corresponding to the balanced failure point is critical.
The relative height of the compression zone is relative to the elastic modulus and yield strength of reinforcement. The elastic modulus changes little during the corrosion process, and the yield strength decreases after the corrosion of reinforcing bars. Corrosion of reinforcing bars results in deterioration of the bond performance between reinforcing bars and concrete, which destroys the strain compatibility between reinforcing bars and concrete. A modified model for calculating the relative height considering the corrosion is established in [36], which is given as
where represents the height of the compression zone; is the effective depth of section, ; represents the strain incompatibility coefficient; is the nominal yield strength of the corroded steel bar; is the ultimate strain of concrete, in this study; and is coefficient with when the strength grade of concrete changes from C80 to C50.
The axial force and bending moment of the balanced failure point can be obtained by
2.4. Hermite Interpolation
After obtaining the three basic points, how to build a continuous smooth M–N curve based on the above three points became the focus of this study. A quadratic parabola can meet the fitting requirements based on only three-points. However, the peak point of the M–N curve constructed by a quadratic parabola often deviates from the balanced failure point. To address this problem, the Hermite interpolation is used in this work. There are only two interpolated points required to establish the Hermite function, and four boundary conditions, including the function values and the first order derivative at the two nodes, must be satisfied. As the continuity and differentiability of the original function are presented, the Hermite function is also named as the shape-preserving function. The value and derivative of the Hermite function at any interpolation knot equals the real value and derivative of the original function, which could make the interpolation function much more easily converged to the prescribed target [37].
In the general case, is a partition of the interval [a, b], for the given points , where , and are the function value and the first derivative value at the point , assuming , ; the cubic Hermite interpolation spline curves on the subinterval can be expressed as
where , , , are the basis functions, which can be expressed as
According to the definition and Equation (36), the basis functions should satisfy the following conditions:
, , , , , , , , , , , , , , , , and , .
Standard cubic Hermite interpolation spline curves defined by Equation (36) satisfy , , , and . In addition, the second derivative of the polynomial used in the PCHIP function is not continuous. This lack of continuity in the second derivative ensures that the original shape of the peak is preserved with only a minimal degree of curvature existing between data points, resulting in an interpolated peak that retains the original maxima and minima of the sampled peak [38].
2.5. Fourier Fitting
After the obtainment of interpolated points, a Fourier model is adopted to realize the explicit expression of interpolation data, because of its high efficiency, fast speed, and sufficient fidelity [39]. The trigonometric Fourier series form can be constructed by
where , , and represent the coefficient of the Fourier function; and are the axial force and bending moment of the interpolation point, respectively; and is the number of terms.
Equation (37) can be expressed as , with
and
As in Equation (39), the least squares solution is used in this paper. The least squares solution can be obtained by
In order to evaluate the accuracy and stability of the fitting model, the adjusted coefficients of determination are utilized in this study [40], which are given as:
where is the residual sum of squares of , which reflects the fluctuation of ; is the sum of square error of , which reflects the effect of the error on response fluctuation; is the bending moment at the interpolation knot, is the mean value, ; is the evaluation value of the bending moment at the interpolation knot; and is the number of non-constant terms in the Fourier fitting function. The closer the modified coefficient of determination is to 1, the higher the accuracy of the response surface model achieves.
In this paper, the PCHIP and Fourier series fitting model were carried out in MATLAB 2011a.
3. Model Validation
In this section, two levels of verification are carried out. First, the prediction values obtained by the proposed model are compared with the experimental data measured by different researchers to illustrate the effectiveness and stability of the proposed method. After that, the comparison with the existing models is implemented to further verify the accuracy of the proposed model.
3.1. Validation by Experimental Data
Fifty corroded RC columns from [18,19,41,42,43] are utilized to verify the accuracy of the model. The material properties, physical dimensions, load eccentricities and bearing capacity of the fifty specimens mentioned above are given in Appendix C. The ratio of results predicted by the proposed model to experimental results is shown in Figure 6.
In Table A1, the data of specimen CUW-e1 are not given as it was broken during the experiment. Based on the remaining forty-nine specimens, the ratio of prediction results to experimental results is satisfactory with a mean value of 1.09 and standard deviation of 0.16. Comparing with the data of members with the same dimension, it is easy to see that the data of the specimens AS-3, AL-3, BL-2 and BL-4 are abnormal, whose load carrying capacity is lower than the specimens with a greater corrosion degree. Possible causes include the fabrication failure of concrete components, the error of eccentricity setting, and the unstable performance of concrete materials. After removing the outliers, the accuracy improves, as the mean value of the ratio of prediction results to experimental results is 1.06, and the standard deviation is 0.14. As shown in Figure 6, only two data points (including an outlier) exceed the 95% confidence interval. The prediction values of the proposed model agree well with the experimental data from different scholars.
3.2. Validation by Existing Models
In this section, the performance of this proposed method is further demonstrated on a numerical example in [22,26], referring to a column suffering from corrosion attack. As shown in Figure 7, the column has a square cross-section of side 610 mm. The longitudinal reinforcement is constituted by four 28-mm bars for each side, with a cover of 28 mm. The stirrups are constituted by 12-mm bars with a pitch equal to 250 mm. The reinforcement ratio is 1.98%. All longitudinal reinforcements and stirrups have the same corrosion rate. Table 1 gives the mathematical model of the moment–axial force interaction diagrams established by the proposed method. As can be seen from Table 1, the Fourier model fitting to interpolating points has high accuracy with a goodness of fit close to 1, which can meet the need of constructing a smooth M–N curve.
As can be seen from Figure 7, the proposed method is in good agreement with the M–N curves calculated by [22] (numerical model) and [26] (simplified model with three branches and four points). Taking data in [22] as the reference value, the maximum relative percentage error of axial compression point, pure bending point and balanced failure point is only 7.9% under the no corrosion condition. For a corrosion rate of 50%, the scatter is only in the range of 3.8% for compression.
Figure 7 also shows that the bearing capacity of reinforced concrete members is significantly reduced with an increase in corrosion degree. When the corrosion rate increases from 10% to 50%, the bearing capacity of the axial compression point degenerates from 31.4% to 45.2%, while the decrease rate in pure bending point ranges from 25.4% to 77.4%. The balanced failure point moves down and to the left and the critical eccentricity at this point increases first and then decreases with an increase in corrosion degree. When the corrosion rate increases from 10% to 50%, the axial force of the balanced failure point decreases from 48.0% to 67.6%, while the bending moment decreases from 30.3% to 65.9%.
In addition, as it directly connects three kinds of mechanical states: pure bending, eccentric compression and axial compression, the proposed model could better explain the continuous transition of the adjacent stress state. Compared with the above two models, the model proposed in this paper is smoother and has less computational complexity with only three characteristic points needing to be calculated.
Furthermore, this paper discusses the effects of different deterioration factors on the degradation of bearing capacity under different loading conditions. For instance, Figure 8 shows the strength contributions of the four parts , , and on the axial compression bearing capacity under different corrosion levels. As seen from Figure 8, with the increase in the corrosion rate, the contributions from and decrease significantly because of the tremendous influence of concrete cracking, which accounts for 80% of the total decline when the corrosion rate is 10%, while for a corrosion rate of 50%, the decrement proportion is 73%; the contribution reduction of comes second; and changes least. Thus, among the several factors of deterioration in axial compression, concrete cracking predominates.
Unlike the axial compression state, according to Equation (30), the bearing capacity of members under the pure bending state mainly depends on the contribution of reinforcement, among which bond slip is the most remarkable factor affecting the reduction of bearing capacity, followed by the reduction of reinforcement area. After the above comparison, it can easily be seen that when the stress state transits from pure bending state to pure compression state, the influence of concrete on bearing capacity is gradually strengthened, while the contribution of reinforcement is weakened gradually.
4. Structural Parameters Sensitivity Analysis of Influence on Corrosion Damage
At present, research on the bearing capacity evolution of corroded structures is mainly carried out by experiments. However, a full-scale model test is arduous to execute, and limited by experimental sites, funds and test equipment. The rationality of actual bridge structures performance evolution predicted by the results of a small-scale test is also given in this section.
This section takes the example given in Section 3.2 as the benchmark model. The following six cases are compared: (1) the reinforcement ratio remains constant, and the section size is set to b × h = 1200 × 1200 mm; (2) concrete strength decreases by 20 %, MPa; (3) the yield strength of reinforcement increases by 20%, MPa; (4) the diameter of the reinforcing bar is increased to 32 mm; (5) the thickness of the concrete cover increased to 38 mm; (6) the diameter of the stirrups is reduced to 8 mm. Comparison results are shown in Figure 9, where refers to the ratio of the reduced force caused by corrosion to force in the no corrosion members.
As shown in Figure 9, the sectional dimension has a certain effect on the degree of corrosion influence. When the sectional dimension increases, the detrimental effect of corrosion on the axial compression bearing capacity decreases. The main reason for this phenomenon is that with an increase in sectional dimension, the proportion of core concrete area increases, while the negative effect of steel corrosion on this area is relatively small, so the adverse effect of corrosion on the structure is weakened. The improvement in yield strength of steel bars may lead to over-estimation of the reduction of the axial force at the balanced failure point, while underestimate the impact of corrosion damage on the bending moment. The strength of concrete, the thickness of concrete cover, the diameter of reinforcement and the diameter of stirrups have little implications on the influence degree evaluation of the bearing capacity reduction caused by corrosion damage.
5. Conclusions
In this paper, the lack of unified consensus for a quantitative assessment of corroded reinforced concrete pier columns is verified, and it is found that existing codes are not able to provide the quantitative calculation of corroded RC eccentric compression members. To address this deficiency, the interpolation and Fourier fitting model are employed to construct the M–N curve, and are validated by the existing test data and models. Some concluding remarks can be summarized as follows.
(1) The traditional method needs to determine the eccentric compressive properties (large or small eccentricity) first, and then calculate the bearing capacity according to different formulas. The stress state of compressed steel bars also needs to be judged, which makes the traditional method cumbersome and inconvenient in engineering applications. In addition, the inconsistency between the formulas for calculating the bearing capacity of compression members with large and small eccentricity makes the derivatives at the balanced failure point unequal. A cusp appears on the M–N curve, and the curve is not smooth. To resolve the above imperfections, this paper proposes a new construction method for the M–N curve. The proposed model connects bending, eccentric compression and axial compression by a unified formula, and achieves a better interpretation of the continuous transition of the adjacent stress state with simple calculations and less computational complexity.
(2) Comparison results based on the experimental data from forty-five corroded eccentric compression columns demonstrated that the prediction performance of the proposed method is satisfactory with an average ratio of predicted results to test results of 1.06 and a standard deviation of 0.14; the satisfactory results are also obtained from comparison with the existing models.
(3) The unified model provides a new feasible method for the construction of the M–N curve used for bearing capacity evaluation of deteriorated RC members. The theories are well designed and established, and the prediction result is more comprehensive which can intuitively reflect the effect of corrosion on the bearing capacity under different mechanical conditions.
In this work, the relationship between the decrease in bearing capacity and corrosion rate is established. To predict the time-varying bearing capacity of actual bridge structures, the model of corrosion initiation time and corrosion rate under different environments should be analyzed for further study.
Author Contributions
J.X. conceived and wrote this paper. J.Z. offered useful suggestions for the preparation and writing the paper. F.Z. collected the data. S.X.Y. advised on the data analysis and paper organization. Y.Z. involved in paper writing.
Funding
This work was supported by the National Key Research and Development Program of China (2017YFC0806007), the National Science Fund for Distinguished Young Scholars (51425801), the Technology Innovation and Application Demonstration Project of Chongqing (cstc2017rgzn-zdyfX0018, cstc2018jscx-mszdX0084), the Science and Technology Planning Project of Yunnan Province of China (2017IB025), and the State Key Laboratory Base of the Mountain Bridge and Tunnel Engineering(Chongqing Jiaotong University: CQSLBF-Y14-1).
Conflicts of Interest
The authors declare no conflict of interest.
Appendix A. AASHTO 2011 (American Code)
As stated in the AASHTO Manual for Condition Evaluation of Bridges (AASHTO 2011) [13], when evaluating the carrying capacity of existing bridges, the ability of structures to resist live loads is emphasized.
The evaluation formula based on load factor rating method can be constructed below,
where is the rating factor; represents the carrying capacity; is the evaluation coefficient; denotes the nominal member resistance; and represent the factor for dead loads and live loads, respectively; and are the dead loads and live loads effect, respectively; and is the impact factor.
The evaluation formula based on the load and resistance factor rating method can be expressed as
where denotes the dead-load effect of structural components and attachments; is the load factor for structural components and attachments; is the dead-load effect of wearing surfaces utilities; represents the load factor for wearing surfaces and utilities; is the permanent loading other than dead loads; is the live-load effect; represents the dynamic load allowance; is the evaluation live-load factor; is the condition factor, which indicates resistance variation in structures. According to the qualitative description of the bridge condition, is equal to 1.00, 0.95 or 0.85; is the system factor, which can reflect the degradation level of the superstructure. According to different superstructure forms, is equal to 1.00, 0.95 or 0.85; and is the resistance factor.
Appendix B. JTG/T J21-2011 (Chinese Code)
According to the “Specification for Testing and Evaluating the Bearing Capacity of Highway Bridges” (JTG/T J21-2011) [14], the bearing capacity of existing RC bridges is evaluated by
where represents the importance factor of structure; is the load effect function; is the resistance effect function; is the comprehensive modification coefficient of load-bearing capacity; , , and represent the deterioration coefficient of load-bearing capacity, section-reduction coefficient of concrete and steel bar, respectively; is the design value of material strength; and and represent the geometric parameters of concrete and reinforcement, respectively.
Appendix C. Sample Data Details

| No. | Data Sources | Column Designation | b × h (mm) | Eccentricity (mm) | Diameter of Longitudinal Reinforcement (mm) | Corrosion Rate of Longitudinal Reinforcement (%) | Diameter of Stirrup (mm) | Corrosion rate of Stirrups (%) | Concrete Strength (MPa) | Yield Strength of Steel bar (MPa) | Cover Thickness (mm) | Stirrup Spacing (mm) | Experimentatal Value (kN) | Predicted Value (kN) |
|---|---|---|---|---|---|---|---|---|---|---|---|---|---|---|
| 1 | [19] | Z0 | 100 × 100 | 0 | 9.2 | 0 | 6 | 0 | 57.8 | 354.44 | 15 | 60 | 710 | 748 |
| 2 | Z5 | 0.5 | 4.85 | 665 | 672 | |||||||||
| 3 | Z10 | 0.8 | 9.6 | 632 | 633 | |||||||||
| 4 | Z20 | 1.2 | 13.0 | 545 | 588 | |||||||||
| 5 | [41] | Z1 | 250 × 350 | 40 | 18 | 0 | 8 | 0 | 47.5 | 432 | 25 | 200 | 3530 | 3950 |
| 6 | Z2 | 70 | 0 | 0 | 46.8 | 432 | 2850 | 3150 | ||||||
| 7 | Z3 | 150 | 0 | 0 | 43.3 | 432 | 1420 | 1670 | ||||||
| 8 | Z4 | 40 | 0.98 | 0.98 | 47.8 | 424 | 3020 | 3500 | ||||||
| 9 | Z5 | 70 | 1.56 | 1.56 | 49.0 | 420 | 2620 | 2850 | ||||||
| 10 | Z6 | 150 | 1.34 | 1.34 | 53.7 | 428 | 1310 | 1610 | ||||||
| 11 | Z7 | 40 | 3.51 | 3.51 | 42.5 | 416 | 2940 | 2710 | ||||||
| 12 | [42] | Z0 | 100 × 200 | 130 | 10 | 0 | 6 | 0 | 45.8 | 360 | 25 | 100 | 260 | 210 |
| 13 | Z1 | 1.8 | / | 34.2 | 248 | 200 | ||||||||
| 14 | Z2 | 2.3 | / | 245 | 199 | |||||||||
| 15 | Z3 | 2.5 | / | 230 | 198 | |||||||||
| 16 | Z4 | 4.3 | / | 30.7 | 221 | 190 | ||||||||
| 17 | Z5 | 8.7 | / | 207 | 170 | |||||||||
| 18 | Z6 | 12.2 | / | 190 | 150 | |||||||||
| 19 | [43] | NUW-e1 | 125 × 125 | 47 | 10 | 0 | 6 | 0 | 28.5 | 550 | 15 | 125 | 215 | 270 |
| 20 | NUW-e2 | 64.63 | 165 | 202 | ||||||||||
| 21 | NUW-e3 | 81.25 | 145 | 158 | ||||||||||
| 22 | NUW-e4 | 116.88 | 92 | 101 | ||||||||||
| 23 | CUW-e1 | 37.5 | 4.25 | 4.25 | − | − | ||||||||
| 24 | CUW-e2 | 62.93 | 167 | 176 | ||||||||||
| 25 | CUW-e3 | 80.14 | 145 | 139 | ||||||||||
| 26 | CUW-e4 | 115.82 | 91 | 91 | ||||||||||
| 27 | [18] | AS-0 | 200 × 240 | 50 | 20 | 0 | 6 | / | 25.93 | 380.05 | 30 | 200 | 805 | 1100 |
| 28 | AS-1 | 1.73 | / | 795 | 900 | |||||||||
| 29 | AS-2 | 2.66 | / | 740 | 825 | |||||||||
| 30 | AS-3 | 4.61 | / | 628 | 750 | |||||||||
| 31 | AS-4 | 6.13 | / | 739 | 700 | |||||||||
| 32 | AS-5 | 8.82 | / | 728 | 640 | |||||||||
| 33 | AL-0 | 90 | 0 | / | 802 | 800 | ||||||||
| 34 | AL-1 | 1.63 | / | 651 | 690 | |||||||||
| 35 | AL-2 | 3.90 | / | 526 | 610 | |||||||||
| 36 | AL-3 | 4.97 | / | 372 | 570 | |||||||||
| 37 | AL-4 | 6.11 | / | 434 | 540 | |||||||||
| 38 | AL-5 | 8.31 | / | 411 | 510 | |||||||||
| 39 | BS-0 | 50 | 0 | / | 100 | 970 | 1180 | |||||||
| 40 | BS-1 | 1.61 | / | 884 | 960 | |||||||||
| 41 | BS-2 | 2.45 | / | 837 | 915 | |||||||||
| 42 | BS-3 | 4.06 | / | 763 | 827 | |||||||||
| 43 | BS-4 | 5.66 | / | 690 | 770 | |||||||||
| 44 | BS-5 | 7.27 | / | 649 | 705 | |||||||||
| 45 | BL-0 | 90 | 0 | / | 848 | 830 | ||||||||
| 46 | BL-1 | 1.16 | / | 570 | 720 | |||||||||
| 47 | BL-2 | 2.92 | / | 509 | 670 | |||||||||
| 48 | BL-3 | 3.90 | / | 513 | 615 | |||||||||
| 49 | BL-4 | 5.81 | / | 430 | 570 | |||||||||
| 50 | BL-5 | 7.10 | / | 447 | 540 |
References
- Xin, J.Z.; Zhou, J.T.; Yang, S.X.; Li, X.Q.; Wang, Y. Bridge structure deformation prediction based on GNSS data using Kalman-ARIMA-GARCH model. Sensors 2018, 18, 298. [Google Scholar] [CrossRef] [PubMed]
- Li, X.; Xie, H.; Yan, M.; Gou, H.; Zhao, G.; Bao, Y. Eccentric compressive behavior of reinforced concrete columns strengthened using steel mesh reinforced resin concrete. Appl. Sci. 2018, 8, 1827. [Google Scholar] [CrossRef]
- Nabizadeh, A.; Tabatabai, H.; Tabatabai, M.A. Survival analysis of bridge superstructures in wisconsin. Appl. Sci. 2018, 8, 2079. [Google Scholar] [CrossRef]
- Moreno-Gomez, A.; Amezquita-Sanchez, J.P.; Valtierra-Rodriguez, M.; Perez-Ramirez, C.A.; Dominguez-Gonzalez, A.; Chavez-Alegria, O. EMD-Shannon entropy-based methodology to detect incipient damages in a truss structure. Appl. Sci. 2018, 8, 2068. [Google Scholar] [CrossRef]
- Federal Highway Administration (FHWA). Deficient Bridges by Highway System 2017. Available online: https://www.fhwa.dot.gov/bridge/nbi/no10/defbr17.cfm (accessed on 28 February 2018).
- Editorial Department of China Journal of Highway and Transport. Review on China’s bridge engineering research: 2014. China J. Highw. Transp. 2014, 27, 1–96. [Google Scholar] [CrossRef]
- Zhou, J.; Qiu, J.; Zhou, Y.; Zhou, Y.; Xia, R. Experimental Study on Residual Bending Strength of Corroded Reinforced Concrete Beam Based on Micromagnetic Sensor. Sensors 2018, 18, 2635. [Google Scholar] [CrossRef]
- Bossio, A.; Monetta, T.; Bellucci, F.; Lignola, G.P.; Prota, A. Modeling of concrete cracking due to corrosion process of reinforcement bars. Cem. Concr. Res. 2015, 71, 78–92. [Google Scholar] [CrossRef]
- Desnerck, P.; Lees, J.M.; Morley, C.T. Bond behaviour of reinforcing bars in cracked concrete. Constr. Build. Mater. 2015, 94, 126–136. [Google Scholar] [CrossRef]
- Mak, M.W.T.; Desnerck, P.; Lees, J.M. Correlation between surface crack width and steel corrosion in reinforced concrete. In Proceedings of the International Conference on Concrete Repair, Rehabilitation and Retrofitting (ICCRRR 2018), Cape Town, South Africa, 19–21 November 2018; Volume 199, p. 04009. [Google Scholar] [CrossRef]
- Bossio, A.; Lignola, G.P.; Fabbrocino, F.; Monetta, T.; Prota, A.; Bellucci, F.; Manfredi, G. Nondestructive assessment of corrosion of reinforcing bars through surface concrete cracks. Struct. Concr. 2017, 18, 104–117. [Google Scholar] [CrossRef]
- Bossio, A.; Fabbrocino, F.; Monetta, T.; Lignola, G.P.; Prota, A.; Manfredi, G.; Bellucci, F. Corrosion effects on seismic capacity of reinforced concrete structures. Corros. Rev. 2018. [Google Scholar] [CrossRef]
- AASHTO. The Manual for Bridge Evaluation, 2nd ed.; American Association of State Highway and Transportation Officials: Washington, DC, USA, 2011. [Google Scholar]
- Research Institute of Highway Ministry of Transport. Specification for Testing and Evaluating the Bearing Capacity of Highway Bridges; China Communications Press: Beijing, China, 2011.
- Wang, X.H.; Liang, F. Performance of RC columns with partial length corrosion. Nucl. Eng. Des. 2008, 238, 3194–3202. [Google Scholar] [CrossRef]
- Yang, S.Y.; Song, X.B.; Jia, H.X.; Chen, X.; Liu, X.L. Experimental research on hysteretic behaviors of corroded reinforced concrete columns with different maximum amounts of corrosion of rebar. Constr. Build. Mater. 2016, 121, 319–327. [Google Scholar] [CrossRef]
- Meda, A.; Mostosi, S.; Rinaldi, Z.; Riva, P. Experimental evaluation of the corrosion influence on the cyclic behaviour of RC columns. Eng. Struct. 2014, 76, 112–123. [Google Scholar] [CrossRef]
- Xia, J.; Jin, W.L.; Li, L.Y. Performance of corroded reinforced concrete columns under the action of eccentric loads. J. Mater. Civ. Eng. 2016, 28, 04015087. [Google Scholar] [CrossRef]
- Li, Q.; Jin, X.Y. Effect of stirrup corrosion on bearing capacity of uniaxial compression short column. J. Zhejiang Univ. (Eng. Sci.) 2015, 49, 1929–1938. [Google Scholar] [CrossRef]
- Zhang, K.; Wei, J.; Xu, G. Assessment of bearing capacity of corroded reinforced concrete little eccentric compressive members. J. Huazhong Univ. Sci. Technol. (Nat. Sci. Ed.) 2008, 36, 107–109. [Google Scholar] [CrossRef]
- Huang, L.; Lu, Y.; Xu, Z. Correctional recommendation of bearing capacity formula of RC eccentric compression members. Eng. Mech. 2012, 29, 169–175. [Google Scholar] [CrossRef]
- Tapan, M.; Aboutaha, R.S. Effect of steel corrosion and loss of concrete cover on strength of deteriorated RC columns. Constr. Build. Mater. 2011, 25, 2596–2603. [Google Scholar] [CrossRef]
- Tapan, M.; Aboutaha, R.S. Strength evaluation of deteriorated RC bridge columns. J. Bridge Eng. 2008, 13, 226–236. [Google Scholar] [CrossRef]
- Guo, A.; Yuan, W.; Li, H.; Li, H. Structural strength deterioration of coastal bridge piers considering non-uniform corrosion in marine environments. Earthq. Eng. Eng. Vib. 2018, 17, 429–444. [Google Scholar] [CrossRef]
- Akiyama, M.; Frangopol, D.M.; Mizuno, K. Performance Analysis of Tohoku-Shinkansen Viaducts Affected by the 2011 Great East Japan Earthquake. Struct. Infrastruct. E 2014, 10, 1228–1247. [Google Scholar] [CrossRef]
- Campione, G.; Cannella, F.; Cavaleri, L.; Ferrotto, M.F. Moment-axial force domain of corroded R.C. columns. Mater. Struct. 2017, 50, 1–14. [Google Scholar] [CrossRef]
- Naser, M.Z. Deriving temperature-dependent material models for structural steel through artificial intelligence. Constr. Build. Mater. 2018, 191, 56–68. [Google Scholar] [CrossRef]
- Vanneschi, L.; Castelli, M.; Scott, K.; Popovič, A. Accurate High performance concrete prediction with an alignment-based genetic programming system. Int. J. Concr. Struct. M. 2018, 12, 72. [Google Scholar] [CrossRef]
- Campione, G.; Cannella, F.; Minafò, G. A simple model for the calculation of the axial load-carrying capacity of corroded RC columns. Mater. Struct. 2016, 49, 1935–1945. [Google Scholar] [CrossRef]
- Coronelli, D.; Gambarova, P. Structural assessment of corroded reinforced concrete beams: Modeling guidelines. J. Struct. Eng. 2004, 130, 1214–1224. [Google Scholar] [CrossRef]
- Val, D.V. Deterioration of strength of RC beams due to corrosion and its influence on beam reliability. J. Struct. Eng-ASCE 2007, 133, 1297–1306. [Google Scholar] [CrossRef]
- Qian, J.; Cheng, L.; Zhou, D. Behavior of axially loaded concrete columns confined with ordinary hoops. J. Tsinghua. Univ. (Sci. Technol.) 2002, 42, 1369–1373. [Google Scholar] [CrossRef]
- Xia, J.; Jin, W.L.; Zhao, Y.X.; Li, L.Y. Mechanical performance of corroded steel bars in concrete. Proc. Inst. Civ. Eng.-Struct. Build. 2013, 166, 235–246. [Google Scholar] [CrossRef]
- Giamundo, V.; Lignola, G.P.; Prota, A.; Manfredi, G. Analytical evaluation of FRP wrapping effectiveness in restraining reinforcement bar buckling. J. Struct. Eng. 2014, 140, 04014043. [Google Scholar] [CrossRef]
- Lin, H.; Zhao, Y. Effects of confinements on the bond strength between concrete and corroded steel bars. Constr. Build. Mater. 2016, 118, 127–138. [Google Scholar] [CrossRef]
- Zhang, K.B.; Hu, J.; Zhang, J.R.; Peng, H. On the experiment and bearing capacity calculation of eccentrically compressed component made of corroded reinforced concrete. J. Exp. Mech. 2010, 25, 625–632. [Google Scholar]
- Tao, T.Y.; Wang, H.; Kareem, A. Reduced-Hermite bifold-interpolation assisted schemes for the simulation of random wind field. Probab. Eng. Mech. 2018, 53, 126–142. [Google Scholar] [CrossRef]
- Allen, R.C.; Rutan, S.C. Investigation of interpolation techniques for the reconstruction of the first dimension of comprehensive two-dimensional liquid chromatography–diode array detector data. Anal. Chim. Acta 2011, 705, 253–260. [Google Scholar] [CrossRef] [Green Version]
- Gao, Y.; Chen, T.; Wu, Y.; Ling, C.Y.; Han, M. Temperature modeling and simulation of a proton exchange membrane fuel cell based on Fourier fitting. Acta Energiae Sol. Sin. 2018, 39, 679–685. [Google Scholar]
- Xin, J.Z.; Zhou, J.T.; Xiao, Y.J.; Li, X.Q.; Su, X. Research on parameters identification algorithm for concrete nonlinearity constitutive model. Mater. Rev. 2018, 32, 2743–2749. [Google Scholar] [CrossRef]
- Yi, W.J.; Lei, G.Q. Experimental research on the bearing capacity of corroded reinforced concrete columns. J. Hunan Univ. (Nat. Sci.) 2008, 35, 6–10. [Google Scholar] [CrossRef]
- Diao, Y.; Sun, Y. Experiments of reinforced concrete columns with eccentric compressive persistent loading under alternative actions of a mixed aggressive solution and freeze-thaw cycles. J. Build. Struct. 2009, S2, 292–297. [Google Scholar] [CrossRef]
- Maaddawy, T.E. Behavior of corrosion-damaged RC columns wrapped with FRP under combined flexural and axial loading. Cem. Concr. Compos. 2008, 30, 524–534. [Google Scholar] [CrossRef]
Figure 1.
Moment–axial force curve.
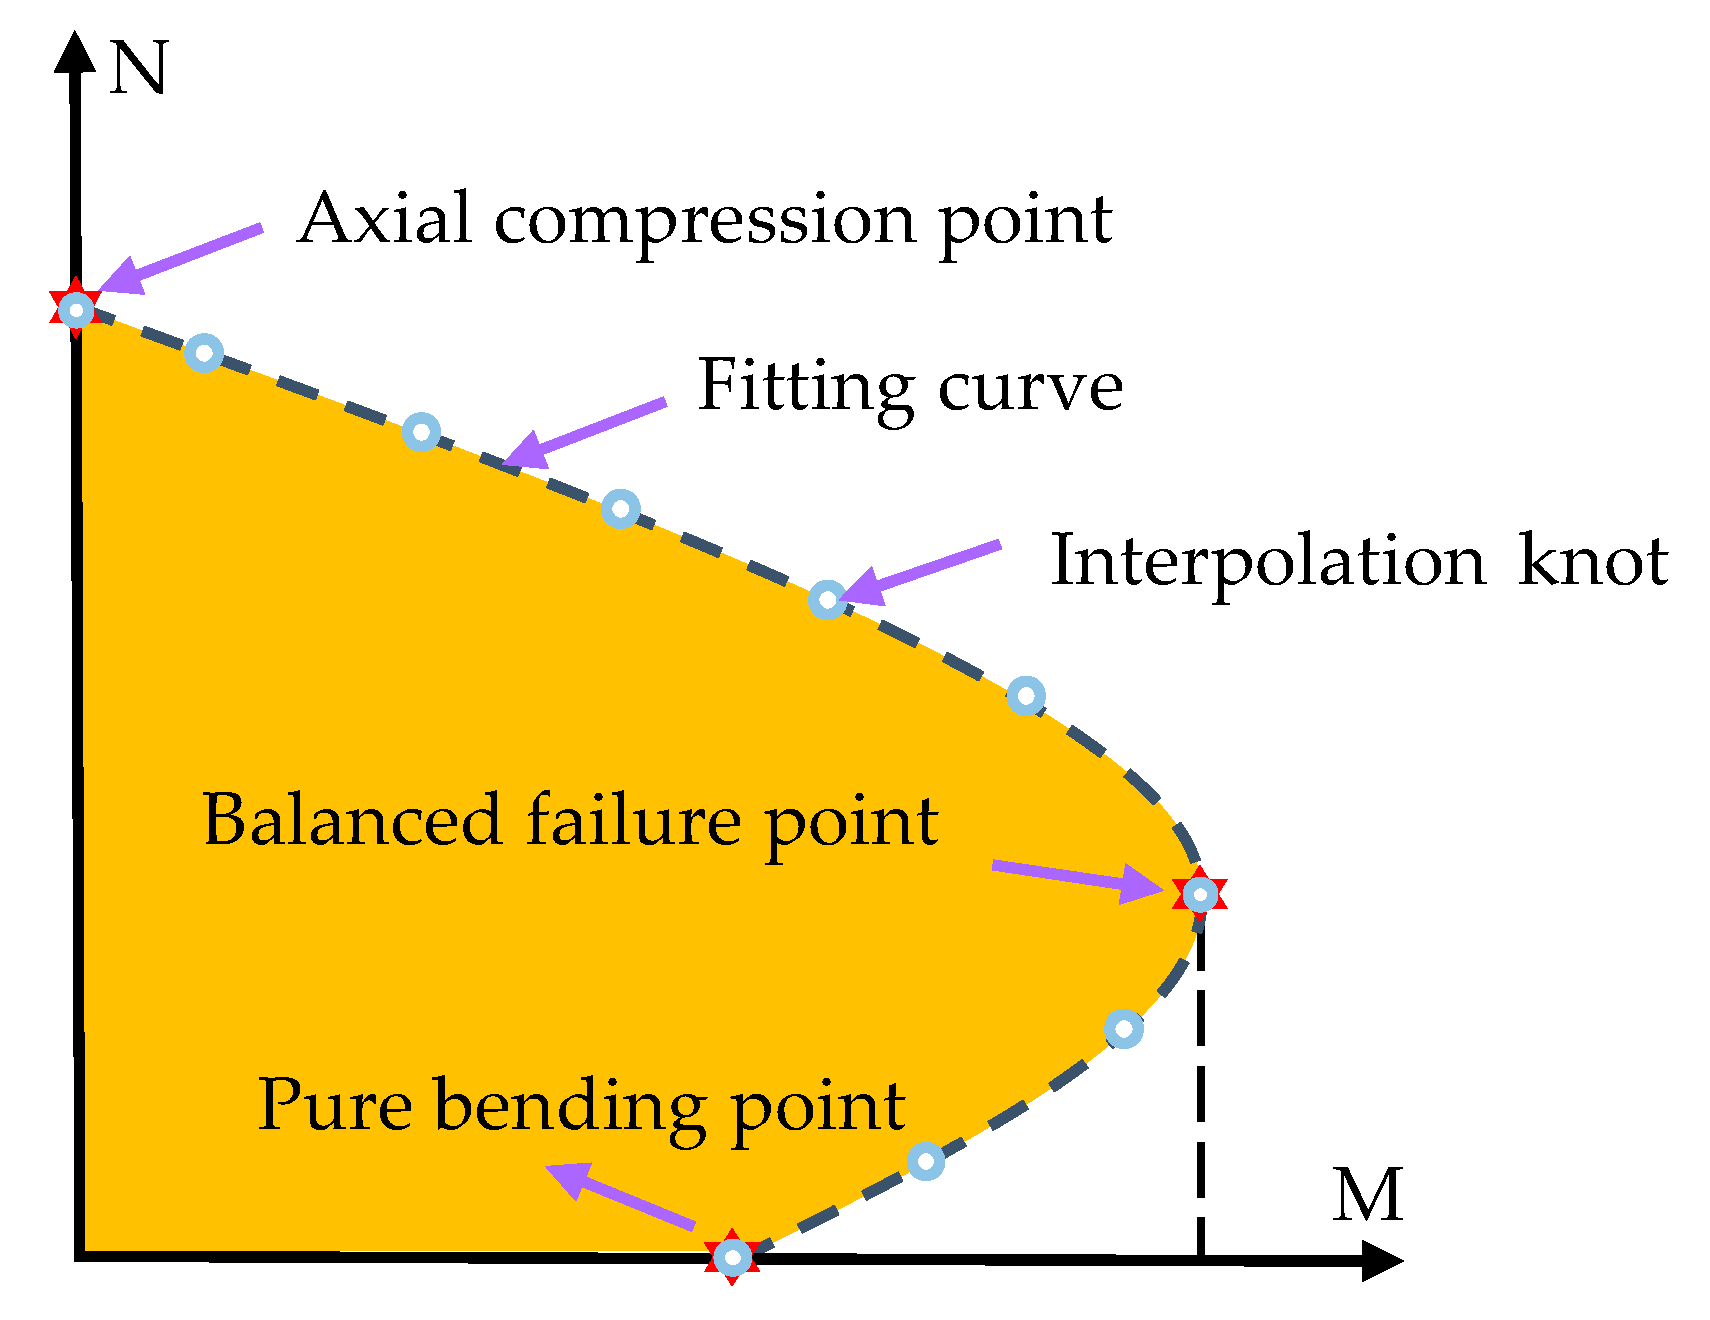
Figure 2.
The flowchart of the proposed method.
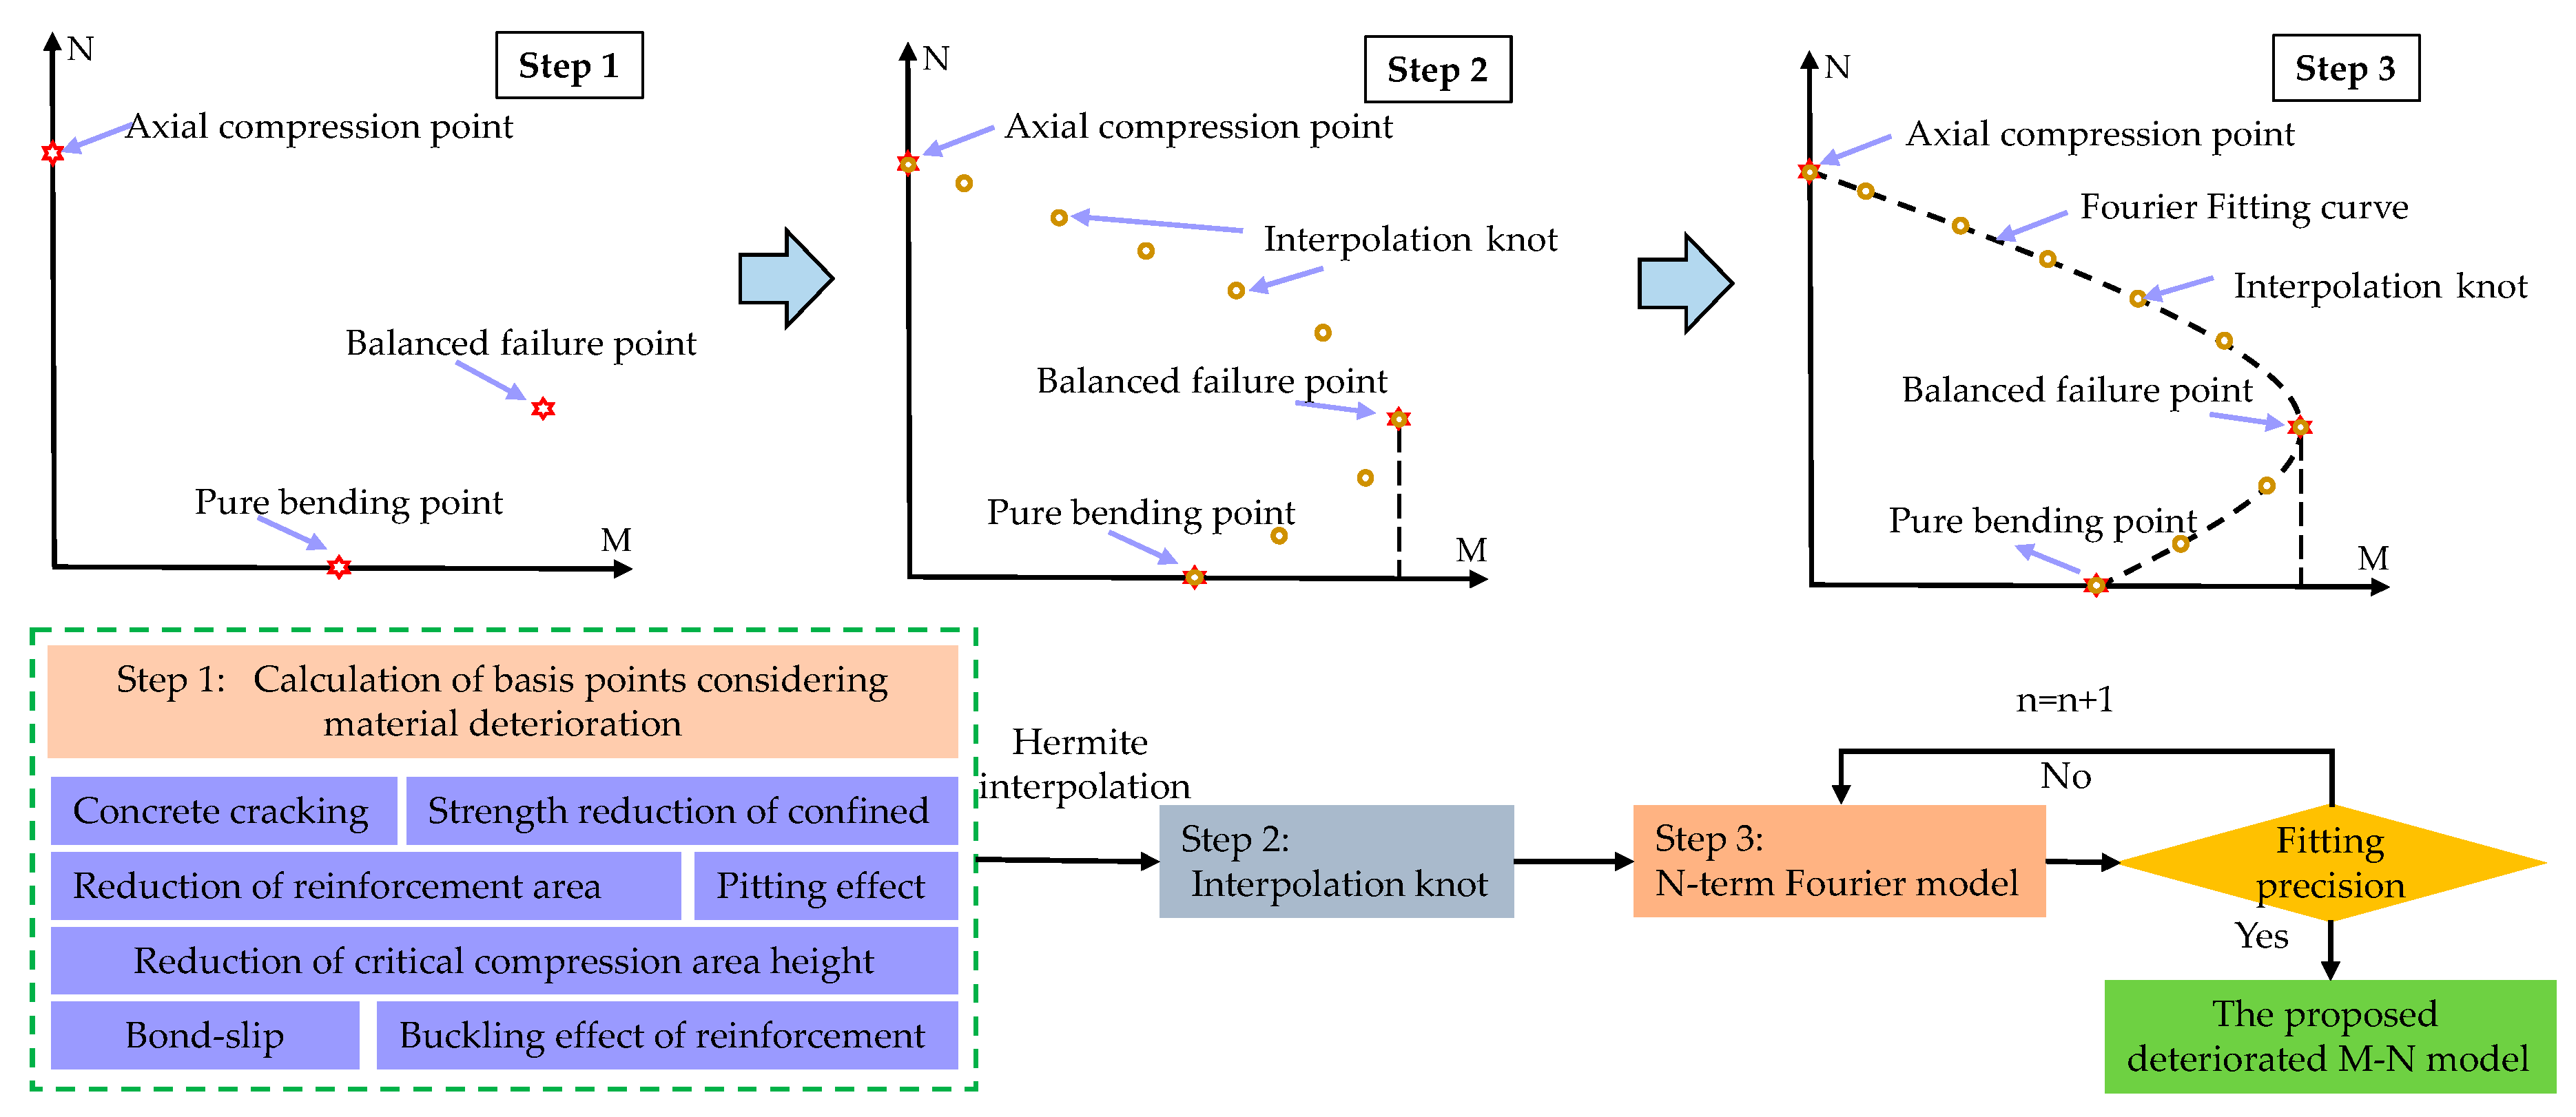
Figure 3.
The bearing capacity model of corroded reinforced concrete (RC) column under axial compression. : cracking area of unconfined concrete; : cracking area of confined concrete; , no cracking area of confined concrete; : the longitudinal reinforcement area considering the buckling effect; and : the height and width of the rectangular column, respectively; : the lateral spacing of longitudinal reinforcement; : the thickness of the concrete cover.
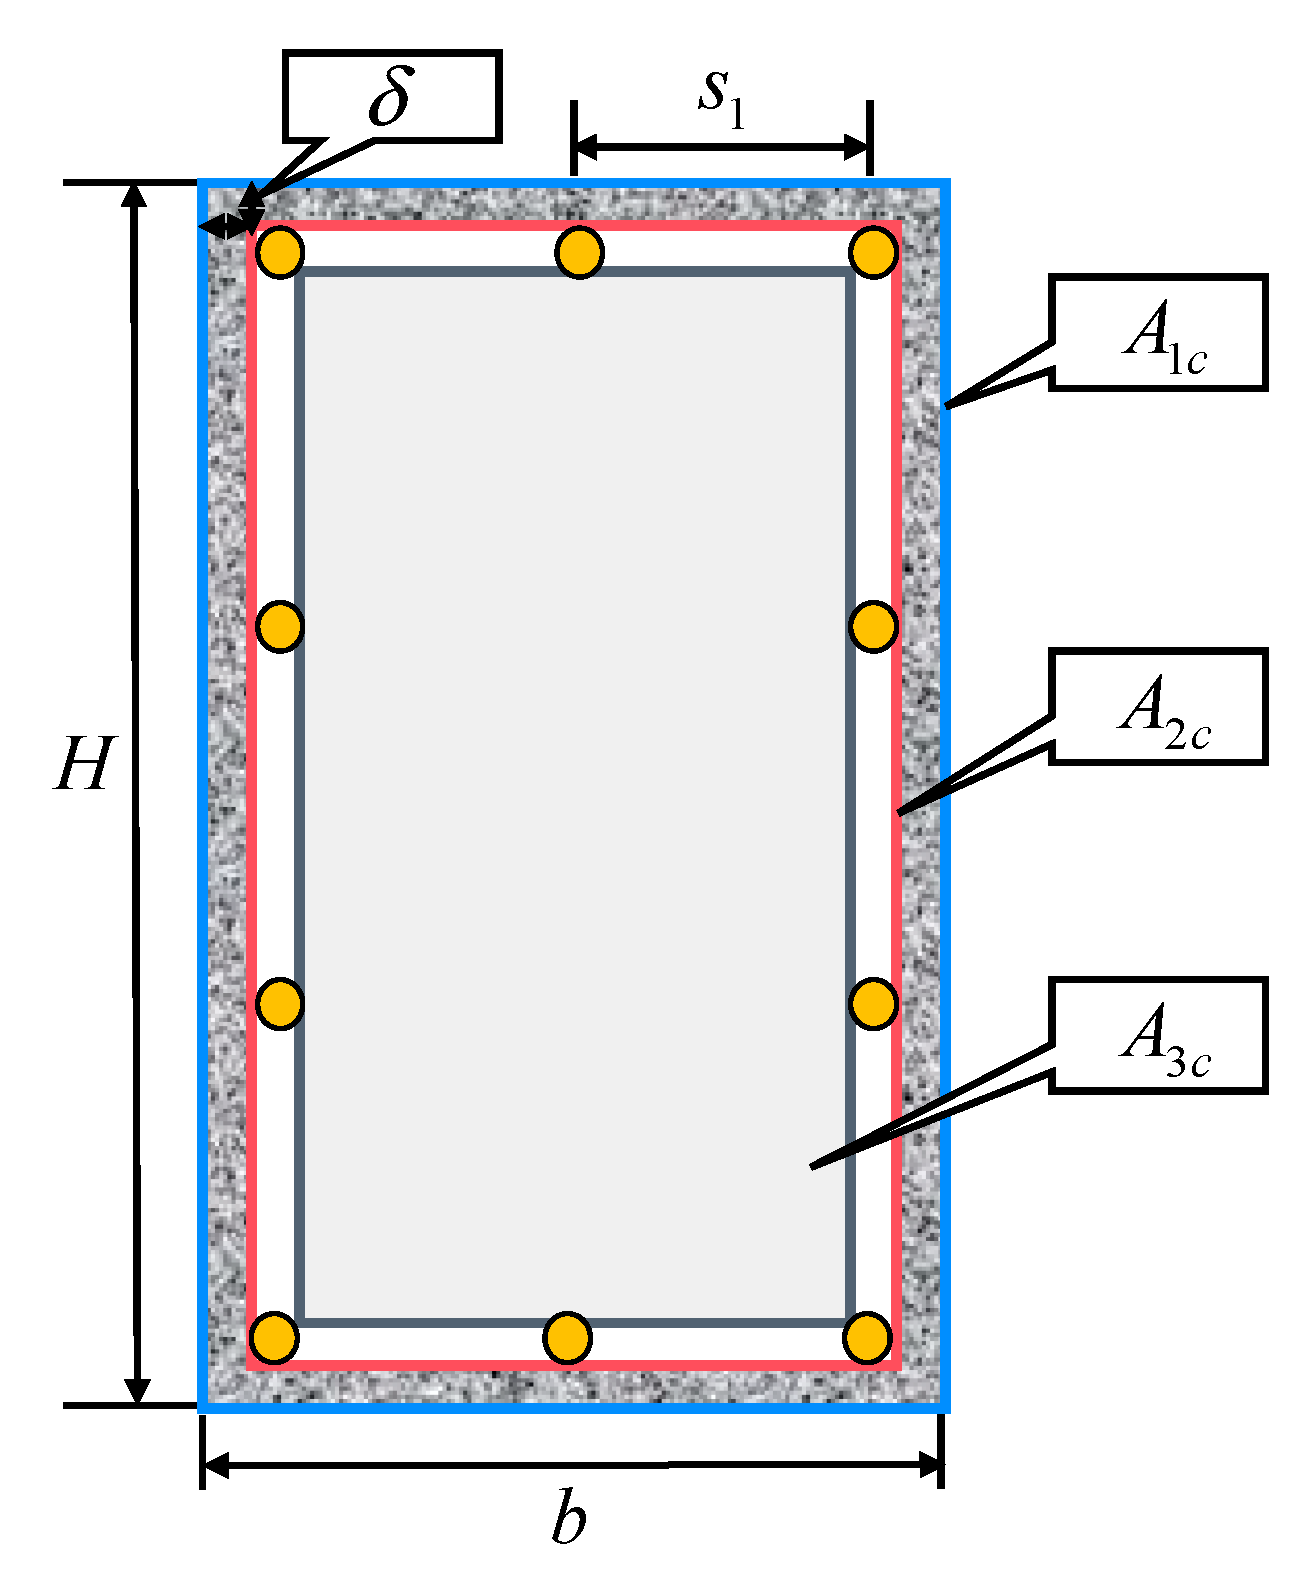
Figure 4.
Pit configuration: : the pitting depth; : the reduced area due to pitting corrosion; and : the angle parameters; : the diameter of the steel bar.
Figure 4.
Pit configuration: : the pitting depth; : the reduced area due to pitting corrosion; and : the angle parameters; : the diameter of the steel bar.
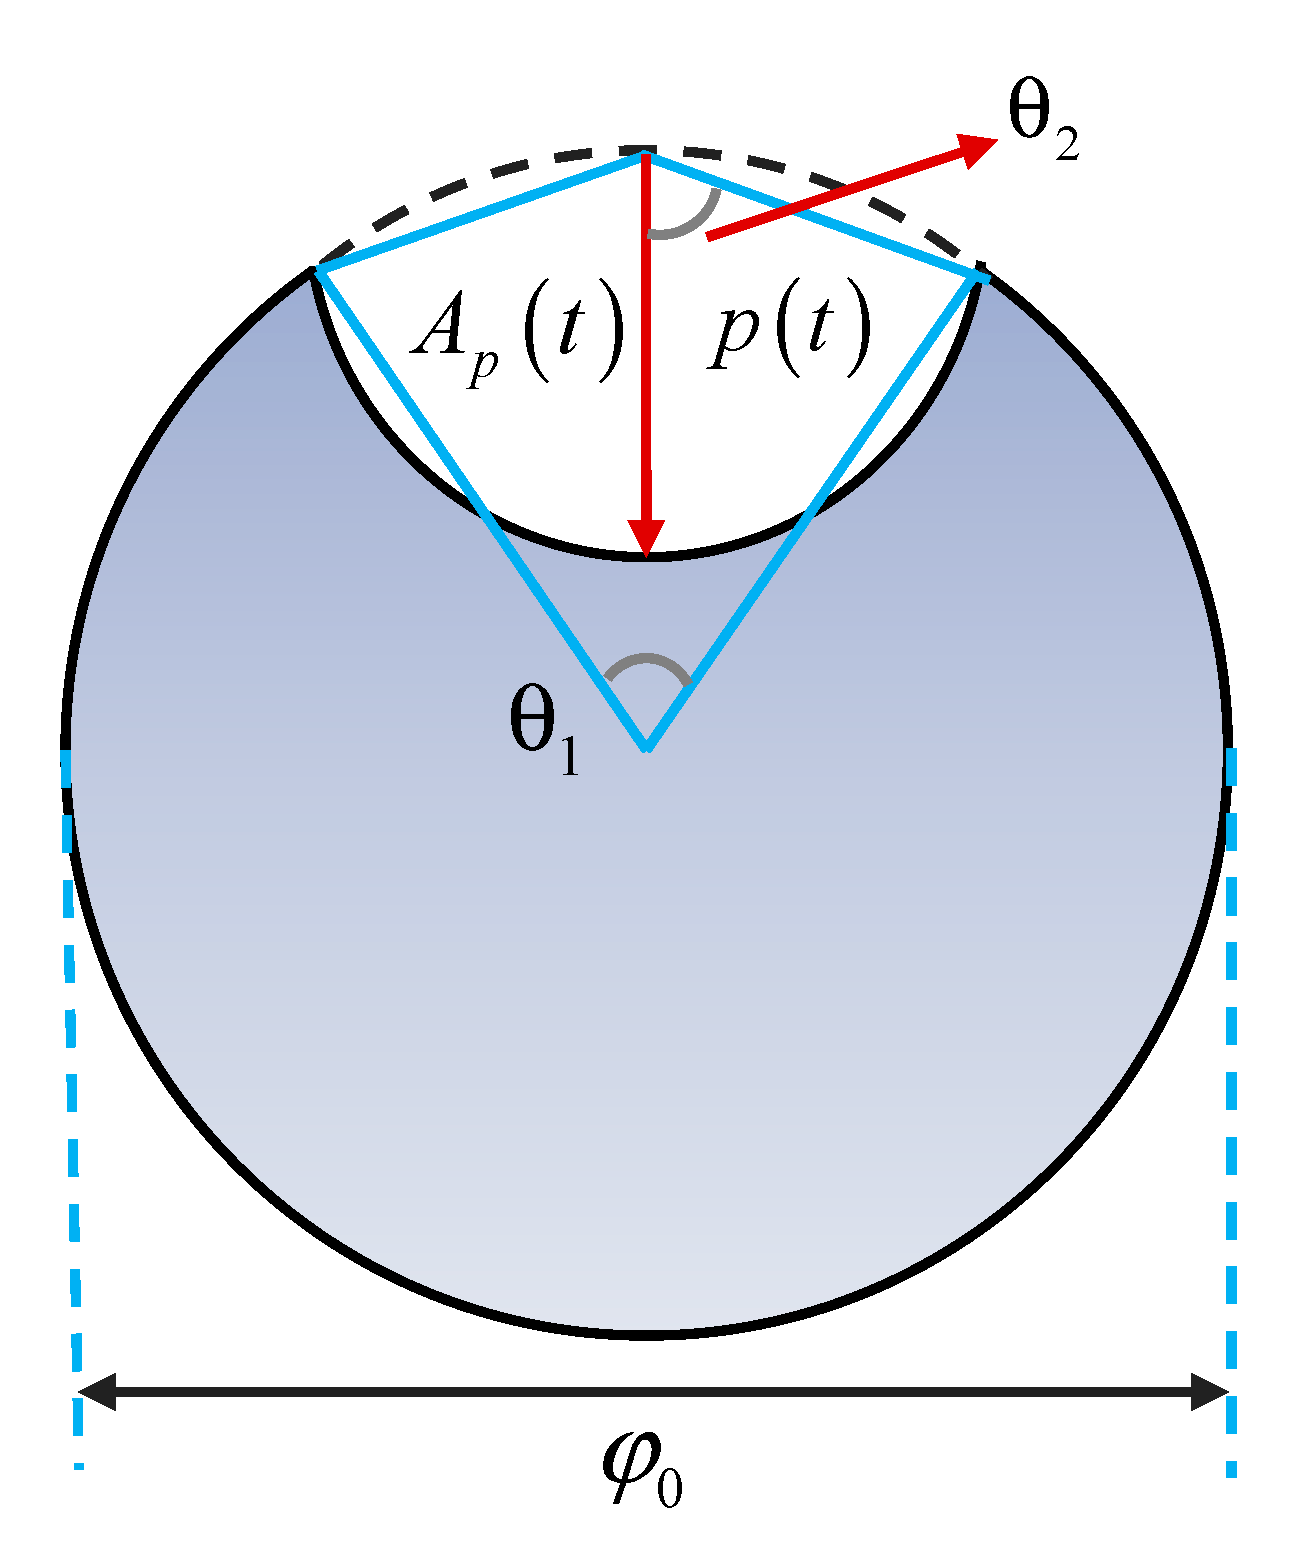
Figure 5.
Distribution of stress and strain in the pure bending section. : the height of compression zone in concrete; : the equivalent rectangle height of the compression zone in concrete; : the ultimate compression strain of concrete; : the distance between the resultant force point of reinforcement and compression edge of the section; : the ultimate tensile strain of the steel bar.
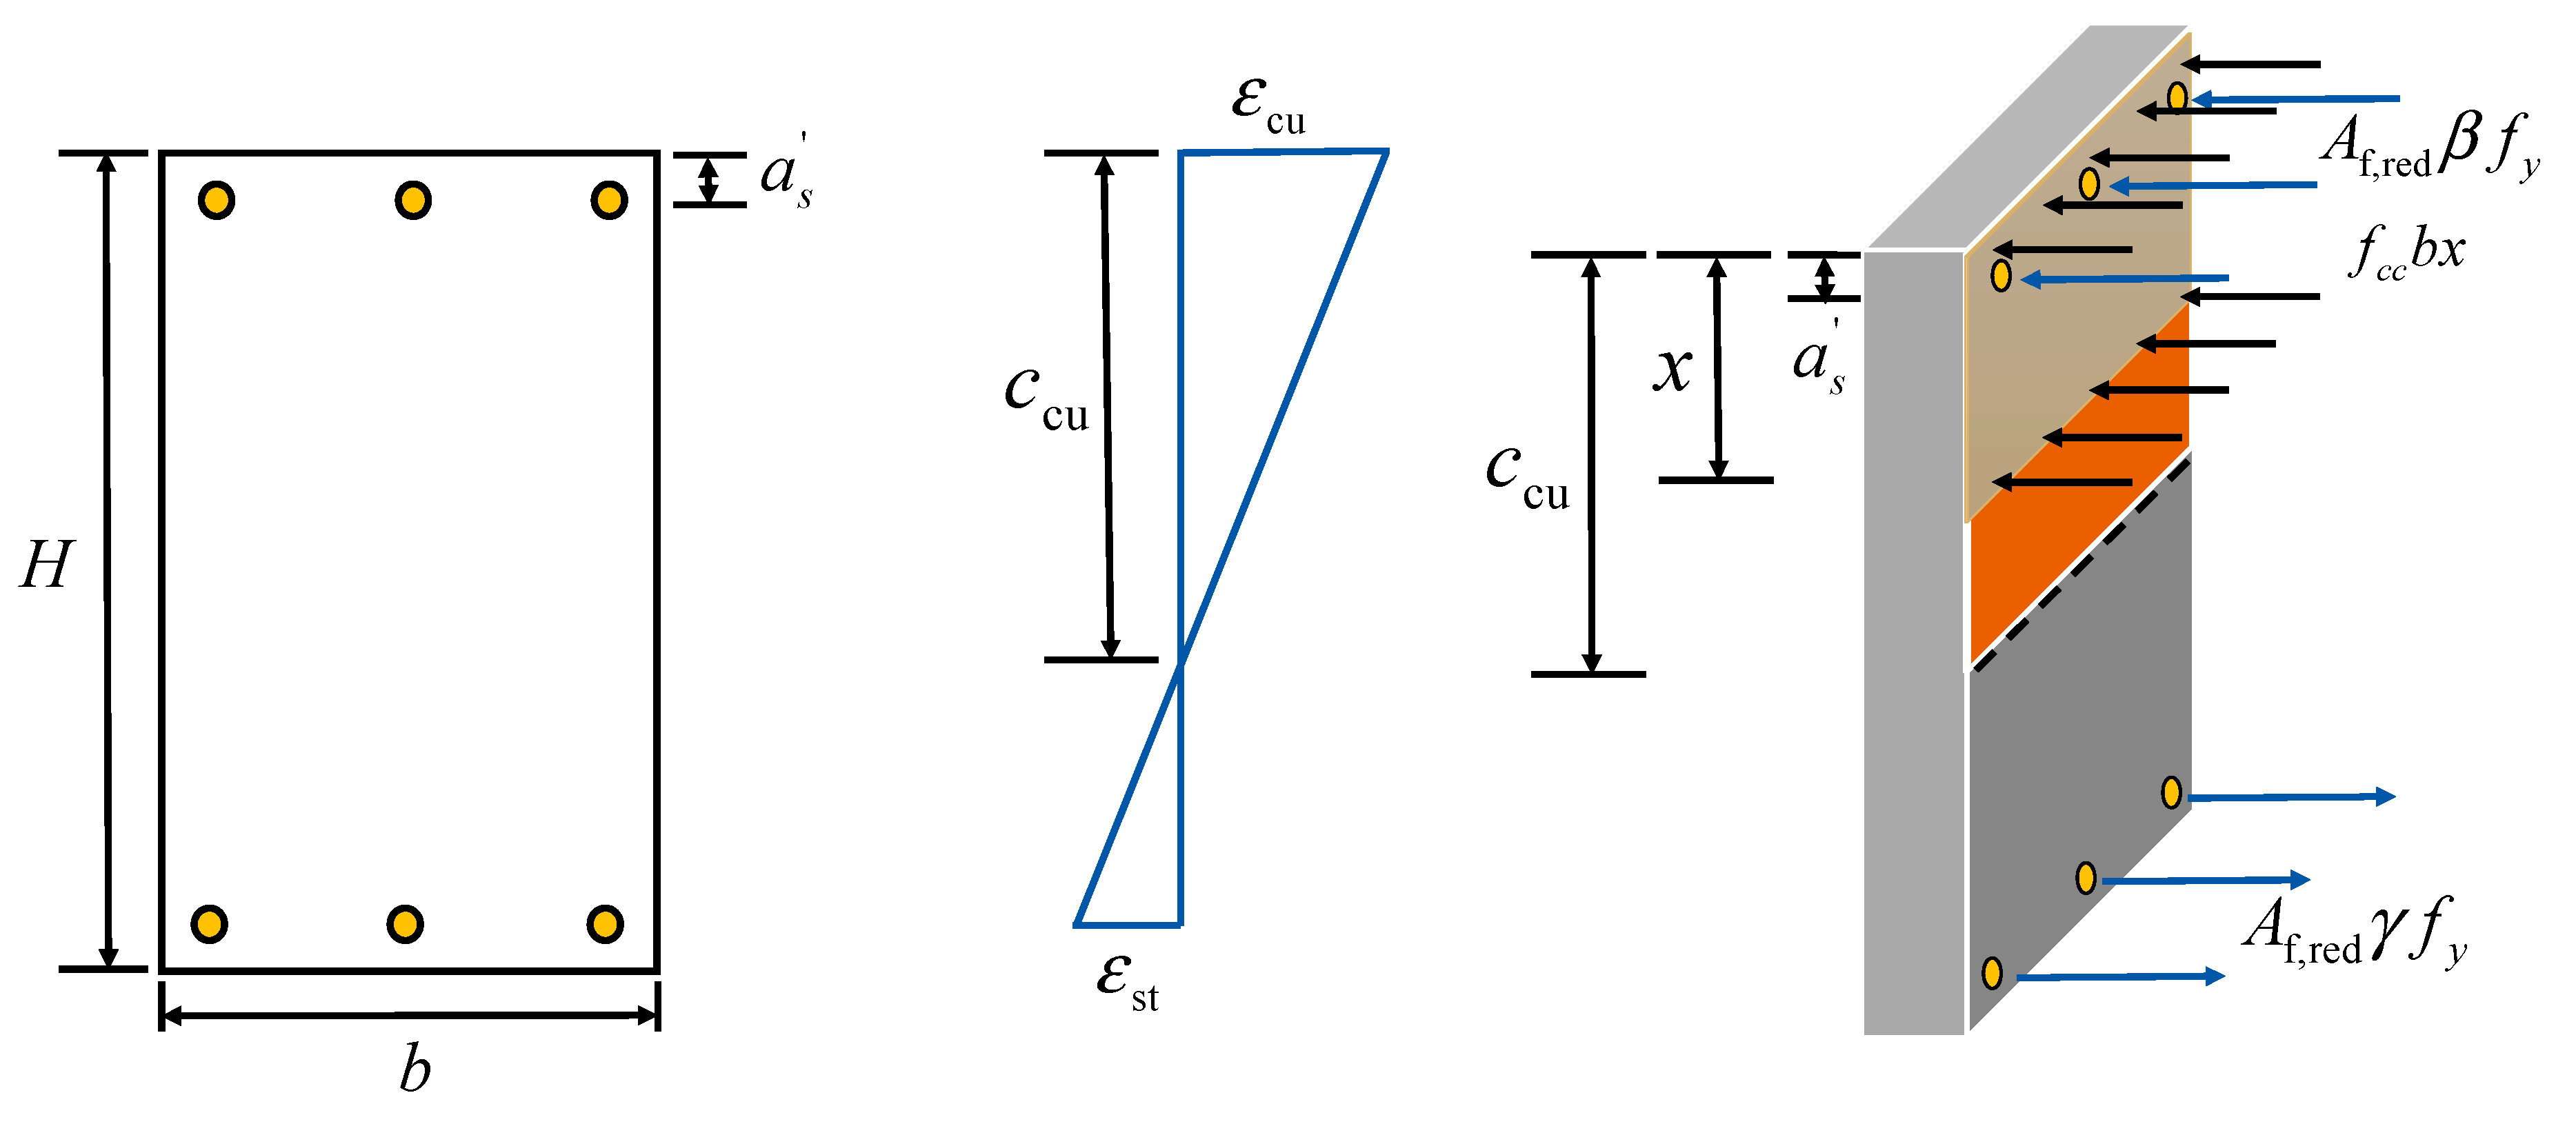
Figure 6.
Comparison between the predicted values and experimental data.
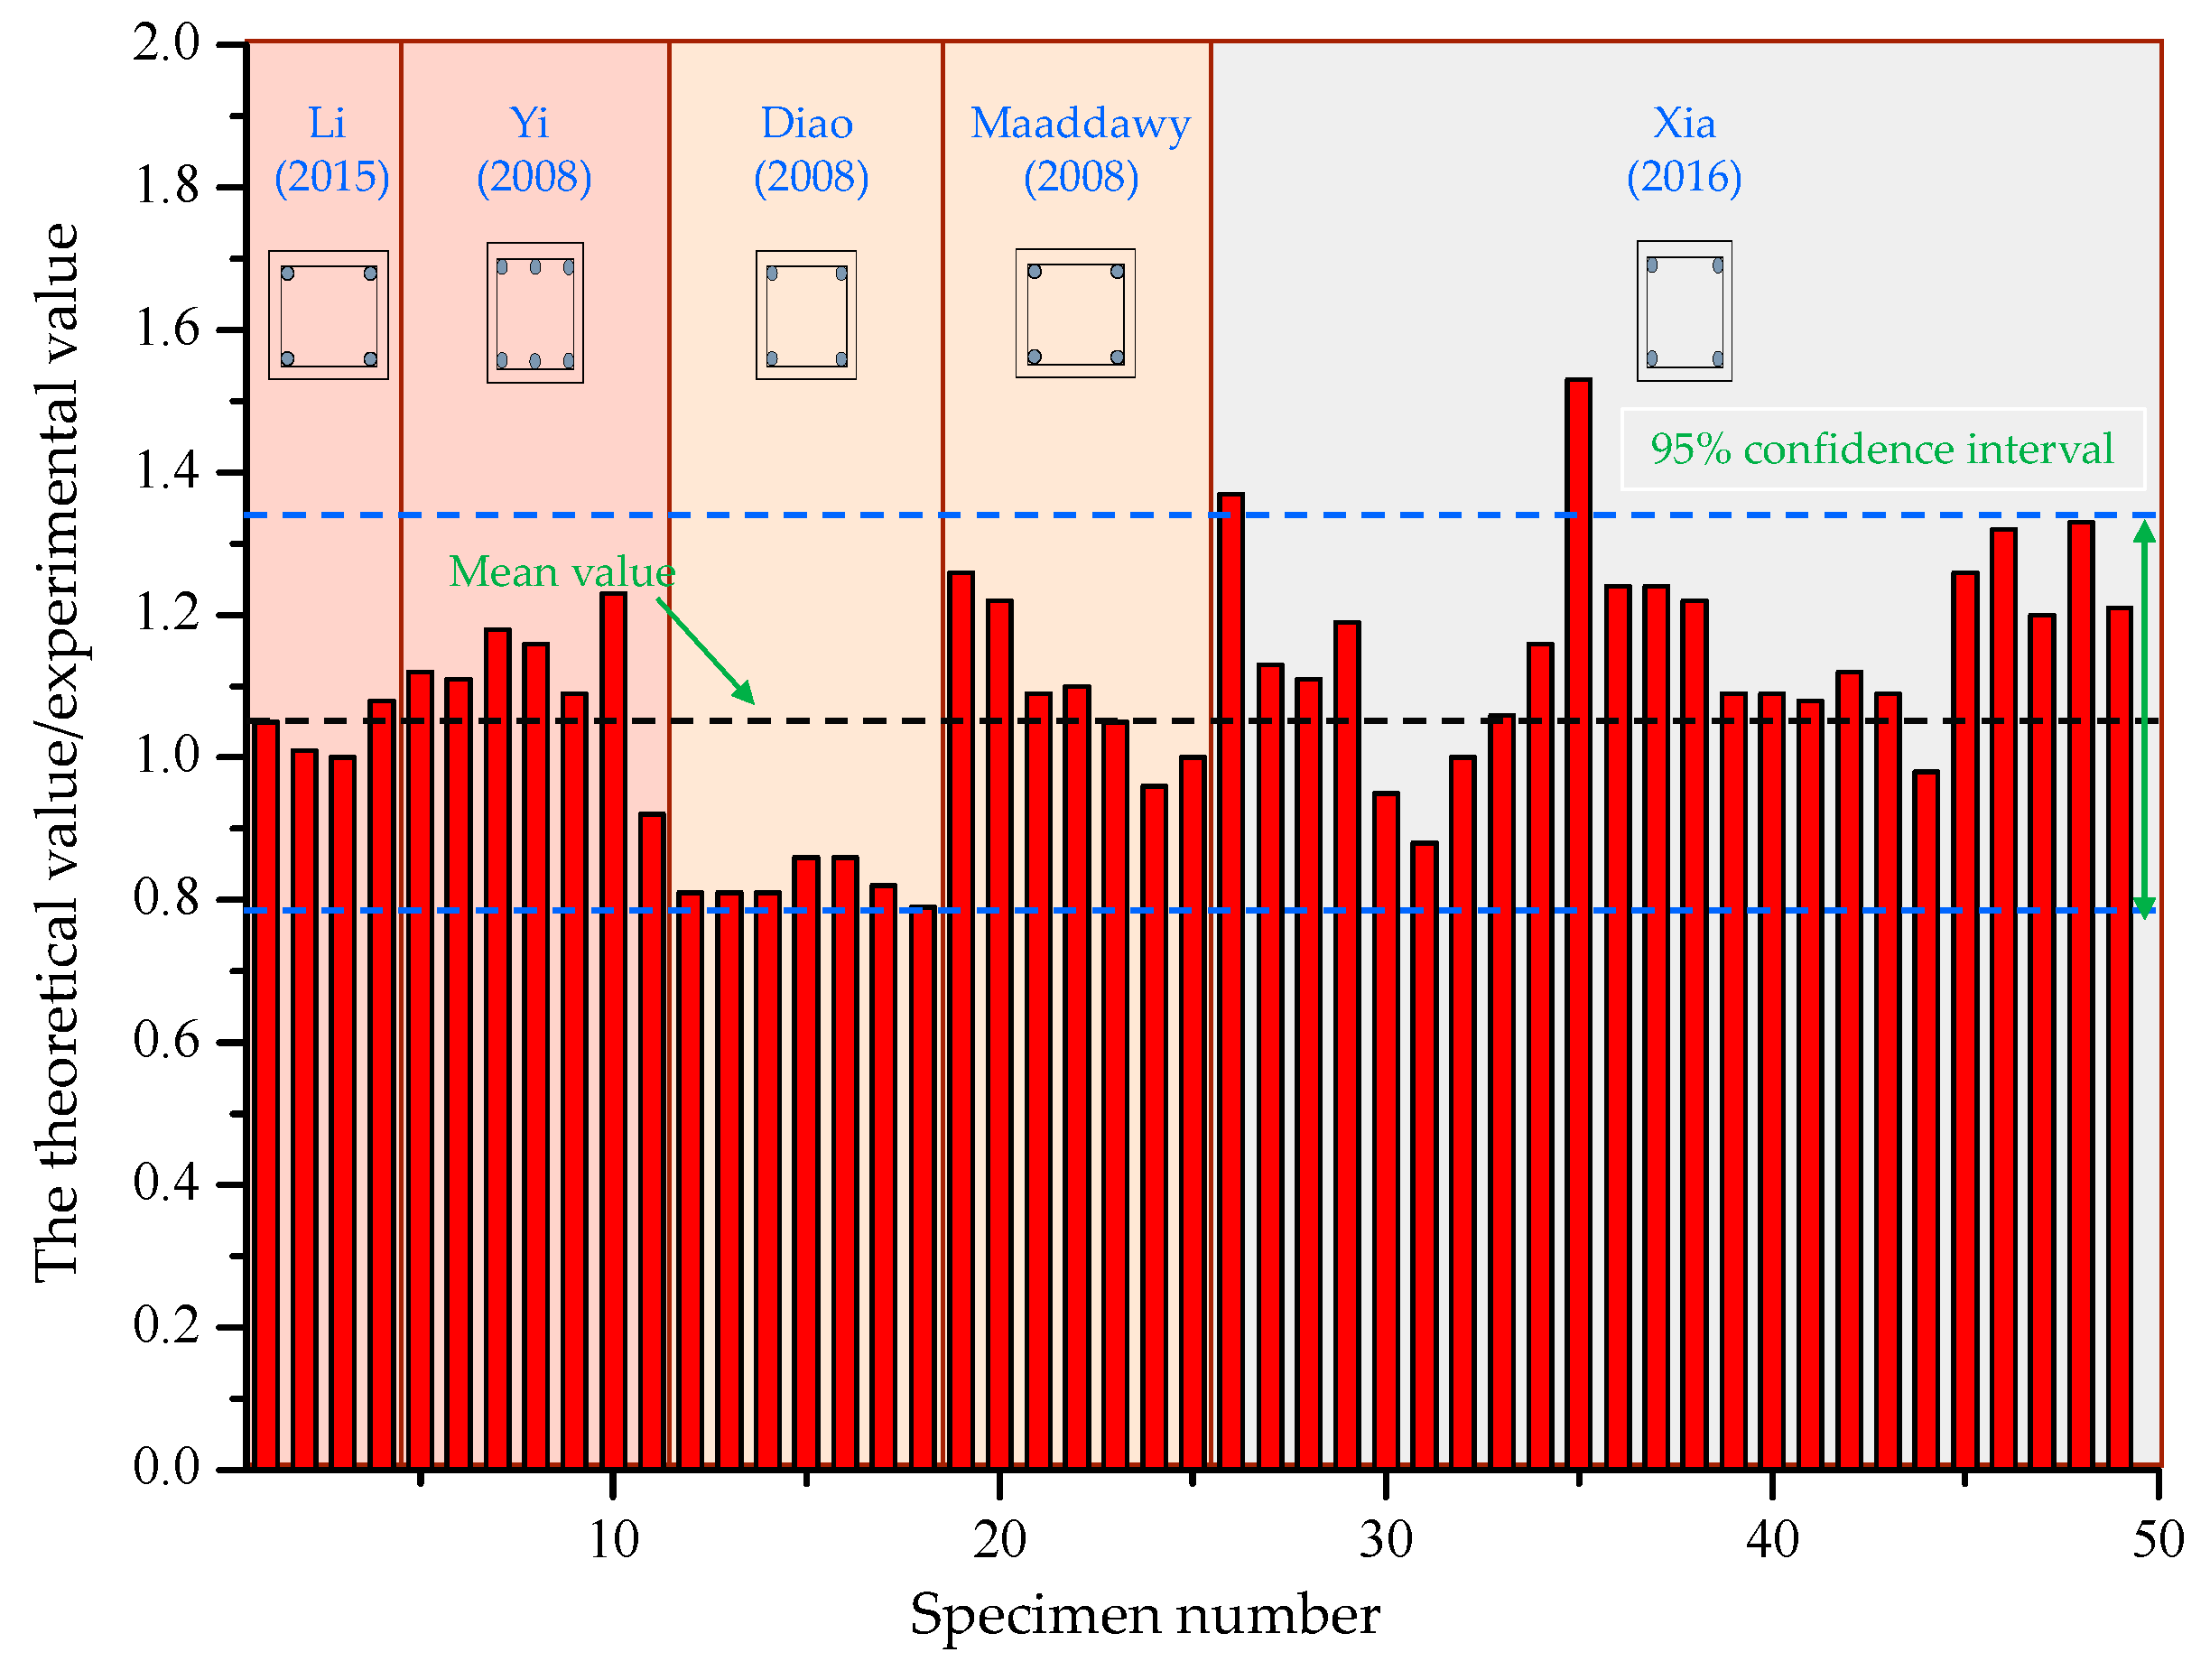
Figure 7.
Comparison between the proposed method and existing model.
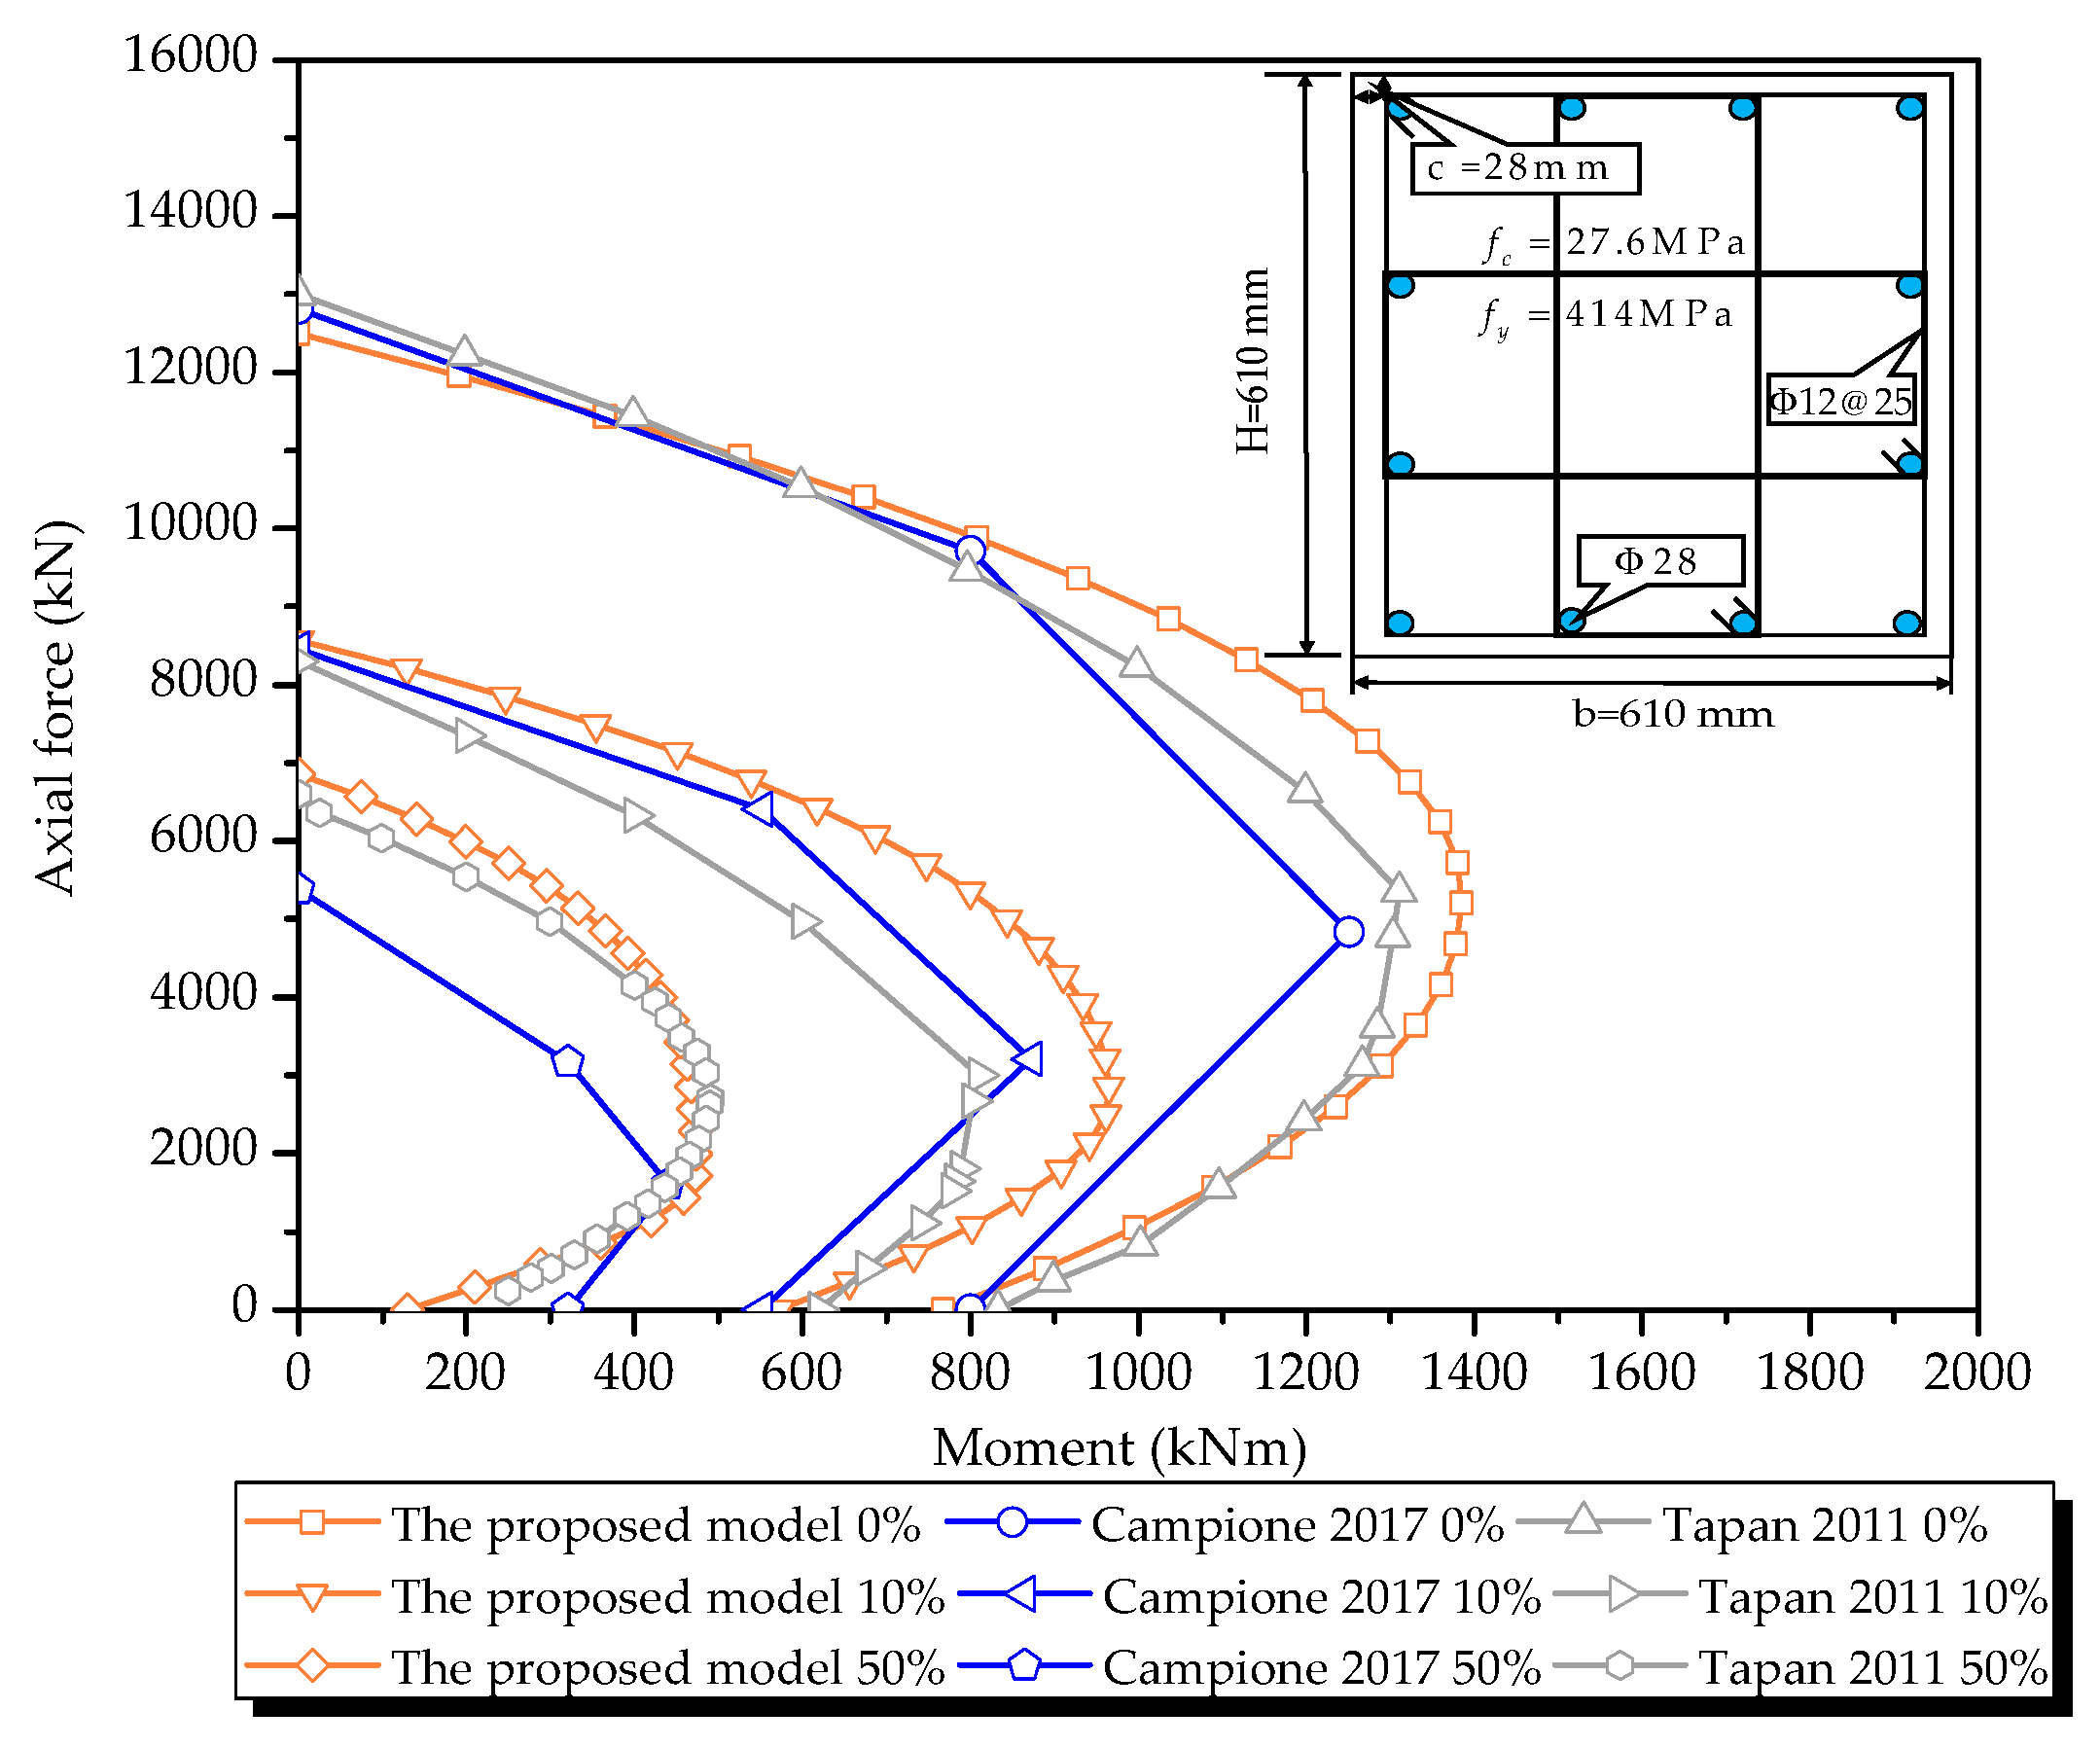
Figure 8.
The strength contributions of axial compression bearing capacity.

Figure 9.
Calculated values of basis points under different parameter combinations.
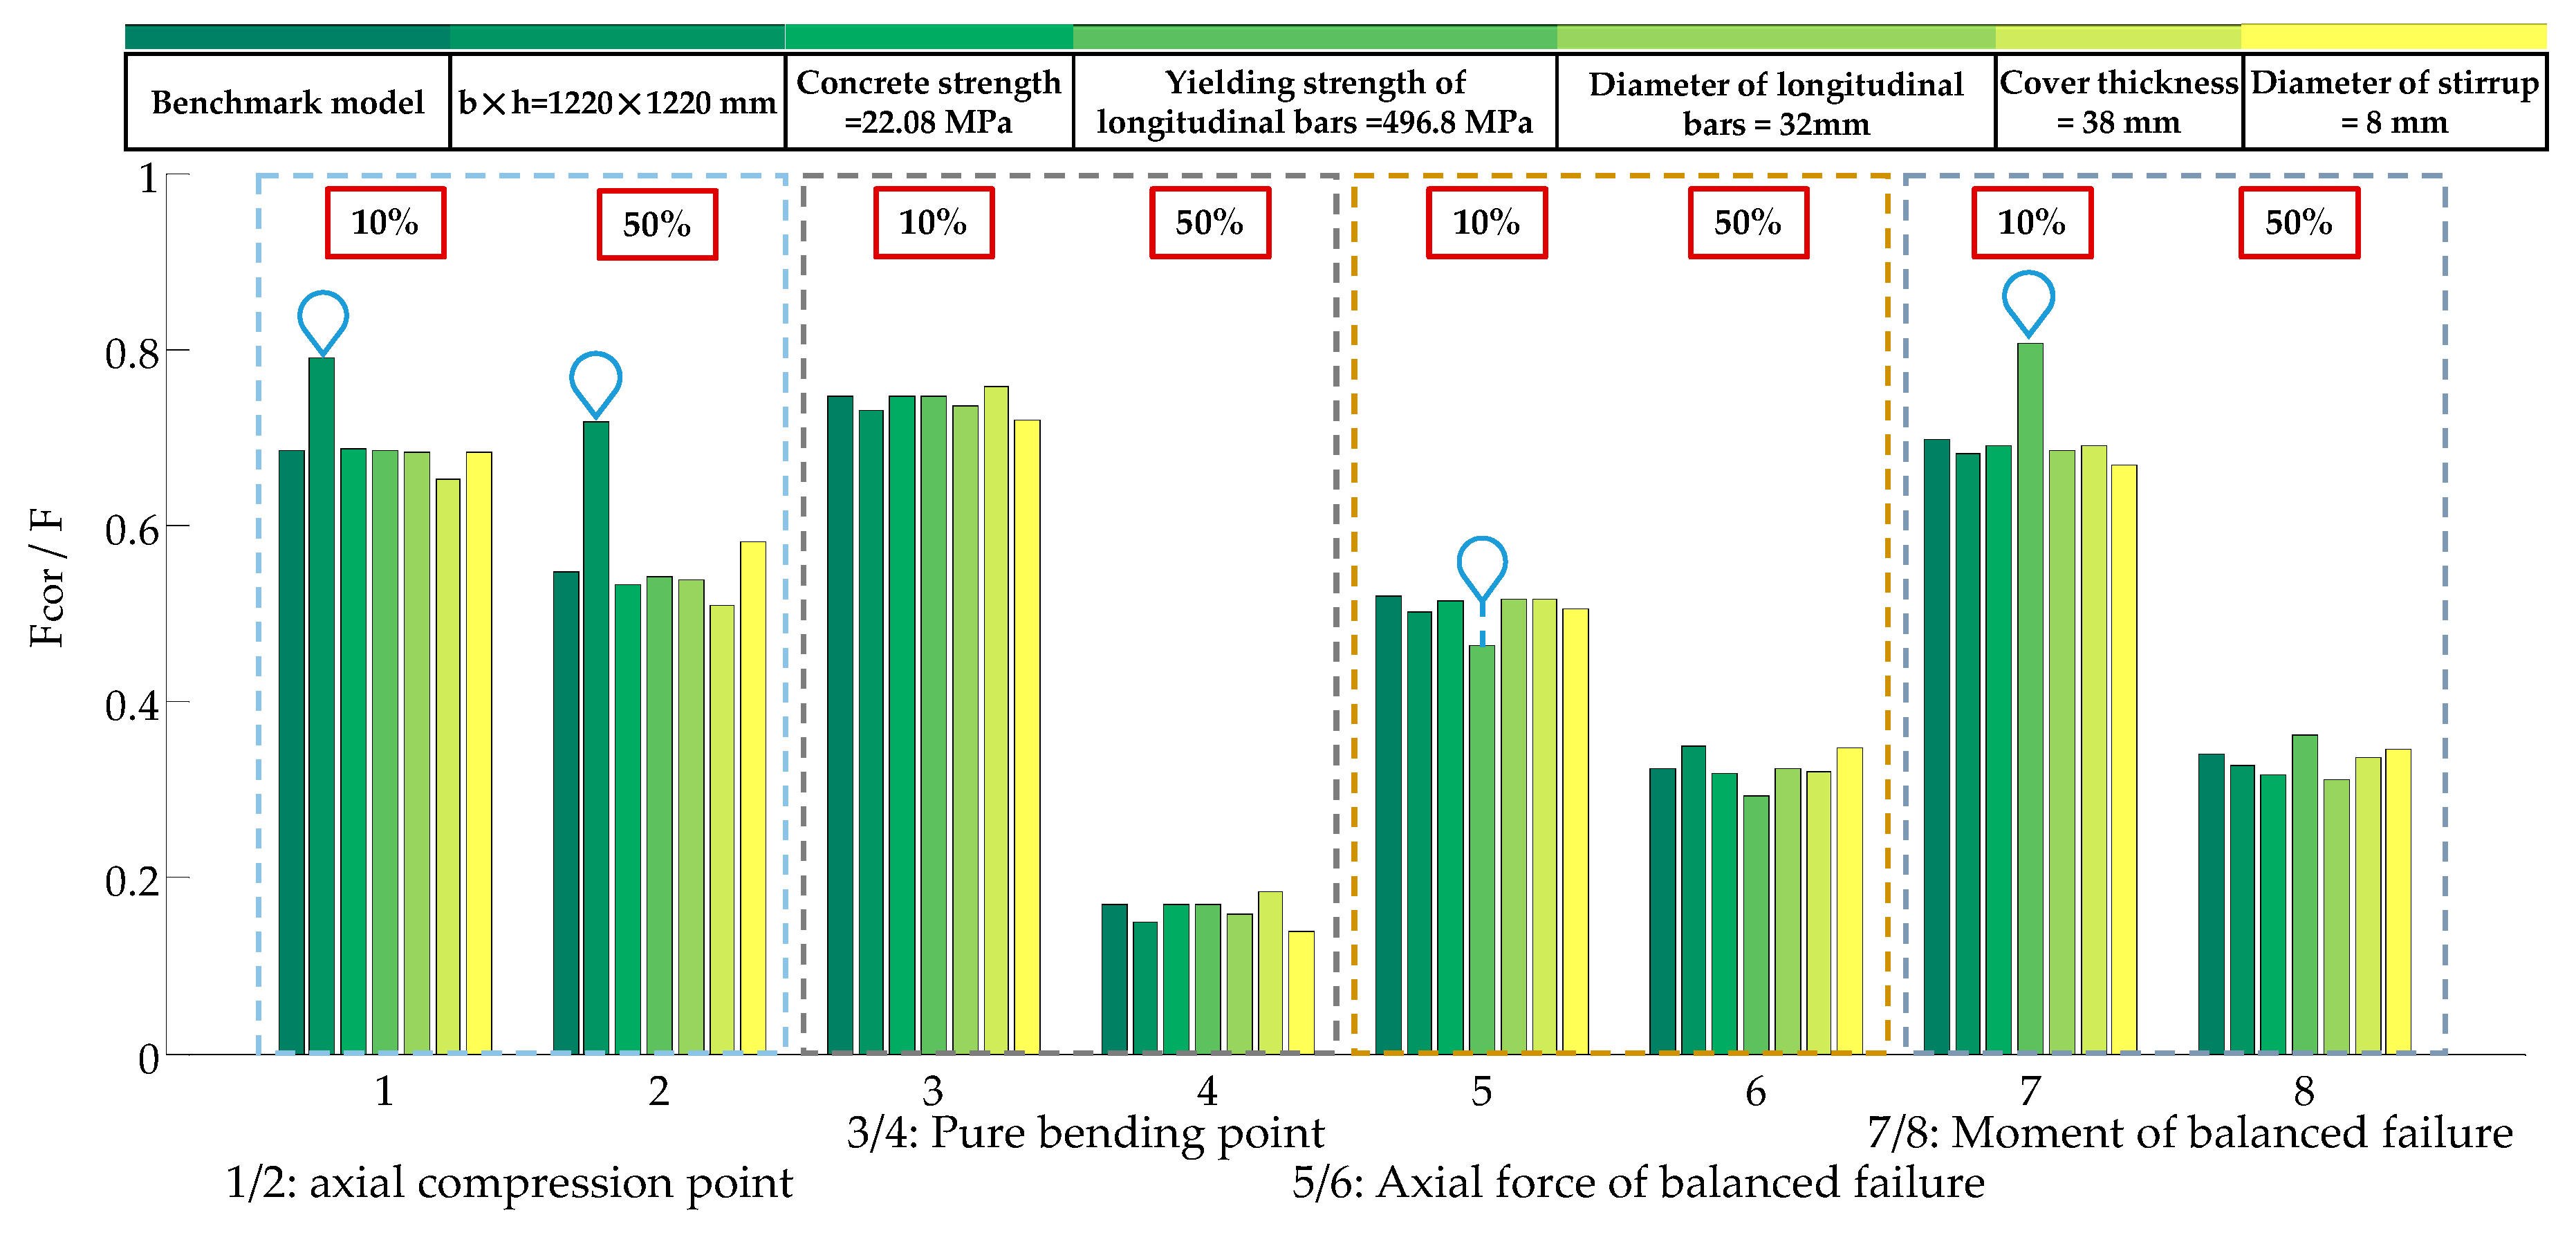
Table 1.
Fourier fitting model to data in Figure 7.
Table 1.
Fourier fitting model to data in Figure 7.
| The Proposed Method | General Model Fourier3: | Goodness of Fit by | |||||||
|---|---|---|---|---|---|---|---|---|---|
| 0% | −407.2 | 986.9 | 1833 | 225.9 | −246.7 | −39.12 | −37.11 | 0.0002071 | 1 |
| 10% | 6.43 × 10¹³ | −9.64 × 10¹³ | −1.92 × 10¹² | 3.86 × 10¹³ | 1.54 × 10¹² | −6.42 × 10¹² | −3.84 × 10¹¹ | 4.48 × 10⁻⁶ | 0.9999 |
| 50% | 300 | −146 | 168.6 | −23.34 | 67.82 | −3.868 | 15.87 | 0.0007697 | 0.9995 |
© 2018 by the authors. Licensee MDPI, Basel, Switzerland. This article is an open access article distributed under the terms and conditions of the Creative Commons Attribution (CC BY) license (http://creativecommons.org/licenses/by/4.0/).
Share and Cite
MDPI and ACS Style
Xin, J.; Zhou, J.; Zhou, F.; Yang, S.X.; Zhou, Y. Bearing Capacity Model of Corroded RC Eccentric Compression Columns Based on Hermite Interpolation and Fourier Fitting. Appl. Sci. 2019, 9, 24. https://doi.org/10.3390/app9010024
AMA Style
Xin J, Zhou J, Zhou F, Yang SX, Zhou Y. Bearing Capacity Model of Corroded RC Eccentric Compression Columns Based on Hermite Interpolation and Fourier Fitting. Applied Sciences. 2019; 9(1):24. https://doi.org/10.3390/app9010024
Chicago/Turabian StyleXin, Jingzhou, Jianting Zhou, Fengbin Zhou, Simon X. Yang, and Yi Zhou. 2019. "Bearing Capacity Model of Corroded RC Eccentric Compression Columns Based on Hermite Interpolation and Fourier Fitting" Applied Sciences 9, no. 1: 24. https://doi.org/10.3390/app9010024
Note that from the first issue of 2016, this journal uses article numbers instead of page numbers. See further details here.