Effect of Heat Treatment on Water Absorption of Chinese fir Using TD-NMR


1
Research Institute of Wood Industry of Chinese Academy of Forestry, Hunan Collaborative Innovation Center for Effective Utilizing of Wood & Bamboo Resources, Beijing 100091, China
2
Zhejiang Academy of Forestry, Hangzhou 310023, China
*
Author to whom correspondence should be addressed.
Appl. Sci. 2019, 9(1), 78; https://doi.org/10.3390/app9010078
Submission received: 8 November 2018
/
Revised: 12 December 2018
/
Accepted: 14 December 2018
/
Published: 26 December 2018
(This article belongs to the Special Issue Applications of Low Field Magnetic Resonance)
Abstract
:Knowledge of the dynamic changes in the water absorption process of heat-treated wood is important for providing a scientific basis for the reasonable application of heat-treated wood, especially for outdoor applications. Nuclear magnetic resonance (NMR) techniques provide detailed information about the moisture components and moisture transport processes in wood, which are not available with other methods. In this work, water absorption of untreated and heat treated Chinese fir (Cunninghamia lanceolata [Lamb.] Hook.) heartwood was investigated using various NMR methods. The heat treatment temperatures were varied between 160 °C and 220 °C. According to the spin-spin relaxation time (T2), there were two components of water in the samples heat-treated at 160 °C and 180 °C as well as the untreated sample, while three components of water were found in the samples heat-treated at 200 °C and 220 °C, and the mass of each component was calculated by the integral peak areas of the T2 curve. The amount of bound water and free water in heat-treated samples were less compared to the untreated ones, and the water absorption decreased correspondingly, due to the increasing heat-treated temperature. The results obtained by one dimensional frequency coding indicated that the heat treatment made wood difficult to be accessed by moisture. Besides, NMR images revealed that the free water absorption in latewood was faster than in earlywood, but earlywood could absorb more water than latewood.
1. Introduction
Wood is a porous material which has a complex hierarchical structure, and the hygroscopic nature makes it sensitive to moist conditions. Water generally exists in wood in two basic states, namely bound water and free water. The former is dissolved or absorbed within the hygroscopic cell walls and associated with them by hydrogen bonding, while the latter occupies the cell lumens and cell cavities and is subject to capillary forces. The amount of moisture contained within wood affects its durability, stability, physical properties, and so on [1,2,3,4], for example, wood with a higher moisture content (MC) is more likely to wear and decay.
Of all the methods for wood modification, heat treatment is an environmentally friendly method to improve timber performance by changing the wood-water relationship without using chemicals. This method is to treat wood at a high temperature, for example, about 200 °C, in a nearly oxygen-free environment, inducing chemical and morphological changes of the wood substance [5]. The changes include the acid hydrolysis and decarboxylation reactions of hemicellulose [6,7], the cleavage of ether linkages and demethoxylation, as well as the condensation reactions of lignin [7,8,9]. In addition, high temperature would result in the increase of cellulose crystallinity [10,11]. All these changes might affect the amount of accessible hydroxyl sites and the pore structure of wood. Consequently, the water state and water content adsorbed in wood would be influenced when wood is situated in a humid environment or immersed in water.
Being utilized for the noninvasive, quick and quantitative characterization, the nuclear magnetic resonance (NMR) technique is known as a powerful tool, which can be used to understand wood structure and the dynamics of water in wood [12]. In previous studies, the signal value from the free induction decay (FID) curve, the first echo amplitude value of the decay curve obtained by the Carr-Purcell-Meiboom-Gill (CPMG) sequence and the integral peak areas of NMR relaxation curves according to the CPMG experiment were applied to describe the MC changes during the wood drying and moisture adsorption processes [12,13,14,15,16,17,18,19,20]. Since the decay rate of the NMR signal is relevant to the mobility and local environment of molecules, the moisture components (bound water and free water) can easily be separated by the different spin–spin (or transverse) relaxation time (T2) values for either hardwood or softwood [15,21,22,23,24,25,26,27,28]. Moreover, bound water that is hydrogen bonded to the wood cell wall components, or in the void spaces between the cellulose chains and in the cell wall micropores, and free water from earlywood or latewood could be distinguished [28]. The spatial distribution of water in wood can be reflected visually by magnetic resonance imaging in a nondestructive way, which is difficult to achieve using other methods [28,29,30,31].
The water absorption performances are extremely important factors defining the dimensional stability, decay resistance and other physical properties of timber. A number of experiments have been carried out in order to investigate the effects of heat treatment on the water absorption performance of wood [32,33,34,35,36]. Most of them dealt with the changes of water absorption amount and rate, and the dimensional change caused by water absorption. However, the whole progress of changes in the water absorption process needs further investigation. For example, it is still unclear whether the heat treatment caused the absorption rate and amount change of both bound water and free water, or only one of these two water components is influenced. In addition, further research of the water distribution in heat-treated wood is needed. Therefore, it is necessary to use NMR technology to give insights into the dynamic change of water absorption process of heat-treated wood, which was expected to provide a scientific basis for the reasonable application of heat-treated wood, especially for outdoor applications. In this study, various NMR techniques were used to investigate changes of the longitudinal water absorption performance of Chinese fir (Cunninghamia lanceolata [Lamb.] Hook.) before and after heat treatment. The samples were immersed in the water and the NMR detections were carried out to observe the progress of the water uptake as a function of immersion time. The total integral area of the T2 curve was applied to estimate the MC and water components, and the corresponding percentage was also determined. Furthermore, the distribution of water in wood was visualized using 1D and 2D magnetic resonance imaging.
2. Materials and Methods
2.1. Sample Preparation and Heat Treatment Process
In this study, a 4 m long log was cut at breast height from a freshly felled 20 year old Chinese fir (Cunninghamia lanceolata [Lamb.] Hook.) from a forest in Kaihua, China. The log was first cut off into eight 500-mm-long sections after air drying. Then 8 sticks with a cross section dimension of 15 × 15 mm2 were sawn from the 6-8 annual rings of each section, as shown in Figure 1. Finally, each stick was cut into three parts with dimensions of 150 × 15 × 15 mm3 (longitudinal × radial × tangential, L × R × T), and 115 defect-free wood specimens in total were chosen to conduct the experiment. These specimens were randomly divided into 5 groups. There were 15 specimens for the control group and 25 for the other 4 groups for heat treatment. The heat treatments proceed at four different temperatures (160, 180, 200 and 220 °C) for 2 h in airtight equipment, and the inside atmosphere controls within comprising no more than 2 percent oxygen content. The MC of the pre-treated specimens was 9.8–12.5%, and decreased to 3.7–7.6% after the heat treatment.
In order to pick out the specimens to undergo time domain nuclear magnetic resonance (TD-NMR) detection, samples with dimensions of 10 × 15 × 15 mm3 (L × R × T) were cut in the middle of the 115 specimens; the two tangential sections and two radial sections of the samples were sealed by epoxy resin to make the water uptake only occur through the cross sections when immerse in distilled water. The samples were oven-dried at 103 °C until reaching a constant mass and weighed before and after they were sealed. Thereafter, samples were immersed in distilled water and weighed at pre-setting intervals to obtain the MC change. The average MC change of each group could be found by means of statistical analysis. Samples whose MC changes were close to the average MC of its group were chosen to conduct the TD-NMR experiment.
2.2. TD-NMR Experiments
The TD-NMR experiments were carried out by a MesoMR23-060H-I NMR instrument (Niumag Co., Ltd., Suzhou, China) with a 0.52 Tesla permanent magnet (23 MHz proton resonance frequency), operating at 32.00 °C. The dimension of samples used for TD-NMR experiments was 50 mm × 15 mm × 15 mm. Similar to the process described in Section 2.1, the experiment samples were oven-dried and weighed before and after they were sealed with epoxy resin. After that, samples were immersed in distilled water in transparent vessels with the aid of a stainless steel net to prevent them from floating. At certain time intervals, the samples were taken out of the vessels and the extra water on the surface removed. The sample was placed into the probe one at a time after weighting. The Carr–Purcell–Meiboom–Gill (CPMG) pulse sequence was used to measure the T2 of the samples. 15,000 echoes with 64 scans were acquired, and the echo time and repetition time between two successive scans were 0.15 ms and 4 s, respectively.
For the 1D and 2D nuclear magnetic resonance imaging (NMR imaging), a field gradient of 0.05 Tm−1 was employed. The magnetic field exists perpendicular to the longitudinal direction of the wood sample, while the field gradient is nominally parallel to the longitudinal direction, therefore we could produce spatial resolution along the samples. In the 1D NMR imaging experiments, one-dimensional frequency coding was utilized to collect the MC profile along the longitudinal direction of the specimen, and the echo time and repetition time were 0.2 ms and 1 s, respectively. To perform 2D NMR imaging, multilayer spin echo imaging sequence was used to obtain images that could visualize the distribution of water in wood, the slice width was 2.5 mm, and the echo time and repetition time were 550 ms and 9.4 ms, respectively.
To investigate the effect of heat treatment on water absorbing performance of wood, calibrations of the integral peak area of T2 relaxation curve with respect to MC was performed for individual samples. The feasibility of using T2 relaxation curve to monitor the dynamic change of moisture during the water uptake process could be evaluated according to the linear correlation coefficient (R2). The content of bound water and free water in the samples could be quantified during each water absorption stage, due to the fact that the integral area of the T2 curve is in proportion to the water amount. The calculation was based on Equation (1):
where MCi is the content of bound water or free water; Areai is the integral area of bound water peak or free water peak; ΣArea is the total integral area of T2 curve; WM is the water mass of the sample at each water absorption stage, which can be calculated by a dry basis; OW is the oven dry weight of the sample.
3. Results and Discussion
3.1. Relationship between MC and NMR Signal
The gravimetrically determined MC against the integral peak area of the T2 relaxation curve and their linear fitting curves, as well as the regression equations are displayed in Figure 2. As shown in the figure, the dry-basis MC has a significant linear correlation with the integral peak area of the T2 relaxation curve with R2 higher than 0.99 for all samples. This provides a clear illustration that the integral peak area of the T2 relaxation curve is proportional to the total water content of the sample, and hence it is a feasible method to investigate the water uptake process of the heat-treated wood.
3.2. Water States and Migration
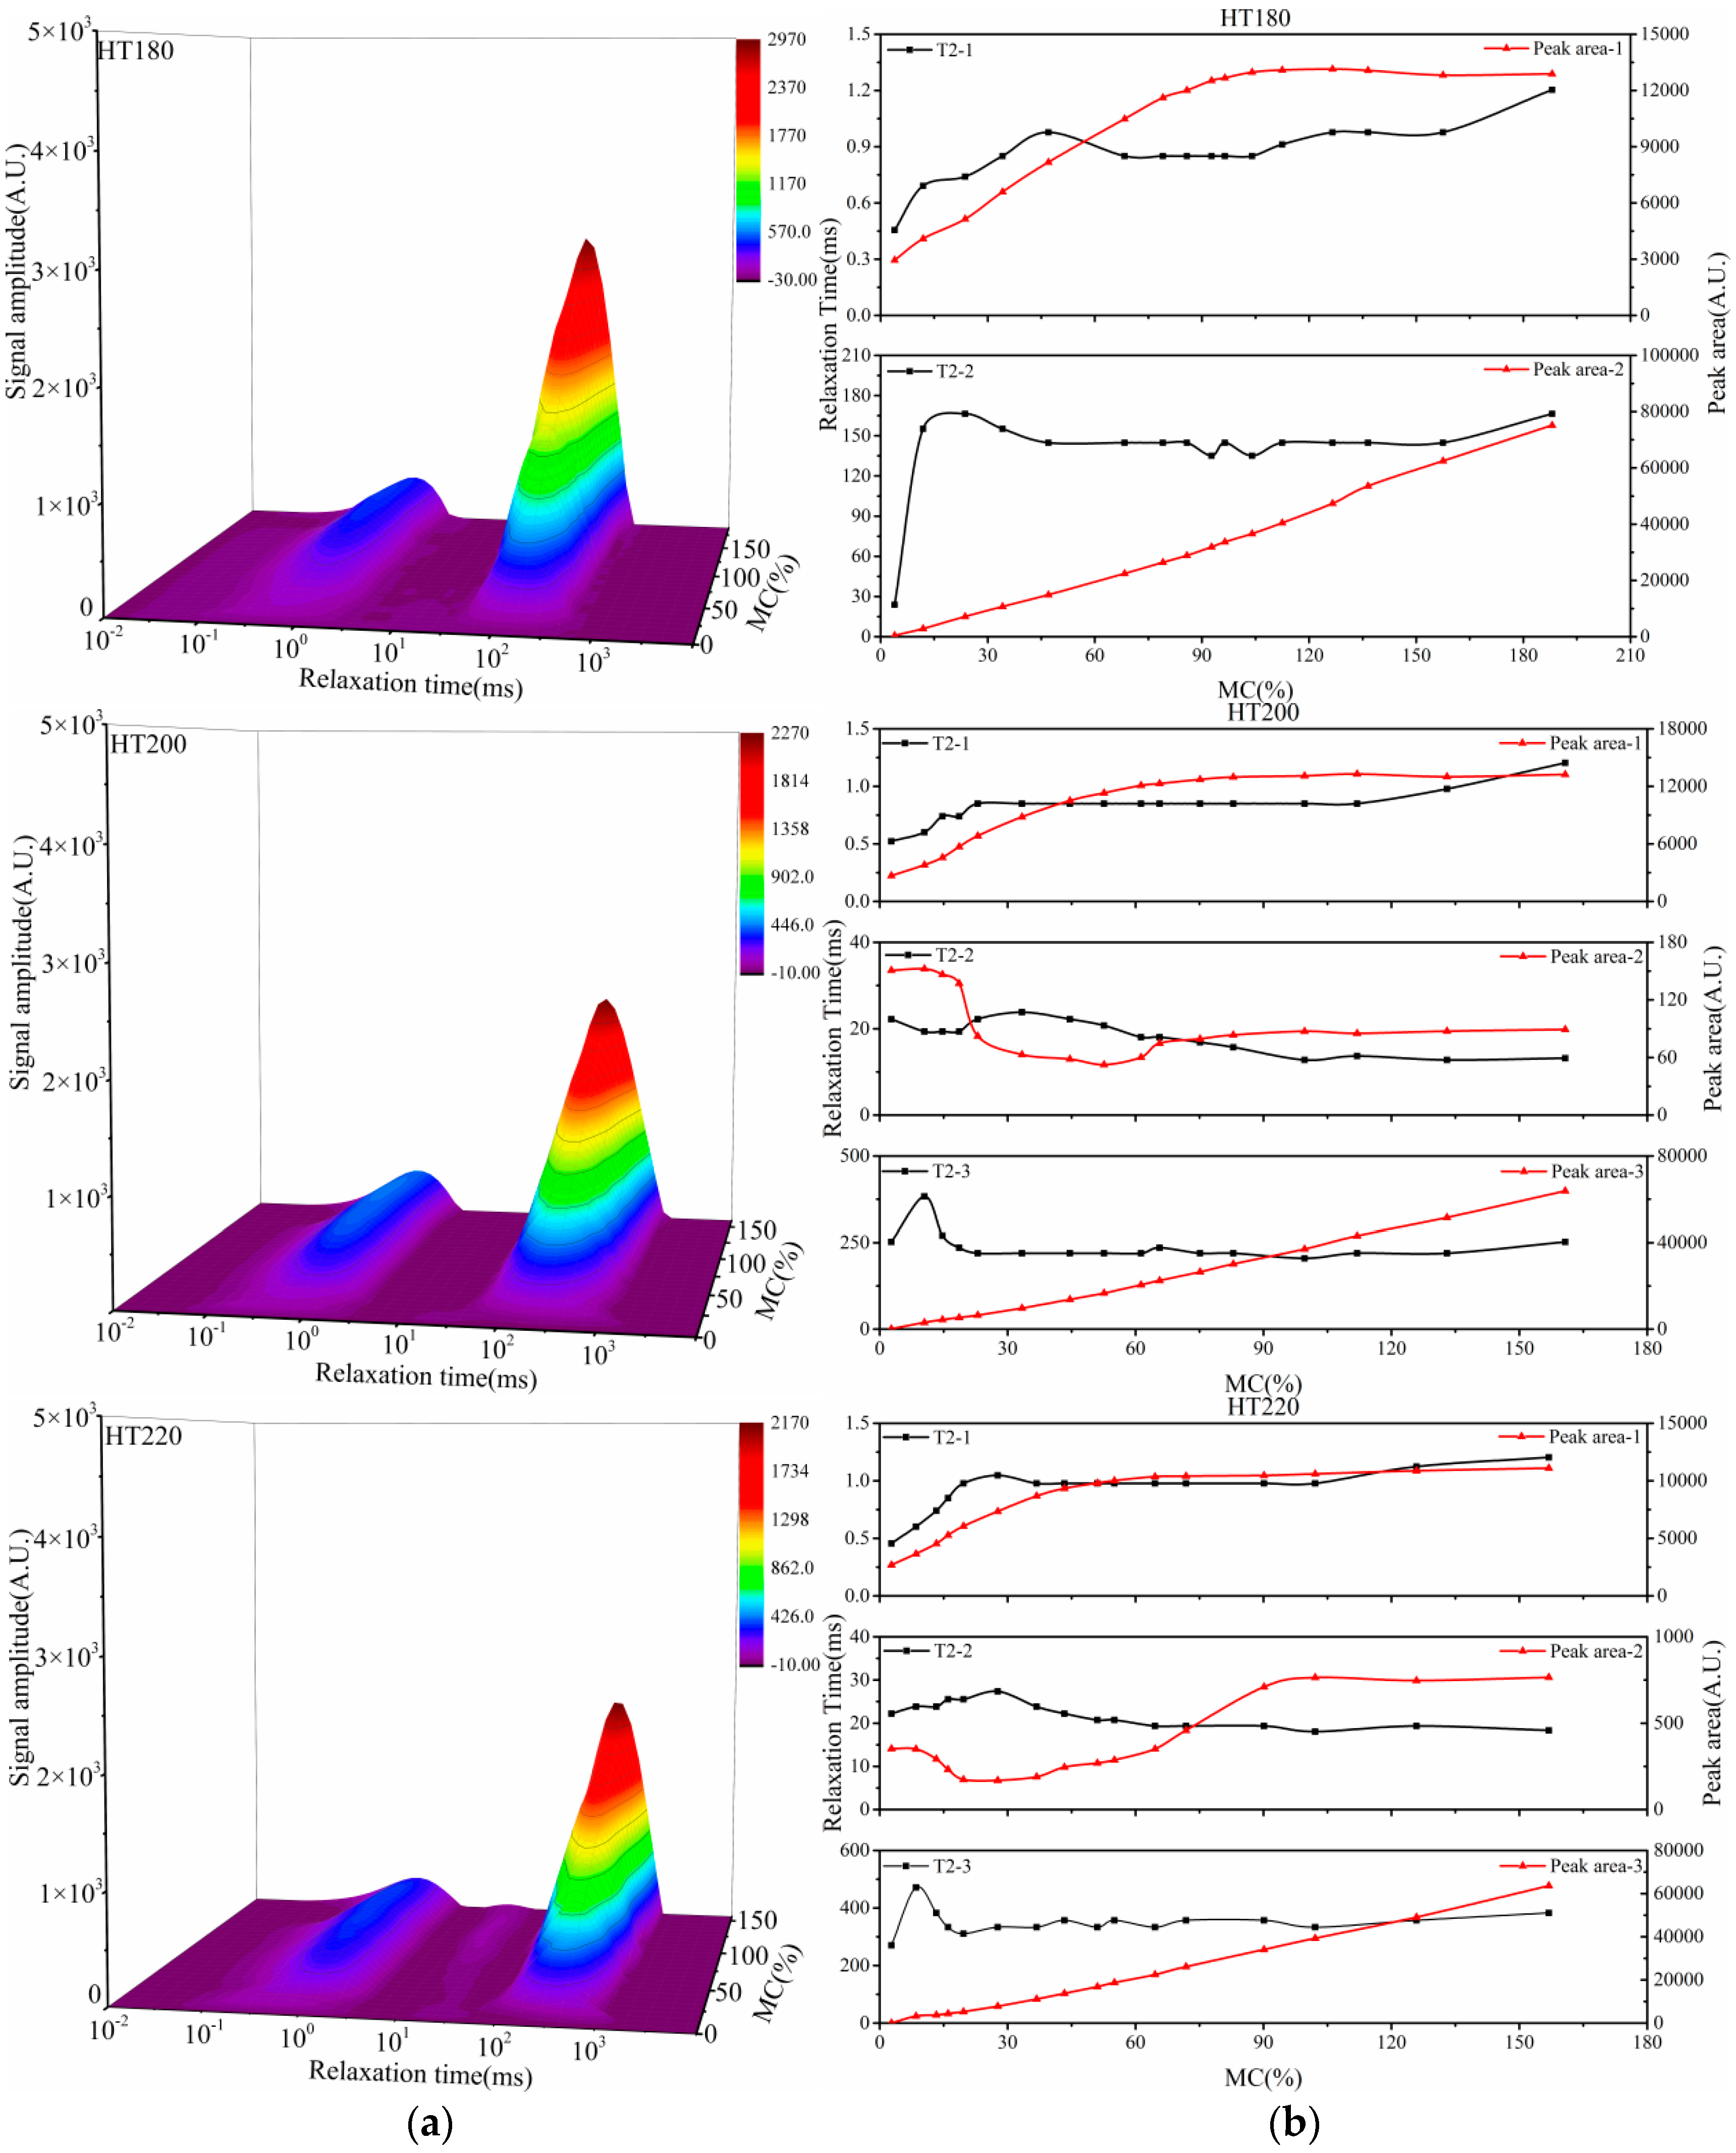
Water states in softwood were distinguished with relaxation analysis by several researchers [22,23,24,25,37]. According to the research results, the T2 was within 10 ms of bound water and greater than 10 ms of free water. Whereas T2 of the wood proton was about 10–15 μs shorter than the dead time of the spectrometer in this study, thus the spectrometer could not detect the signal of the wood proton. Figure 3 illustrates the states and the relaxation behavior of water in wood during the process of water uptake. In Figure 3a, there are two peaks which correspond to two components in water states in the 160 °C and 180 °C heat-treated samples and the untreated control samples. The component with shorter relaxation time showed that the water became more restricted in motion, which belonged to bound water in the wood cell walls, and the other one with longer relaxation time belonged to free water in the rays and tracheid lumens. Besides these two components, a new component with a T2 value about 20 ms was found in the 200 °C and 220 °C heat-treated samples. According to the references [25,37], this component belonged to free water, which was more restricted in motion than the water in cell lumens. By considering that the high-temperature heat treatment might change the pore structure of timber [38,39,40] and that the relaxation behavior of water was significantly affected by wood pore size [41], this component probably located in very small pores or cracks caused by the degradation of wood components due to the heat treatment.
In addition to the environment where the moisture located, the hydrogen bond strength and water amount also affect the relaxation time of moisture in wood, and hence the change of T2 could indicate the change of the MC and the bonding form between wood and moisture. Figure 3b shows the variation of T2 value and the integral peak area of different water states during water uptake process. Of all the test samples, the T2 value of bound water was small at the beginning of water sorption. In this stage, monomolecular layer adsorption was mainly carried out, and with the process of water absorption, which gradually transferred to multi-molecule layer adsorption manifest as the increase of T2 value. However, the variation tendency of the T2 value of free water was different. At lower MC, the T2 value for all the samples was greater and gradually decreased with the elongation of the immersion time, and then tended to be constant. Moreover, it should be noted that for all the heat-treated samples, the first T2 values were small due to the very small amount of water. As mentioned previously, the variation tendency of free water was supposed to be related to the water amount and the interaction between wood and water. In the initial stage, water penetrated into the wood by capillary force, which might not be hydrogen bonding with the inner surface of the cell lumen, and the weaker binding force led to larger T2 value. Then the T2 gradually decreased with the immersion time because part of the moisture was absorbed on the inner surface of cell lumens and the motion of water was restricted. The T2 value was an average of water which had similar characteristics, and thus the decrease of T2 value could be interpreted. Figure 3b also shows that, for all treated and untreated samples, the integral peak area of bound water changed rapidly at first, gradually slowed down with the change of MC, and then remained constant after reaching about 100% MC for the untreated sample, as well as the 160 °C and 180 °C heat-treated samples; while after reaching about 60% MC for 200 °C and 220 °C heat-treated samples. For the case of free water, the integral peak areas basically increased linearly with the change of MC for all the tested samples. It was also needed to point out that the peak area of the new water components appeared in the 200 °C and 220 °C heat-treated samples were very small. But the area of the latter was significantly larger than the former, because the higher treatment temperature led to more degradation of the wood cell wall components.
Figure 4 shows the comparison of T2 distribution curve of the heat-treated samples and the untreated control one after different immersion times. It was evident that, after immersion for 2 h, there was a greater amount of moisture in the untreated sample, especially for bound water. Whether bound water or free water, the absorption amount in untreated samples was larger than the heat-treated ones, and the water absorption decreased correspondingly due to the increasing heat-treated temperature. Moreover, the T2 of free water for heat-treated samples was longer than the untreated sample, and the T2 increased with the increasing heat treatment temperature. In the previous studies, it was shown that heat treatment could increase the contact angle between wood and water, and decrease the wood wettability, especially in the axial direction [42]. Therefore, the absorption rate of heat-treated samples might be influenced by this reason, and the T2 of free water might be influenced by the wettability of the internal surface of the cell lumens as well.
3.3. Content of Free Water and Bound Water
Previous studies showed that the high-temperature heat treatment might lead to the degradation of wood components, reducing the relative content of polysaccharides and the number of hygroscopic groups, such as hydroxyl groups, carbonyl groups, and so on. [43,44]. Thus, the water absorption of wood was reduced and its dimensional stability was increased [45].
The content of bound water and free water in untreated samples and heat-treated wood samples were measured as a function of immersion time, as illustrated in Figure 5. The content of bound water existing in untreated samples reached about 30% after the longest immersion time, and the MC values were slightly reduced for the 160 °C and 180 °C heat-treated samples, but no obvious difference was found between them. However, the heat treatment at 200 °C noticeably decreased the bound water content, reaching about 25.65% MC. The influence was more significant for the sample treated at 220 °C, reaching 22.17% MC. The decrease of the bound water content of the heat-treated samples might be caused by the degradation of cell wall components. The reduction in the hydroxyl groups resulted from the depolymerization and hydrolyzation of hemicellulose and the structural change of lignin due to the crosslinking at higher treated temperatures, because both could affect the amount of bound water [6,46,47]. Moreover, the heat treatment partially blocked the access of water to wood cell walls, which was most likely an important reason for the decrease of bound water content [48]. Unlike the bound water, the mass of free water for all the tested samples had not reached equilibrium after immersion for 60 days. In contrast to the untreated sample, the heat treatment decreased the content of free water for all the samples under current experimental conditions. The value decreased as the treatment temperature increased. Similar to the bound water, the heat treatments at 160 °C and 180 °C slightly reduced the free water content, while after 200 °C and 220 °C heat treatments, the MC values were only about 78.80% and 75.58% of the untreated sample at the 60th day, respectively. In addition to the effects of changes in chemical composition, a large number of pits were closed when heat treatment was at temperatures above 200 °C [49]. Thus, the absorption routes of free water were blocked and the transport of free water was impeded.
3.4. MC Profiles and NMR Imaging of Absorption of Free Water
The change of MC and MC profiles of untreated and heat-treated Chinese fir samples during water uptake are presented in Figure 6. Figure 6a shows the MC change of the samples, along with the immersion time. MC profiles of the samples during water uptake are shown in Figure 6b–f. The two cross sections were located at position x = 0 and x = 50 mm respectively, and the magnetic field gradient was along the longitudinal direction of the sample. After immersion for 2 h, the MC of the untreated sample was about 52.12%, which was almost double the values of 160 °C and 180 °C heat-treated samples and triple that of 200 °C and 220 °C heat-treated samples. The depth of water reached and the signal amplitude of the same depth in the heat-treated samples was less than the untreated sample, indicating that the heat treatment made it difficult for moisture to enter the wood samples. For the untreated sample, the distance away from the ends that could detect the moisture signals was longer than 15 mm, while it was about 6 mm for samples treated at 160 °C and 180 °C, and about 3 mm for samples treated at 200 °C and 220 °C. As reported by Gezici-Koç [41], during the early phase of water absorption, a front was developed both in the untreated and heat-treated samples, indicating that the transport was internally limited. After 9 days, the water signal in the center of the untreated sample was obviously increased. By comparing the signal values, it can be concluded that it was difficult for water to penetrate into the center of the sample treated at 160 °C and 180 °C, and it took about 15 days for the water signal to be increased significantly. Moreover, it was more difficult for samples treated at 200 °C and 220 °C, because there was only a very small increase in the water signal in the center of the samples, even after 30 days. After 60 days, the water signal of the untreated sample was about 3.6 times the value of the sample heat-treated at 220 °C. According to the previous studies, after heat treatment, a decrease was observed in the wetting tension while the contact angles were increased, both indicating a more hydrophobic behavior compared to the untreated wood [42,50]. Also, the variation of the contact angle was most pronounced in the axial direction [42]. In addition, the pits which connecting the wood cells were closed after treated at high temperature and would block the absorption routes of free water appeared to be another significant reason [49]. Therefore, the differences of water absorption properties in the longitudinal direction between untreated and heat-treated samples could be interpreted.
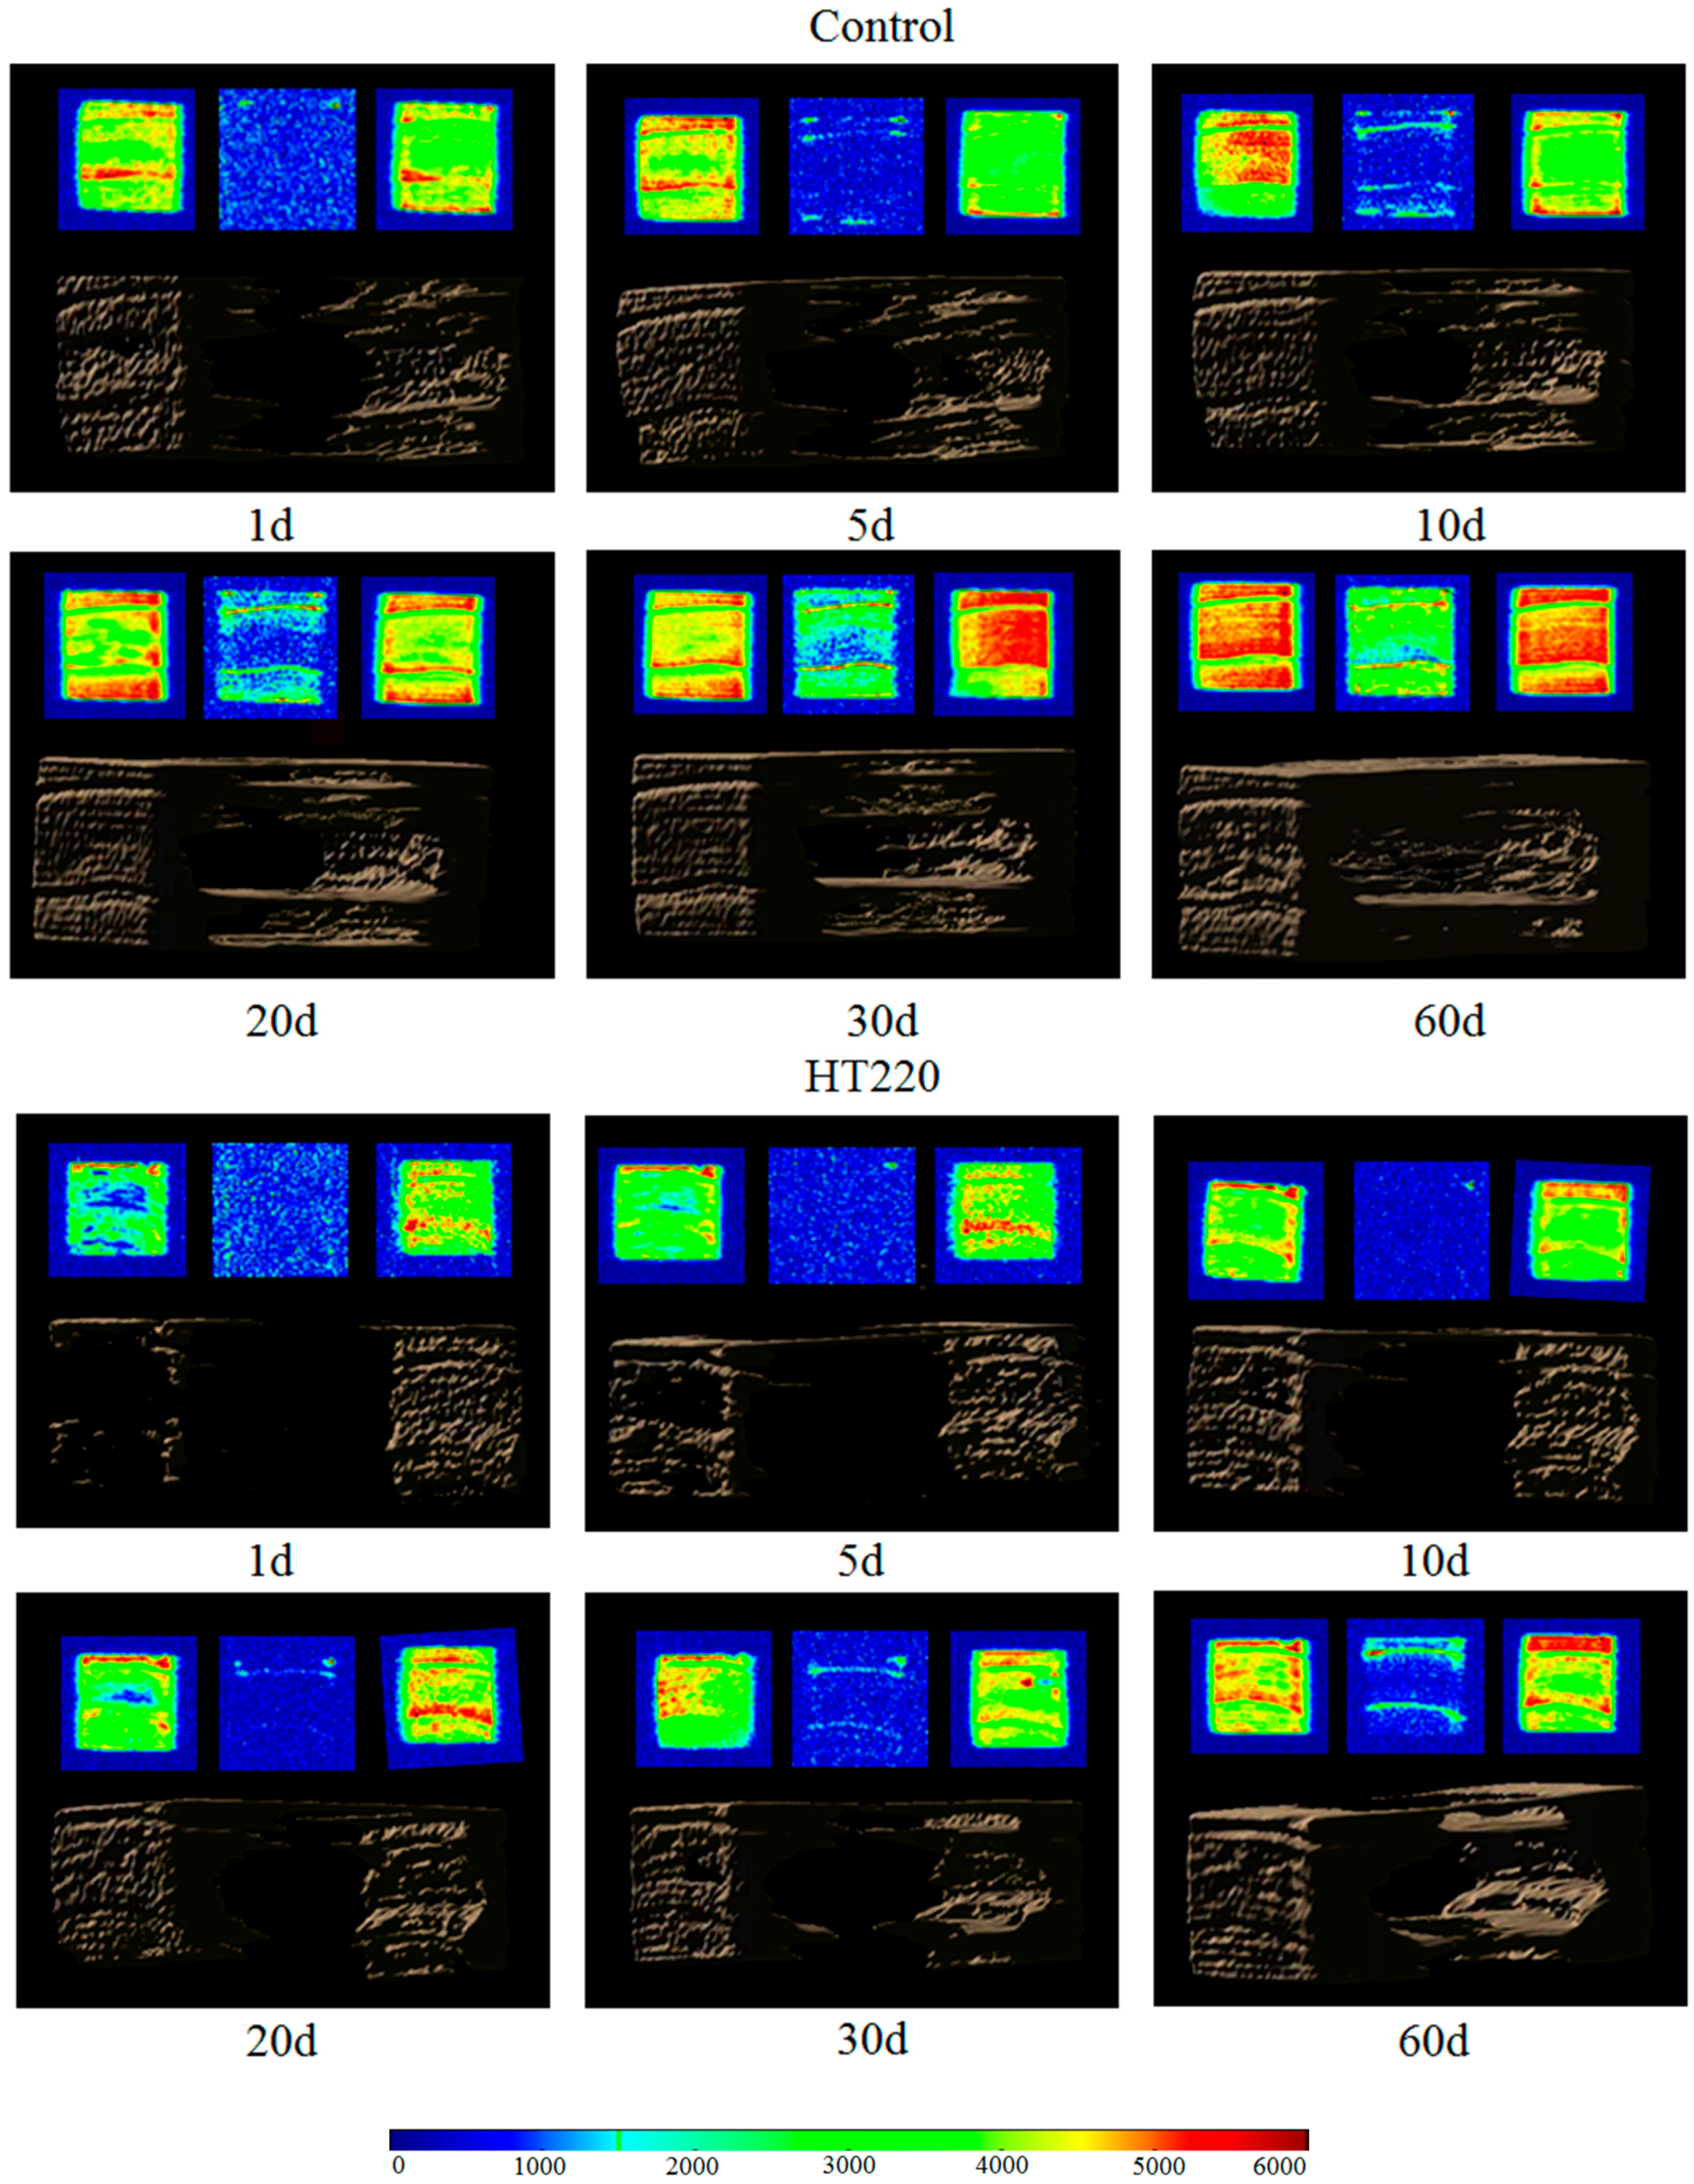
The NMR images and three-dimensional reconstruction of the samples heat-treated at 220 °C, as well as the untreated samples, are presented in Figure 7. Slices from the two ends and the middle of the samples were selected. The three-dimensional reconstruction was based on the NMR images, thus what can be seen in the figure is the water signal instead of the real wood. It should be noted that the echo time employed in the NMR imaging experiments was 9.5 ms longer than the relaxation time of bound water, and as a result, only the signals of free water were reflected in the images. The differences of water absorption properties between untreated and 220 °C heat-treated samples could be directly reflected according to the images. After 1 day of immersion, water had absorbed into the ends of both the samples, and no signal was detected in the middle of the sample. After 5 days of immersion, a few signals emerged in the middle of the untreated sample and they were stronger after 10 days of immersion. While after 20 days the water signals were still very small in the middle of the 220 °C heat-treated sample. After 60 days of immersion, both the untreated and heat-treated samples were not yet fully saturated, but it was observed in the figures that water absorption in latewood was faster than that in earlywood, whether untreated sample or 220 °C heat-treated sample [31,51]. One possible explanation is that the internal diameter of the cell lumen is larger in earlywood than in latewood, and the smaller radius creates a stronger capillary force, which results in faster water absorption in latewood. However, the earlywood absorbed more water than latewood, which could be observed in the images which were taken from the ends of the samples after longer immersion time.
4. Conclusions
In this work, various NMR methods were applied to investigate the water absorption process of untreated and heat-treated Chinese fir wood. The integral peak area and the gravimetrically determined MC had a significant linear correlation relationship, which indicate that it was a feasible method to use the T2 relaxation curve to characterize the dynamic changes of moisture in wood samples during the water absorption process. Two water components, corresponding to bound water and free water, were reflected by the T2 relaxation curve for the samples heat-treated at 160 °C and 180 °C, as well as the untreated sample. However, a small amount of new water components with T2 values of about 20 ms appeared in the 200 °C and 220 °C heat-treated samples. They are most likely to be water existing in very small pores or cracks that were generated on the cell walls due to degradation of wood components after heat treatment at high temperatures. In addition, the T2 values of water in heat-treated wood samples were greater than that of the untreated one, which to some extent indicates that heat treatment might decrease the wood wettability and result in the reduction of the water absorption rate. The results calculated by the area integration method showed that the contents of bound water and free water in heat-treated samples were less compared to the untreated sample, and the water absorption decreased correspondingly due to the increasing heat-treated temperature. The reason was that heat treatment might partially block the access of water to wood cell walls, and in consequence improve the dimensional stability of heat-treated wood. 1D NMR imaging showed that the moisture transport was more internally limited and difficult to penetrate into the center of heat-treated wood samples. The main reason might be that the pits, which play a crucial role in connecting the wood cell walls, were closed after heat treatment. Moreover, 2D NMR images of the untreated and 220 °C heat-treated samples revealed that the free water absorption in latewood was faster than in earlywood. This was likely to be the result of the internal diameter of the cell lumen is smaller in latewood and could a stronger capillary force than in earlywood.
Author Contributions
J.L. and Y.G. planned and designed the research. Y.G. performed the experiments and wrote the paper. All authors read and approved the manuscript.
Funding
This research was sponsored by the National Key Research and Development Program of China (2017YFD0600202).
Acknowledgments
The authors would like to thank the engineer Yu Peng at Niumag Cor. Ltd. in Suzhou for the technical support.
Conflicts of Interest
The authors declare no conflict of interest.
References
- Bal, B.C. Wood-water relationships and biological durability of heat-treated Taurus Fir wood. Pro Ligno 2015, 11, 3–10. [Google Scholar]
- Sun, Q.F.; Yu, H.P.; Liu, Y.X.; Jian, L.; Yun, L.; Hunt, J.F. Improvement of water resistance and dimensional stability of wood through titanium dioxide coating. Holzforschung 2010, 64, 757–761. [Google Scholar] [CrossRef]
- Zhan, T.; Jiang, J.; Lu, J.; Zhang, Y.; Chang, J. Influence of hygrothermal condition on dynamic viscoelasticity of Chinese fir (Cunninghamia lanceolata). Part 1: Moisture adsorption. Holzforschung 2018. [Google Scholar] [CrossRef]
- Zhan, T.; Jiang, J.; Lu, J.; Zhang, Y.; Chang, J. Influence of hygrothermal condition on dynamic viscoelasticity of Chinese fir (Cunninghamia lanceolata). Part 2: Moisture desorption. Holzforschung 2018. [Google Scholar] [CrossRef]
- Källbom, S.; Rautkari, L.; Wålinder, M.; Johansson, L.S.; Campbell, J.M.; Segerholm, K.; Jones, D.; Laine, K. Water vapour sorption characteristics and surface chemical composition of thermally modified spruce (Picea abies karst). Int. Wood Prod. J. 2016, 7, 116–123. [Google Scholar] [CrossRef]
- Tjeerdsma, B.F.; Militz, H. Chemical changes in hydrothermal treated wood: FTIR analysis of combined hydrothermal and dry heat-treated wood. Holz Als Roh-Und Werkst. 2005, 63, 102–111. [Google Scholar] [CrossRef]
- Altgen, M.; Hofmann, T.; Militz, H. Wood moisture content during the thermal modification process affects the improvement in hygroscopicity of Scots pine sapwood. Wood Sci. Technol. 2016, 50, 1–15. [Google Scholar] [CrossRef]
- Nuopponen, M.; Vuorinen, T.; Jämsä, S.; Viitaniemi, P. Thermal Modifications in Softwood Studied by FT-IR and UV Resonance Raman Spectroscopies. J. Wood Chem. Technol. 2005, 24, 13–26. [Google Scholar] [CrossRef]
- Tjeerdsma, B.F.; Boonstra, M.; Pizzi, A.; Tekely, P.; Militz, H. Characterisation of thermally modified wood: Molecular reasons for wood performance improvement. Holz Als Roh-Und Werkst. 1998, 56, 149–153. [Google Scholar] [CrossRef]
- Windeisen, E.; Strobel, C.; Wegener, G. Chemical changes during the production of thermo-treated beech wood. Wood Sci. Technol. 2007, 41, 523–536. [Google Scholar] [CrossRef]
- Akgül, M.; Gümüşkaya, E.; Korkut, S. Crystalline structure of heat-treated Scots pine [Pinus sylvestris L.] and Uludağ fir [Abies nordmanniana (Stev.) subsp. bornmuelleriana (Mattf.)] wood. Wood Sci. Technol. 2007, 41, 281. [Google Scholar] [CrossRef]
- Zhang, M.; Wang, X.; Gazo, R. Water states in yellow poplar during drying studied by time-domain nuclear magnetic resonance. Wood Fiber Sci. 2013, 45, 423–428. [Google Scholar]
- Nanassy, A.J. True dry mass and moisture content of wood by NMR. Wood Sci. 1976, 9, 104–109. [Google Scholar]
- Sharp, A.R.; Riggin, M.T.; Kaiser, R.; Schneider, M.H. Determination of moisture content of wood by pulsed nuclear magnetic resonance. Wood Fiber Sci. 1978, 10, 74–81. [Google Scholar]
- Hartley, I.D.; Kamke, F.A.; Peemoeller, H. Absolute Moisture Content Determination of Aspen Wood Below the Fiber Saturation Point using Pulsed NMR. Holzforschung 1994, 48, 474–479. [Google Scholar] [CrossRef]
- Merela, M.; Oven, P.; Serša, I.; Mikac, U. A single point NMR method for an instantaneous determination of the moisture content of wood. Holzforschung 2009, 63, 348–351. [Google Scholar] [CrossRef]
- Hartley, I.D.; Avramidis, S.; Mackay, A.L. H-NMR studies of water interactions in sitka spruce and western hemlock: Moisture content determination and second moments. Wood Sci. Technol. 1996, 30, 141–148. [Google Scholar] [CrossRef]
- Dvinskikh, S.V.; Furó, I. Moisture content profiles and uptake kinetics in wood cladding materials evaluated by a portable nuclear magnetic resonance spectrometer. Wood Mater. Sci. Eng. 2011, 6, 119–127. [Google Scholar] [CrossRef]
- Labbé, N.; Jéso, B.D.; Lartigue, J.-C.; Daudé, G.; Pétraud, M.; Ratier, M. Time-domain 1H NMR characterization of the liquid phase in greenwood. Holzforschung 2006, 60, 265–270. [Google Scholar] [CrossRef]
- Xu, K.; Lv, J.; Gao, Y.; Wu, Y.; Li, X. Determination of Moisture Content and Moisture Content Profiles in Wood during Drying by Low Field Nuclear Magnetic Resonance. Dry. Technol. 2017, 35, 1909–1918. [Google Scholar] [CrossRef]
- Almeida, G. A NMR study of water distribution in hardwoods at several equilibrium moisture contents. Wood Sci. Technol. 2007, 41, 293–307. [Google Scholar] [CrossRef]
- Menon, R.S.; Mackay, A.L.; Hailey, J.R.T.; Bloom, M.; Burgess, A.E.; Swanson, J.S. An NMR determination of the physiological water distribution in wood during drying. J. Appl. Polym. Sci. 1987, 33, 1141–1155. [Google Scholar] [CrossRef]
- Riggin, M.T.; Sharp, A.R.; Kaiser, R.; Schneider, M.H. Transverse NMR relaxation of water in wood. J. Appl. Polym. Sci. 1979, 23, 3147–3154. [Google Scholar] [CrossRef]
- Araujo, C.D.; Mackay, A.L.; Hailey, J.R.T.; Whittall, K.P.; Le, H. Proton magnetic resonance techniques for characterization of water in wood: Application to white spruce. Wood Sci. Technol. 1992, 26, 101–113. [Google Scholar] [CrossRef]
- Labbé, N.; Jéso, B.D.; Lartigue, J.-C.; Daudé, G.; Pétraud, M.; Ratier, M.; Labbé, N.; Jéso, B.D.; Lartigue, J.C.; Daudé, G. Moisture Content and Extractive Materials in Maritime Pine Wood by Low Field 1H NMR. Holzforschung 2002, 56, 25–31. [Google Scholar] [CrossRef]
- Thygesen, L.G.; Elder, T. Moisture in untreated, acetylated, and furfurylated Norway spruce studied during drying using time domain NMR. Wood Fiber Sci. 2008, 40, 309–320. [Google Scholar]
- Telkki, V.V.; Yliniemi, M.; Jokisaari, J. Moisture in softwoods: Fiber saturation point, hydroxyl site content, and the amount of micropores as determined from NMR relaxation time distributions. Holzforschung 2013, 67, 291–300. [Google Scholar] [CrossRef]
- Kekkonen, P.M.; Ylisassi, A.; Telkki, V.V. Absorption of Water in Thermally Modified Pine Wood As Studied by Nuclear Magnetic Resonance. J. Phys. Chem. C 2014, 118, 2146–2153. [Google Scholar] [CrossRef]
- Dvinskikh, S.V.; Henriksson, M.; Berglund, L.A.; Furo, I. A multinuclear magnetic resonance imaging (MRI) study of wood with adsorbed water: Estimating bound water concentration and local wood density. Holzforschung 2011, 65, 103–107. [Google Scholar] [CrossRef]
- Mazela, B.; Kowalczuk, J.; Ratajczak, I.; Szentner, K. Moisture content (MC) and multinuclear magnetic resonance imaging (MRI) study of water absorption effect on wood treated with aminofunctional silane. Eur. J. Wood Wood Prod. 2014, 72, 243–248. [Google Scholar] [CrossRef]
- Javed, M.A.; Kekkonen, P.M.; Ahola, S. Magnetic resonance imaging study of water absorption in thermally modified pine wood. Holzforschung 2014, 69, 899–907. [Google Scholar] [CrossRef]
- Kymäläinen, M.; Havimo, M.; Louhelainen, J. Sorption properties of torrefied wood and charcoal. Wood Mater. Sci. Eng. 2014, 9, 170–178. [Google Scholar] [CrossRef]
- Ahmed, S.A.; Morén, T. Moisture properties of heat-treated Scots pine and Norway spruce sapwood impregnated with wood preservatives. Ann. Des Sci. For. 2012, 46, 85–93. [Google Scholar]
- Kaygin, B.; Gunduz, G.; Aydemir, D. Some Physical Properties of Heat-Treated Paulownia (Paulownia elongata) Wood. Dry. Technol. 2009, 27, 89–93. [Google Scholar] [CrossRef]
- Unsal, O.; Kartal, S.N.; Candan, Z.; Arango, R.A.; Clausen, C.A.; Iii, F.G. Decay and termite resistance, water absorption and swelling of thermally compressed wood panels. Int. Biodeterior. Biodegrad. 2009, 63, 548–552. [Google Scholar] [CrossRef]
- Scheiding, W.; Direske, M.; Zauer, M. Water absorption of untreated and thermally modified sapwood and heartwood of Pinus sylvestris L. Eur. J. Wood Wood Prod. 2016, 74, 585–589. [Google Scholar] [CrossRef]
- Cox, J.; Mcdonald, P.J.; Gardiner, B.A. A study of water exchange in wood by means of 2D NMR relaxation correlation and exchange. Holzforschung 2010, 64, 259–266. [Google Scholar] [CrossRef]
- Borrega, M.; Karenlämpi, P.P. Cell wall porosity in Norway spruce wood as affected by high-temperature drying. Wood Fiber Sci. J. Soc. Wood Sci. Technol. 2011, 43, 206–214. [Google Scholar]
- Olek, W.; Bonarski, J.T. Effects of thermal modification on wood ultrastructure analyzed with crystallographic texture. Holzforschung 2014, 68, 721–726. [Google Scholar] [CrossRef]
- Junghans, K.; Niemz, P.; Bächle, F. Investigations into the influence of thermal treatment on the porosity of spruce. Eur. J. Wood Prod. 2005, 63, 243–344. [Google Scholar] [CrossRef]
- Gezici-Koç, Ö.; Erich, S.J.F.; Huinink, H.P.; van der Ven, L.G.; Adan, O.C.G. Bound and free water distribution in wood during water uptake and drying as measured by 1D magnetic resonance imaging. Cellulose 2017, 24, 535–553. [Google Scholar] [CrossRef]
- Kocaefe, D.; Poncsak, S.; Doré, G.; Younsi, R. Effect of heat treatment on the wettability of white ash and soft maple by water. Holz Als Roh Werkst. 2008, 66, 355–361. [Google Scholar] [CrossRef]
- Esteves, B.; Graça, J.; Pereira, H. Extractive composition and summative chemical analysis of thermally treated eucalypt wood. Holzforschung 2008, 62, 344–351. [Google Scholar] [CrossRef]
- Mitsui, K.; Inagaki, T.; Tsuchikawa, S. Monitoring of hydroxyl groups in wood during heat treatment using NIR spectroscopy. Biomacromolecules 2008, 9, 286–288. [Google Scholar] [CrossRef] [PubMed]
- Dubey, M.K.; Pang, S.; Walker, J. Changes in chemistry, color, dimensional stability and fungal resistance of Pinus radiata D. Don wood with oil heat-treatment. Holzforschung 2012, 66, 49–57. [Google Scholar] [CrossRef]
- Cademartori, P.H.G.; Santos, P.S.B.D.; Serrano, L.; Labidi, J.; Gatto, D.A. Effect of thermal treatment on physicochemical properties of Gympie messmate wood. Ind. Crop. Prod. 2013, 45, 360–366. [Google Scholar] [CrossRef]
- Sandak, A.; Sandak, J.; Allegretti, O. Quality control of vacuum thermally modified wood with near infrared spectroscopy. Vacuum 2015, 114, 44–48. [Google Scholar] [CrossRef]
- Hill, C.A.S. Wood Modification: Chemical, Thermal and other Processes; John Wiley & Sons: Hoboken, NJ, USA, 2006; pp. 99–127. [Google Scholar]
- Telkki, V.V.; Saunavaara, J.; Jokisaari, J. Time-of-flight remote detection MRI of thermally modified wood. J. Magn. Reson. 2010, 202, 78–84. [Google Scholar] [CrossRef]
- Hakkou, M.; Pétrissans, M.; Zoulalian, A.; Gérardin, P. Investigation of wood wettability changes during heat treatment on the basis of chemical analysis. Polym. Degrad. Stab. 2005, 89, 1–5. [Google Scholar] [CrossRef]
- Kekkonen, P.M.; Telkki, V.V.; Jokisaari, J. Determining the highly anisotropic cell structures of Pinus sylvestris in three orthogonal directions by PGSTE NMR of absorbed water and methane. J. Phys. Chem. B 2009, 113, 1080–1084. [Google Scholar] [CrossRef]
Figure 1.
Sample preparation method.
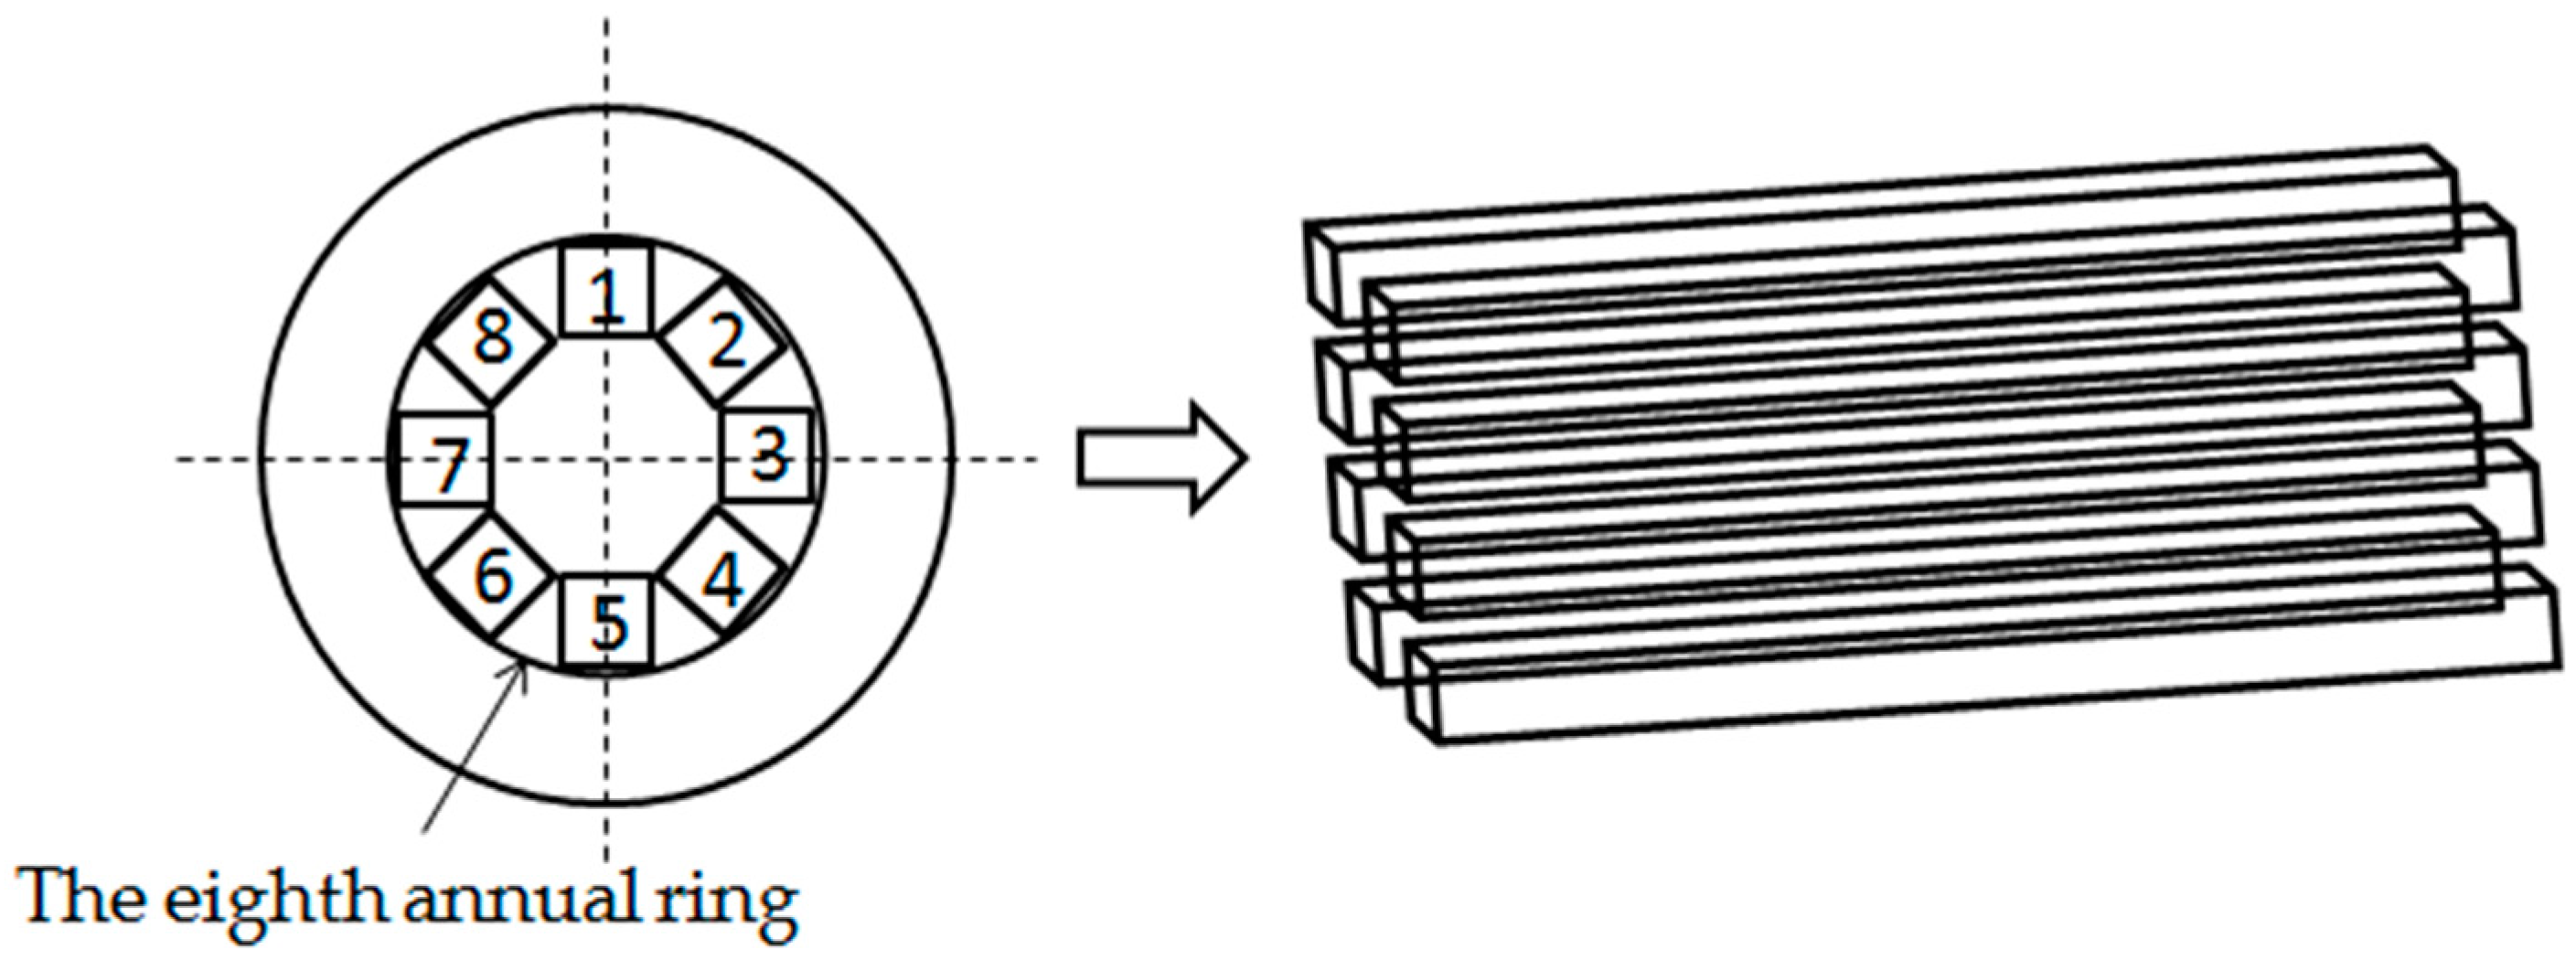
Figure 2.
Relationship between the moisture content (MC) obtained by the gravimetric method and the integral peak area of T2 relaxation curve according to the Carr-Purcell-Meiboom-Gill (CPMG) experiment (HTx refers to the heat-treated sample, where x is the treated temperature in Celsius degrees).
Figure 2.
Relationship between the moisture content (MC) obtained by the gravimetric method and the integral peak area of T2 relaxation curve according to the Carr-Purcell-Meiboom-Gill (CPMG) experiment (HTx refers to the heat-treated sample, where x is the treated temperature in Celsius degrees).
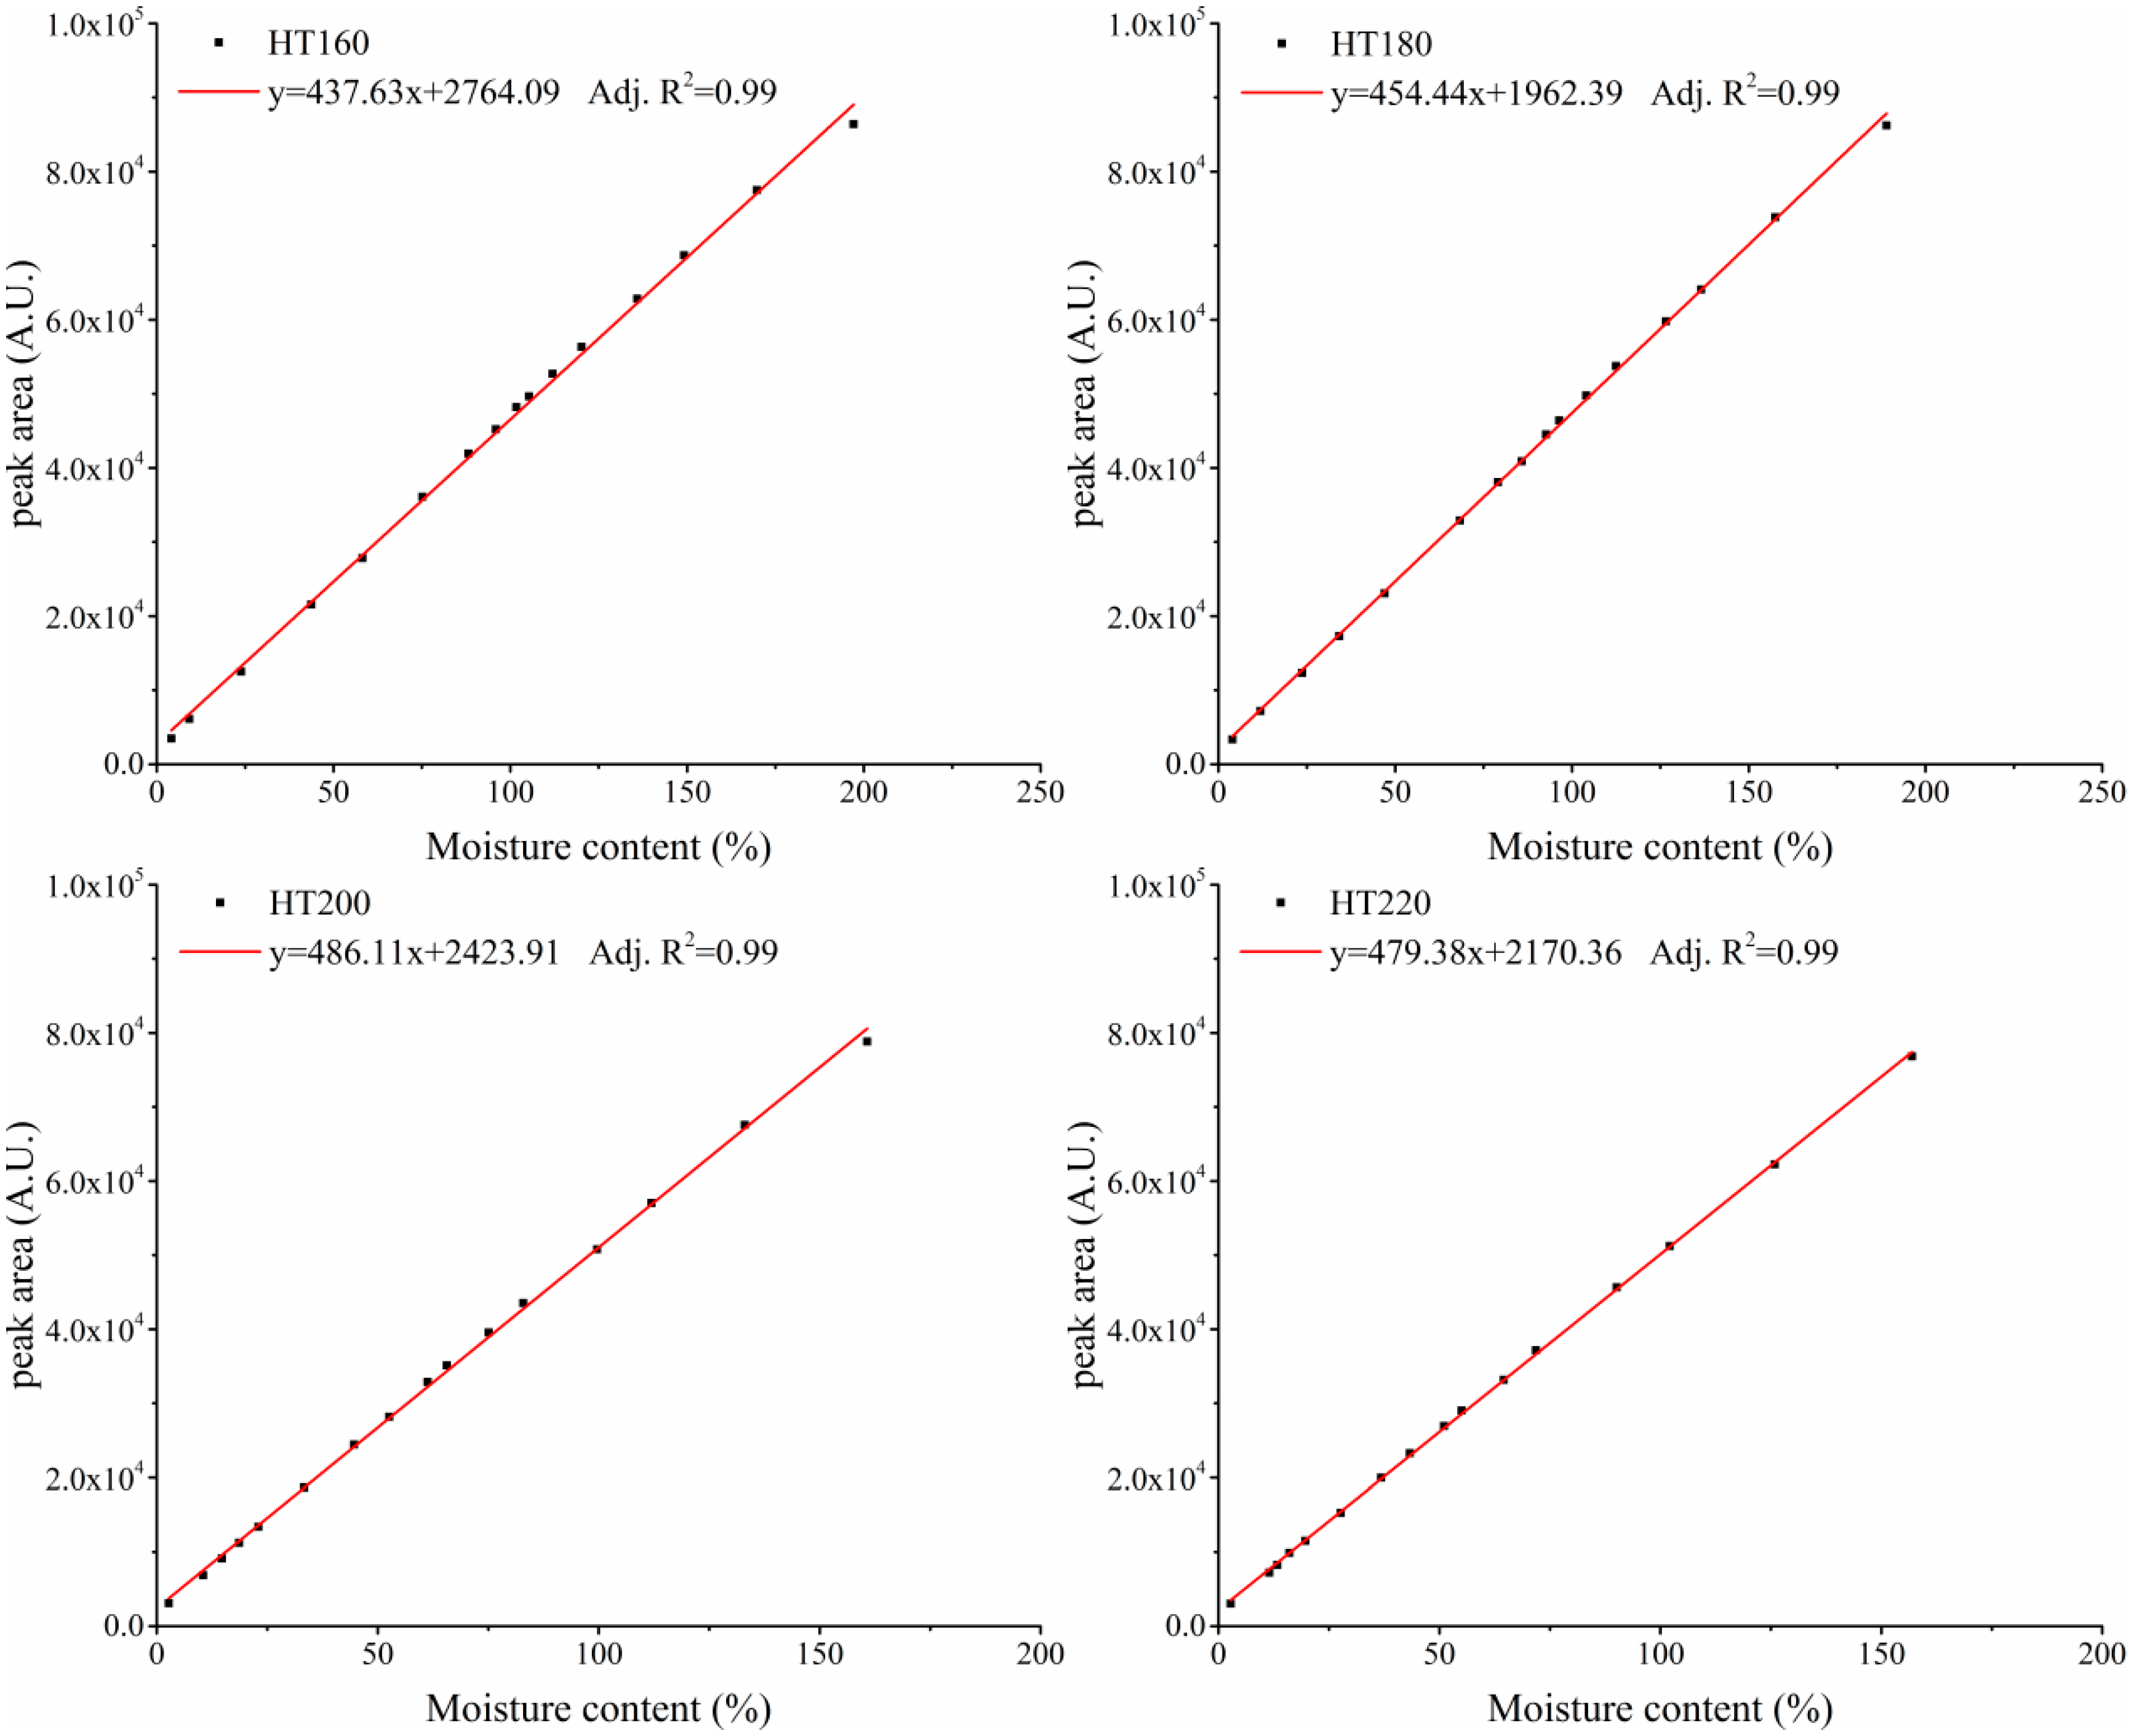
Figure 3.
Changes of the amount and relaxation behavior of water in the wood samples during the water absorption process. (a) 3D trajectory and corresponding contour plot of T2 distribution for the water absorption process (the color bar in the right of each figure reflects the water signal intensity). (b) The change of T2 values and integral peak areas of bound water and free water along with the MC.
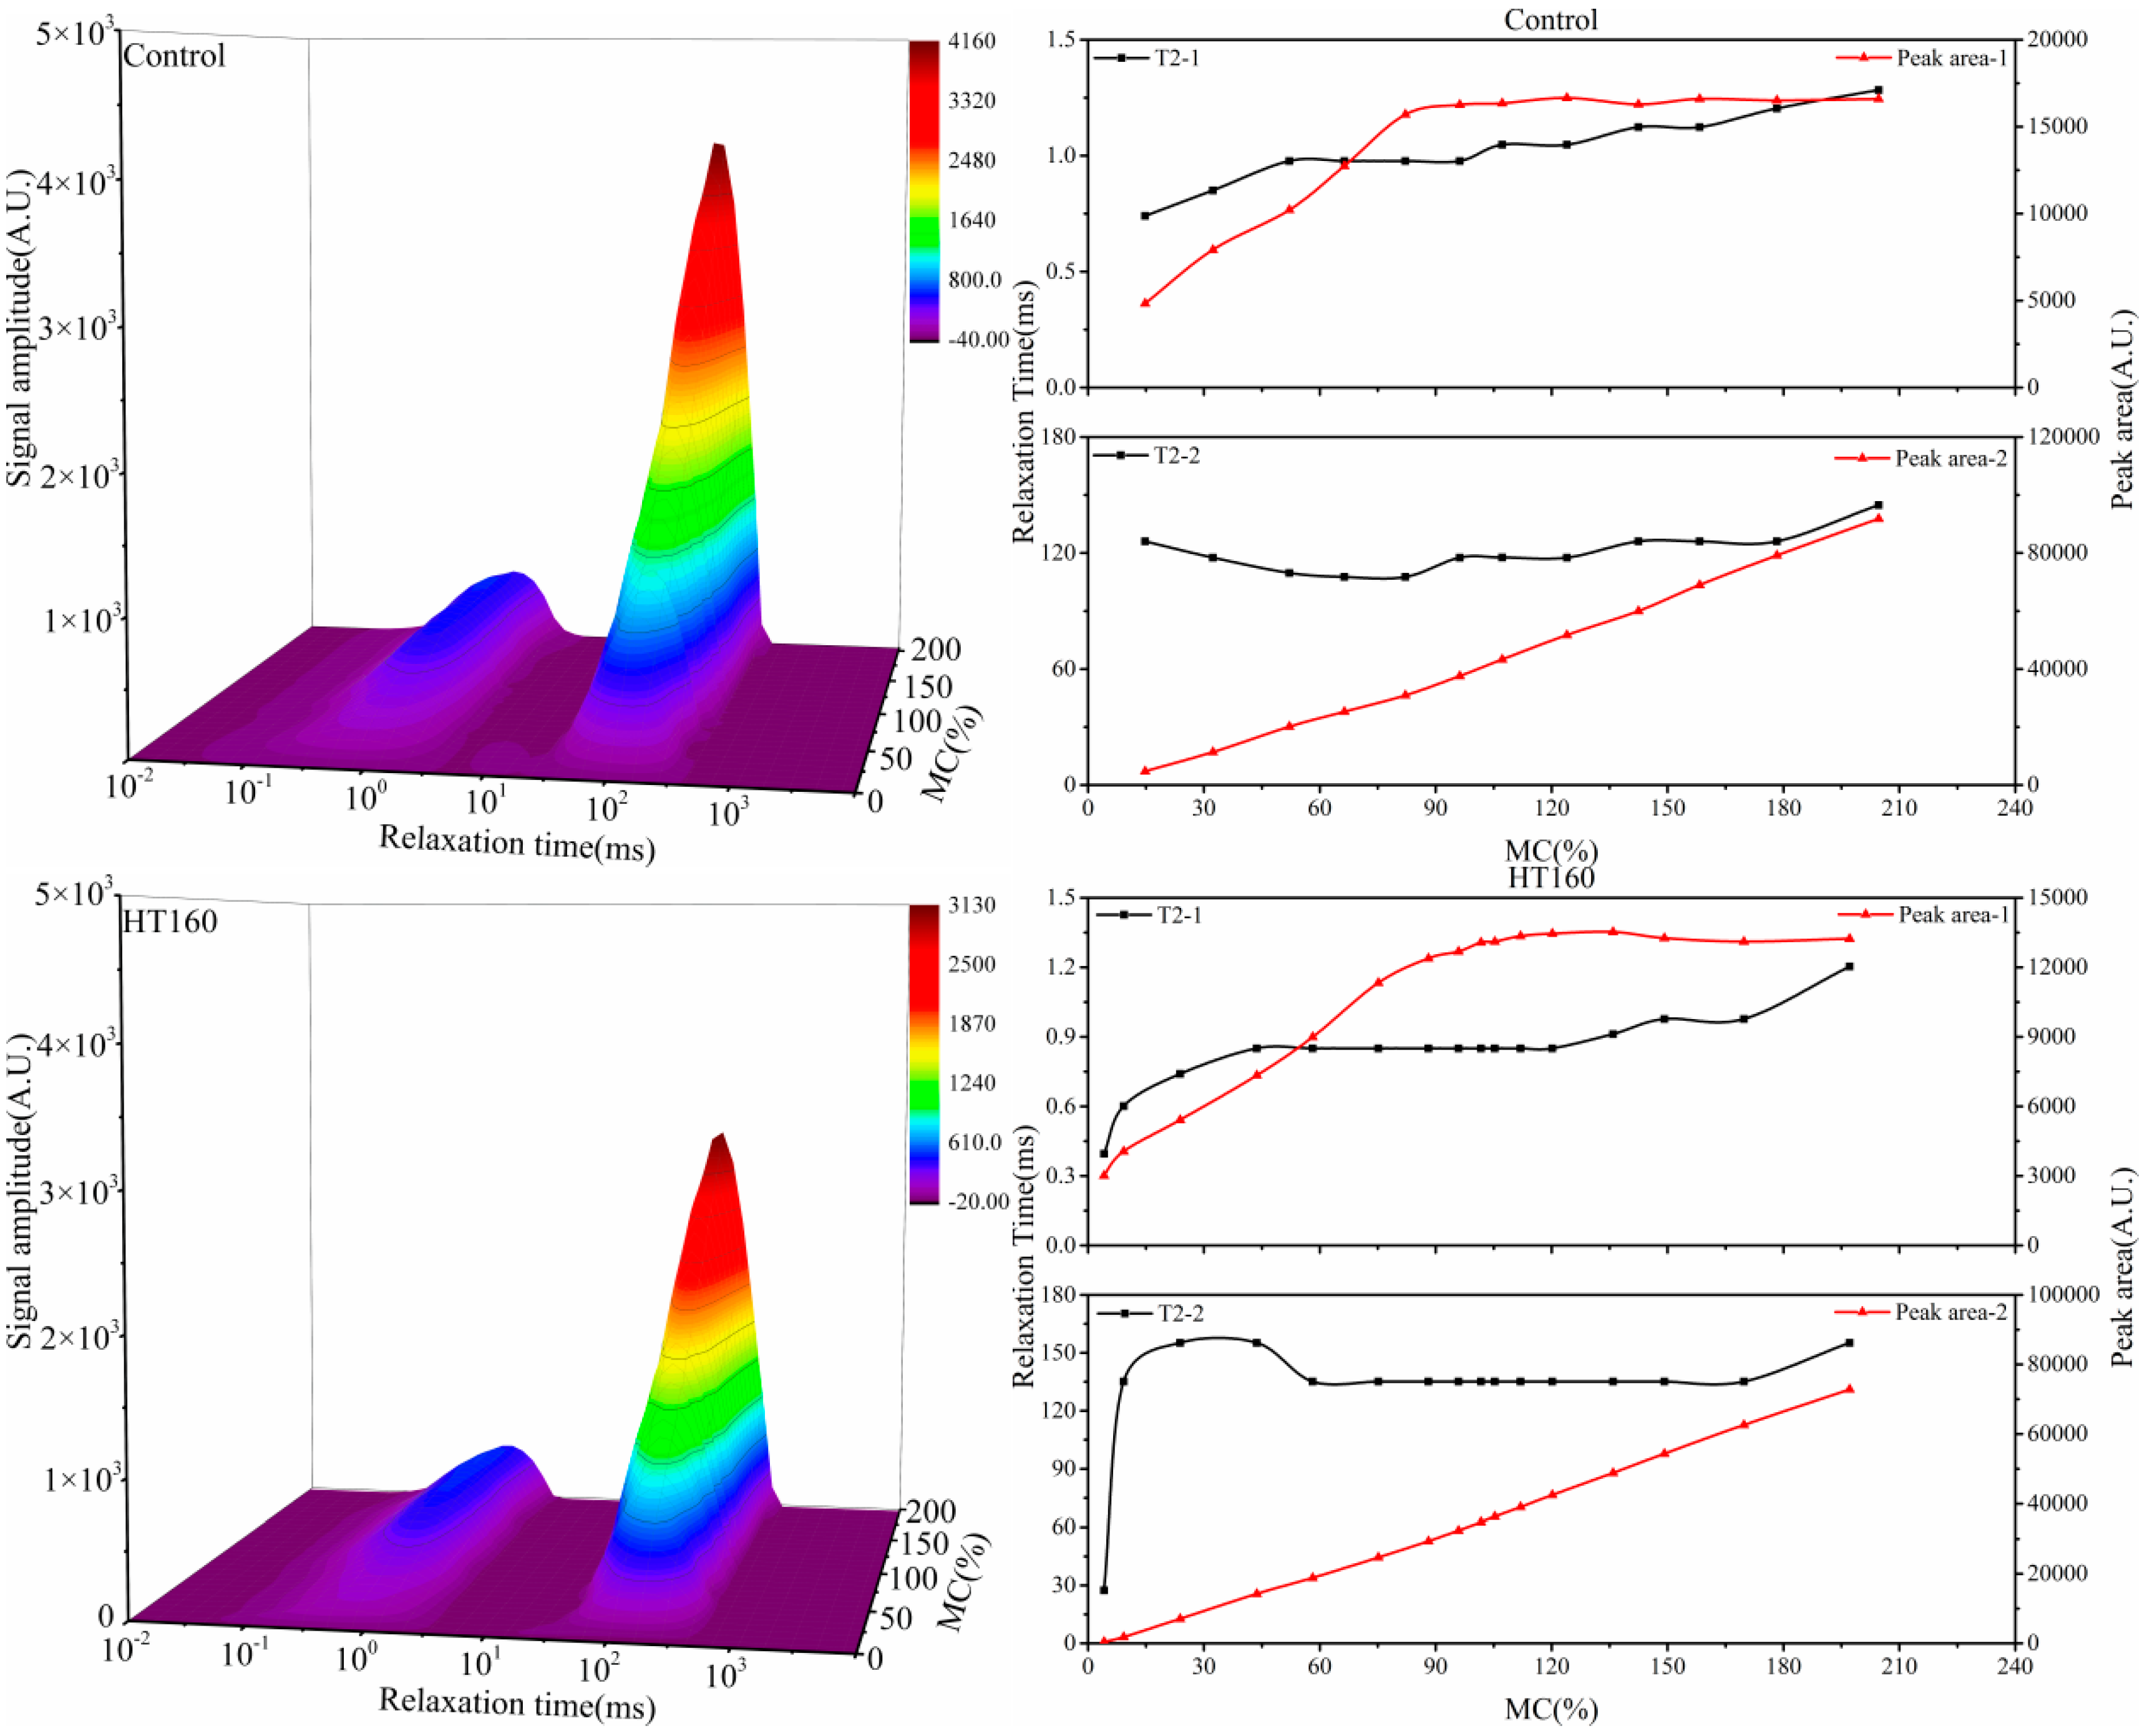

Figure 4.
Compare of T2 distribution curves of sample immersion for different times (immersion for 2 h, 1, 3, 5, 7, 9, 15, 30 and 60 days).
Figure 4.
Compare of T2 distribution curves of sample immersion for different times (immersion for 2 h, 1, 3, 5, 7, 9, 15, 30 and 60 days).
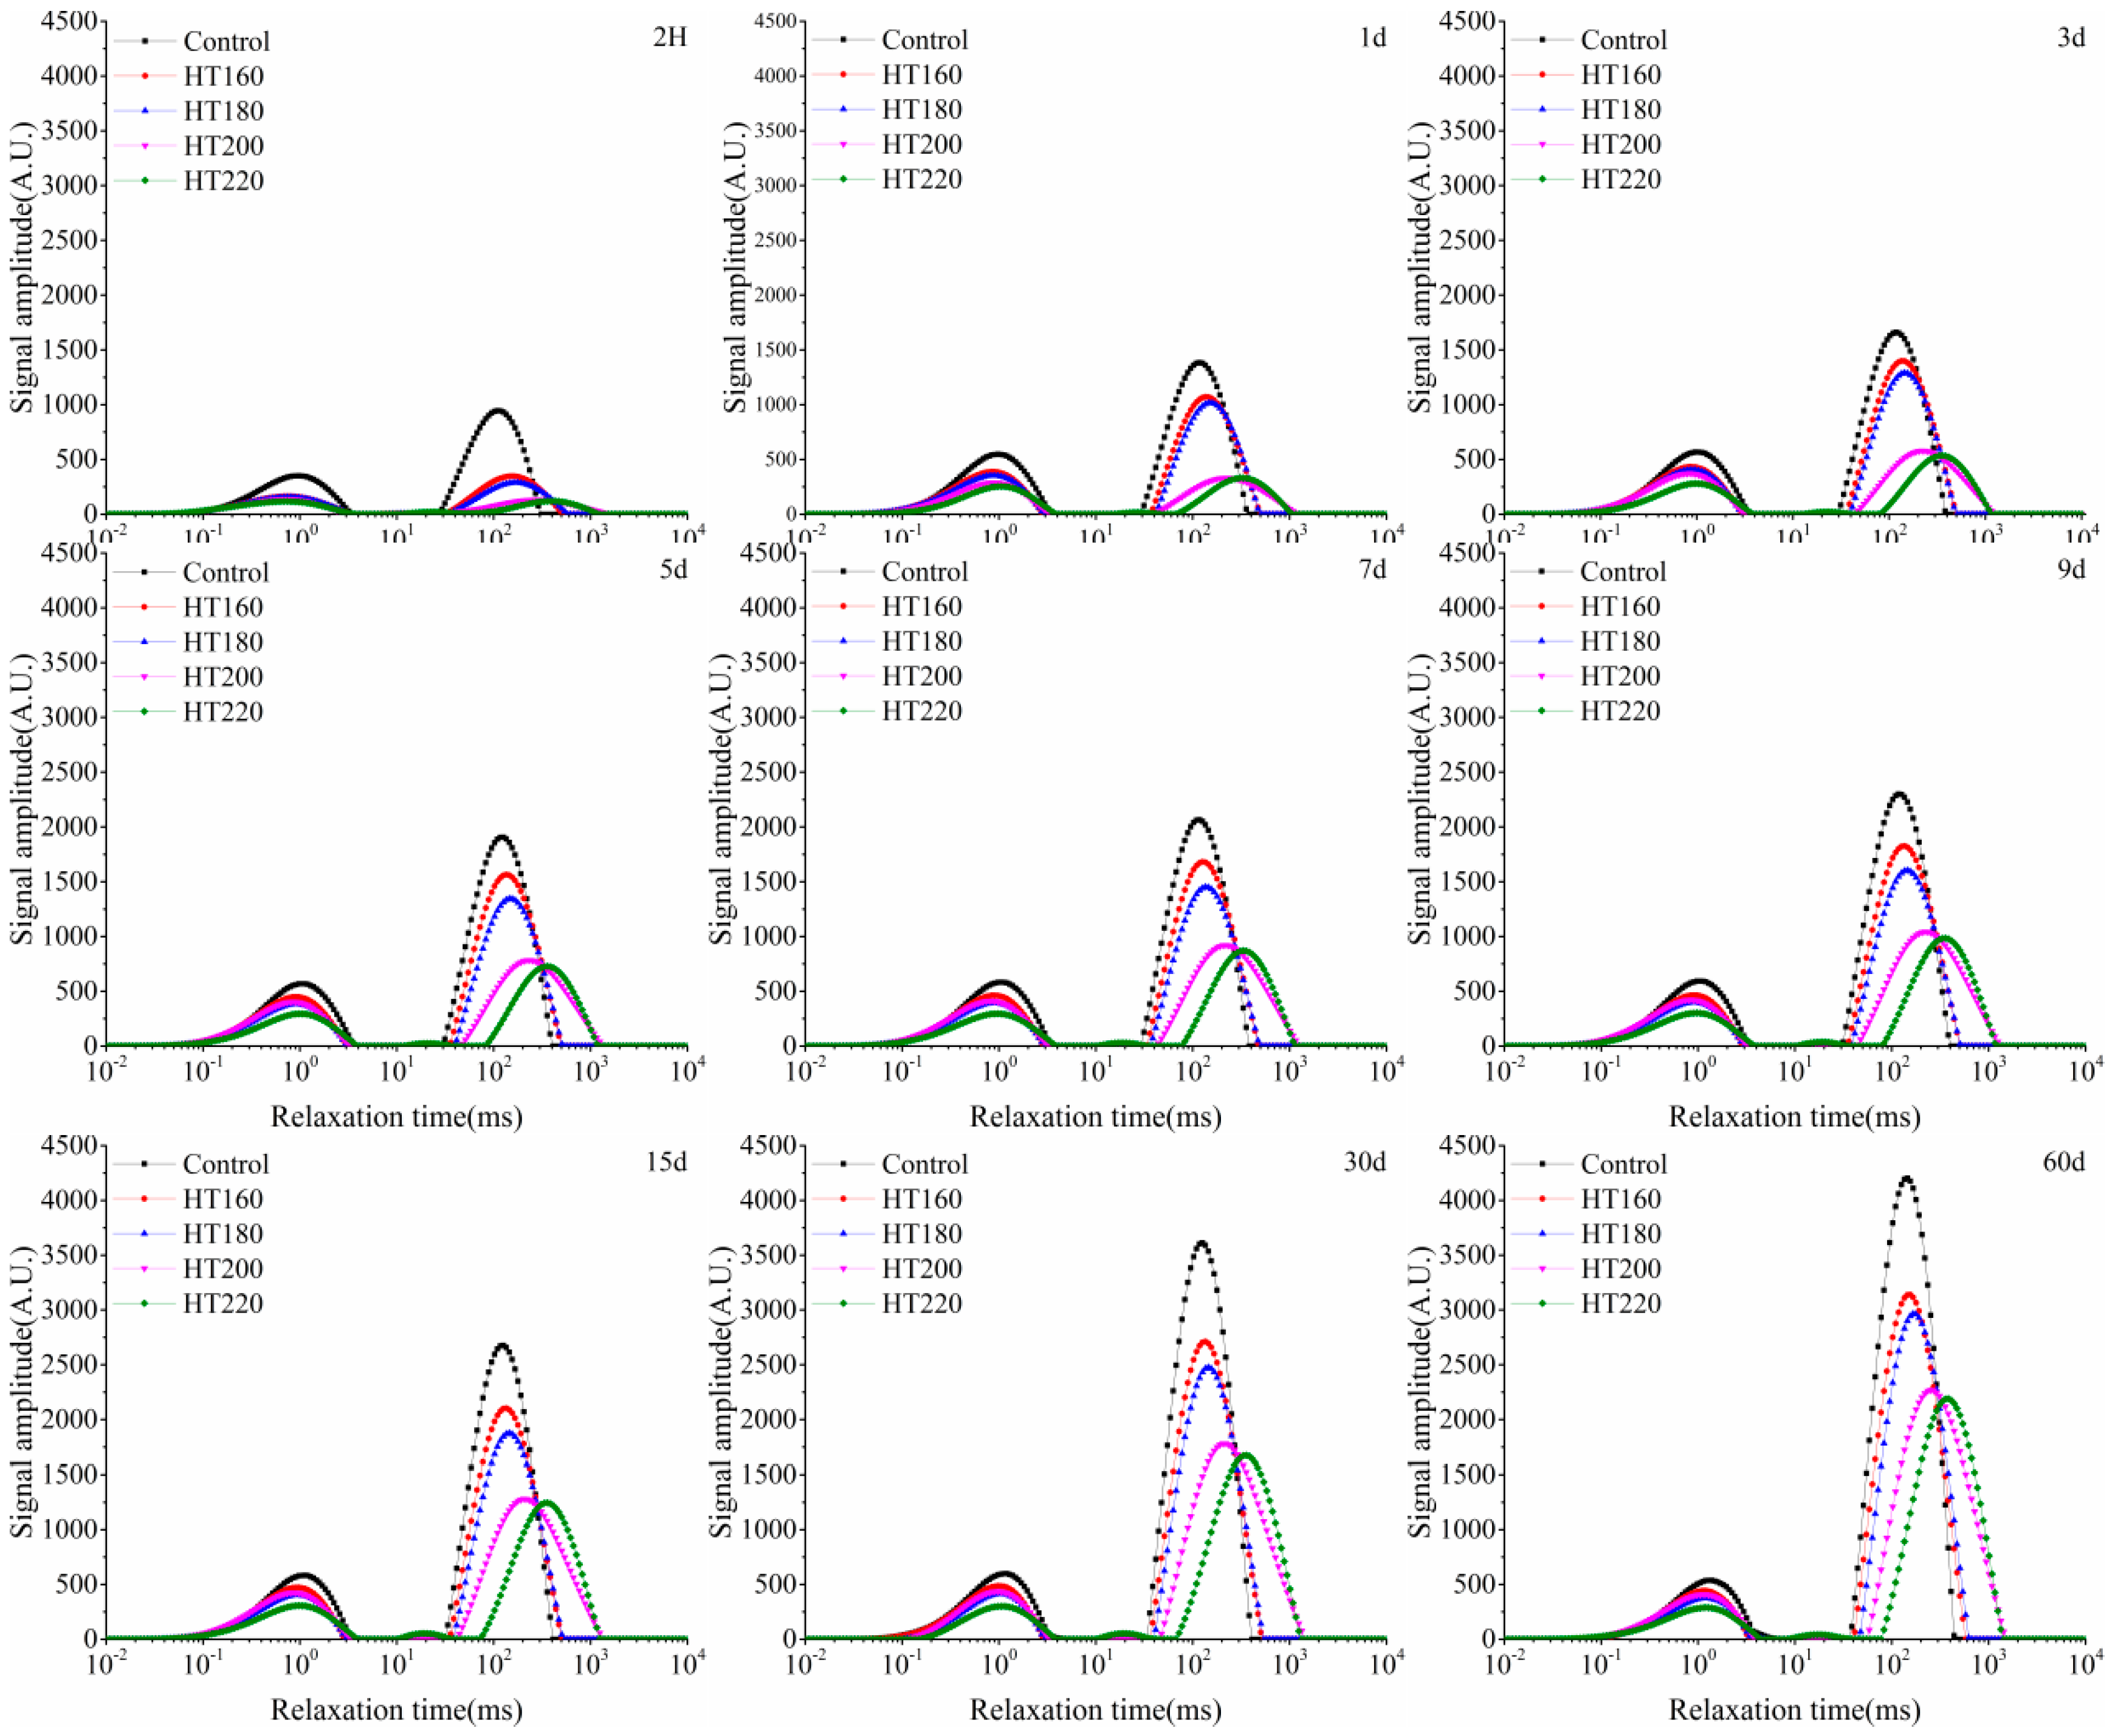
Figure 5.
The content of bound water (a) and free water (b) in untreated and heat-treated Chinese fir wood samples.
Figure 5.
The content of bound water (a) and free water (b) in untreated and heat-treated Chinese fir wood samples.
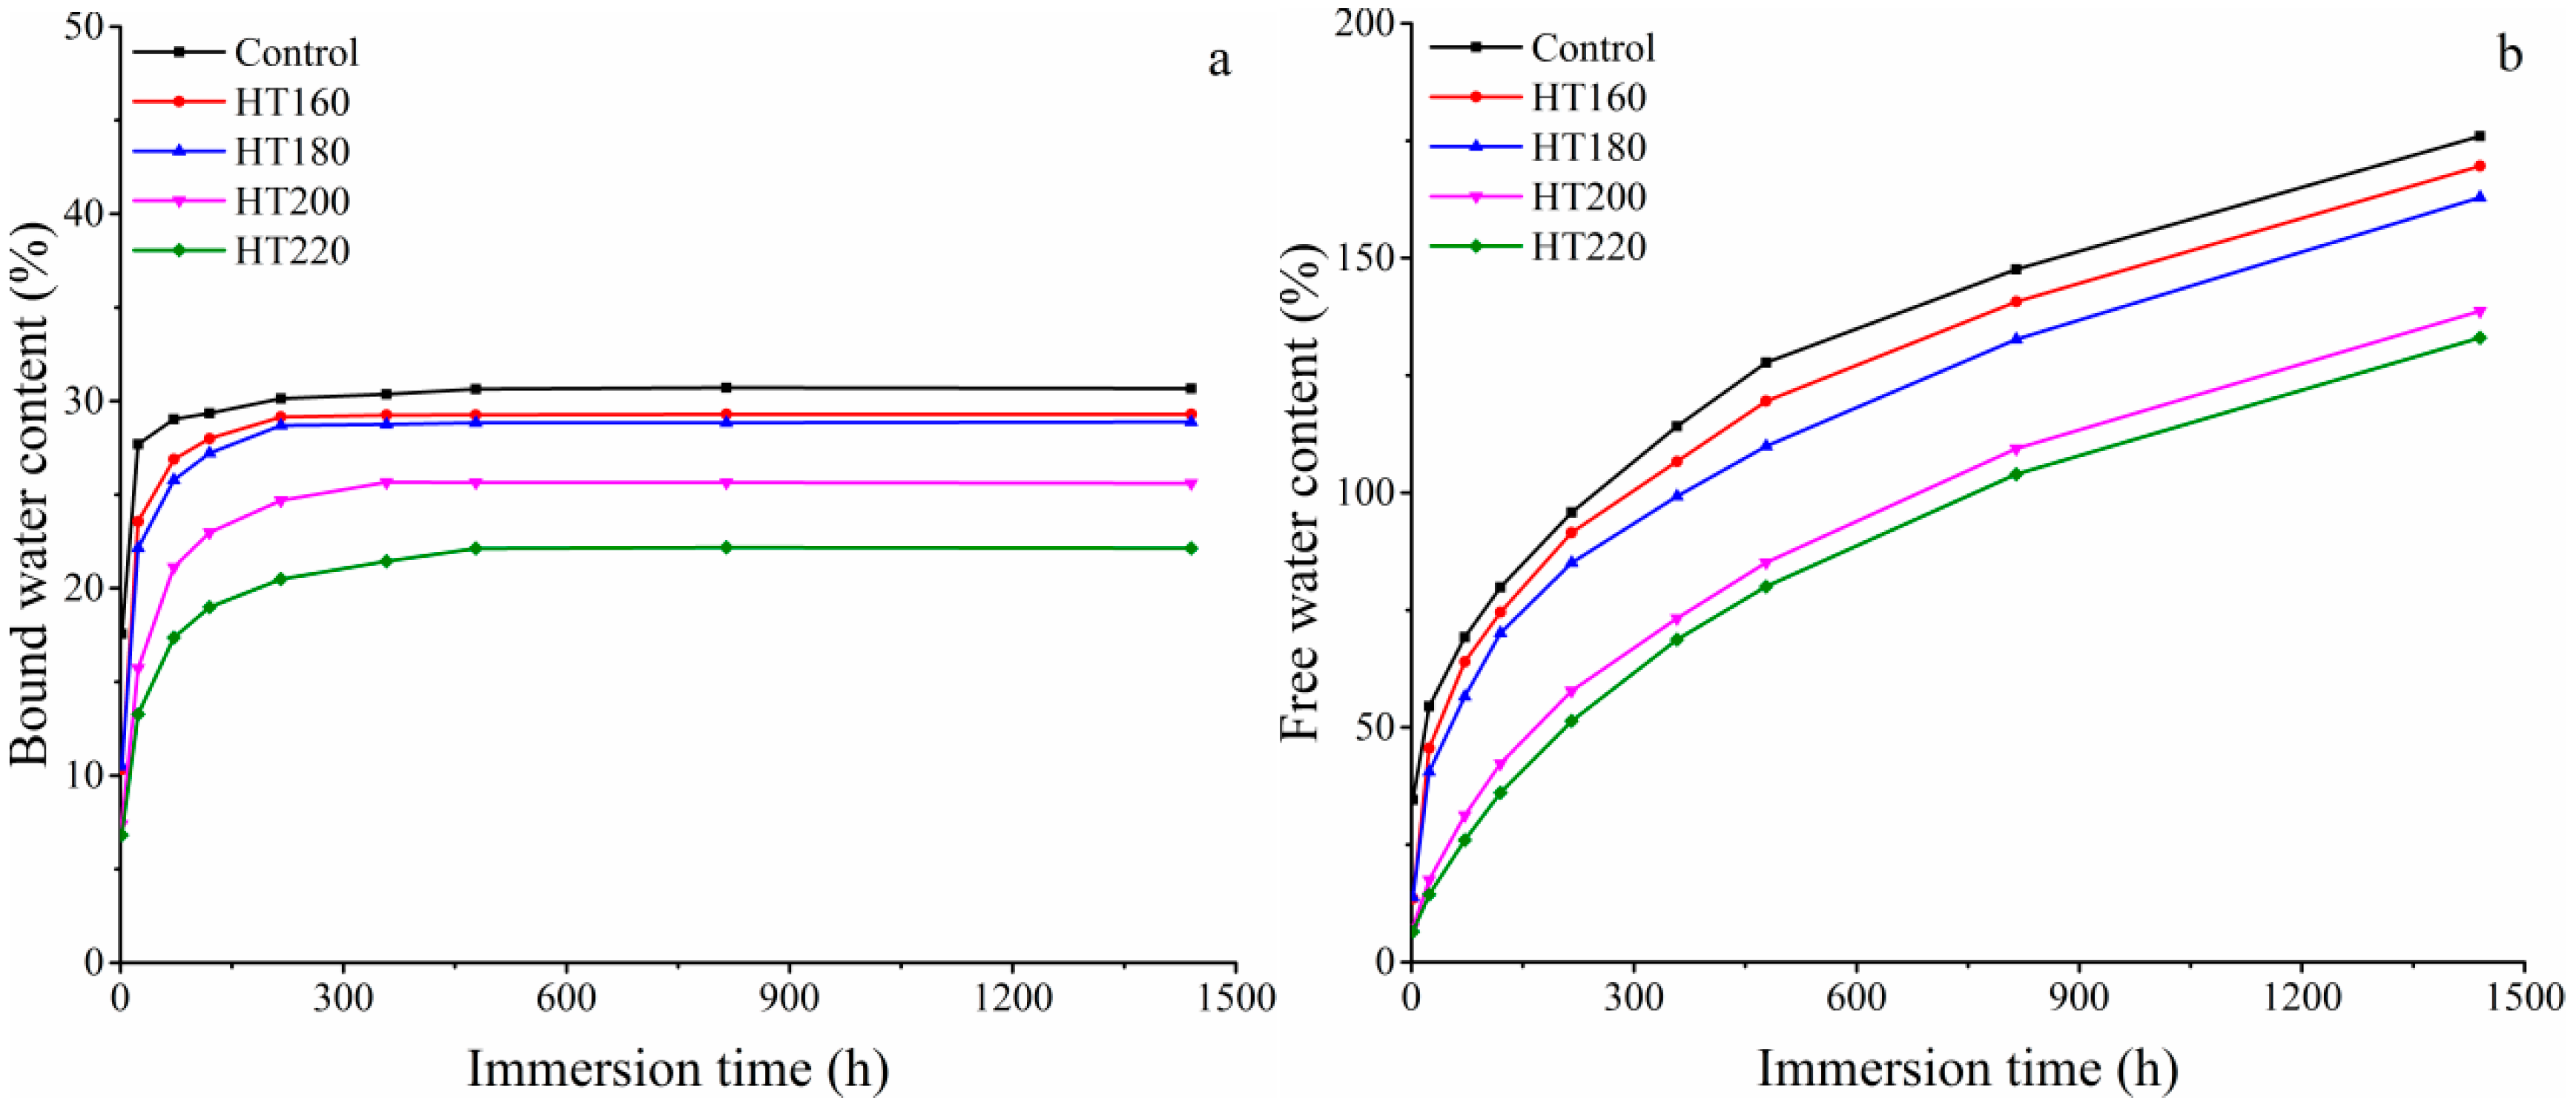
Figure 6.
(a) The change of MC of untreated and heat-treated Chinese fir samples along with the immersion time. (b–f) The MC profiles of untreated and heat-treated Chinese fir samples during water uptake for 60 days.
Figure 6.
(a) The change of MC of untreated and heat-treated Chinese fir samples along with the immersion time. (b–f) The MC profiles of untreated and heat-treated Chinese fir samples during water uptake for 60 days.
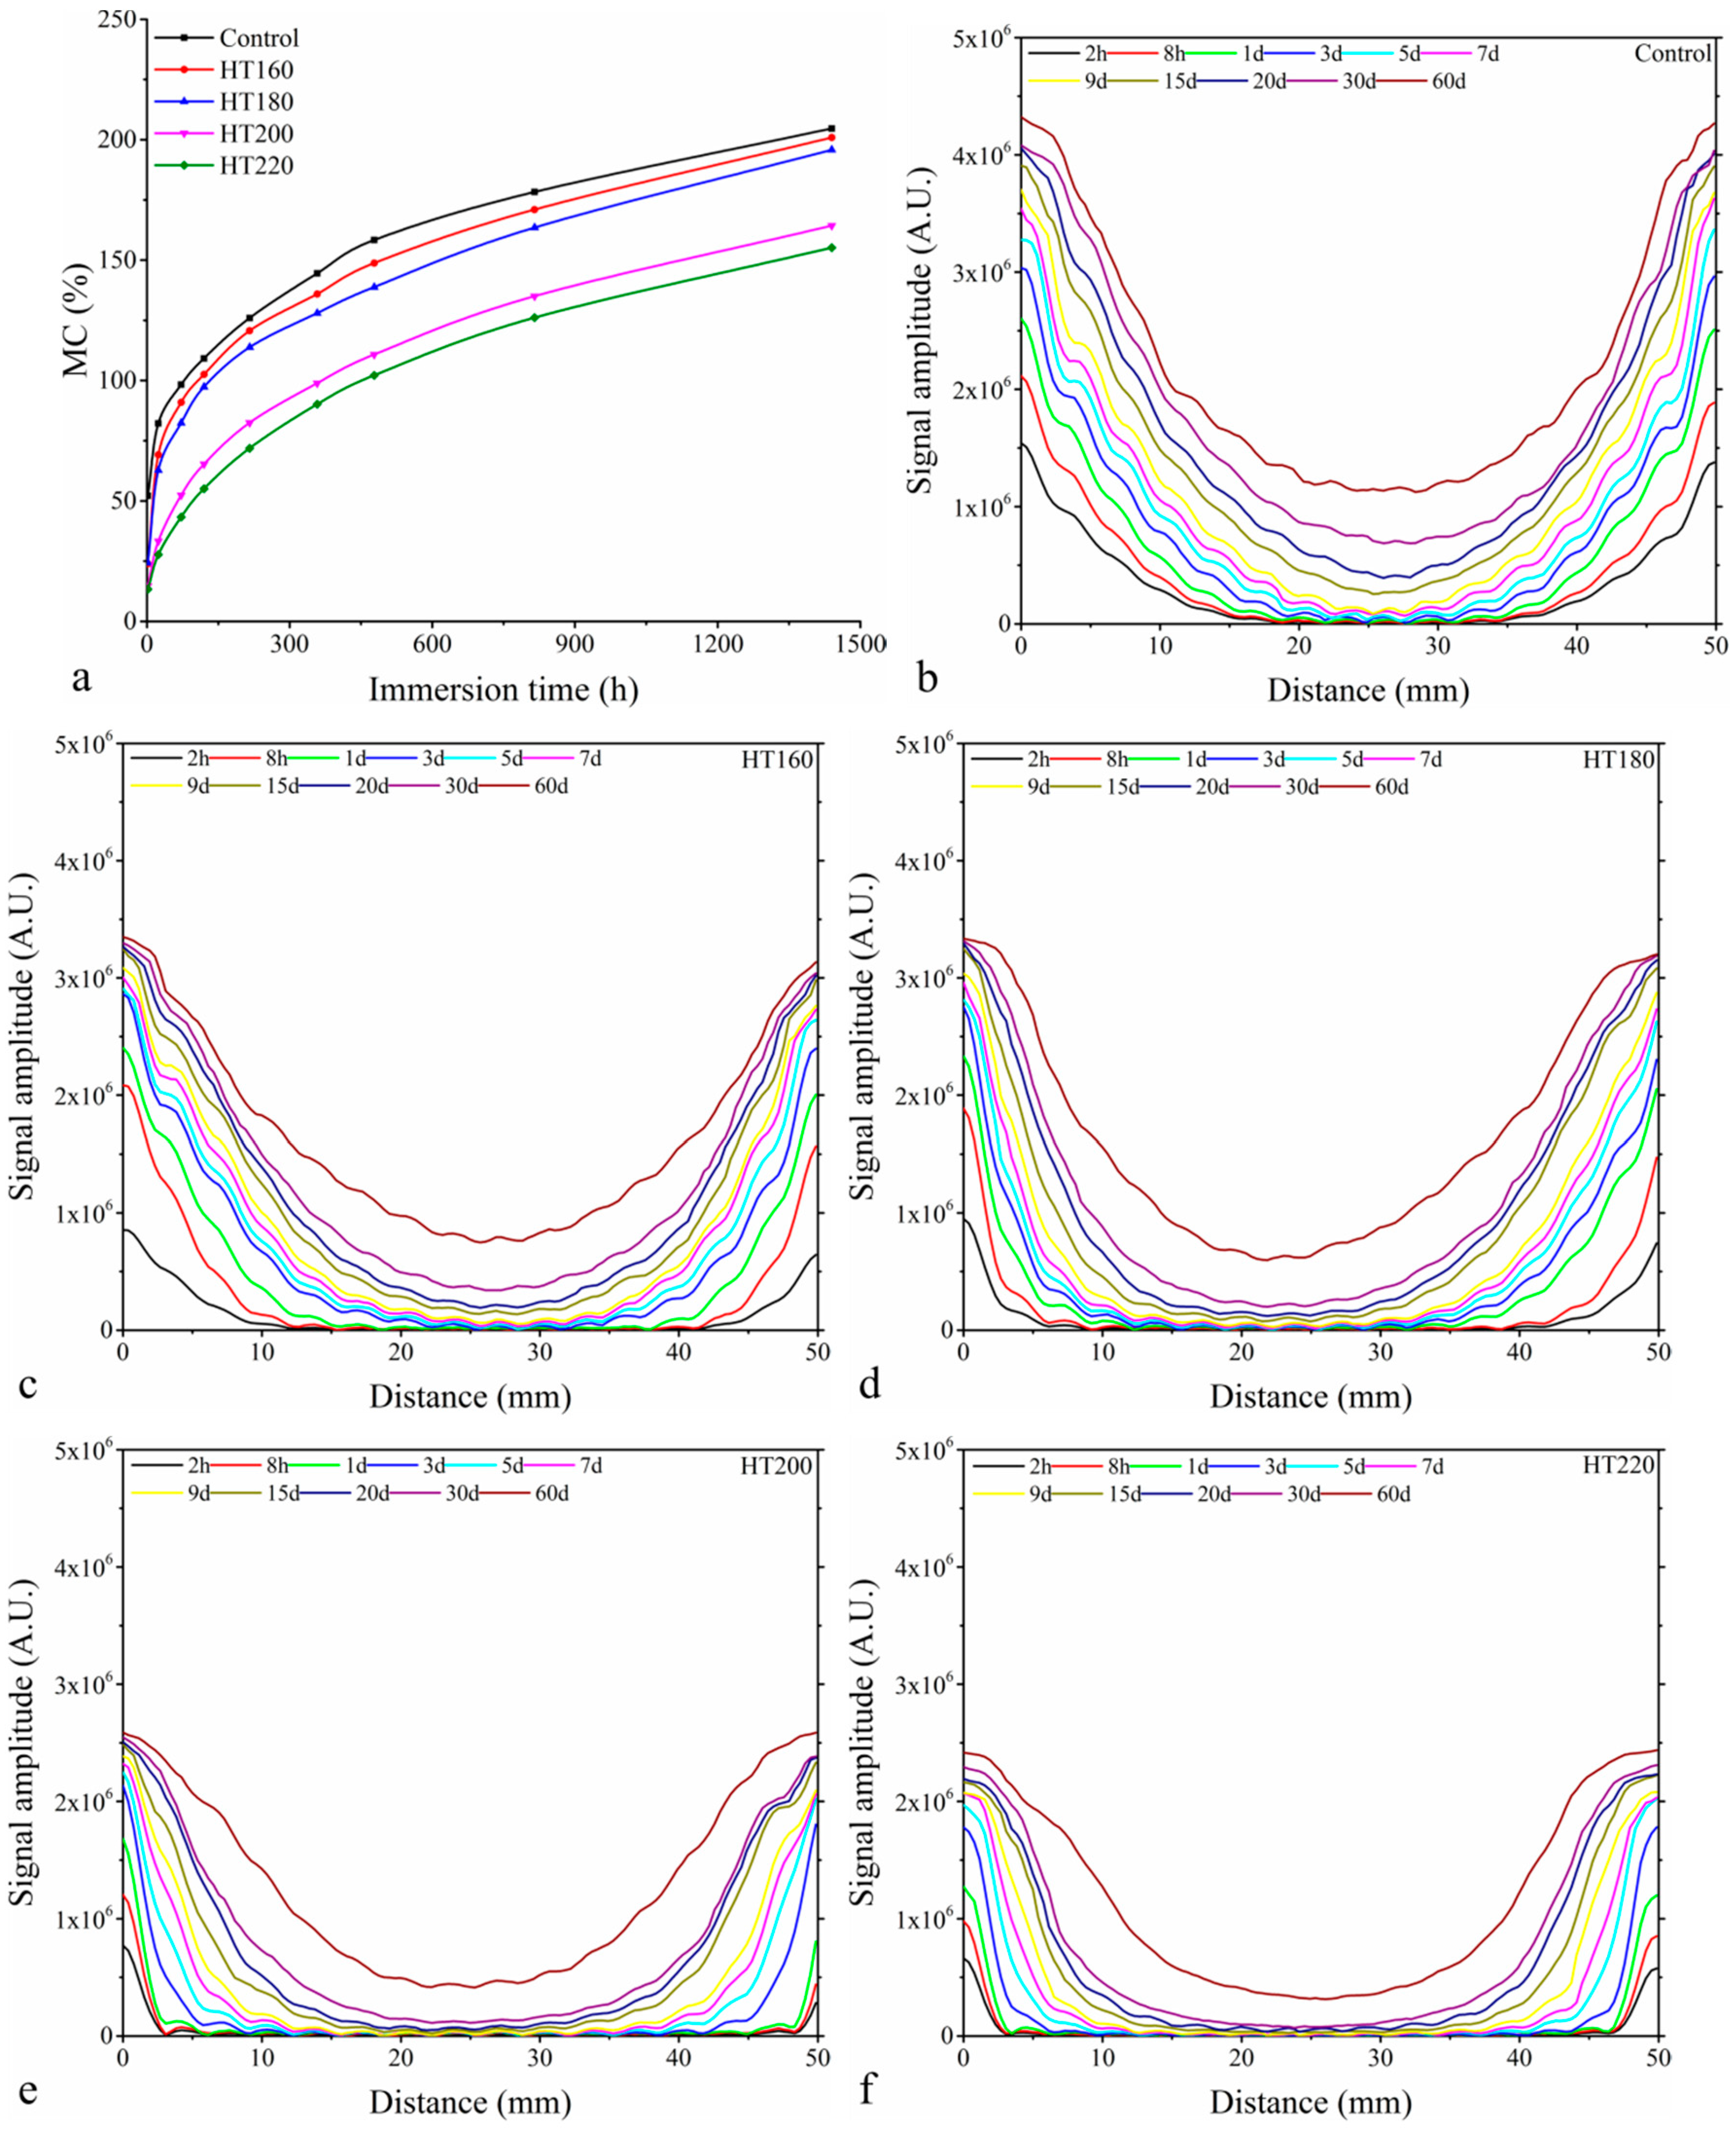
Figure 7.
Axial NMR images of free water absorbed in the samples heat-treated at 220 °C as well as the untreated samples, measured after immersed for 1, 5, 10, 20, 30, and 60 days, the images were took from the two ends and the middle of samples (the color bar which reflects the signal intensity is shown under the figures). Three-dimensional reconstructions of the samples are shown below the images.

© 2018 by the authors. Licensee MDPI, Basel, Switzerland. This article is an open access article distributed under the terms and conditions of the Creative Commons Attribution (CC BY) license (http://creativecommons.org/licenses/by/4.0/).
Share and Cite
MDPI and ACS Style
Gao, Y.; Xu, K.; Peng, H.; Jiang, J.; Zhao, R.; Lu, J. Effect of Heat Treatment on Water Absorption of Chinese fir Using TD-NMR. Appl. Sci. 2019, 9, 78. https://doi.org/10.3390/app9010078
AMA Style
Gao Y, Xu K, Peng H, Jiang J, Zhao R, Lu J. Effect of Heat Treatment on Water Absorption of Chinese fir Using TD-NMR. Applied Sciences. 2019; 9(1):78. https://doi.org/10.3390/app9010078
Chicago/Turabian StyleGao, Yulei, Kang Xu, Hui Peng, Jiali Jiang, Rongjun Zhao, and Jianxiong Lu. 2019. "Effect of Heat Treatment on Water Absorption of Chinese fir Using TD-NMR" Applied Sciences 9, no. 1: 78. https://doi.org/10.3390/app9010078
Note that from the first issue of 2016, this journal uses article numbers instead of page numbers. See further details here.