A Novel Method Based on Neural Networks for Designing Internal Coverings in Buildings: Energy Saving and Thermal Comfort


1
Department of N. S. and Marine Engineering, Universidade da Coruña, Paseo de Ronda, 51, 15011 A Coruña, Spain
2
Department of Mechanical Engineering, Catholic University of Ávila, C/Canteros, s/n, 05005 Avila, Spain
*
Author to whom correspondence should be addressed.
Appl. Sci. 2019, 9(10), 2140; https://doi.org/10.3390/app9102140
Submission received: 5 April 2019
/
Revised: 21 May 2019
/
Accepted: 22 May 2019
/
Published: 25 May 2019
(This article belongs to the Special Issue Sustainable Energy Systems Planning, Integration and Management)
Abstract
:Featured Application
This work shows a new methodology to optimize the exact amount of permeable internal coverings in a building, thereby becoming a passive method control system for this indoor ambience.
Abstract
Although several papers define energy saving and thermal comfort optimization with internal coverings materials, none of them deal with predictive models to improve design in building constructions. Thus, artificial intelligence (AI) procedures were applied in this paper. In particular, neural networks (NNs) were designed for indoor ambiences with internal covering materials in different buildings, were trained and employed to predict indoor ambiences (indoor temperature and relative humidity as a function of weather conditions), and, based on these procedures, local thermal comfort conditions and energy consumption, due to the type of internal covering permeability level, were calculated. Results from this original methodology showed a better acceptability of indoor ambiences when permeable coating materials were used, in agreement with previous research works. At the same time, with permeable coverings, a lower energy consumption of 20% in the heating, ventilation, and air conditioning (HVAC) systems was needed to reach more comfortable conditions during the summer season in the first hours of occupation. Finally, all these results suggest an original methodology to optimize indoor ambiences based on the design of internal coverings by NN.
Keywords:
novel method; internal coverings; neural networks; energy; thermal comfort; control system1. Introduction
Internal coverings are now commonly employed in new and old buildings. In particular, public spaces, such as office buildings, are selected for internal coverings based on the principles of a good economy and easily washable surfaces. Consequently, most of the time, impermeable coverings are selected for buildings due to their high durability and ease of cleaning. On the other hand, in the last decade, permeable internal coverings as a passive method to control indoor ambiences have attracted much attention [1,2,3,4,5]. Initially, this passive effect was neglected for a long time [6]; however, under low ventilation rates, this passivity was clearly appreciated [7]. Finally, initial studies in wooden structures [6,8] were employed to analyze the same passive effect on concrete buildings covered with coatings of different materials, such as paper, wood, and paint or plastic [7,9]. Initially, these studies were evaluated in laboratories to define their coefficients, such as diffusion coefficients or water vapor permeability [10], for applications such as inputting data in future modelling processes [11] so as to define the real effect of internal coverings over indoor ambiences after placing these materials in their final constructive position in buildings [12].
The International Energy Agency (IEA) made several different attempts to predict indoor ambiences based on outdoor weather conditions. However, predicting indoor ambiences is a complex objective with a large number of unknown variables, such as the properties of materials in a building construction positions. Despite the fact that materials are tested in a laboratory in their final application place, experiments with different treatments change their expected behavior, [13] such varnishing, painting, covering with paper, or simply dusting over the covering. Recent papers have reported that many of the current numerical models for building energy systems assume empty rooms and do not account entirely for the thermal inertia of objects and materials, such as furniture. This assumption makes the models invalid for dynamic calculations [14]. The issues arising during the simulation processes are too complex to understand and apply realistically to building behavior.
Despite the interest in heat and mass transfer processes in buildings, toward energy saving and thermal comfort improvement, most of the studies are centered on phase change materials (PCMs) that affect buildings [15,16] due to the addition of new materials, reaching a more intense effect over indoor ambiences. Despite this, in accordance with the sustainability, and considering the impossibility of development in most countries, these constructive materials seem expensive, which is why it is necessary to continue the analysis of this effect on the basis of the usual internal covering materials to reach the optimization level in buildings.
In previous research on the effect of permeable internal coverings in the indoor conditions of 25 office buildings [1,2,3,4,5], it was possible to define, based on statistical studies, the effects of internal coverings over real indoor ambiences during an unoccupied period. During the occupied period, the offices attend to clients and the air changes are so high that the covering materials are ineffective in controlling the ambiences [7]. In this sense, internal covering materials like paper, wood, paint, and plastic can be classified as permeable, semi-permeable, and impermeable, in clear agreement with its expected permeability level.
Furthermore, in previous works [1,2,3,4,5], the statistical hourly study of the partial vapor pressure difference between indoor and outdoor ambiences showed that, although this effect is more intense in wooden constructions, the internal covering over concrete walls act as a barrier that influences the building by controlling the indoor ambience. In particular, permeable materials show a tendency to reduce the indoor partial vapor pressure when it is high in the ambience, and vice versa. Simultaneously, impermeable materials only increase the effect of outdoor humidity, reaching a greater number of dissatisfied persons during the first hours of occupation. As a consequence, during the first hours of occupation, the enthalpy was high and the energy consumption increased to reach an acceptable ambience, which was a peak of energy demand during the morning.
Although our results suggest the applicability of permeable materials, the information on optimal material properties and the amount of internal coverings needed in an indoor ambience to act as an adequate mechanical thermal comfort controller, remains unknown, and so a new design methodology towards nearly-zero energy building (NZEB) is needed [17,18]. This is related to the fact that statistical studies do not allow us to model this process and recognize the real material coefficients once placed in the building.
Despite the fact that there are previous works about control systems of indoor ambiances in buildings and its posterior optimization by artificial intelligence, a few of them are centered on wall construction materials. Furthermore, the permeability level of internal coverings was simulated in heat and mass transfer software resources, which, most of time, do not let researchers develop feedback and redesign the building construction characteristics. Furthermore, in the present paper, the input variables considered were outdoor temperature and relative humidity, which could be related to just one output variable per neural network (NN), such as indoor local perception of indoor air quality (PD), indoor air acceptability (ACC) and indoor enthalpy (energy consumption), with the aim of a future optimization of indoor thermal comfort and a reduction of building energy consumption.
NNs are employed when the statistical results are insufficient in revealing great results in most of the research areas, indicating the solution to different problems, such as natural ventilation and thermal comfort in buildings [18,19]. In particular, NNs are a universal approach that allow us to model everything that statistical curve fitting cannot, letting us model some processes and predict their behavior. Once statistics showed these results, it was of interest to train neural networks based on outdoor conditions to predict indoor conditions and reach a quantitative determination of the permeability level of internal coverings. In the present paper, an initial step was performed on the validation of an original modelling procedure based on real sampled data and its predictions, in accordance with the knowledge developed in the last few decades.
2. Materials and Methods
2.1. Office Buildings
In previous research works [1,2,3,4,5], different statistical studies were developed to identify the behavior of indoor conditions in office buildings in the northwest region of Spain. This region is of special interest due to its high relative humidity, which is nearly 80% throughout the year, and its mild climate with a mild temperature.
Offices were selected owing to their usage of the same construction materials and structure, except the internal covering, which let us relate the effect of internal coverings with different ambiences. This internal covering was classified as permeable, semi-permeable, and impermeable, in accordance with indoor ambience behavior under different weather conditions. The behavior of internal coverings was in accordance with the expected permeability level of other materials, such as paper, paint, and plastic.
Two time periods were identified in these offices, in accordance with the working hours, which could be directly related to the high or low ventilation rate and the presence or absence of humidity sources from its metabolic rate. The occupied period was defined as a period when clients and workers were in the office from 09:00 to 19.00, and the unoccupied period was defined as the time-period when nobody was in the office from 19:00 till 09:00 the next day. During the unoccupied period, the ventilation rate was reduced and only the internal coverings could have decreased humidity these ambiences.
2.2. Sampling Temperature and Relative Humidity
Different weather stations from the Environmental Information System of Galicia (SIAM) [20] in the entire Galician region provide us the main climatic variables, such as temperature, relative humidity, pressure, and air velocity, with a time frequency of 10 min. This sampling frequency can be considered to be adequate for our research work.
On the other hand, to sample indoor conditions, different tiny tag data loggers [21] of temperature and relative humidity were placed in each office during the summer and winter seasons, with a sampling frequency of 5 min after calibration, with a precision range of ±1 °C of temperature and 1% of relative humidity, respectively.
3. Calculation
3.1. Local Thermal Comfort Indexes
Indoor temperature and relative humidity can be related to some local thermal comfort indexes, as shown in a previous study by Toftum et al. [21,22,23] and Simonson et al. [24]. Different research works revealed that the percentage of dissatisfied persons with warm respiratory thermal comfort (PDWRC) or the percentage of dissatisfied persons with indoor air quality (PDIAQ) were employed to identify the acceptable level of an indoor ambience (ACCIAQ), which ranges from −1 (clearly unacceptable) and 0 (just acceptable) to +1 (clearly acceptable), and the expected percentage of dissatisfied persons. As in previous research, PDIAQ was found to be more sensitive to the changes in the indoor air conditions, which is an interesting index for this study, as compared to the PDWRC. The Equations (1) and (2) represent the variables ACCIAQ and PDIAQ:
The two indexes shown in Equations (1) and (2) were obtained by Fang et al. [25] and were based on the laboratory studies, where the subjects were facially exposed to clean air in a climatic chamber, and different indoor air temperatures and relative humidity could be modelled with a perception of indoor air quality. In this sense, the first term defined by these laboratory results showed moist air acceptability due to the indoor air quality. As can be seen from Equation (1), this acceptability is clearly a function of moist air enthalpy (h). On the other hand, the second index obtained from the previous index is the percentage of dissatisfied persons expected to be in disagreement with the proposed indoor air (PDIAQ). This index, shown in Equation (2), is the only function of the moist air acceptability (ACCIAQ).
At the same time, due to the moist air, the enthalpy difference respects the comfortable conditions, both in summer or winter seasons, which are proportional to the energy consumption needed to reach this comfortable ambience; the enthalpy was calculated for each indoor ambience under the effect of each internal covering during extreme summer and winter seasons.
3.2. NN Training and Prediction
Matlab NN [26] is the main software resource employed to train and predict the behavior of internal covering materials as a function of weather conditions. In this sense, it is of interest to highlight that the generalized regression neural network (GRNN), due to its main advantages, is related to the lack of need to define the topology of the network. One of the more complex decisions to make when developing this kind of study is the number of nodes needed that relate to the precision of the results and the time and the number of calculations needed to obtain each of the different predictions. As a consequence, an interesting neural net selection of two hidden layers were selected by default, which is considered to be adequate for most of the real processes.
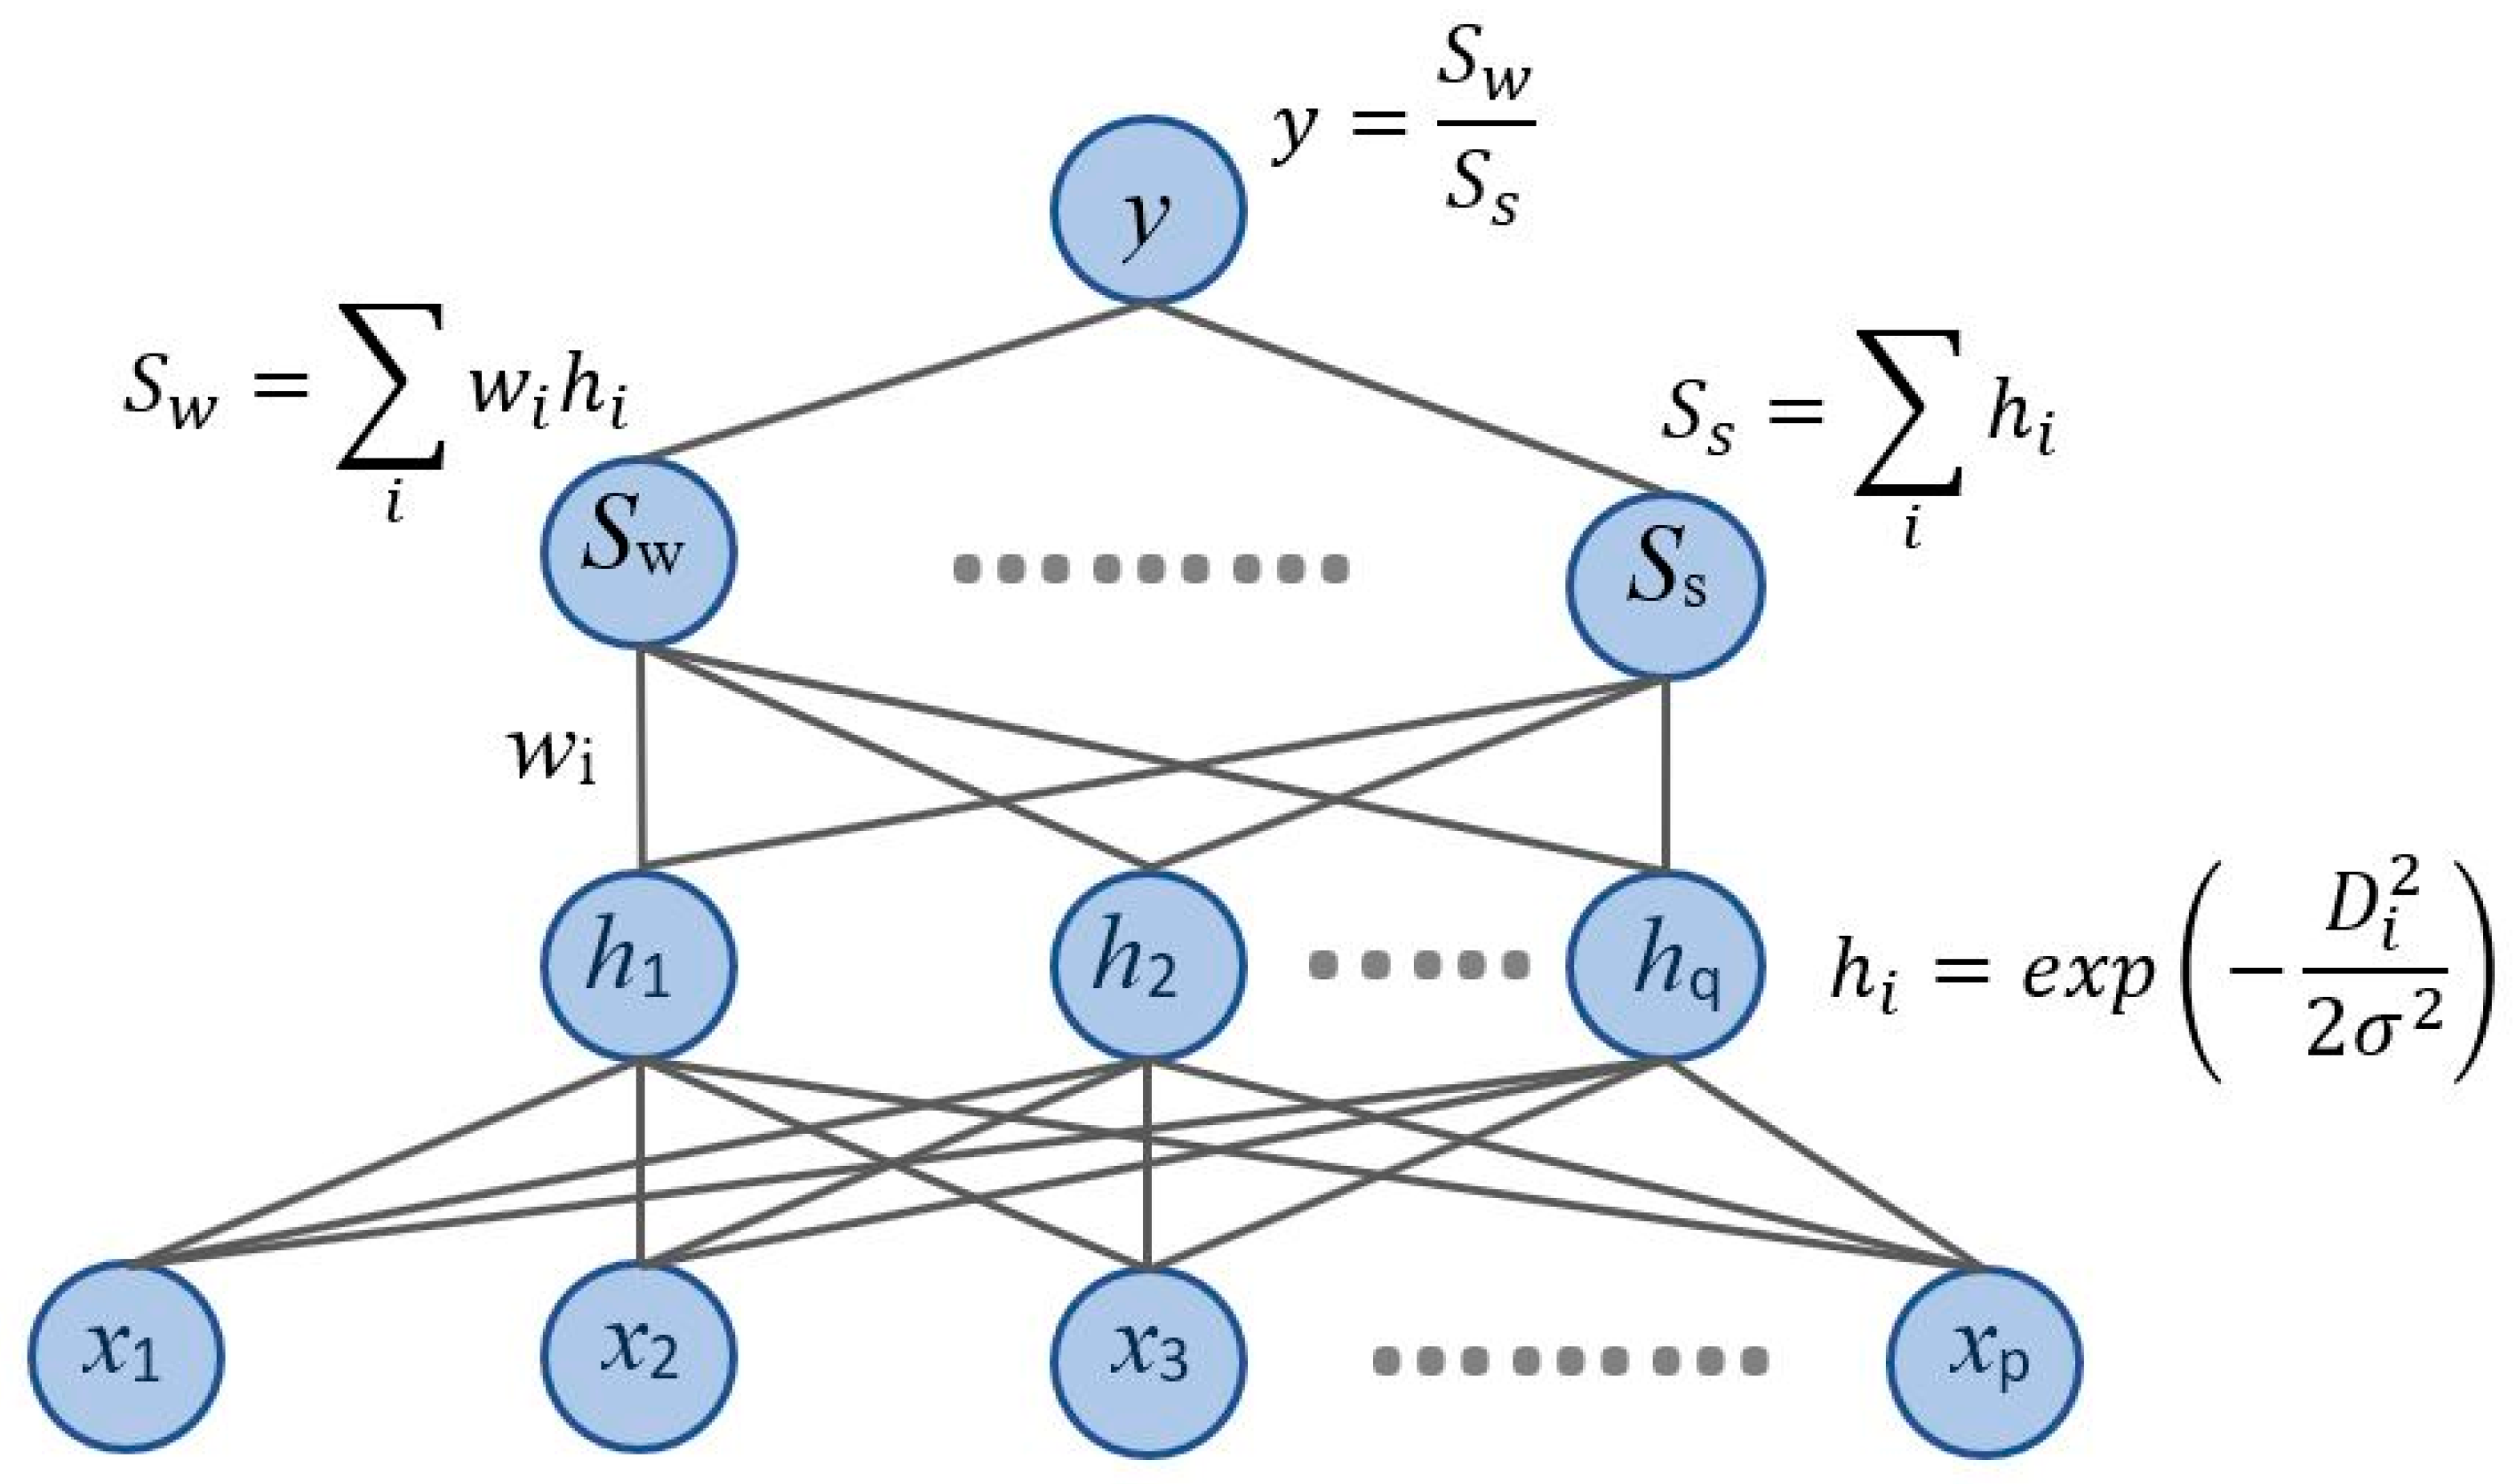
The neuronal model of generalized regression employed in this research work (GRNN) was proposed and developed by Specht in 1991 [27,28]. It possesses the desirable property of not requiring any iterative training, that is, it can approximate any arbitrary function between input vectors (inputs) and output vectors (outputs), taking the estimation of the function directly from the training data. In this sense, the GRNN model relies on nonlinear regression theory. It is, in essence, a method to estimate a function f (x, y) only through the training set, so that the joint probability function, which is unknown, is estimated using the Parzen estimator [27,28]. To do this, we must first define the following distances between “x” and “y”.
The output of the GRNN can be defined by Equations (3) and (4):
where x isthe training sampled, y is the training sampled output, σ is the smoothing parameter of the GRNN, and T is the number of Parzen windows used in the estimation process. Equation (3) shows the Euclidean distance between the input xi and the training sampled (Di), and Equation (4) shows the fundamental expression of the neuronal model.
The topology of the GRNN model has four layers. The first layer represents the vector of inputs or inputs. The second layer, called the pattern layer, is equal to the number of observations of the input vector. The value of the neuron in this non-visible layer is obtained by applying the activation function, , which is an extension of the Gaussian multivariate function. The third layer includes two types of summations: (i) , which represents the denominator (D(x)) and (ii) , which is the numerator (N(x)), where “wi” are the values of the output used in the learning phase and which act as weights. Finally, in the fourth layer the output is obtained by the following operation, , as we can see in the Figure 1.
Once training data are introduced in the input layer, the training starts and it will stop when a previously marked fitness is reached or, if the values don’t improve, when they reach a value close to zero, for a number of consecutive generations. In our case, the average percentage of incorrect predictions for each weather station was selected, as we can see in Table 1.
In the second part of this experimental configuration, the main variables to be employed were selected in accordance with the NN rules. In this sense, NNs can predict only one dependent variable as a function of a wide number of independent variables. The problem appears to adjust this methodology to our case study, where we need to define the indoor conditions as a function of how to minimize the indoor and outdoor temperatures and the relative humidity. As a consequence of this, partial vapor pressure was selected as the main study variable as it represents indoor conditions and due to its difference with the outdoor partial vapor pressure, which used to be employed to analyze heat and mass transfer processes in building construction materials.
However, different results from past studies [1,2] have shown that only outdoor partial vapor pressure, outdoor temperature or relative humidity is needed to train the NNs with an adequate precision. In consequence, these two input variables were selected to train and predict indoor partial vapor pressure, enthalpy, and local thermal comfort indexes during the summer and winter seasons.
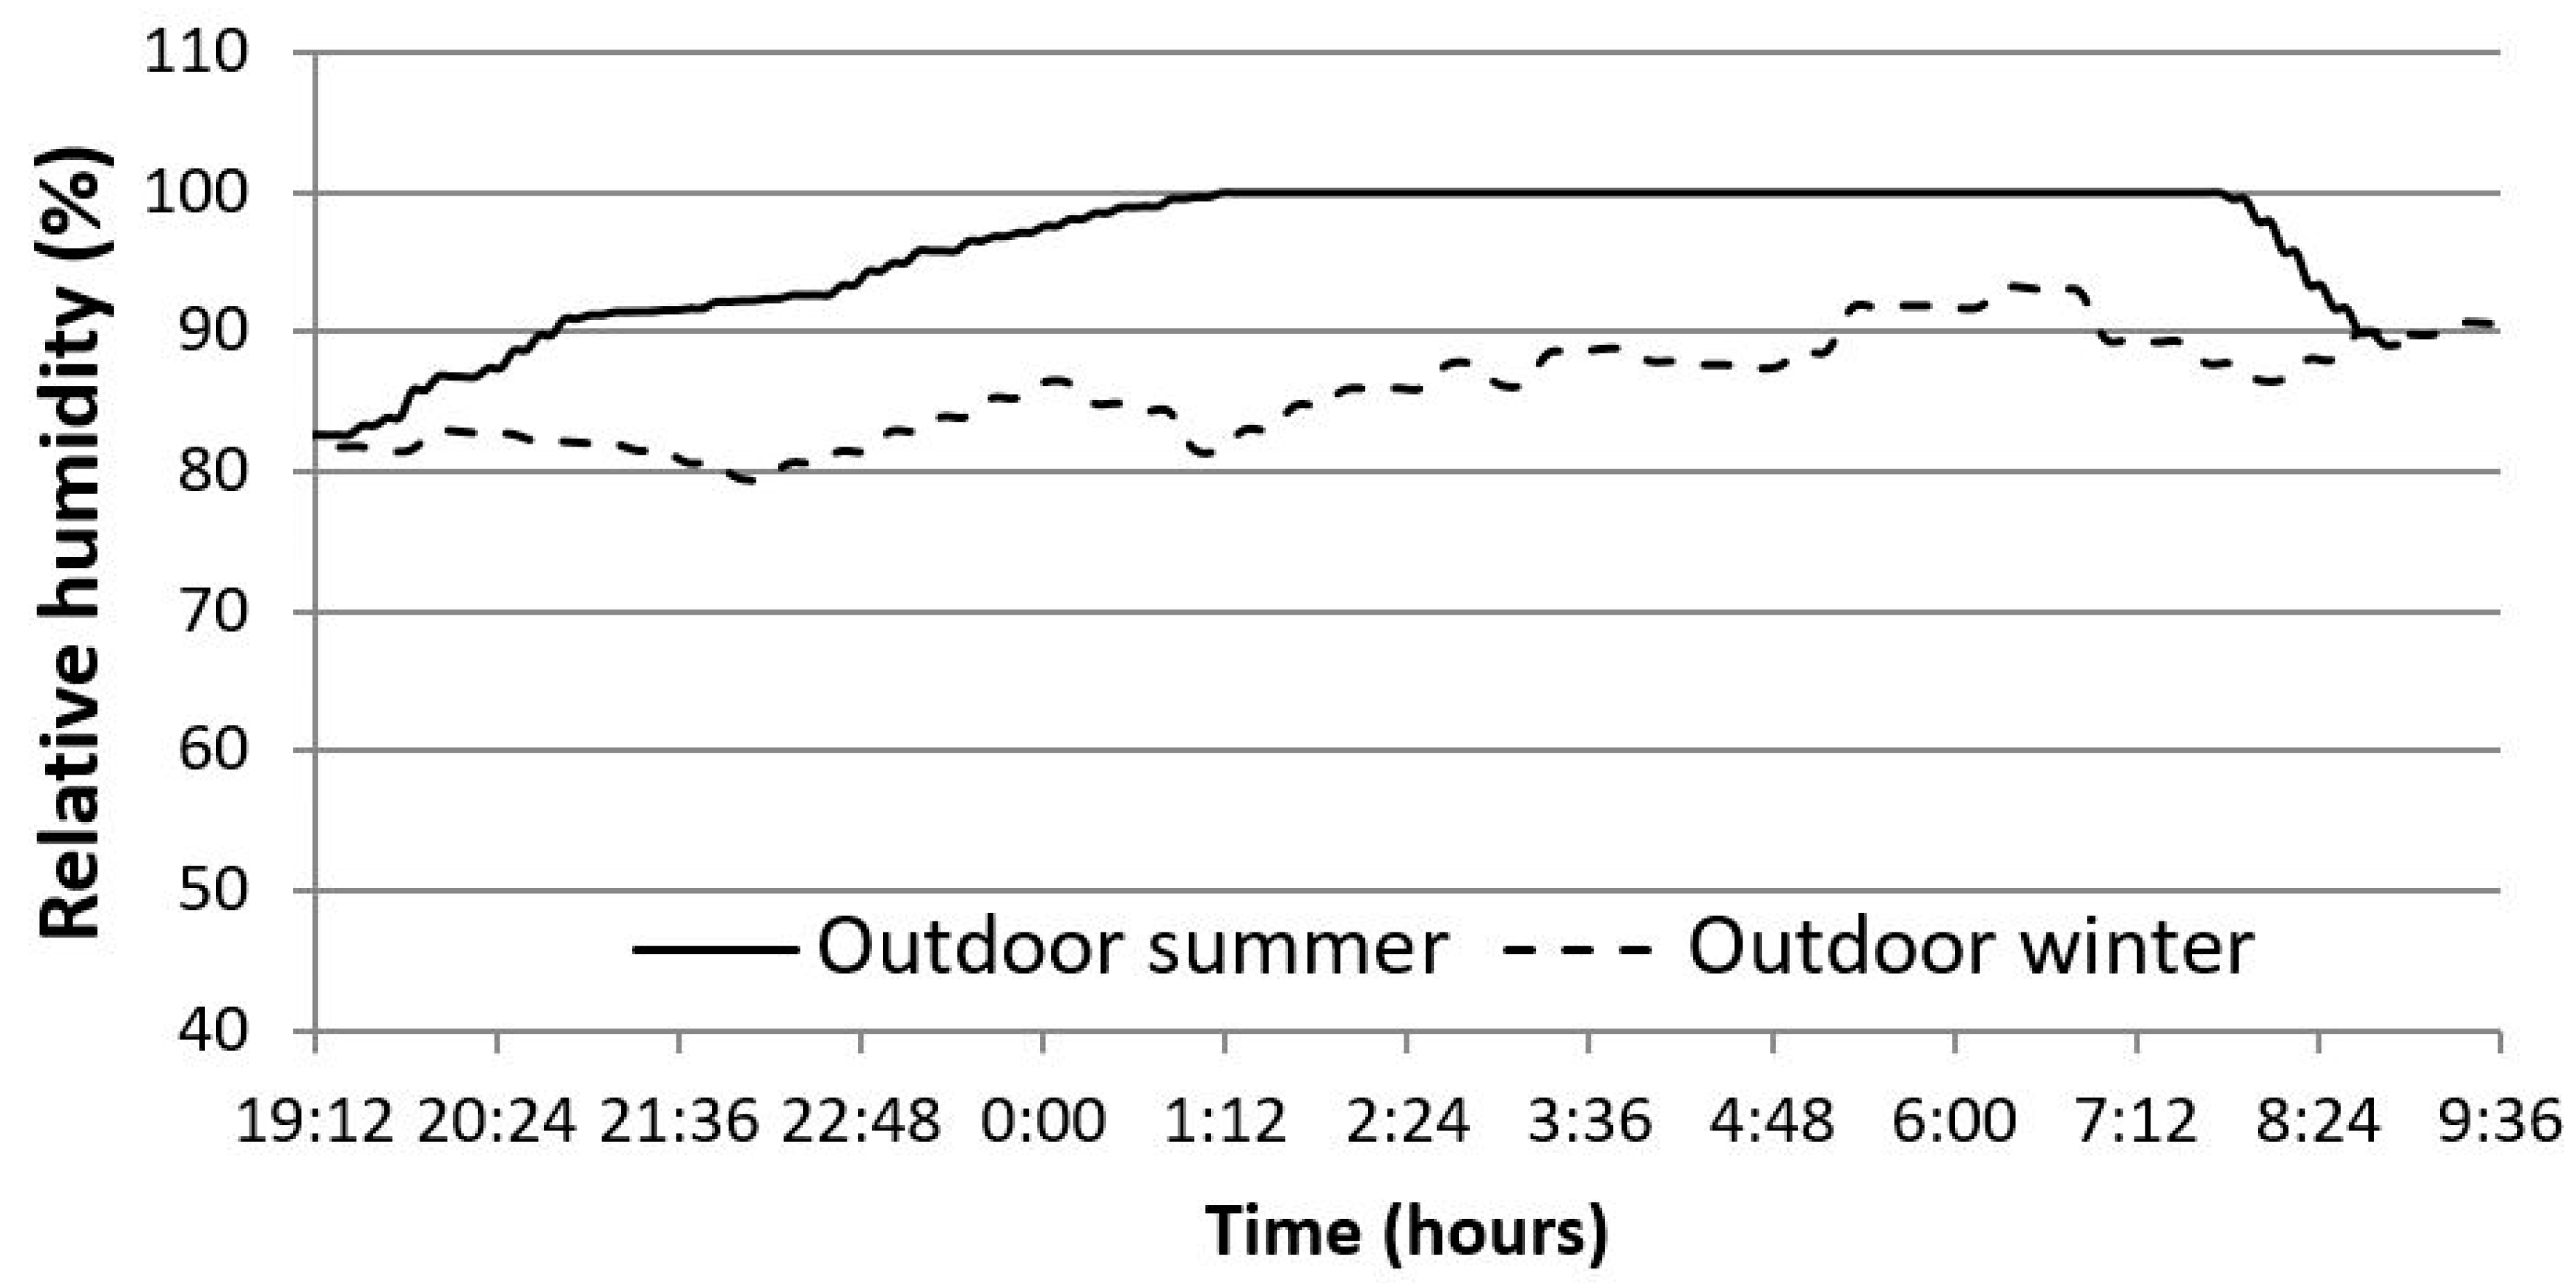
Finally, in the second step, to compare and understand the behavior of the internal coverings, each of the trained networks were required to be stimulated under the exact same weather conditions for each season. Figure 2 and Figure 3 depict the outdoor temperature and relative humidity (RH) sampled in a typical Galician night. The data reflected in Figure 2 and Figure 3 are real curves obtained from nearer weather stations that are certificated and calibrated by the Spanish ministry. These are the real weather conditions selected for their usual nearly constant high relative humidity, as is normal in the coastal regions of Galicia. In the winter season relative humidity increases during the night and, in summer, it may reach 100% during long periods of time due to fog, as we can see in Figure 3.
An interesting change in temperature from 20–15 °C during the unoccupied period of the summer season can be observed. As we can see in Figure 2, in summer weather the temperate remains constant from 0:00 until 7:00, but during the winter season a nearly constant 12 °C can be observed. This event is typical of the weather conditions that would help understand its effect over indoor ambiences.
4. Results
Using the previous methodology, and with a frequency of 10 min, about 80 samples/day during the unoccupied period over more than 1 week were needed to obtain a minimum training data of 300 samples per office and per season. For NN validation, when the percentage of error is reduced during the training process, it can be modified from the standard 60% of data for training and 40% for validation [29] to a more interesting 75% of data for training the network and 25% to validate it, by comparing the NN results with real sampled data and their derived indexes of thermal comfort and energy saving, obtained from this sampled data, inside each office building.
The stopping criteria was the minimum absolute number of errors obtained in most of the indoor vapor pressure predictions. In particular, the maximum absolute error allowed was fixed to 6 during the training period and 9 during the testing period, with a standard deviation of this error in both cases of 8%, which represented an nearly null percentage of incorrect predictions, providing a clear example of the power of NNs to model this process. Next, as an example of the accuracy obtained to define indoor air variables, such as partial vapor pressure (pv), the sampled and predicted values were compared during the validation process, as shown in Figure 4.
For the indoor partial vapor pressure prediction, more interesting thermodynamic variables and thermal comfort indexes were predicted. The moist air enthalpy, PDIAQ and ACCIAQ, was calculated for each season and for each internal covering during the unoccupied period from 19:00 to 09:00. Thus, partial vapor pressure, ACCIAQ, PDIAQ, and enthalphy were represented as the three most used materials for internal covering (paper, paint, and plastic) during the winter season in Figure 5, Figure 6, Figure 7 and Figure 8 and during the summer season in Figure 9, Figure 10, Figure 11 and Figure 12. Taking into account the permeability of these materials (Table 2) and the results obtained in previous works [1,2,3,4,5], based on a statistical study of indoor ambiences with these wall internal coverings, the following assumption is considered in the present study: Paper represents the permeable materials family, paint represents the semi-permeable materials family, and plastic represents the impermeable materials family.
5. Discussion
Each NN was trained based on the respective indoor sampled conditions of each office and its respective outdoor weather conditions, with an adequate margin of error. Each of the different trained networks had predicted indoor conditions as a function of the same outdoor weather (Figure 2 and Figure 3) with the aim to demonstrate the effect of internal coverings over indoor ambiences, as in the laboratory analysis.
Previous to this analysis, it is important to remember that, in previous works [1,2], statistical studies showed that internal covering materials used in several offices such as paper, paint, and plastic, showed a statistical behavior representative of the permeable, semi-permeable, and impermeable materials and, in consequence, the offices buildings with these materials were selected to model the behavior of internal covering materials.
In accordance with the previous works performed in the summer season, for this climatic region, a more interesting period helps to appreciate the more intense effect of internal coverings. In this sense, we can appreciate that, during the winter (Figure 5), permeable coverings tended to exert an opposite effect on the outdoor conditions. In particular, the humidity cumulated and released from permeable materials is expected to be found in the first 4 h (from 19:30 to 11:30) and, after this, only permeable internal coverings will reduce partial vapor pressure more slowly than impermeable internal coverings. Additionally, the opposite effect was appreciated during the last hours of occupation in this season.
This effect was more intense in the summer, as can be seen in Figure 9. As soon as the outdoor partial vapor pressure was reduced from an initial value of 19:12 to 0:00, the indoor partial vapor pressure in offices with permeable internal coverings released humidity and tended to increase its partial vapor pressure. Furthermore, the opposite effect to the increase in the outdoor partial vapor pressure can be appreciated during the last hours of the unoccupied period from 06:00 to 09.00.
We can also see that, during the winter and summer seasons, the indoor ambiences of office buildings with impermeable internal coverings showed a tendency very similar to that of the outdoor ambiences. Finally, the office with semi-permeable materials tended to maintain a nearly constant partial vapor pressure during the night in both the seasons (cf. Figure 5 and Figure 9).
As a consequence of this effect of the internal covering over indoor ambiences, we can appreciate clear consequences to thermal comfort and energy saving. For instance, as seen in Figure 6, the acceptability index (ACCIAQ) during the winter showed a nearly constant value of 0.5, while the impermeable coverings showed a great variability of this index over time. This variability is a clear example of the effect of temperature and relative humidity over indoor partial vapor pressure in office buildings with impermeable coverings.
As seen in Figure 10, this same index revealed higher acceptability during the summer season as a consequence of lower indoor partial vapor pressure during the first and last hours of the unoccupied period. Consequently, a better acceptability of indoor ambiences was expected when these materials (permeable coatings) were used.
The same effect was identified via the expected number of people that were unsatisfied with the perception of indoor air quality, by means of the PDIAQ index (Figure 7 and Figure 11). As expected, the percentage of dissatisfied persons during the winter season tended to be reduced to an extremely low value, which was similar for all the offices. Despite this, the effect of internal coverings was more intense in summer and, as a direct effect of indoor partial vapor pressure, the percentage of dissatisfied persons tended to be nearly 10% during the last hours of inoccupation and the first hours of occupation. Moreover, from these results, it is possible to confirm that, in general, a better indoor ambience is reached (Figure 11). Furthermore, this value of 10% of unsatisfied persons can be reduced when compared with 40% of unsatisfied persons with impermeable coverings.
Finally, since the energy needed by a heating, ventilation, and air-conditioning (HVAC) system to reach an adequate indoor ambience is directly related to moist air enthalpy, we could deduce the energy consumption tendency as a function of this thermodynamic variable (represented in Figure 7 and Figure 12). Figure 7 shows a higher enthalpy value during nearly all of the unoccupied periods in office buildings with permeable internal coverings. Consequently, a lower energy consumption of 20% in the HVAC systems was needed to reach more comfortable conditions during the summer season in the first hours of occupation. At the same time, it is interesting to highlight that, during a reduced percentage of time, offices with impermeable internal coverings showed a peak of indoor partial vapor pressure and, as a consequence, a peak of enthalpy and percentage of dissatisfied persons.
Despite these results, these effects are reduced when compared with the values obtained during the summer season. As can be seen in Figure 12 there is a difference in the indoor enthalpy of 10 kJ/kg and the enthalpy of indoor air in offices with impermeable respect permeable internal coverings during the last hours of inoccupation and during the first hours of occupation. This effect implies reduced energy consumption to reach a cool ambience during the summer season, which is really important since such a reduced consumption is becoming one of the key objectives in the majority of today’s research related to sustainability [30].
Based on these results, we can deduce that it is possible to model indoor ambiences based on the outdoor conditions by means of NN procedures. At the same time, we can confirm the validity of these predictions owing to its agreement with the results obtained in previous research [1,2] based on the statistical analysis of real sampled data. In this sense, NN predictions let us confirm the effect of permeable internal coverings, such as paper or wood, to control the indoor ambiences toward better local thermal comfort and energy saving, which acted as a mechanical control system. In particular, internal coverings materials behavior depended on the extreme outdoor conditions to which the office was exposed. For instance, the climatic region of this study showed a high relative humidity but no extreme temperature changes. This is the reason why, during the winter season, this effect was reduced and clearly more intense in the summer season.
Finally, this passive method needs to be redesigned and adjusted to the amount of surface and permeability level of covering employed in each case in order to obtain the best possible indoor ambience behavior. Thus, this methodology can be employed for almost all kinds of buildings and weather conditions [31,32]. Furthermore, this methodology would be of interest because climate variations will induce different indoor ambiences in each type of building and, therefore, this and others passive methods must be adjusted for each particular region [33,34,35,36]. Other kinds of artificial PCMs [37] are employed as building construction materials rather than the typical permeable internal covering materials, because these PCMs are well modelled in laboratories [37]. However, only limited information is available about the behavior of PCMs in real buildings, which is why this new generation procedure seems promising toward understanding their effect and improving their future design.
6. Conclusions
The present paper shows new and interesting results about a new methodology for internal covering designs to improve these materials effect over indoor ambiences. In this sense, based on the results obtained from previous works, the effect of permeable, semi-permeable, and impermeable internal coverings was analyzed after placing them in the actual final building construction position. The main data was employed to obtain different neural networks that, once trained, were employed to predict the indoor ambience based on input data with the same weather conditions.
This result had a direct implication on the indoor thermal comfort and energy consumption, proposing permeable coverings as the better way to reduce energy peak demands in the first hours of occupation and a better thermal comfort condition, which acted as a mechanical control system. In particular, a reduction of 20% in the expected energy consumption of the HVAC system and a reduction from 40% to 10% of unsatisfied persons was obtained during the summer season when the permeable coverings were employed.
Finally, from these interesting results, we can conclude that, once the effect of internal coverings over thermal comfort and energy consumption has been demonstrated, it is possible to design internal coverings and, consequently, to define the exact amount of internal covering surface and permeability level needed, to reach an adequate behavior for a specific indoor ambience as the main constant to adjust this mechanical control system.
Author Contributions
Conceptualization, J.A.O.; methodology, J.A.O., Á.M.C., and R.B.; software, J.A.O.; validation, D.V., Á.M.C., and R.B.; formal analysis, J.A.O., D.V., Á.M.C., and R.B.; data curation, J.A.O. and D.V.; writing—original draft preparation, J.A.O.; writing—review and editing, J.A.O. and D.V.
Funding
This research was funded by CYPE Ingenieros S.A. in their research project to reduce energy consumption in buildings and its certification, in collaboration with the University of A Coruña (Spain) and the University of Porto (Portugal). (Grant No. 64900).
Acknowledgments
The authors wish to express their deepest gratitude to the Sustainability Specialization Campus of the University of A Coruña for the administrative and technical support.
Conflicts of Interest
The authors declare no conflict of interest.
References
- Orosa, J.A.; Baaliña, A. Passive climate control in Spanish office buildings for long periods of time. Build. Environ. 2008, 43, 2005–2012. [Google Scholar] [CrossRef]
- Orosa, J.A.; Baaliña, A. Improving PAQ and comfort conditions in Spanish office buildings with passive climate control. Build. Environ. 2009, 44, 502–508. [Google Scholar] [CrossRef]
- Orosa, J.A.; Oliveira, A.C. Energy saving with passive climate control methods in Spanish office buildings. Energy Build. 2009, 41, 823–828. [Google Scholar] [CrossRef]
- Orosa, J.A.; Oliveira, A.C. Reducing energy peak consumption with passive climate control methods. Energy Build. 2011, 43, 2282–2288. [Google Scholar] [CrossRef]
- Orosa, J.A.; Oliveira, A.C.; Ramos, N.M.M. Experimental quantification of the operative time of a passive hvae system using porous covering materials. J. Porous Media 2010, 13, 637–643. [Google Scholar] [CrossRef]
- Hens, H. Indoor Climate in Student Rooms: Measured Values. IEA-EXCO Energy Conservation in Buildings and Community Systems Annex 41 “Moist-Eng” Glasgow Meeting. 2004. Available online: https://www.kuleuven.be/bwf/projects/annex41/protected/data/KUL%20Oct%202004%20Paper%20A41-T3-B-04-6.pdf (accessed on 24 February 2019).
- Padfield, T. The Role of Absorbent Building Materials in Moderating Changes of Relative Humidity. Ph.D. Thesis, Department of Structural Engineering and Materials, The Technical University of Denmark, Kongens Lyngby, Denmark, October 1998. [Google Scholar]
- Hameury, S.; Lundstrom, T. Contribution of indoor exposed massive wood to a good indoor climate: In situ measurement campaign. Energy Build. 2004, 36, 281–292. [Google Scholar] [CrossRef]
- Nicolajsen, A. Thermal transmittance of a cellulose loose-fill insulation material. Build. Environ. 2005, 40, 907–914. [Google Scholar] [CrossRef]
- Plathner, P.; Littler, J.; Stephen, R. Dynamic water vapour sorption: Measurement and modelling. In Proceedings of the Indoor Air Quality 99, Edinburgh, Scotland, 9–13 August 1999. [Google Scholar]
- Talukdar, P.; Osanyintola, O.F.; Olutimayin, S.O.; Simonson, C.J. An experimental data set for benchmarking 1-D, transient heat and moisture transfer models of hygroscopic building materials. Part II: Experimental, numerical and analytical data. Int. J. Heat Mass Transf. 2007, 50, 4915–4926. [Google Scholar] [CrossRef]
- Osanyintola, O.F.; Simonson, C.J. Moisture buffering capacity of hygroscopic building materials: Experimental facilities and energy impact. Energy Build. 2006, 38, 1270–1282. [Google Scholar] [CrossRef]
- Simonson, C.J.; Tuomo, O. Moisture performance of buildings envelopes with no plastic vapour retarders in cold climates. In Proceedings of the Healthy Buildings 2000, Espoo, Finland, 6–10 August 2000; SIY Indoor Air Information Oy: Helsinki, Finland, 2000; Volume 3. [Google Scholar]
- Johra, H.; Heiselberg, P. Influence of internal thermal mass on the indoor thermal dynamics and integration of phase change materials in furniture for building energy storage: A review. Renew. Sustain. Energy Rev. 2017, 69, 19–32. [Google Scholar] [CrossRef]
- Talukdar, U.P.; Das, A.; Alagirusamy, R. Effect of structural parameters on thermal protective performance and comfort characteristic of fabrics. J. Text. Inst. 2016, 108, 1430–1441. [Google Scholar] [CrossRef]
- Wahid, M.A.; Hosseini, S.E.; Hussen, H.M.; Akeiber, H.J.; Saud, S.N.; Mohammad, A.T. An overview of phase change materials for construction architecture thermal management in hot and dry climate region. Appl. Therm. Eng. 2017, 112, 1240–1259. [Google Scholar] [CrossRef]
- Fedorczak-Cisak, M.; Furtak, M.; Gintowt, J.; Kowalska-Koczwara, A.; Pachla, F.; Stypuła, K.; Tatara, T. Thermal and vibration comfort analysis of a nearly zero-energy building in Poland. Sustainability 2018, 10, 3774. [Google Scholar] [CrossRef]
- Álvarez, J.D.; Costa-Castelló, R.; Castilla, M.D.M. Repetitive control to improve users’ thermal comfort and energy efficiency in buildings. Energies 2018, 11, 976. [Google Scholar] [CrossRef]
- Weng, K.; Meng, F.; Mourshed, M. Model-based optimal control of window openings for thermal comfort. Proceedings 2018, 2, 1134. [Google Scholar] [CrossRef]
- SIAM. Environmental Information System of Galicia. 2016. Available online: http://archivo.cesga.es/component/option,com_proyectos/task,view/Itemid,0/catid,46/id,45/lang,en/ (accessed on 24 February 2019).
- Gemini Data Loggers. 2016. Available online: http://www.geminidataloggers.com (accessed on 24 February 2019).
- Toftum, J.; Jorgensen, A.S.; Fanger, P.O. Upper limits for indoor air humidity to avoid uncomfortably humid skin. Energy Build. 1998, 28, 1–13. [Google Scholar] [CrossRef]
- Toftum, J.; Jorgensen, A.S.; Fanger, P.O. Upper limits of air humidity for preventing warm respiratory discomfort. Energy Build. 1998, 28, 15–23. [Google Scholar] [CrossRef]
- Simonson, C.J.; Salonvaara, M.; Ojanen, T. The effect of structures on indoor humidity-possibility to improve comfort and perceived air quality. Indoor Air 2002, 12, 243–251. [Google Scholar] [CrossRef]
- Fang, L.; Clausen, G.; Fanger, P.O. Impact of temperature and humidity on perception of indoor air quality during immediate and longer whole-body exposures. Indoor Air 1998, 8, 276–284. [Google Scholar] [CrossRef]
- Matlab Mathworks. Available online: https://es.mathworks.com (accessed on 24 February 2019).
- Specht, D.F. A general regression neural network. IEEE Trans. Neural Netw. 1991, 2, 568–576. [Google Scholar] [CrossRef] [PubMed]
- Kartal, S.; Oral, M.; Ozyildirim, B.M. Pattern layer reduction for a generalized regression neural network by using a self–organizing map. Int. J. Appl. Math. Comput. Sci. 2018, 28, 411–424. [Google Scholar] [CrossRef]
- MathWorks. Divide Data for Optimal Neural Network Training. 2019. Available online: https://www.mathworks.com/help/deeplearning/ug/divide-data-for-optimal-neural-network-training.html;jsessionid=33c5d9e13c9aa6f19e618b26f0d8 (accessed on 26 April 2019).
- Costa, A.M.; Bouzón, R.; Vergara, D.; Orosa, J.A. Eco-friendly pressure drop dehumidifier: An experimental and numerical analysis. Sustainability 2019, 11, 2170. [Google Scholar] [CrossRef]
- Csoknyai, T.; Hrabovszky-Horváth, S.; Georgiev, Z.; Jovanovic-Popovic, M.; Stankovic, B.; Villatoro, O.; Szendrő, G. Building stock characteristics and energy performance of residential buildings in Eastern-European countries. Energy Build. 2016, 132, 39–52. [Google Scholar] [CrossRef]
- Vasco, D.A.; Muñoz-Mejías, M.; Pino-Sepúlveda, R.; Ortega-Aguilera, R.; García-Herrera, C. Thermal simulation of a social dwelling in Chile: Effect of the thermal zone and the temperature-dependant thermophysical properties of light envelope materials. Appl. Thermal Eng. 2017, 112, 771–783. [Google Scholar] [CrossRef]
- Glass, S.V.; Kochkin, V.; Drumheller, S.C.; Barta, L. Moisture performance of energy-efficient and conventional wood-frame wall assemblies in a mixed-humid climate. Buildings 2015, 5, 759–782. [Google Scholar] [CrossRef]
- Bhikhoo, N.; Hashemi, A.; Cruickshank, H. Improving thermal comfort of low-income housing in thailand through passive design strategies. Sustainability 2017, 9, 1440. [Google Scholar] [CrossRef]
- Boostani, H.; Hancer, P. A model for external walls selection in hot and humid climates. Sustainability 2019, 11, 100. [Google Scholar] [CrossRef]
- Orosa, J.A.; Vergara, D.; Costa, Á.M.; Bouzón, R. A novel method for nZEB internal coverings design based on neural networks. Coatings 2019, 9, 288. [Google Scholar] [CrossRef]
- Medved, I.; Trník, A.; Vozár, L. Modeling of heat capacity peaks and enthalpy jumps of phase-change materials used for thermal energy storage. Int. J. Heat Mass Transf. 2017, 107, 123–132. [Google Scholar] [CrossRef]
Figure 1.
Typology of a generalized regression neural network (GRNN).

Figure 2.
Outdoor temperature during the unoccupied period employed in the prediction process (data collected from different weather stations in Galicia, Spain).
Figure 2.
Outdoor temperature during the unoccupied period employed in the prediction process (data collected from different weather stations in Galicia, Spain).

Figure 3.
Outdoor relative humidity during the unoccupied period employed in the prediction process (data collected from different weather stations in Galicia, Spain).
Figure 3.
Outdoor relative humidity during the unoccupied period employed in the prediction process (data collected from different weather stations in Galicia, Spain).

Figure 4.
Example of sampled and predicted partial vapor pressure in the winter season.

Figure 5.
Indoor partial vapor pressure predicted for each internal covering during the winter season.
Figure 5.
Indoor partial vapor pressure predicted for each internal covering during the winter season.

Figure 6.
Indoor air acceptability (ACCIAQ) predicted for each internal covering during the winter season.
Figure 6.
Indoor air acceptability (ACCIAQ) predicted for each internal covering during the winter season.

Figure 7.
Indoor air percentage of dissatisfied persons (PDIAQ) predicted for each internal covering during the winter season.
Figure 7.
Indoor air percentage of dissatisfied persons (PDIAQ) predicted for each internal covering during the winter season.

Figure 8.
Indoor air enthalpy predicted for each internal covering during the winter season.

Figure 9.
Indoor air partial vapor pressure predicted for each internal covering during the summer season.
Figure 9.
Indoor air partial vapor pressure predicted for each internal covering during the summer season.

Figure 10.
Indoor air acceptability (ACCIAQ) predicted for each internal covering material during the summer season.
Figure 10.
Indoor air acceptability (ACCIAQ) predicted for each internal covering material during the summer season.

Figure 11.
Indoor air percentage of dissatisfied persons (PDIAQ) predicted for each internal covering during the summer season.
Figure 11.
Indoor air percentage of dissatisfied persons (PDIAQ) predicted for each internal covering during the summer season.

Figure 12.
Indoor air enthalpy predicted for each internal covering during the summer season.


Table 1.
Average percentage of incorrect predictions.
| GRNN | Error (%) |
|---|---|
| Winter permeable | 1.59 |
| Winter semi-permeable | 1.20 |
| Winter impermeable | 1.34 |
| Summer permeable | 1.47 |
| Summer semi-permeable | 1.21 |
| Summer impermeable | 1.68 |
© 2019 by the authors. Licensee MDPI, Basel, Switzerland. This article is an open access article distributed under the terms and conditions of the Creative Commons Attribution (CC BY) license (http://creativecommons.org/licenses/by/4.0/).
Share and Cite
MDPI and ACS Style
Orosa, J.A.; Vergara, D.; Costa, Á.M.; Bouzón, R. A Novel Method Based on Neural Networks for Designing Internal Coverings in Buildings: Energy Saving and Thermal Comfort. Appl. Sci. 2019, 9, 2140. https://doi.org/10.3390/app9102140
AMA Style
Orosa JA, Vergara D, Costa ÁM, Bouzón R. A Novel Method Based on Neural Networks for Designing Internal Coverings in Buildings: Energy Saving and Thermal Comfort. Applied Sciences. 2019; 9(10):2140. https://doi.org/10.3390/app9102140
Chicago/Turabian StyleOrosa, José A., Diego Vergara, Ángel M. Costa, and Rebeca Bouzón. 2019. "A Novel Method Based on Neural Networks for Designing Internal Coverings in Buildings: Energy Saving and Thermal Comfort" Applied Sciences 9, no. 10: 2140. https://doi.org/10.3390/app9102140
Note that from the first issue of 2016, this journal uses article numbers instead of page numbers. See further details here.