Enhanced Automatic Speech Recognition System Based on Enhancing Power-Normalized Cepstral Coefficients


1
Electronics and Communications Engineering Department, Arab Academy for Science, Technology and Maritime Transport (AASTMT), Alexandria, Egypt
2
Electrical and Computer Engineering, Royal Military College of Canada, Kingston, ON K7K 7B4, Canada
*
Author to whom correspondence should be addressed.
Appl. Sci. 2019, 9(10), 2166; https://doi.org/10.3390/app9102166
Submission received: 24 April 2019
/
Revised: 22 May 2019
/
Accepted: 24 May 2019
/
Published: 27 May 2019
(This article belongs to the Section Electrical, Electronics and Communications Engineering)
Abstract
:Many new consumer applications are based on the use of automatic speech recognition (ASR) systems, such as voice command interfaces, speech-to-text applications, and data entry processes. Although ASR systems have remarkably improved in recent decades, the speech recognition system performance still significantly degrades in the presence of noisy environments. Developing a robust ASR system that can work in real-world noise and other acoustic distorting conditions is an attractive research topic. Many advanced algorithms have been developed in the literature to deal with this problem; most of these algorithms are based on modeling the behavior of the human auditory system with perceived noisy speech. In this research, the power-normalized cepstral coefficient (PNCC) system is modified to increase robustness against the different types of environmental noises, where a new technique based on gammatone channel filtering combined with channel bias minimization is used to suppress the noise effects. The TIDIGITS database is utilized to evaluate the performance of the proposed system in comparison to the state-of-the-art techniques in the presence of additive white Gaussian noise (AWGN) and seven different types of environmental noises. In this research, one word is recognized from a set containing 11 possibilities only. The experimental results showed that the proposed method provides significant improvements in the recognition accuracy at low signal to noise ratios (SNR). In the case of subway noise at SNR = 5 dB, the proposed method outperforms the mel-frequency cepstral coefficient (MFCC) and relative spectral (RASTA)–perceptual linear predictive (PLP) methods by 55% and 47%, respectively. Moreover, the recognition rate of the proposed method is higher than the gammatone frequency cepstral coefficient (GFCC) and PNCC methods in the case of car noise. It is enhanced by 40% in comparison to the GFCC method at SNR 0dB, while it is improved by 20% in comparison to the PNCC method at SNR −5dB.
1. Introduction
Despite advanced signal processing techniques used nowadays, the existing automatic speech recognition (ASR) system still cannot meet the performance of the human auditory system. This motivated many researchers to develop several robust feature extraction techniques. These techniques are based on modeling the physiological attitude of human audition to recognize speech in the presence of environmental noise and background interference.
In the literature, there are numerous approaches have been proposed to address these problems. They are mainly categorized into two significant approaches [1]. These approaches are the feature–space approach and the model–space approach. The feature–space approach depends on modifying the auditory features that suppress noises. It applies different adaptation techniques to the test features in order to match the training features. However, in the model–space approach, the acoustic model parameters are adjusted to decrease the noise effects. Although the model–space approach achieves higher accuracy in comparison to the feature–space approach, it still requires a higher computational time. In both the feature–space approach and model–space approach, the hidden Markov model (HMM) [2,3] is mostly used as a statistical machine learning technique.
In the literature, there are numerous feature extraction techniques, which have recently been applied in ASR systems. For instance, mel-frequency cepstral coefficient (MFCC) [4] and the perceptual linear predictive (PLP) [5] technique are considered the most widely used techniques in speech recognition and speaker identification systems.
In the PLP technique, relative spectral (RASTA) [6,7] filtering is combined with this feature extraction method to remove channel noises that vary slowly compared to speech waveforms. Cepstral mean and variance normalization (CMVN) [8] is another feature extraction technique that can be used to remove channel instability. There are many other advanced noise robust feature extraction techniques, such as gammatone frequency cepstral coefficient (GFCC) [9], zero crossing peak amplitude (ZCPA) [10], average localized synchrony detection (ALSD) [11], perceptual minimum variance distortionless response (PMVDR) [12], sparse auditory reproducing kernel (SPARK) [13] and Gabor filter bank features [14], and power-normalized cepstral coefficient (PNCC) [15].
In the literature, the PNCC system has several advantages [15,16]. The PNCC system reported in [15] demonstrates effective robustness against different sources of environmental disturbances such as background additive noise, linear channel distortion, and reverberation in comparison to MFCC and PLP methods. In this paper, the PNCC feature extraction method [15,17] was modified to obtain acoustic features that can work against the noise at low SNRs without affecting the system performance. This paper is organized as follows: Section 2 discusses the proposed system in detail; Section 3 shows the experimental work and results; and Section 4 summarizes the outcomes of the paper and future works.
2. Proposed Enhanced PNCC Algorithm
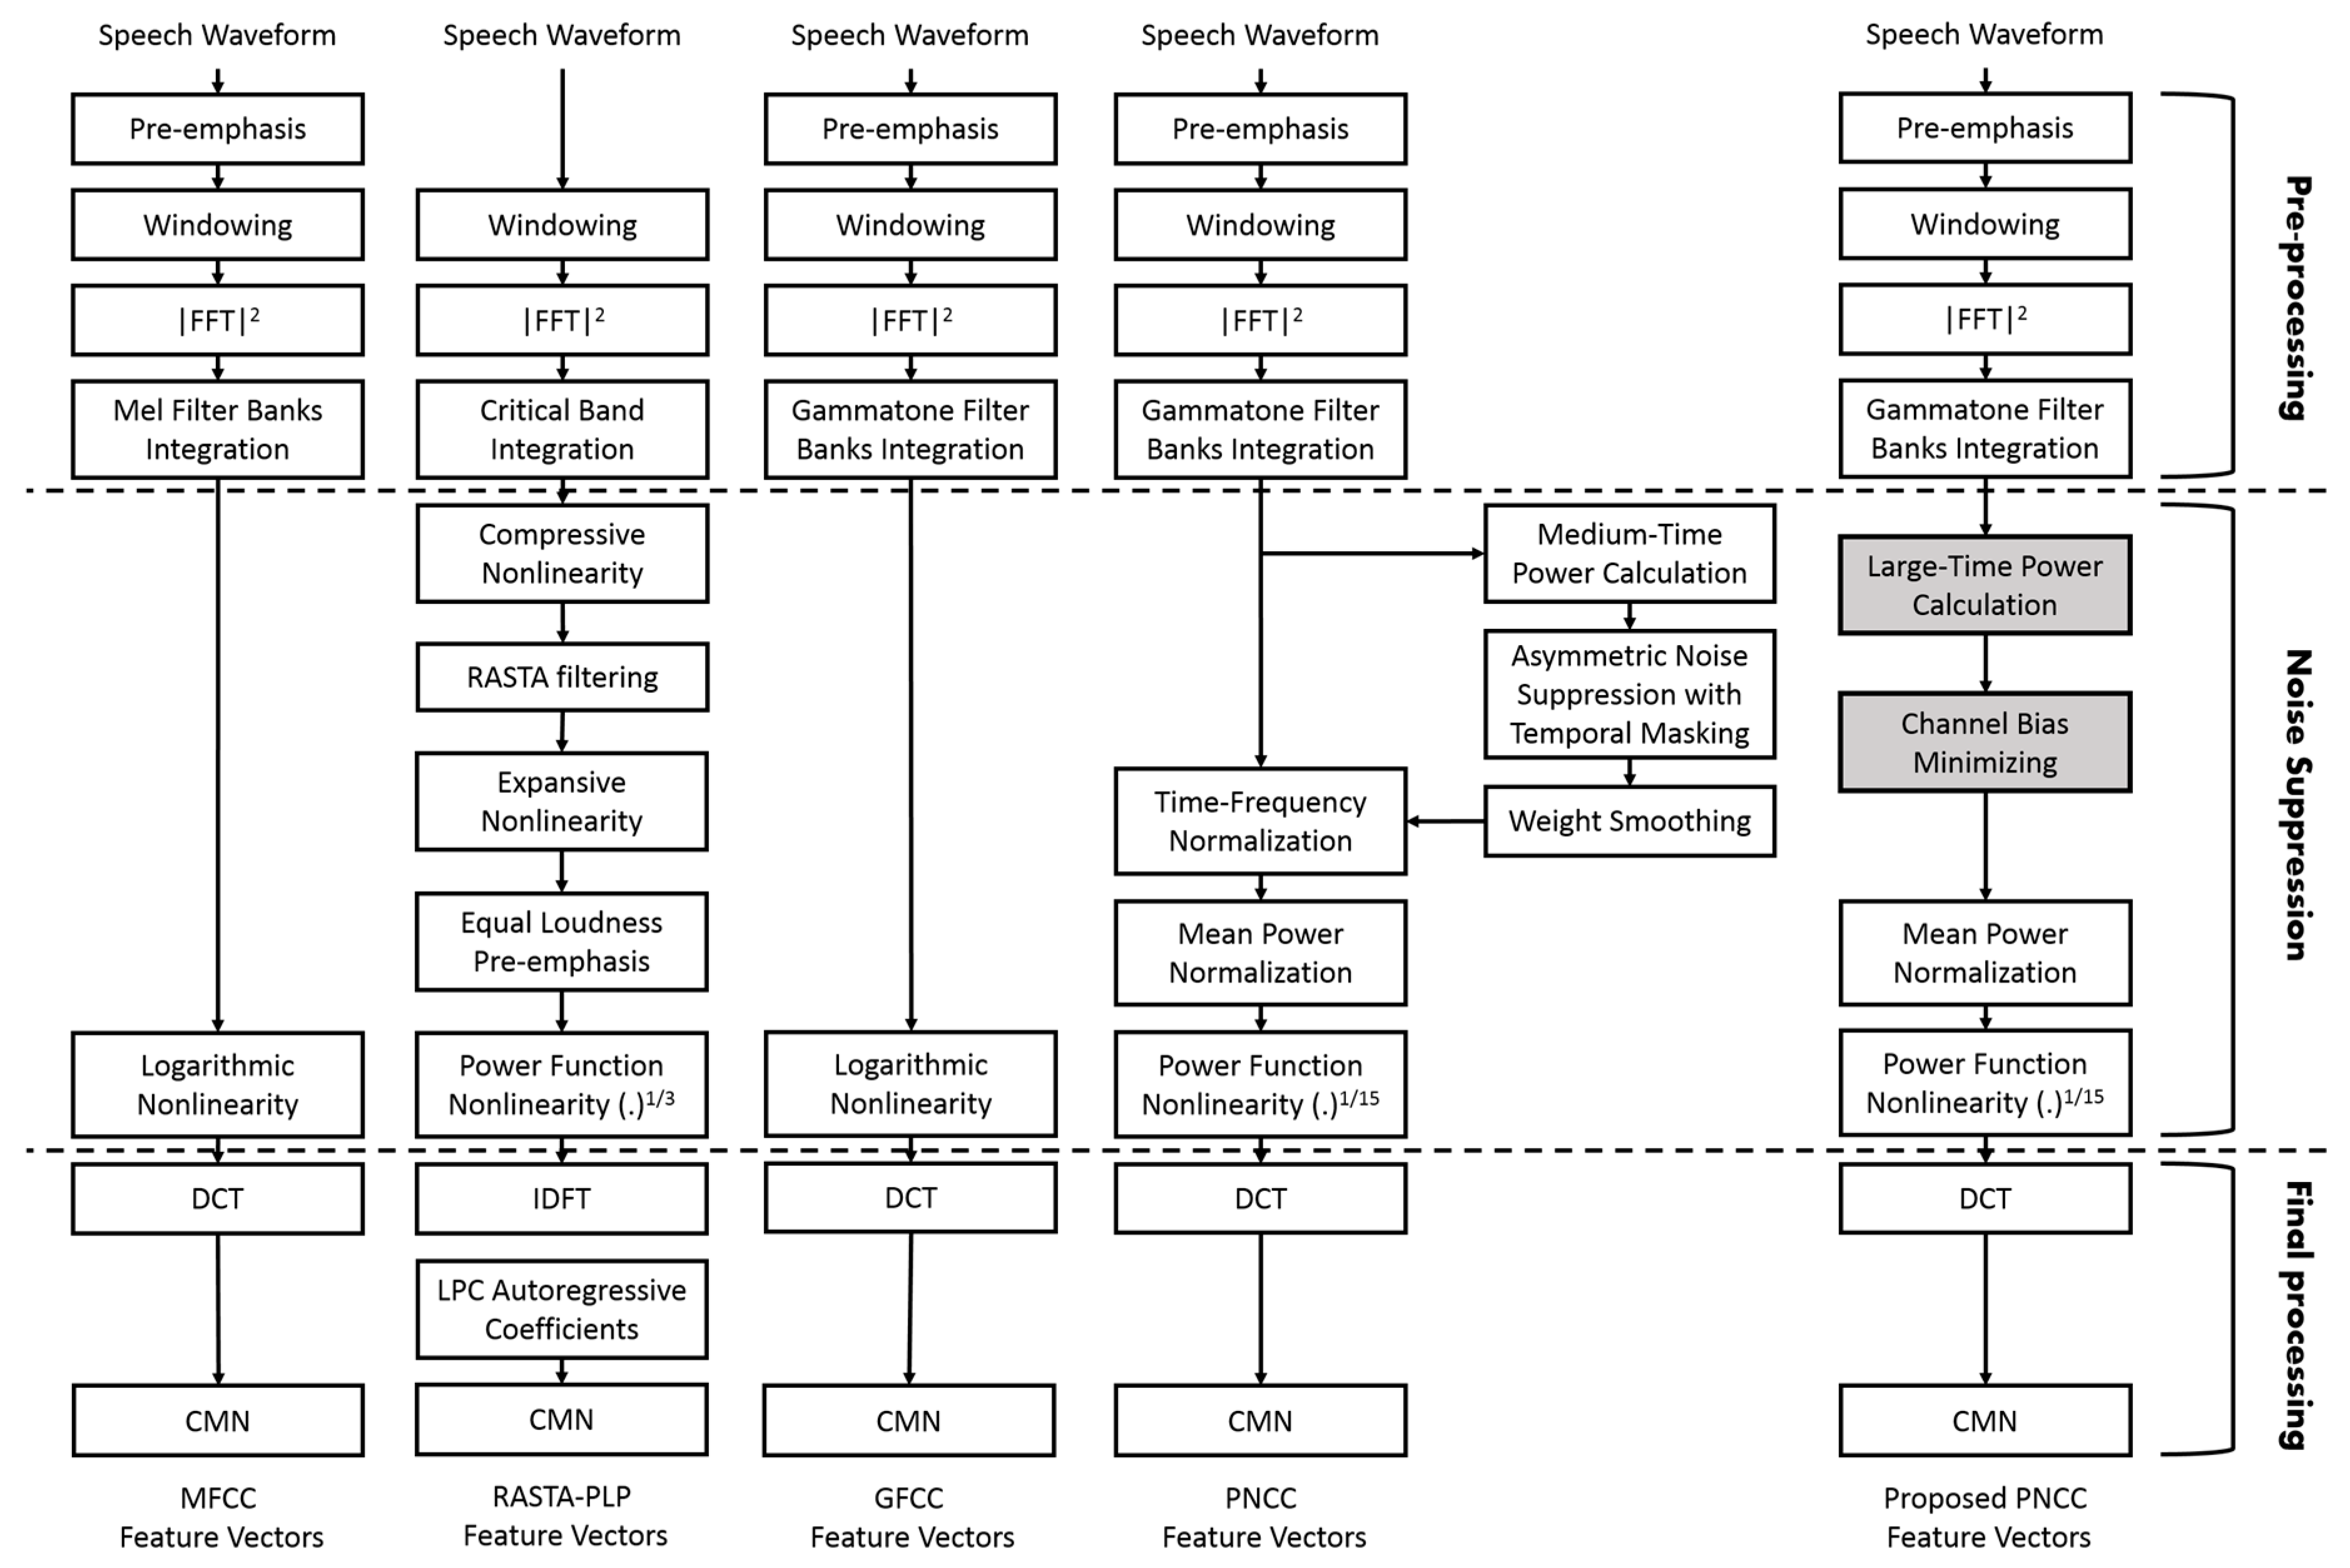
In this section, the modifications that were applied to the PNCC system will be explicated in detail. Figure 1 illustrates a comparison between the block diagram structures of the proposed PNCC method and state-of-the-art methods such as PNCC, GFCC, RASTA–PLP, and MFCC [15]. As shown in Figure 1, the block diagrams are divided into three stages. These stages are pre-processing, noise suppression, and final processing.
2.1. Proposed Enhanced PNCC Algorithm
Preprocessing is the first stage in the block diagram. In this stage, a high pass pre-emphasis Finite Impulse Response (FIR) filter is applied at the input speech waveform in all methods except RASTA–PLP. Then, the pre-emphasized waveform is divided into short overlapped frames with 25.6 ms frame duration and with 10 ms overlap between frames. Each frame is multiplied by the Hamming window. In the next stage, the fast Fourier transform (FFT) is applied with 256-bit resolution. The power spectral density (PSD) is obtained by computing the magnitude-square of the output frequencies as .
The gammatone filter banks provide more robust features rather than Mel-filter banks and bark filters for the MFCC and RASTA–PLP methods, respectively. Therefore, a set of 25 gammatone filters [18,19] were generated from the frequency response of the gammatone kernel basis functions from Equation (1) with center frequencies ranging from 100 Hz to 4 kHz, as shown in Figure 2.
where is the amplitude, is the discrete-time index, is the filter’s order, is the filter’s bandwidth, is the center frequency, and is the phase of the carrier.
In order to decrease the computational time, the gammatone filter response is set to be zero if the filter bank is less than 0.5 percent of its maximum value. The magnitude of each gammatone filter is then multiplied by the PSD of each frame, and the summation is calculated according to the following equation:
where is the frame index, is the gammatone filter index, is spectrum resolution, and is the function of each filter bank in the frequency domain.
2.2. Noise Suppression
Most noise suppression techniques that are used in speech recognition systems are based on using different filtering techniques on several frequency frames. Increasing the number of analysis frames provides high performance for modeling and eliminating noise effects [6,20,21,22]. Many algorithms are based on high-pass or band filtering techniques along with frames such as the RASTA–PLP feature extraction technique. RASTA filtering is used in this technique. This filter is a band-pass filter designed to remove the slowly varying background noise along with frames [6]. The mathematical expression of PSD should be a positive value. One of the drawbacks of using high-pass filtering is that it can obtain a negative value [6]. For the noise suppression technique in the standard PNCC system, firstly the medium-time power is applied by calculating the running average of five following frequency channels. It is considered low-pass filtering along with frames. Secondly, another filtering technique is applied using asymmetric noise suppression filtering, which is combined with temporal masking. This technique is used to remove the impact of slowly-varying background noise and define excitation and non-excitation states. The excitation state represents the filtered speech activity state, while the non-excitation states represent the non-voice activity, which is determined from the estimated floor-level. Then, weight smoothing is applied by calculating the running average across channels. Finally, the original time–frequency domain is modulated by the constructed transfer function. Nevertheless, in the proposed PNCC method, the large-time power is used instead of medium-time power and then channel bias minimizing is applied as explicated in the following section.
2.2.1. Large-Time Power Calculation
In the proposed method, the large-time power filter is used as an average low-pass average filter, similar to the medium-time power filter, but it is applied on a higher number of frames. This filter is applied by computing the running average power for consecutive frames as in the following equation:
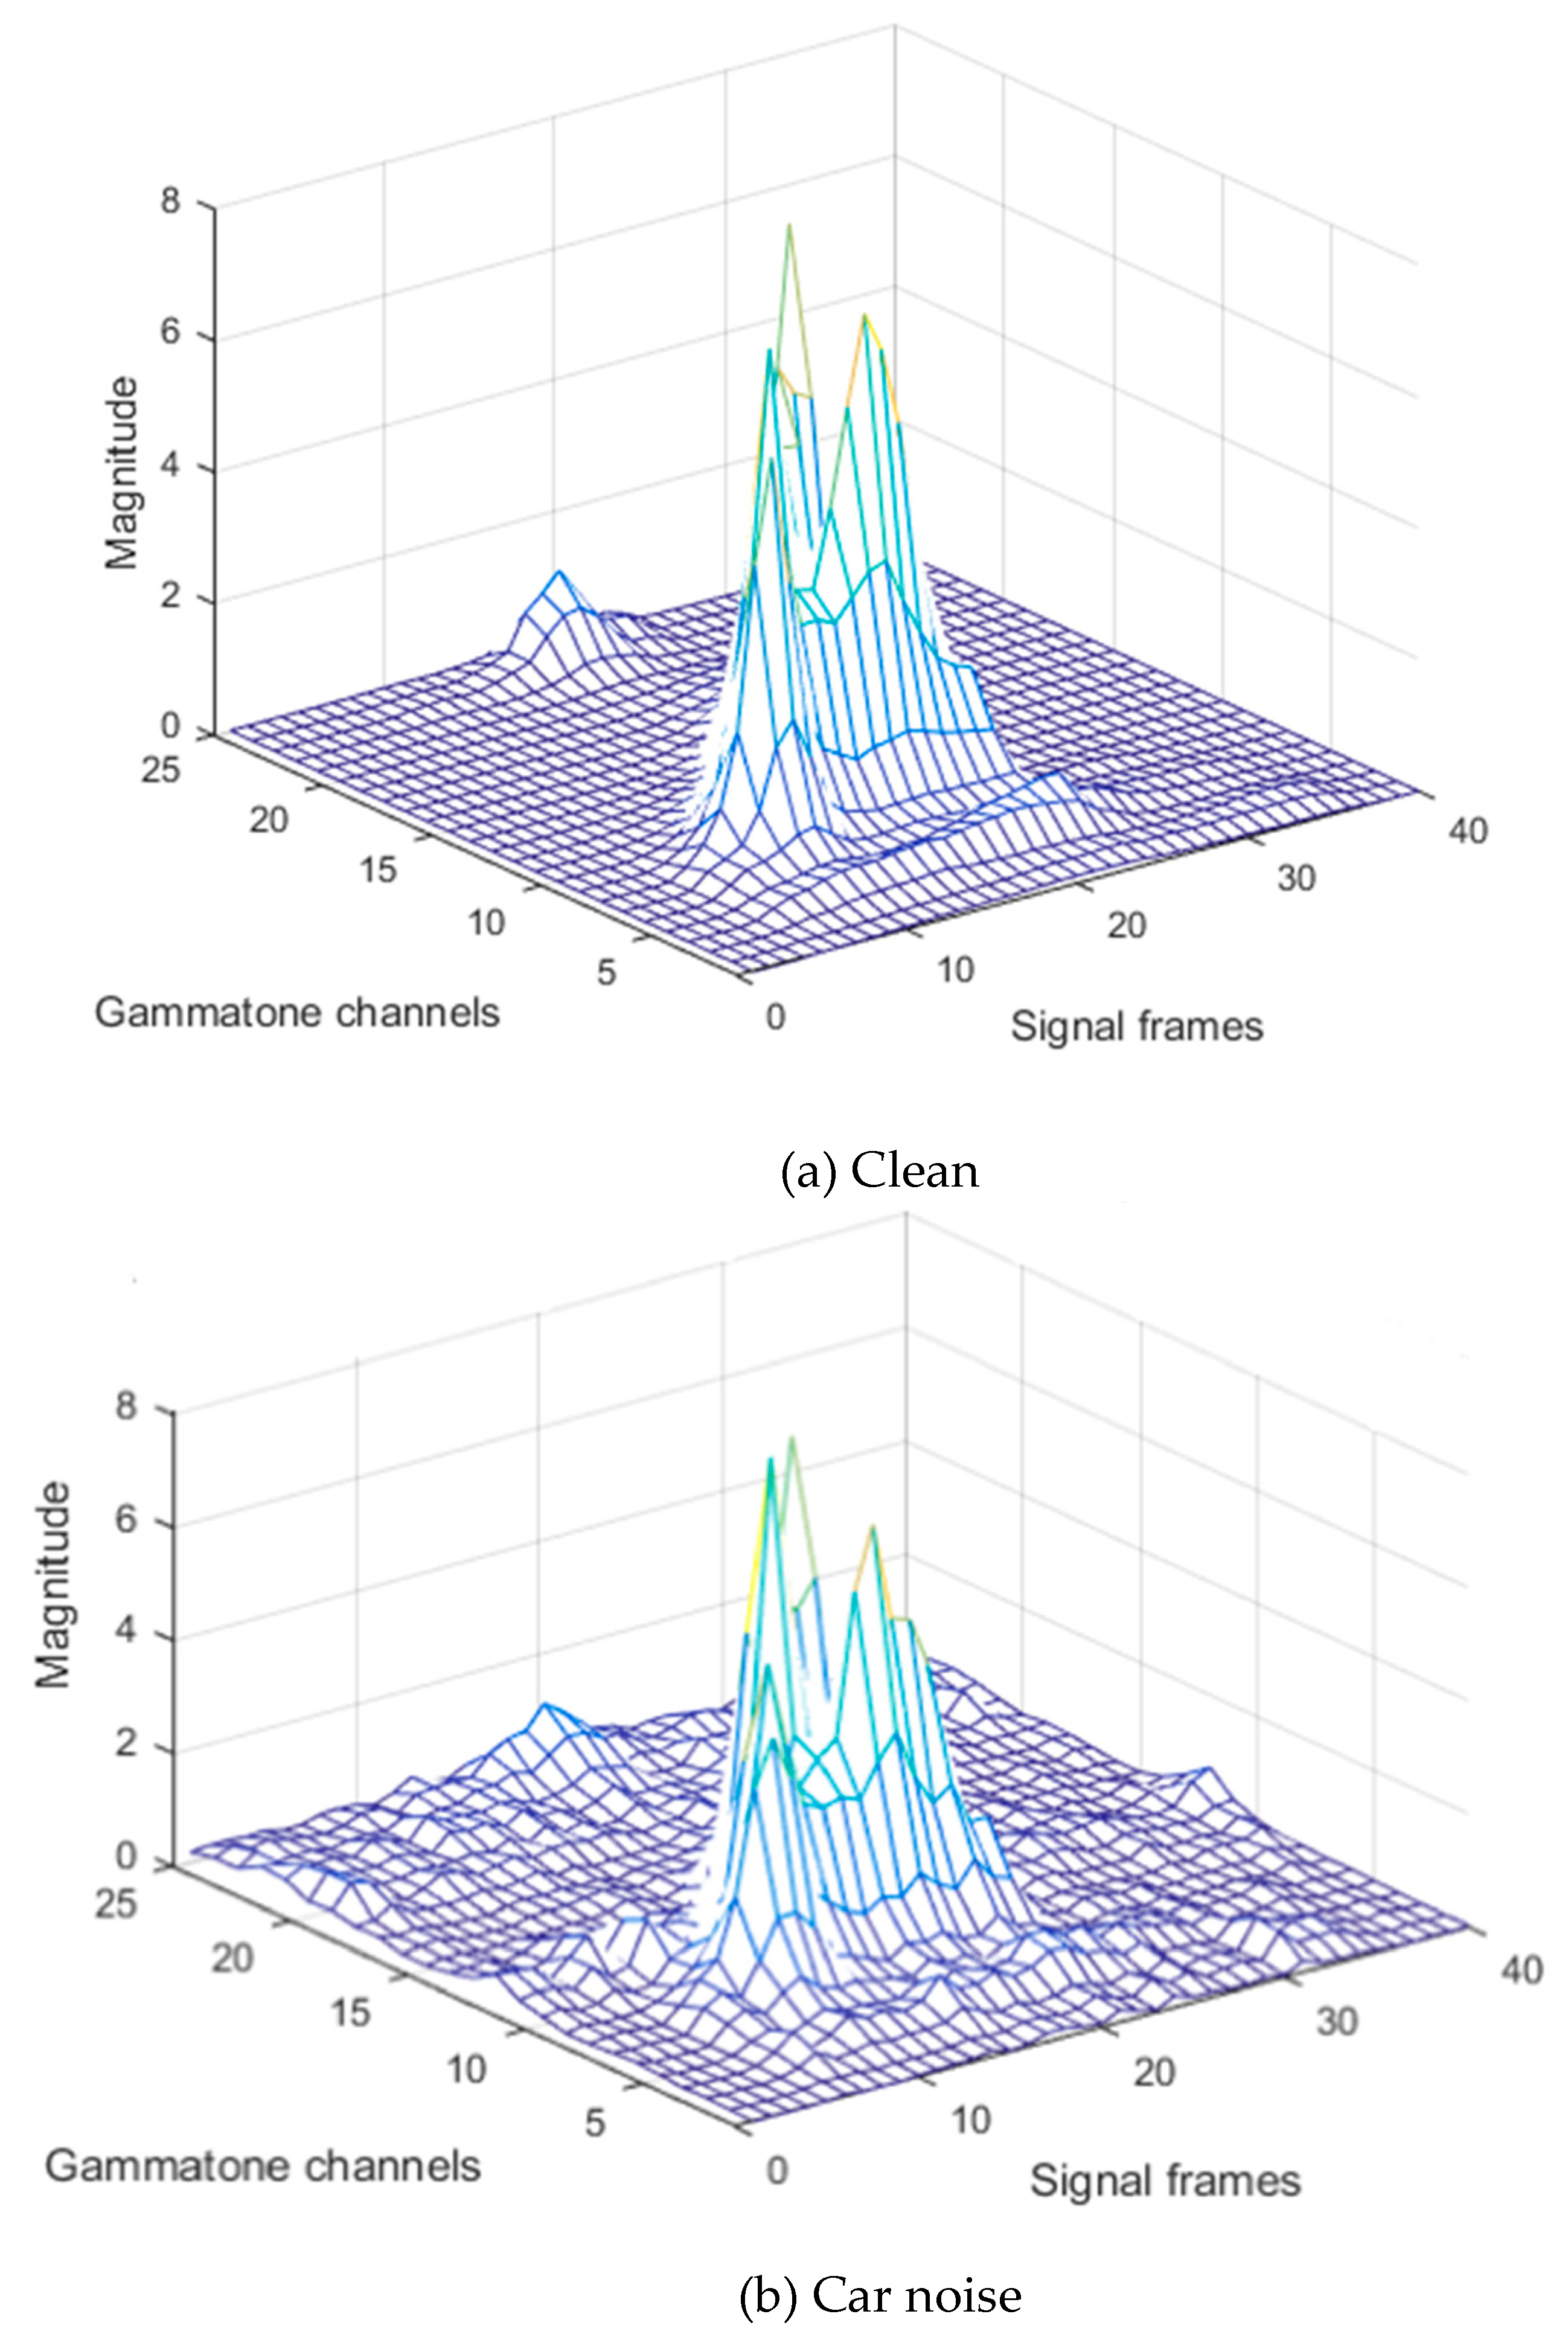
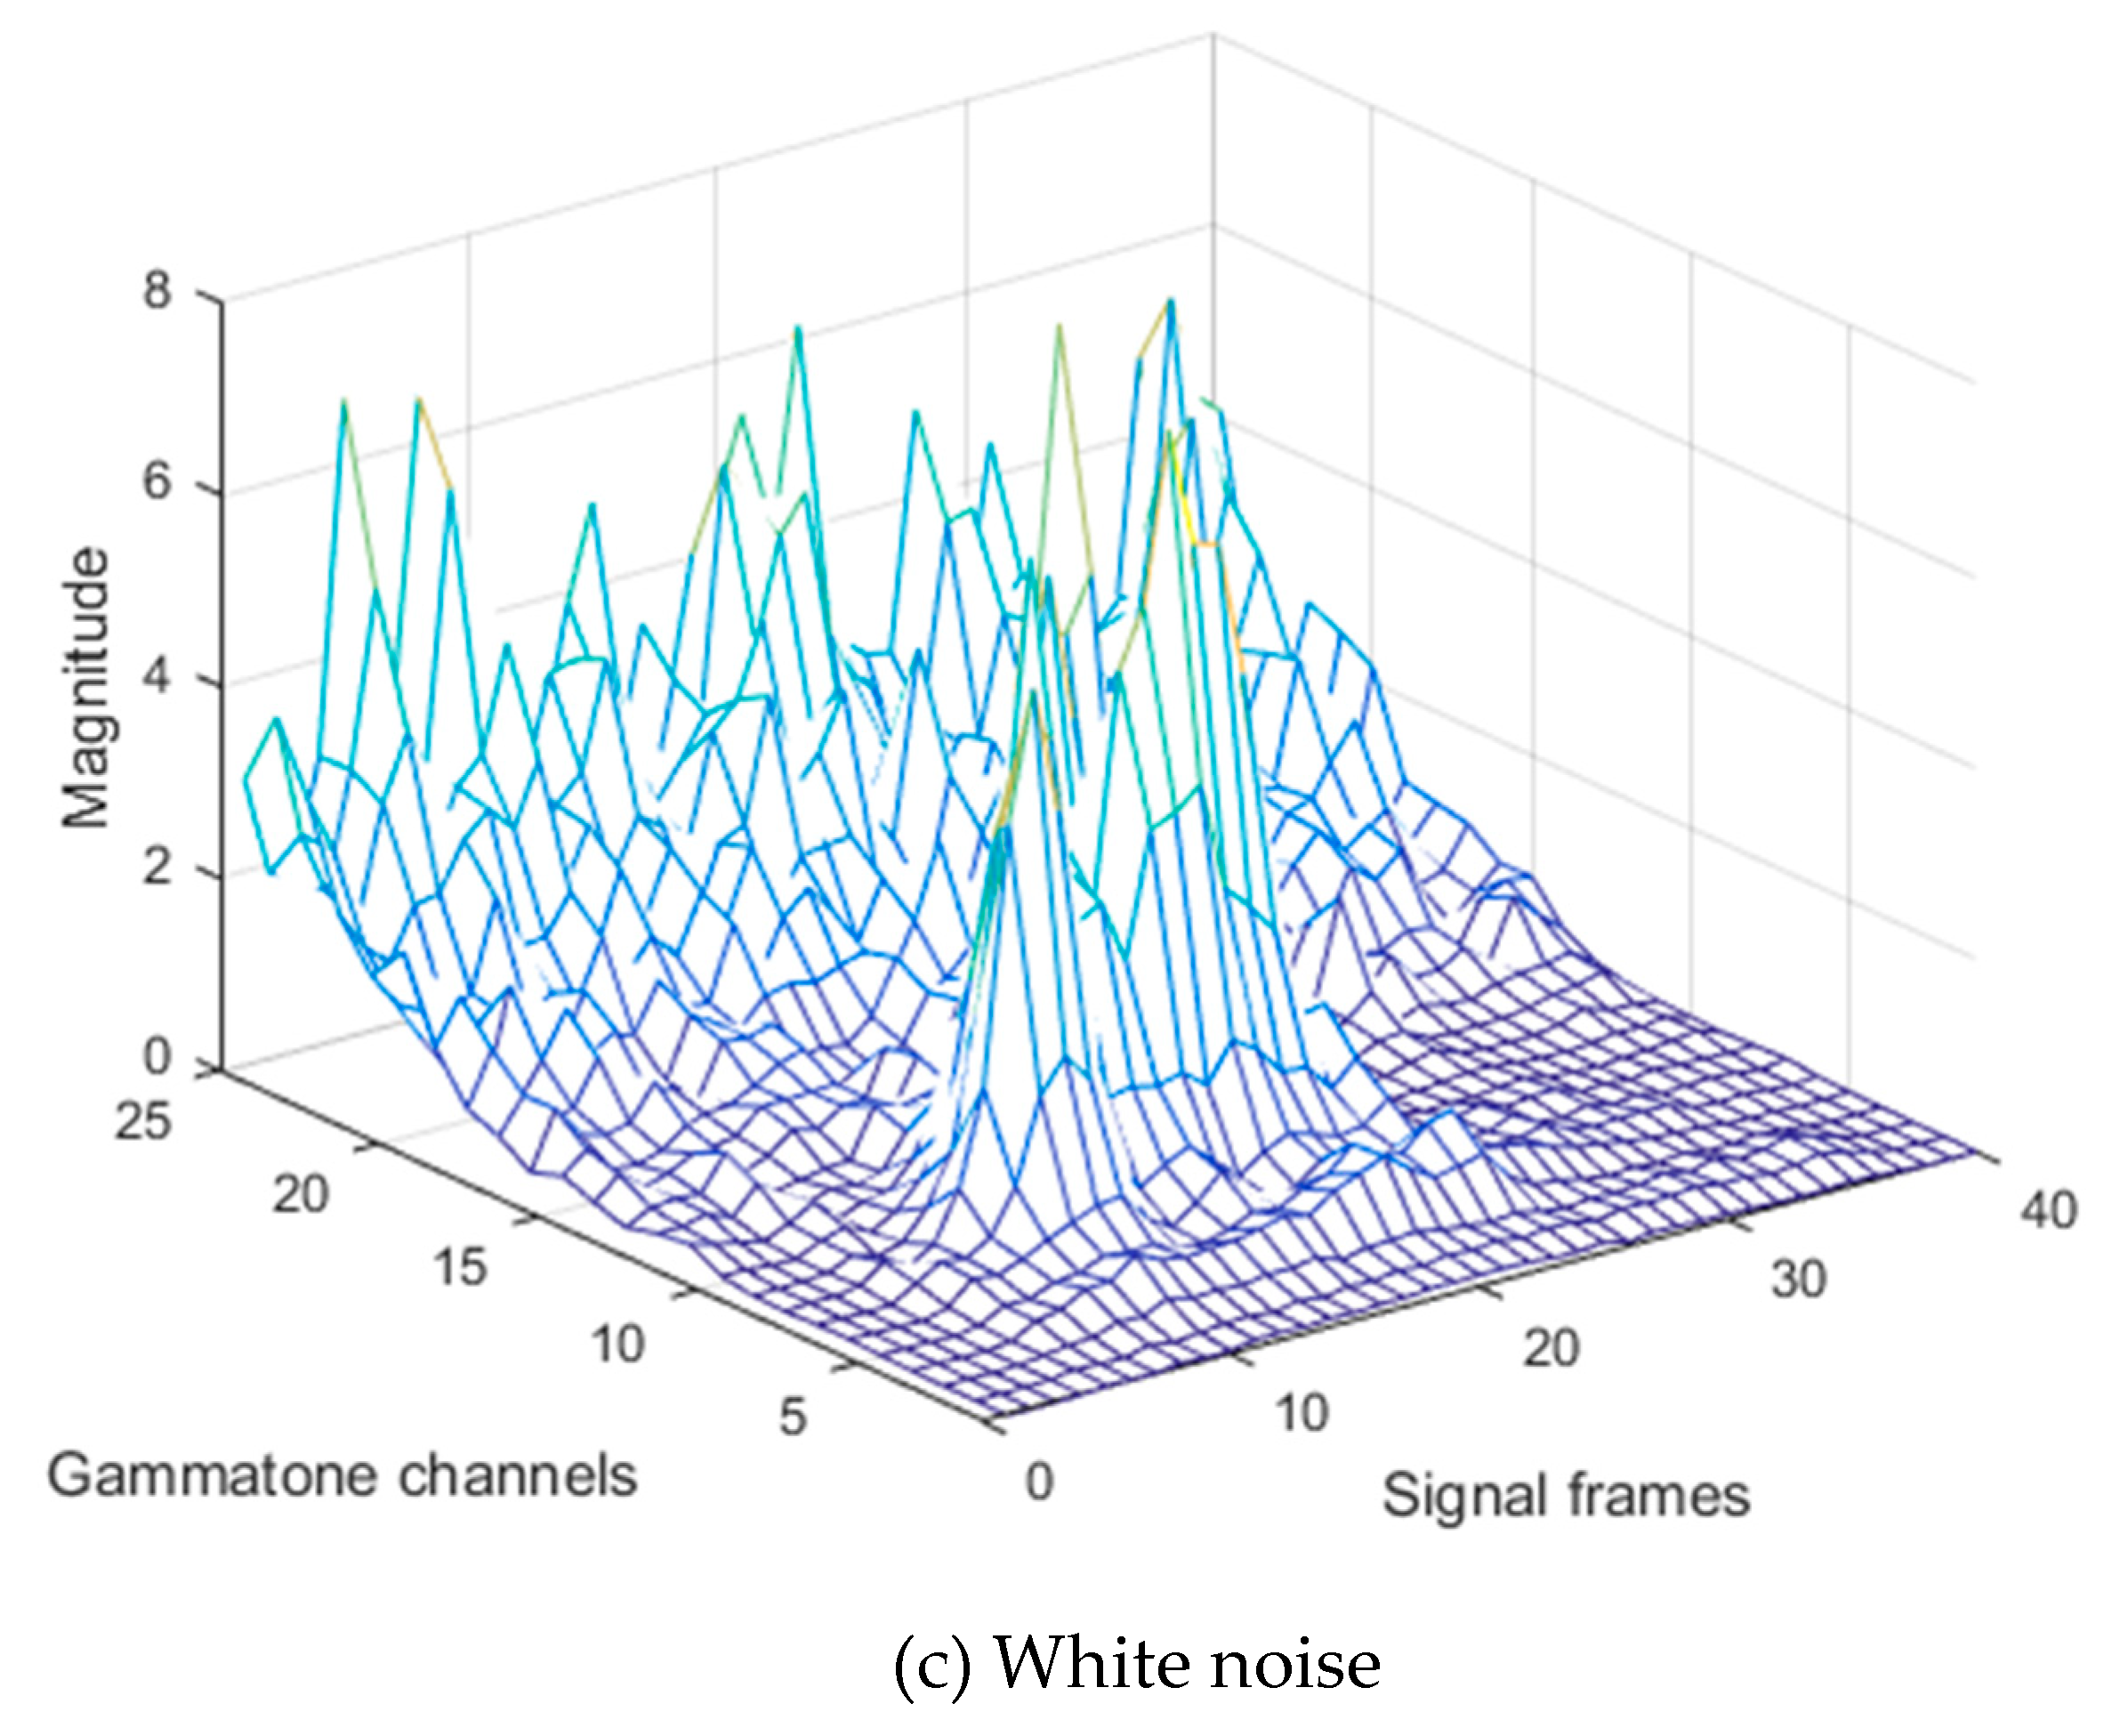
where represents the frame index, and is the gammatone channel index. As shown in Figure 3a, the power values of the gammatone spectrogram for clean speech does not change rapidly along with consequent frames. On the other hand, the power values of additive environmental and white noise change more frequently. Thus, these noises cause a sudden variation in speech values over consequent frames of each gammatone channel, as shown in Figure 3b,c. These sudden changes vary in each gammatone channel according to each type of 110 noise. Additionally, pre-emphasizing causes boosting of the additive noise values with speech at high frequency. Therefore, in this stage, the average filtering over each gammatone channel will cause smoothing of these sudden changes in the power values. Furthermore, the number of average window frames affects recognition performance. Using a large average window causes the 115 blur effect that can destroy the speech information, which degrades the system performance, especially in the case of undistorted speech utterances. Moreover, it is computationally demanding. On the other hand, small average window size leads to incomplete removal of sudden changes in power that are associated with some background noise conditions. Therefore, in this paper, the value of 120 coefficient is set to be equal to 5, and it was chosen experimentally by selecting the value that provides high performance at different noise levels.
2.2.2. Channel Bias Minimizing
Most of the speech information values are concentrated at low and medium frequencies, while the noise spectrum values distribution depends on each type of noise. After gammatone filtering, the PSD values for of each noisy speech frame is smoothed according to each gammatone filter function. However, the large-time power averaging filter will cause smoothing of the power values of each consequent gammatone channel, but differently. Since the energy values of additive noise change are faster than the speed energies over the frames, the smoothing effect will cause spreading of the noise energies more than the speech energies along each gammatone channel. Therefore, it will produce a channel bias. This bias depends on the spectral noise distribution more than the speech spectral distribution. Since the noise PSD is usually not uniform, specifically in the case of environmental noise, the bias value varies from each gammatone channel to another. In Equation (4), the channel bias effect is minimized by subtracting channel values from the minimum number within each channel, multiplied by the constant bias factor where . This constant bias factor depends on the value of the coefficient. It was also chosen experimentally, and its value is equal to 0.6.
2.2.3. Mean Power Normalization
The human auditory processing system contains an automatic gain control that decreases the effect of amplitude variation with the perceived acoustic wave. In the PNCC system, using the power function nonlinearity that is explicated in the next stage drives the produced power values from the processing to 145, which is sensitive to the absolute power variation, although the impact of variation is usually small. The mean power normalization is applied to minimize the potential effect of amplitude scaling. The input power is normalized by dividing the perceived power by a running average of the total power. Initially, the estimated mean power is calculated from the following equation:
where is a forgetting factor whose value is 0.999. Then the normalized power is computed from the evaluated running power as per the following equation:
where an arbitrary constant [15,17].
2.2.4. Power Function Nonlinearity
This stage simulates the compressive relation between the intensity of sound in decibels and the auditory nerve spontaneous firing rate [23,24]. It is included within the physiological model of human auditory processing. In the RASTA–PLP system, the power function nonlinearity is simulated as a cubic-root amplitude compression relation. However, this compressive relation is logarithmic in MFCC and GFCC systems. Based on experiments [15,25], to find the human rate intensity relation that fits to the [23] curve, it has been found that the power–law approximation curve of 1/15 exponent presents a proper fit to the physiological data, while optimizing recognition accuracy for the noisy speech compared to logarithmic and cubic-root curves.
2.3. Final Processing
In the last stage, the discrete cosine transform (DCT) is calculated to obtain the speech cepstral features. In order to decrease the convolutive channel distortion effect, the cepstral mean normalization (CMN) [26] is applied by moving all of the cepstral features to have a zero mean.
3. Experimental Work and Results
3.1. Experimental Work
In this paper, an excerpt of the TIDIGITS database [27] was utilized to evaluate the performance of the proposed method in comparison to the state-of-the-art techniques. This excerpt consists of 207 speakers; each of them pronounces 11 digits twice. It was partitioned into two subsets. The training set was 37 men and 57 women, while the testing set was 56 men and 57 women. Eight different types of noise were added to the testing datasets with different SNRs from −5 dB to 20 dB with a step size of 5 dB. These noises were added at the same random sequence. One of them was additive white Gaussian noise (AWGN), and the rest were AURORA environmental noise.
Likewise, in the PNCC methods, as well as in the MFCC [28], RASTA–PLP [28], and GFCC methods, each utterance was divided by 25.6 ms overlapped frames with 10 ms shifts between frames. Then, each frame was multiplied by a Hamming window. After that, the FFT was applied with 256-bit resolution. In the last stage, 13 features were obtained for each technique. After applying CMN, and features were calculated’ the total number of extracted features was 39 features.
For all types of feature extraction techniques in this paper, the Gaussian mixture model–hidden Markov model (GMM–HMM) technique was used to generate acoustic models of each word [3]. The sphinx Carnegie Mellon University (CMU) lexical dictionary was used with three Gaussian mixture components per each phoneme. All the feature extraction methods were trained with noise-free utterances, and tested with noise-free and noisy utterances. The database structure was a single word. Therefore, the language model was only one word, and in this case, the recognition accuracy was equal to the word recognition rate (WRR).
3.2. Results and Discussion
Figure 4 shows the recognition accuracy, which is presented graphically for the proposed PNCC method in comparison to the state-of-the-art PNCC system, as well as the most commonly used baseline systems, such as GFCC, MFCC, and RASTA–PLP. The first graphs are obtained accuracy in the case of AWGN, while the rest of the graphs are for different types of environmental noise. The performance of these systems for each noise is shown in the case of clean data and at six SNR levels from −5 dB to 20 dB with step size 5 dB.
As seen in Figure 4, it was concluded that the lowest robustness against noise acquired for MFCC and RASTA–PLP systems was interchangeable. With some types of noise, the performance of MFCC was higher than RASTA–PLP, and the reverse was true for other circumstances, while in the rest of the cases, the performance varied for each noise level. Replacing the mel triangular filter banks in MFCC processing by the gammatone filter banks in the GFCC system provided significantly measurable improvements in the recognition accuracy for all types of degradation. However, with significant types of noise, the GFCC performance was less than both of these systems at a SNR of −5dB. Using the time–frequency noise suppression technique, mean power normalization, and power function nonlinearity using (1/15) root remarkably improved the recognition accuracy in the PNCC systems in comparison to the last three systems. The recognition accuracy of the enhanced proposed PNCC dramatically outperformed all the systems for all noise types, specifically at low SNRs, whereas at high SNR values, the recognition accuracy was almost unchanged.
Moreover, the proposed robustness technique against the noise did not degrade the system performance in the case of the undistorted speech waveform. Thus, the blurring effect from the large-time power averaging filter was almost unnoticeable. Figure 5 demonstrates an in-depth analysis of the percentage improvement rate of the proposed method in comparison to the other methods at low SNRs, such as −5 dB, 0 dB, and 5 dB. Overall improvement in percentage recognition rate for all the types of noise was obtained in the case of MFCC, RASTA–PLP, and GFCC methods, and lastly PNCC method. In the SNR −5 dB bar chart, the highest recognition rate in comparison to RASTA–PLP and GFCC methods was determined in the street noise condition.
The proposed method outperformed the RASTA–PLP method by 37.21%, while it was better than the GFCC method by 38.66%. Differently, the highest recognition rate in comparison to MFCC and PNCC methods was determined in the case of car noise. The proposed method was improved by 33.75% in the case of the MFCC method, while it was enhanced by 19.51% more than the PNCC method. In the SNR 0 dB bar chart, the highest percentage enhancement in recognition rate in comparison to MFCC and PNCC methods was obtained in the subway noise condition.
The proposed method was better than the MFCC method by 49.75%, while it outperformed the PNCC method by 14.4%. Otherwise, the highest recognition rate compared to RASTA–PLP and GFCC methods was determined in the case of car noise. The proposed method was improved by 46.98% in the case of the RASTA–PLP method, while it was enhanced by 40.02% in the case of the GFCC method. In the SNR 5 dB bar chart, the highest recognition rate in comparison to MFCC, RASTA PLP, and PNCC methods was determined in the subway noise condition. The proposed method was better than the MFCC method by 55.72%, while it was better than the RASTA–PLP method by 47.87% and the PNCC method by 8.16%. Differently, the highest recognition rate in comparison to the GFCC method was determined in the case of exhibition noise. It was improved by 24.85% more than the GFCC method.
3.3. Computational Complexity
Following [15], the number of multiplications and divisions in each frame for RASTA–PLP, PNCC, and the proposed method feature extraction techniques were estimated, as shown in Table 1. In this research, we assumed that the window length was 25.6 ms and with 10 ms overlap between frames. The sampling rate was assumed to be 8 kHz, and a 256-pt FFT was used for each analysis frame.
It can be seen in Table 1 that the proposed method processing was about 4.07 percent costlier than PNCC processing. The proposed method processing was approximately 12.45 percent costlier than RASTA–PLP processing.
4. Conclusions and Future Work
In this paper, a framework modification for the power normalized cepstral coefficient (PNCC) system was presented for extracting more robust speech features, specifically at low signal to noise ratios (SNRs), without affecting the system performance for undistorted speech. Experimental results were acquired for a part of TIDIGITS corpus for clean and additive white and AURORA environmental noises. The proposed PNCC dramatically exceeded the state-of-the-art PNCC method as well as the MFCC, RASTA–PLP, and GFCC systems.
- Under clean conditions, the recognition accuracy for all systems was almost equivalent.
- The highest robust proposed PNCC features in comparison to MFCC and RASTA–PLP were achieved in the subway noise condition at SNR 5 dB, whereas, for GFCC and PNCC methods, they were obtained in the case of car noise at SNR 0 dB and −5 dB, respectively. The achieved recognition accuracies for the proposed PNCC system were 86.89% in the subway noise condition at SNR 5 dB, 79.32% in the car noise condition at SNR 0 dB, and 53.58% in the car noise condition at SNR −5 dB.
Many different adaptations, tests, and experiments are suggested for future work. They concern the more in-depth analysis of specific mechanisms, trying different methods to enhance the proposed system’s performance or to evaluate the proposed system’s behavior under different conditions. For instance, the performance of the proposed system can be examined with a more extensive vocabulary and different languages datasets. Moreover, noisier conditions need to be evaluated, such as reverberation noise effects, colored noises, background music, and mixtures of environmental noises.
Author Contributions
M.T. and A.G. proposed the idea, conceived and designed the simulations, analyzed the data, and wrote the paper. M.K. reviewed the paper and simulation results.
Funding
This research received no external funding.
Conflicts of Interest
The authors declare no conflict of interest.
References
- Li, J.Y.; Deng, L.; Gong, Y.F.; Haeb-Umbach, R. An Overview of Noise-Robust Automatic Speech Recognition. IEEE-ACM Trans. Audio Speech Lang. Process. 2014, 22, 745–777. [Google Scholar] [CrossRef]
- Rabiner, L.; Juang, B.-H. Fundamentals of Speech Recognition; Prentice Hall: Englewood Cliffs, NJ, USA, 1993; Volume 14. [Google Scholar]
- Jurafsky, D.; Martin, J.H. Speech and Language Processing: An Introduction to Natural Language Processing, Computational Linguistics, and Speech Recognition, 2nd ed.; Prentice Hall, Pearson Education International: Upper Saddle River, NJ, USA, 2008. [Google Scholar]
- Davis, S.B.; Mermelstein, P. Comparison of Parametric Representations for Monosyllabic Word Recognition in Continuously Spoken Sentences. IEEE Trans. Acoust. Speech Signal Process. 1980, 28, 357–366. [Google Scholar] [CrossRef]
- Hermansky, H. Perceptual linear predictive (PLP) analysis of speech. J. Acoust. Soc. Am. 1990, 87, 1738–1752. [Google Scholar] [CrossRef] [PubMed] [Green Version]
- Hermansky, H.; Morgan, N. RASTA processing of speech. IEEE Trans. Speech Audio Process. 1994, 2, 578–589. [Google Scholar] [CrossRef]
- Hermansky, H.; Morgan, N.; Bayya, A.; Kohn, P. RASTA–PLP Speech Analysis Technique. In Proceedings of the ICASSP-92: 1992 IEEE International Conference on Acoustics, Speech, and Signal Processing, Vols 1–5, San Francisco, CA, USA, 23–26 March 1992; pp. A121–A124. [Google Scholar] [CrossRef]
- Viikki, O.; Bye, D.; Laurila, K. A recursive feature vector normalization approach for robust speech recognition in noise. In Proceedings of the 1998 IEEE International Conference on Acoustics, Speech and Signal Processing, Seattle, WA, USA, 15 May 1998; Volume 2, pp. 733–736. [Google Scholar] [CrossRef]
- Shao, Y.; Srinivasan, S.; Jin, Z.Z.; Wang, D.L. A computational auditory scene analysis system for speech segregation and robust speech recognition. Comput. Speech Lang. 2010, 24, 77–93. [Google Scholar] [CrossRef]
- Kim, D.S.; Lee, S.Y.; Kil, R.M. Auditory processing of speech signals for robust speech recognition in real-world noisy environments. IEEE Trans. Speech Audio Process. 1999, 7, 55–69. [Google Scholar] [CrossRef]
- Ali, A.M.A.; Van der Spiegel, J.; Mueller, P. Robust auditory-based speech processing using the average localized synchrony detection. IEEE Trans. Speech Audio Process. 2002, 10, 279–292. [Google Scholar] [CrossRef]
- Yapanel, U.H.; Hansen, J.H.L. A new perceptually motivated MVDR-based acoustic front-end (PMVDR) for robust automatic speech recognition. Speech Commun. 2008, 50, 142–152. [Google Scholar] [CrossRef]
- Fazel, A.; Chakrabartty, S. Sparse Auditory Reproducing Kernel (SPARK) Features for Noise-Robust Speech Recognition. IEEE Trans. Audio Speech Lang. Process. 2012, 20, 1362–1371. [Google Scholar] [CrossRef]
- Schadler, M.; Meyer, B.T.; Kollmeier, B. Spectro-temporal modulation subspace-spanning filter bank features for robust automatic speech recognition. J. Acoust. Soc. Am. 2012, 131, 4134–4151. [Google Scholar] [CrossRef] [PubMed]
- Kim, C.; Stern, R.M. Power-Normalized Cepstral Coefficients (PNCC) for Robust Speech Recognition. IEEE/ACM Trans. Audio Speech Lang. Process. 2016, 24, 1315–1329. [Google Scholar] [CrossRef] [Green Version]
- Kim, C.; Stern, R.M. Feature Extraction for Robust Speech Recognition Based on Maximizing the Sharpness of the Power Distribution and on Power Flooring. In Proceedings of the 2010 IEEE International Conference on Acoustics, Speech, and Signal Processing, Dallas, TX, USA, 14–19 March 2010; pp. 4574–4577. [Google Scholar] [CrossRef]
- Gouda, A.M.; Tamazin, M.; Khedr, M. Robust Automatic Speech Recognition System Based on Using Adaptive Time-Frequency Masking. In Proceedings of the 2016 11th International Conference on Computer Engineering & Systems (ICCES), Cairo, Egypt, 20–21 December 2016; pp. 181–186. [Google Scholar]
- Irino, T.; Patterson, R.D. A compressive gammachirp auditory filter for both physiological and psychophysical data. J. Acoust. Soc. Am. 2001, 109, 2008–2022. [Google Scholar] [CrossRef] [PubMed]
- Irino, T.; Patterson, R.D. A time-domain, level-dependent auditory filter: The gammachirp. J. Acoust. Soc. Am. 1997, 101, 412–419. [Google Scholar] [CrossRef]
- Kingsbury, B.E.D.; Morgan, N.; Greenberg, S. Robust speech recognition using the modulation spectrogram. Speech Commun. 1998, 25, 117–132. [Google Scholar] [CrossRef]
- Dau, T.; Püschel, D.; Kohlrausch, A. A quantitative model of the “effective” signal processing in the auditory system. I. Model structure. J. Acoust. Soc. Am. 1996, 99, 3615–3622. [Google Scholar] [CrossRef] [PubMed]
- Kim, C.; Stern, R.M. Nonlinear enhancement of onset for robust speech recognition. In Proceedings of the Eleventh Annual Conference of the International Speech Communication Association, Chiba, Japan, 26–30 September 2010; pp. 2058–2061. [Google Scholar]
- Heinz, M.G.; Zhang, X.; Bruce, I.C.; Carney, L.H. Auditory nerve model for predicting performance limits of normal and impaired listeners. Acoust. Res. Lett. Online 2001, 2, 91–96. [Google Scholar] [CrossRef] [Green Version]
- Zhang, X.; Heinz, M.G.; Bruce, I.C.; Carney, L.H. A phenomenological model for the responses of auditory-nerve fibers: I. Nonlinear tuning with compression and suppression. J. Acoust. Soc. Am. 2001, 109, 648–670. [Google Scholar] [CrossRef] [PubMed] [Green Version]
- Stern, R.M.; Acero, A.; Liu, F.-H.; Ohshima, Y. Signal processing for robust speech recognition. In Automatic Speech and Speaker Recognition; Springer: Berlin/Heidelberg, Germany, 1996; pp. 357–384. [Google Scholar]
- Viikki, O.; Laurila, K. Cepstral domain segmental feature vector normalization for noise robust speech recognition. Speech Commun. 1998, 25, 133–147. [Google Scholar] [CrossRef]
- Leonard, R. A database for speaker-independent digit recognition. In Proceedings of the ICASSP’84, IEEE International Conference on Acoustics, Speech, and Signal Processing, San Diego, CA, USA, 19–21 March 1984; pp. 328–331. [Google Scholar]
- Ellis, D.P.W. PLP and RASTA (and MFCC, and Inversion) in Matlab. Available online: http://www.ee.columbia.edu/%7Edpwe/resources/matlab/rastamat/ (accessed on 16 April 2019).
Figure 1.
Difference between the block diagrams of enhanced PNCC, PNCC, GFCC, RASTA–PLP, and MFCC feature extraction techniques.
Figure 1.
Difference between the block diagrams of enhanced PNCC, PNCC, GFCC, RASTA–PLP, and MFCC feature extraction techniques.

Figure 2.
Normalized 25 gammatone filter banks.

Figure 3.
Gammatone spectrogram of the uttered word ‘one’.


Figure 4.
Percentage recognition accuracy under various noise conditions.


Figure 5.
Percentage improvement rate of the proposed method for all noise types at SNRs −5 dB, 0 dB, and 5 dB.
Figure 5.
Percentage improvement rate of the proposed method for all noise types at SNRs −5 dB, 0 dB, and 5 dB.


Table 1.
Number of multiplications and divisions in each frame [15].
Table 1.
Number of multiplications and divisions in each frame [15].
| Item | RASTA–PLP | PNCC | Proposed Method |
|---|---|---|---|
| Pre-emphasis | 205 | 205 | |
| Windowing | 205 | 205 | 205 |
| FFT | 2560 | 2560 | 2560 |
| Magnitude squared | 128 | 128 | 128 |
| Time power calculation | 25 | 125 | |
| Spectral integration | 2477 | 2492 | 2739 |
| ANS filtering | 100 | ||
| Channel bias minimizing | 125 | ||
| Equal loudness pre-emphasis | 128 | ||
| Temporal masking | 120 | ||
| Weight averaging | 120 | 120 | |
| IDFT | 120 | ||
| LPC and cepstral recursion | 115 | ||
| DCT | 240 | 240 | |
| Sum | 5733 | 6195 | 6447 |
© 2019 by the authors. Licensee MDPI, Basel, Switzerland. This article is an open access article distributed under the terms and conditions of the Creative Commons Attribution (CC BY) license (http://creativecommons.org/licenses/by/4.0/).
Share and Cite
MDPI and ACS Style
Tamazin, M.; Gouda, A.; Khedr, M. Enhanced Automatic Speech Recognition System Based on Enhancing Power-Normalized Cepstral Coefficients. Appl. Sci. 2019, 9, 2166. https://doi.org/10.3390/app9102166
AMA Style
Tamazin M, Gouda A, Khedr M. Enhanced Automatic Speech Recognition System Based on Enhancing Power-Normalized Cepstral Coefficients. Applied Sciences. 2019; 9(10):2166. https://doi.org/10.3390/app9102166
Chicago/Turabian StyleTamazin, Mohamed, Ahmed Gouda, and Mohamed Khedr. 2019. "Enhanced Automatic Speech Recognition System Based on Enhancing Power-Normalized Cepstral Coefficients" Applied Sciences 9, no. 10: 2166. https://doi.org/10.3390/app9102166
Note that from the first issue of 2016, this journal uses article numbers instead of page numbers. See further details here.