Field Research on the Wind-Induced Response of a Super High-Rise Building under Typhoon
by
 ,
,
Chequan Wang
1 ,
,
Zhengnong Li
1,*,
Lan Hu
2,
Zhefei Zhao
3,
Qizhi Luo
1,
Jiaxing Hu
1 and
Xuewen Zhang
1 1
Key Laboratory of Building Safety and Efficiency of the Ministry of Education, Hunan University, Changsha 410082, Hunan, China
2
Civil Engineering College, Hunan University of Technology, Zhuzhou 412007, Hunan, China
3
School of Vocational Engineering, Health and Sciences, RMIT University, GPO Box 2476, Melbourne, VIC 3001, Australia
*
Author to whom correspondence should be addressed.
Appl. Sci. 2019, 9(11), 2180; https://doi.org/10.3390/app9112180
Submission received: 6 May 2019
/
Revised: 21 May 2019
/
Accepted: 24 May 2019
/
Published: 28 May 2019
(This article belongs to the Special Issue Structural Damage Detection and Health Monitoring)
Abstract
:This paper simultaneously measures the characteristics of wind on the roof and the acceleration responses of the 10th, 18th, 25th, 32nd and 41st floors of a high-rise building in Wenzhou during the passing of typhoons between 2014 and 2016. This paper also analyses the dynamic characteristics and wind-induced response of buildings by using Welch and improved Natural Excitation Technique–Eigensystem Realisation Algorithm methods. The results show that the typhoons that affected Wenzhou are dominated by wind from the east, northeast and northwest. The acceleration response probability densities of different floors during Typhoons Chan-hom and Dujuan are similar to the Gaussian distribution. The first-order natural frequencies of the two wind directions of the test building are 0.390 and 0.409, which are in good agreement with Tamura’s prediction results. The relevant amplitude and frequency characteristics of the first three modes are investigated in detail according to the nonlinear characteristics of the measured building. The first-, second- and third-order damping ratios of the structure during Typhoons Chan-hom and Dujuan increased with the peak acceleration, whereas the damping during Typhoon Fung-wong remained almost unchanged. The root mean square of the acceleration response of the building structure during Typhoons Chan-hom and Dujuan increased with the wind speed. However, the increase rate of Typhoon Chan-hom was small, possibly because the angle between the incoming flow and the building is 45°, and the acceleration response in the downwind and crosswind directions is not apparent. The measured results show that the working environment of the staff at the top of the building under the influence of the typhoon also meets comfort requirements. The measured data and statistical parameters provide a valuable reference for the wind-resistant design of high-rise buildings in typhoon-prone areas.
1. Introduction
The number of high-rise buildings in coastal areas are increasing, and these buildings have become higher and softer with the application of new materials, the innovation of design concepts and the advancement of construction technology. In recent decades, many full-scale measurements have been conducted on the wind-induced response of high-rise buildings. Field measurements provide valuable scientific data for identifying dynamic parameters, such as mode shapes, natural frequencies and damping ratios [1,2,3,4,5,6,7,8,9]. However, comprehensively measuring the wind-induced response of high-rise buildings during the passing of a typhoon is difficult due to the high cost, uncertain landing trajectory and long test period. Therefore, an on-site measurement of high-rise buildings during typhoons is crucial to a wind-resistant design of high-rise buildings in typhoon-prone areas.
At present, research on the damping ratio of high-rise building structures is mainly based on field measurements, and the influence analysis on the aerodynamic damping ratio is mainly conducted in wind tunnel tests. However, the structure and aerodynamic damping ratio of the actual structure under a strong wind excitation are inseparable. Aeroelastic models, which simulate the amplitude-dependent damping characteristics of high-rise buildings and are designed in wind tunnel tests, are not considered. Many scholars have conducted various studies on the relationship of the damping ratio and vibration amplitude. Vickery and Steckley [10] and Kareem and Gurley [11] proposed that aeroelastic effects, especially aerodynamic damping ratios, need to be considered to obtain an accurate wind-induced response. Cooper et al. [12] conducted a wind tunnel test by using an aeroelastic model and found that the aerodynamic coefficients excited by wind increased with the amplitude in the downwind and upwind directions when the wind speed was low. Li et al. [13] conducted field measurements on the 324 m Diwang Tower and a 367 m high-rise building to analyse the influence of nonlinear damping characteristics on dynamic behaviour and found that the damping ratio increased with the increase in amplitude. Jeary [14] determined the relationship between damping and amplitude through a 100 m high structural steel building, which has a low-amplitude stability level, a medium-amplitude slope and a high-amplitude stability level. Tamura [15] conducted tests on a 99 m steel tower and found that when the amplitude was above the critical tip displacement ratio, the damping ratio no longer increased but remained at a stable level. Li et al. [16] conducted field measurements on a 420 m building to analyse the damping ratios of the super-tall building, which demonstrates amplitude-dependent characteristics. Huang et al. [17] analyzed the dynamic response and dynamic characteristics based on the long-term monitoring acceleration data of the Shanghai World Financial Center. The standard deviation of the top acceleration increases with the mean wind speed as a power function, and the first-order natural vibration frequency decreases with the increase of the top amplitude. The first order damping ratio increases as the amplitude of the top increases. Huang et al. [18], based on the measured acceleration data of a super high-rise building under the action of a typhoon, considered an amplitude greater than 10 mm/s2; the X-direction vibration mode damping ratio gradually becomes larger as the amplitude increases, and the amplitude reaches 30 mm/s2. The damping ratio is stable at about 0.6%. In summary, most studies have shown that the damping ratio remains at a stable level at low amplitudes and increases with the amplitude before the low amplitude reaches a critical value. Once the critical value is reached, the damping ratio tends to be stable as the amplitude increases. Therefore, field measurements are needed to verify the variation trend and range of amplitude-dependent modal frequencies at high amplitudes.
At present, most of the measured research only analyzes the dynamic response and dynamic characteristics of a super high-rise building under a certain typhoon. The time span of the measured data is not large enough, and almost no large wind events are involved. It is difficult to fully obtain the wind-induced response law of super high-rise buildings. Therefore, it is necessary to conduct long-term observations on the wind-induced response of super-tall buildings, as well as a comprehensive and in-depth analysis of the dynamic response and dynamic characteristics of super-tall buildings through a large amount of response data. The wind-induced response of a high-rise building in Wenzhou, China during typhoons from 2014–2016 was measured in this study. The wind characteristics at the top of the building and the wind-induced response of different floors were obtained, and the relationship between e acceleration amplitude and the 10-min mean wind speed was determined. The Welch and improved Natural Excitation Technique -Eigensystem Realisation Algorithm (NExT-ERA) methods are used to identify the modal parameters, providing a reference for subsequent studies on the nonlinear characteristics of the modal parameters of high-rise buildings during typhoons.
2. Field Measurement Overview
2.1. Overview of the Test Building
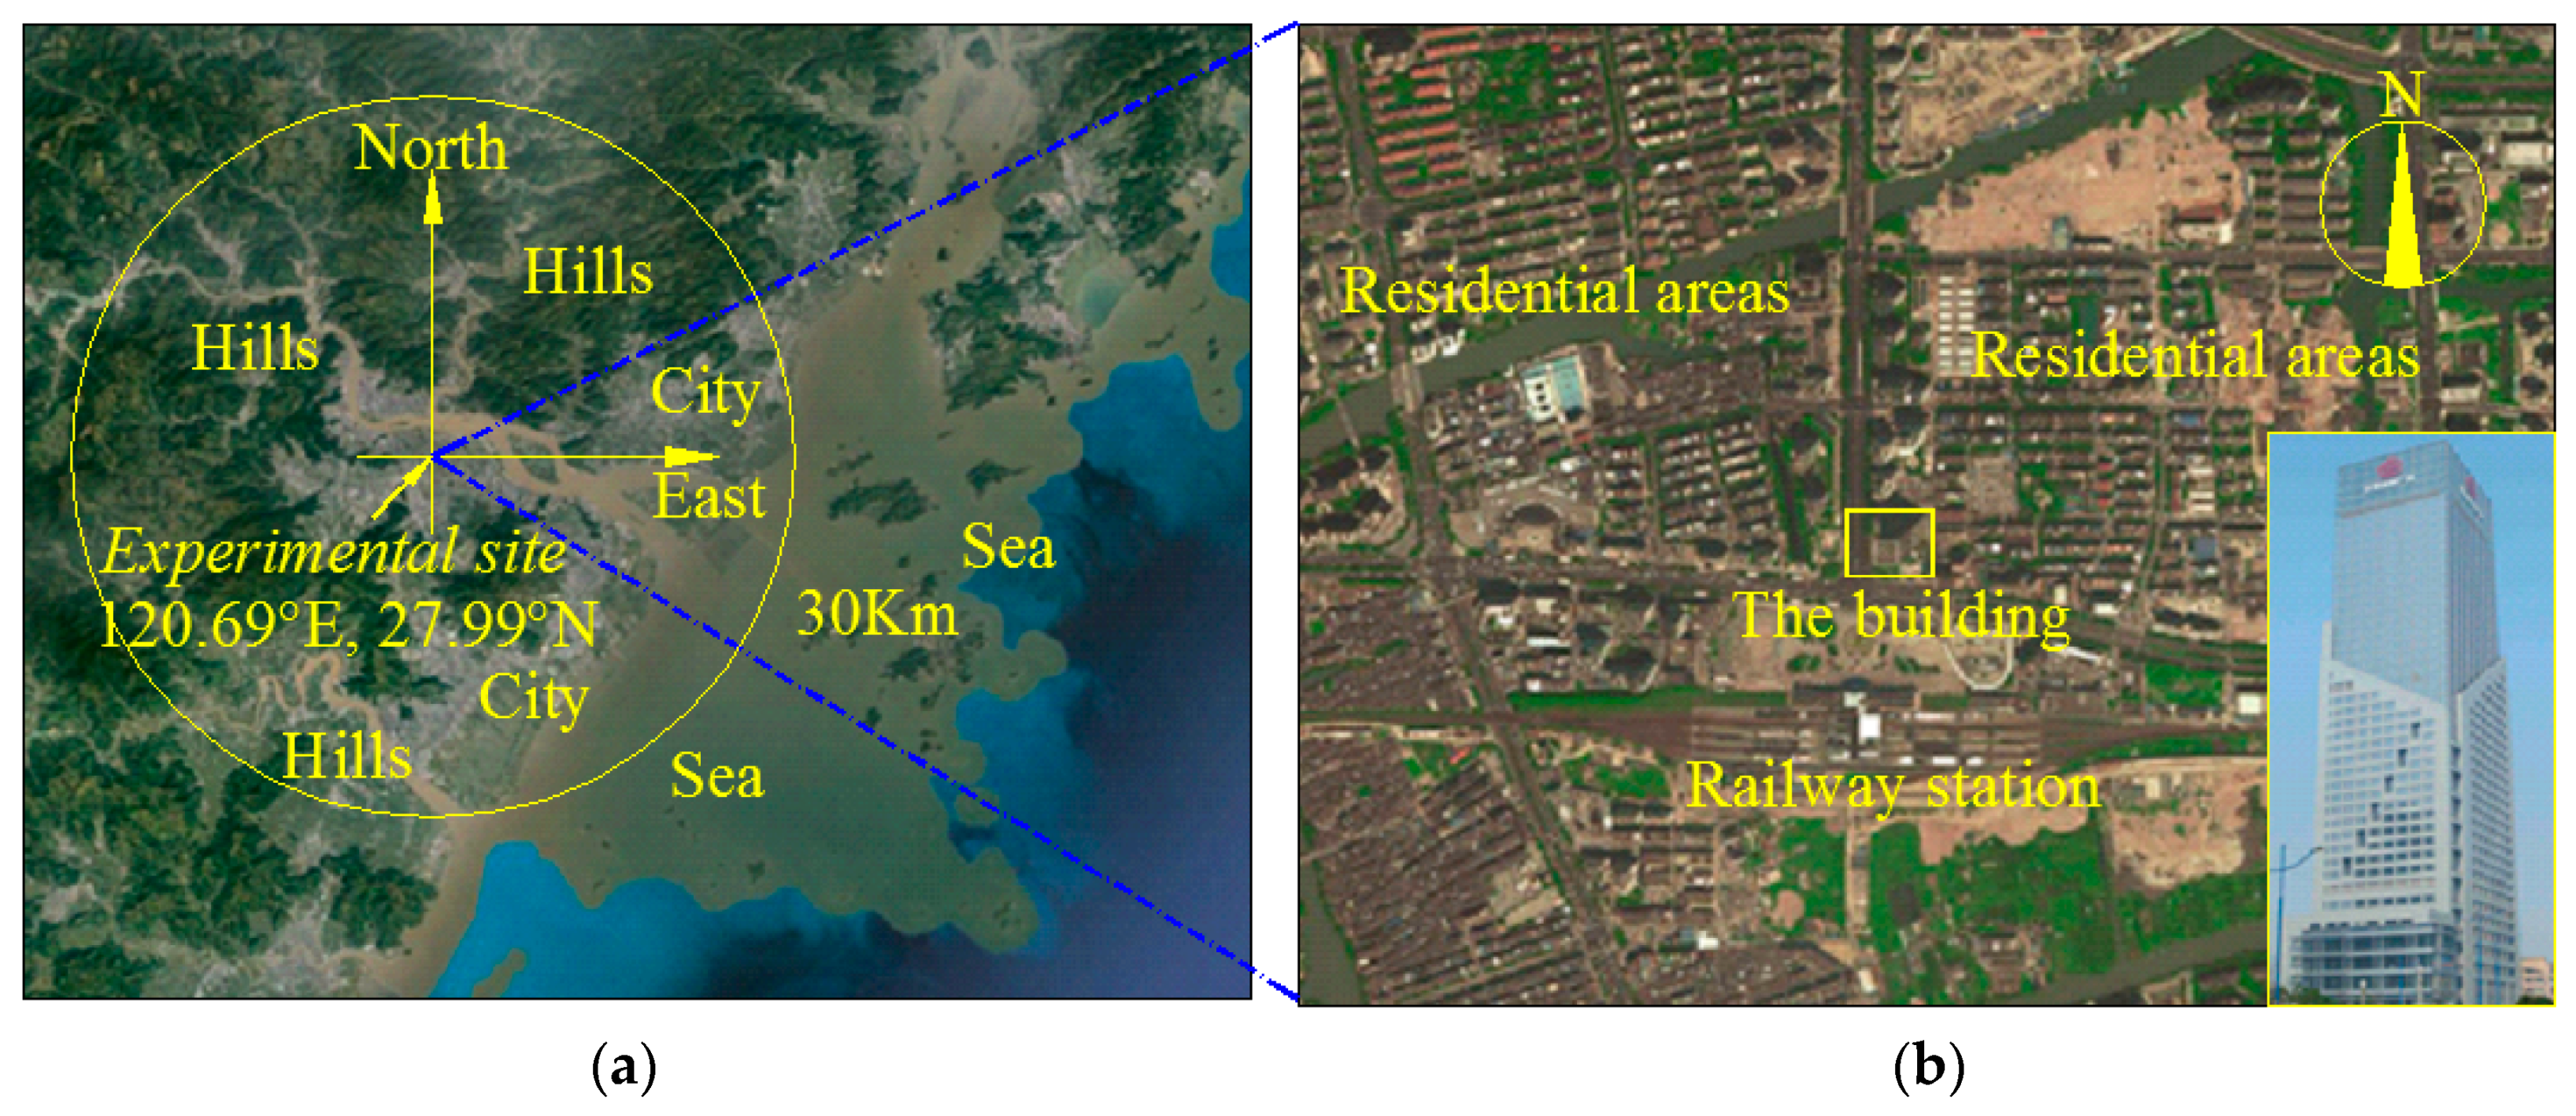
A 168-metre-high test building with 41 floors above ground is located in Wenzhou City, China, 21 km from the sea. The east side of the building is a residential area with a height of 5–7 floors. The south side is an open area. A small number of high-rise buildings are found in the west and north sides. The location is a typical urban suburb. Figure 1a,b show the surrounding environment of the test building.
2.2. Introduction to Field Measurement Instruments
An R. M. Young 05103 V mechanical anemometer (Figure 2a) is installed at the southeast corner of the test building and fixed on a straight rod 9 m high above the floor. The total height of the anemometer from the ground is about 177 m. The anemometer is installed due north, and the wind direction defines the north wind as , which increases clockwise in a top view; that is, the east wind is , and other angles are clockwise. The horizontal wind speed and wind direction angle are obtained by field measurements. At the stair landing in the middle of the 10th, 18th, 25th, 32nd and 41st floors of the test building, a 991C horizontal vibration pickup is arranged in longitudinal and transverse directions (Figure 2b). A 14-bit AD high-precision 32-channel Youtai acquisition and analysis system is used to synchronously collect the roof anemometer and the vibration pickups of five floors.
2.3. Field Measurement Status
Five typhoons, namely, Typhoons Matmo and Fung-wong in 2014, Typhoons Chan-hom and Dujuan in 2015 and Typhoon Nepartak in 2016, were observed from 2014 to 2016. Figure 3 shows the typhoon paths. A synchronous measurement of the wind field and wind-induced response of super high-rise buildings was conducted using the aforementioned measured systems, and the sampling frequency was 128 Hz.
3. Analytical Research Methods
3.1. Research Method for Wind Characteristics
The anemometer can simultaneously measure the x and y axial wind speed at the point denoted by and , respectively. The wind speed statistical processing in this study uses a vector decomposition method [19] to obtain the longitudinal and transverse horizontal components (Figure 4). The average horizontal wind speed U and the average horizontal wind direction angle at a basic time interval of 10 min in the statistical analysis are:
where and are the mean values of the samples of and at the basic time interval, respectively. In the basic time interval, the horizontal longitudinal pulsating wind speed and the horizontal longitudinal pulsating wind speed can be calculated according to Equations (3) and (4):
3.2. Welch Method
The average periodic diagram (Welch method) is a frequency domain analysis method based on environmental excitation and is used to rapidly identify structural modal parameters. It divides the data of random vibration signals into several segments, allows each data segment to overlap, separately obtains the power spectrum of each data segment and averages it afterwards. Taking appropriate window functions (e.g., Hamming window and Hanning window) and the half-length overlap rate enables the full use of all the signal information and effectively reduces the estimation bias.
The auto-power spectral density function of the average periodic diagram is defined as:
where is the Fourier transform of the th data segment of a random vibration signal, is a conjugate complex number of and is the average time.
The auto-power spectral density function is an important parameter that describes the random vibration, which shows the power distribution at each frequency of the vibration signal. This function is often used to determine the natural vibration characteristics of a structure. The natural vibration frequency of structures with low damping and discrete natural frequencies can be easily identified. This method is widely used in the construction field because of its simple operation and convenient use.
3.3. Improved NExT-ERA Method
The basic idea of the Natural Excitation Technique (NExT) method is that the cross-correlation and impulse response functions between two points of the structure under white noise excitation have similar expressions, and a modal identification method in the time domain is used to identify the modal parameters after obtaining the cross-correlation function of the response between the two points.
For a linear system with a degree of freedom of N, when the k point of the system receives an excitation of force , the response of the system’s i point can be expressed as:
where is the r-th-order modal model of the i-th measuring point, and is a constant term that is related only to the excitation point k and the modal order r.
An impulse response of the system’s i point is obtained when the system’s k point is excited by a unit pulse and can be expressed as:
The system’s k-point input force is excited, and the responses obtained by the system’s i- and j-point tests are and , respectively. The expression of the cross-correlation functions of the two responses can be written as:
Assuming that the stimulus is an ideal white noise, the definition of the correlation functions implies that:
where is an impulse function, and is a constant term only related to the excitation point k.
Equation (5) substituted Equation (4) by integrating and simplifying it to obtain:
where is a constant term that is related only to the reference point j and the modal order r, is the r-th-order modal model of the i-th measuring point. is the s-th-order modal model of the j-th measuring point. and are constant terms that are related only to the excitation point k and the modal order r and s, respectively, and is a constant term only related to the excitation point k. and are the modal participation factors of the r-th and s-th modes, respectively.
The comparison of Equations (5) and (10) shows that the mathematical expressions of the cross-correlation function of the two-point response and the impulse response of the pulse excitation of the linear system under white noise excitation are completely identical in form. The cross-correlation function can be characterised as a superposition of a series of complex exponential functions. The NExT method assumes the excitation as white noise, selects the measurement point with less response as a reference point and calculates the cross-correlation function between other measurement points and the reference measurement point. The function is used as input data in combination with traditional modal identification methods for the parameter identification under environmental excitation. This study initially calculates the cross-power spectrum of the measured signal and then obtains the measured cross-correlation function by using an inverse Fourier transform based on the NExT method. This method adopts statistical averaging processing, and the obtained signal-to-noise ratio of the cross-correlation function is greatly increased. A certain degree of precision is observed in the processing of non-stationary signals. This improved NExT method is called the Natural Excitation Technique-Average (NExT-AVG) method.
The Eigensystem Realisation Algorithm (ERA) method [9] is a multi-input multi-output time-domain global modal parameter identification method. The basic idea is to apply a matrix singular value decomposition to decompose the measured free impulse response data matrix, to realise the parameter control of the most effective number of state spaces by truncating invalid singular values and to eliminate the noise mode by using quantitative modal confidence factors. Therefore, the ERA method is an ideal time domain parameter identification method. The frequency and damping of the building structure are discussed in conjunction with the ERA method based on the NExT-AVG method.
4. Wind Characteristics
Five field measurements were conducted on typhoons from 2014 to 2016. Three typhoons had a wind speed over 20 m/s, with one typhoon having a wind speed over 30 m/s (Table 1). The mean wind speed and average wind direction at a basic time interval of 10 min were obtained by analysing the measured data (Figure 5). Table 2 shows the maximum mean wind speed in each wind direction. Only data with more than 50 samples were considered, to improve the reliability of the results. Table 2 shows that the highest mean wind speed is 15.7 m/s, which occurs between 0° and 30°. These angles, which are followed by angles from 75° to 105° where the number of samples is 84, have the largest number of samples, 90. Table 2 shows that the mean wind speed decreases with the increase in angles, which is consistent with the law of wind field changes before and after a typhoon landing. The measured results show that the typhoons that affected Wenzhou during 2014–2016 were dominated by wind from the east, northeast and northwest with inflow directions that were mainly concentrated in three directions, namely, 0°–30°, 75°–105° and 300°–360°.
5. Structural Dynamic Characteristics
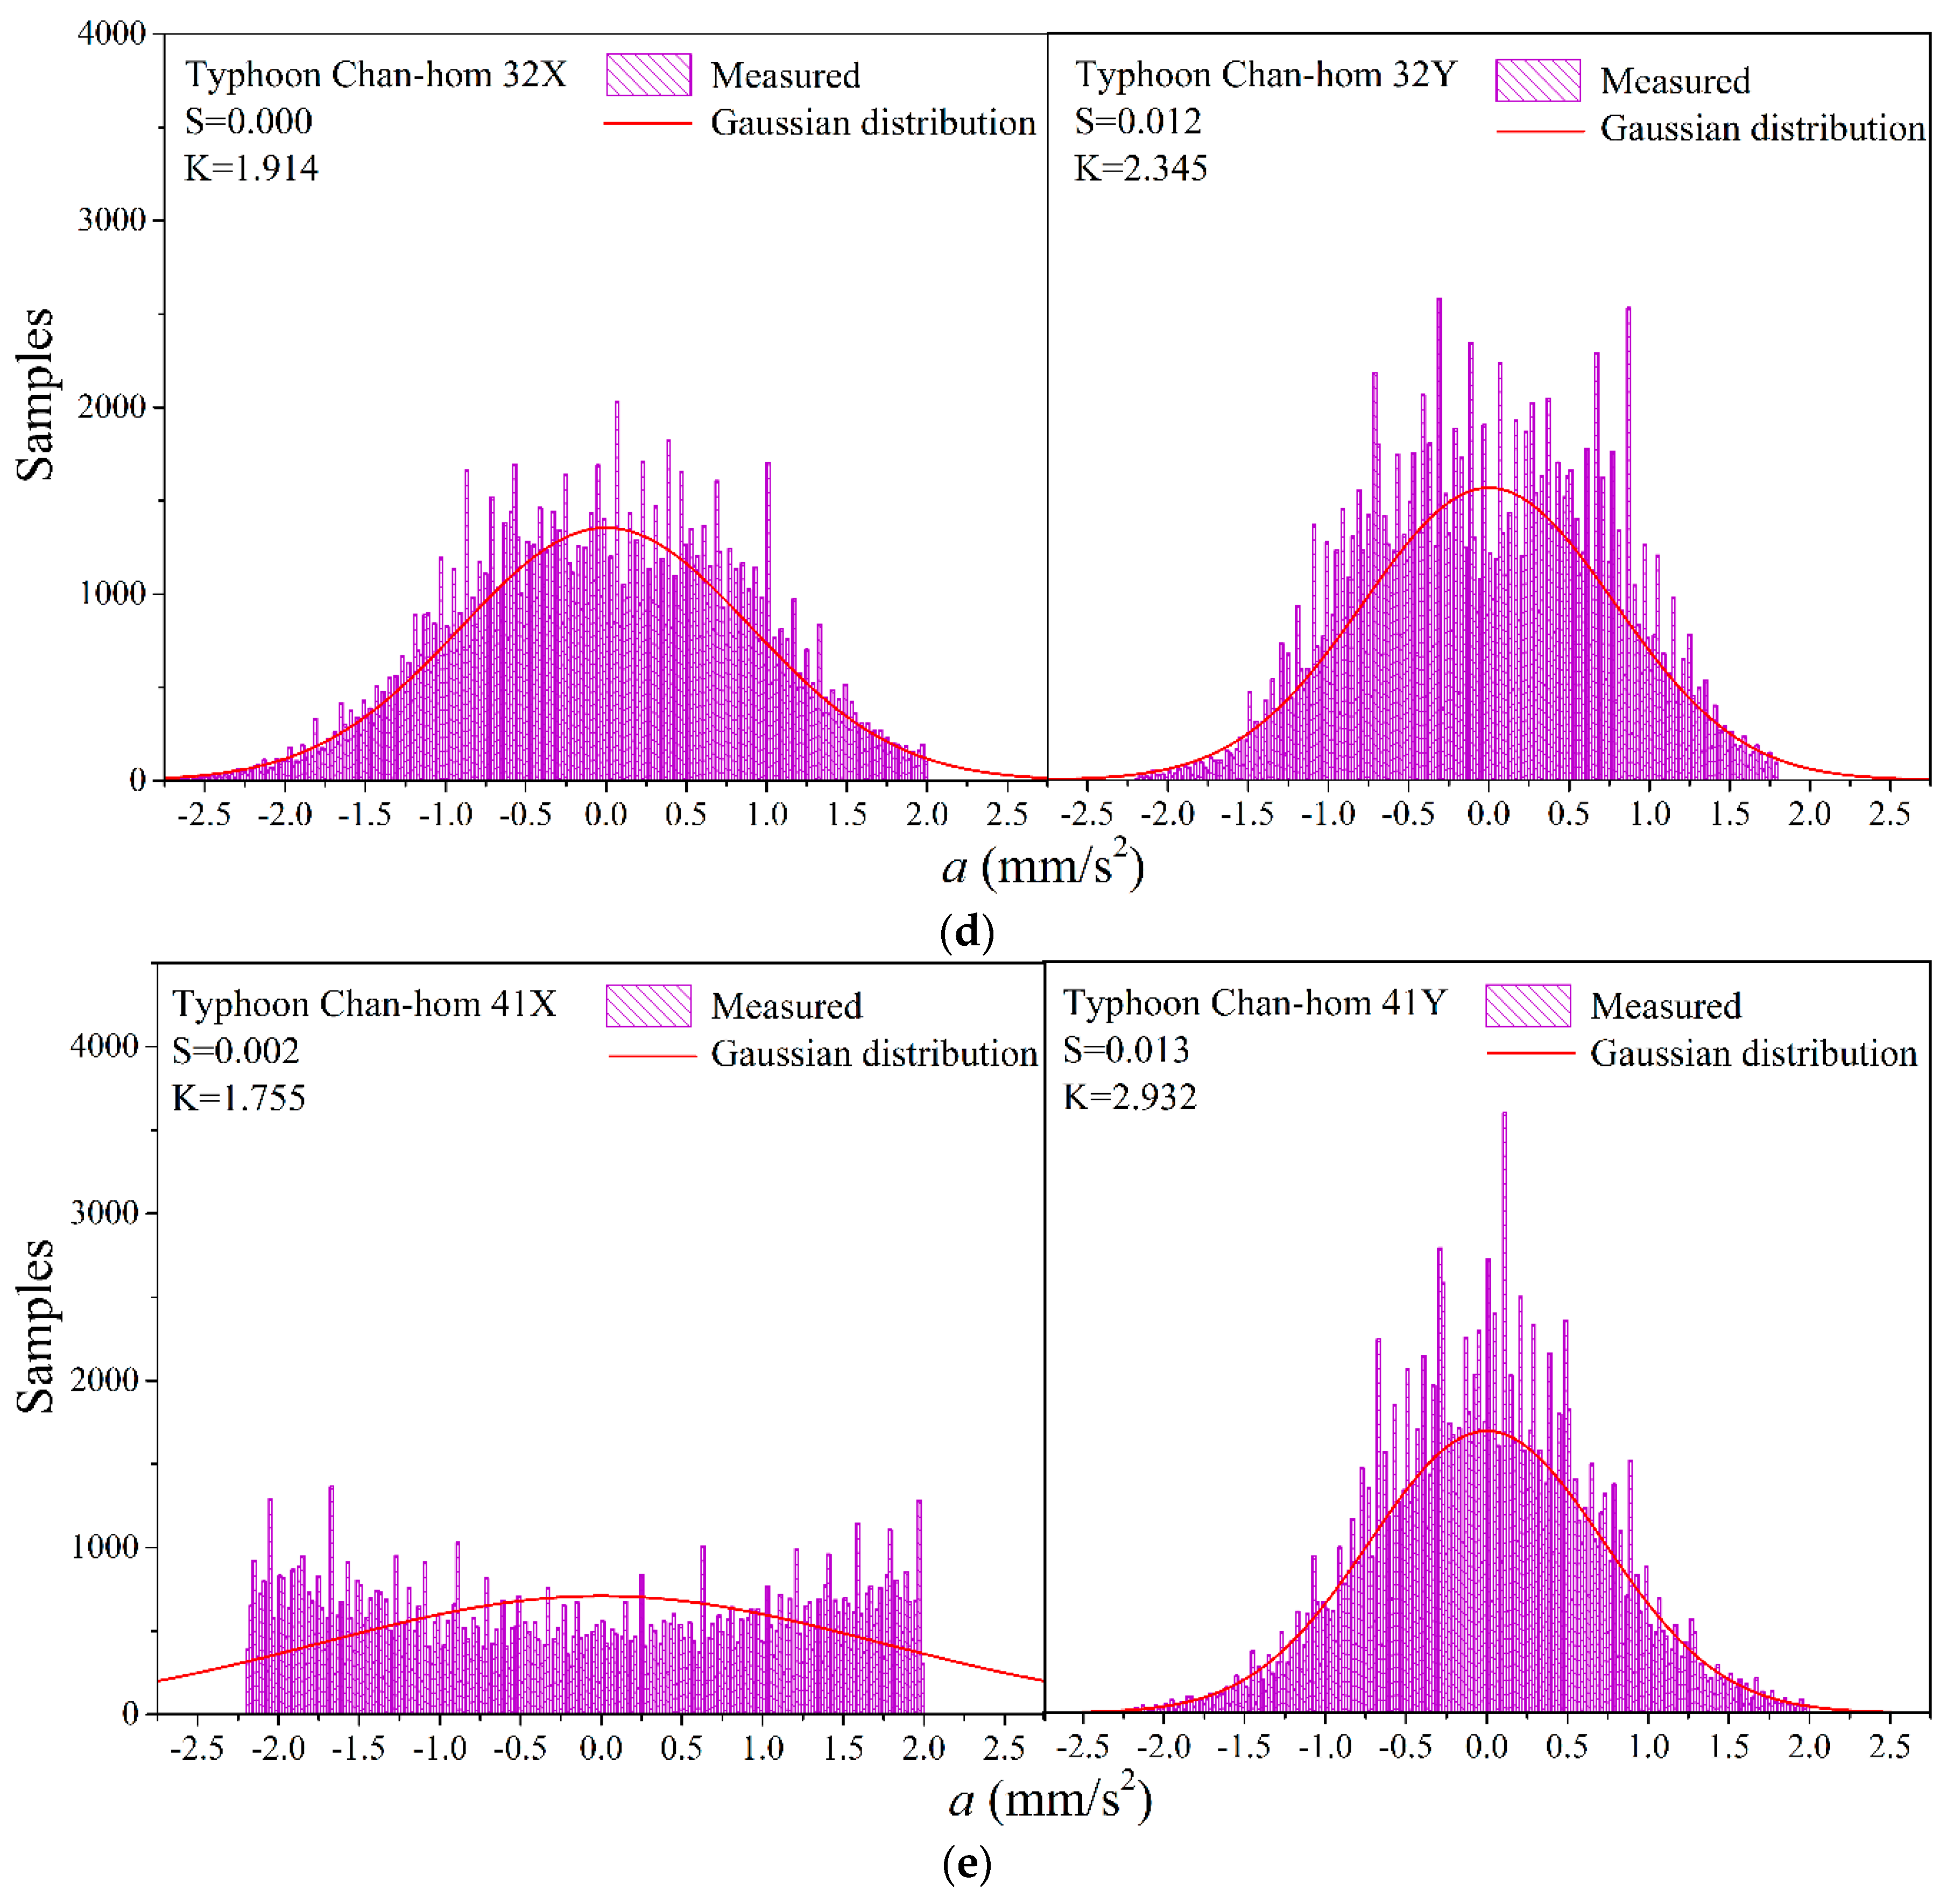
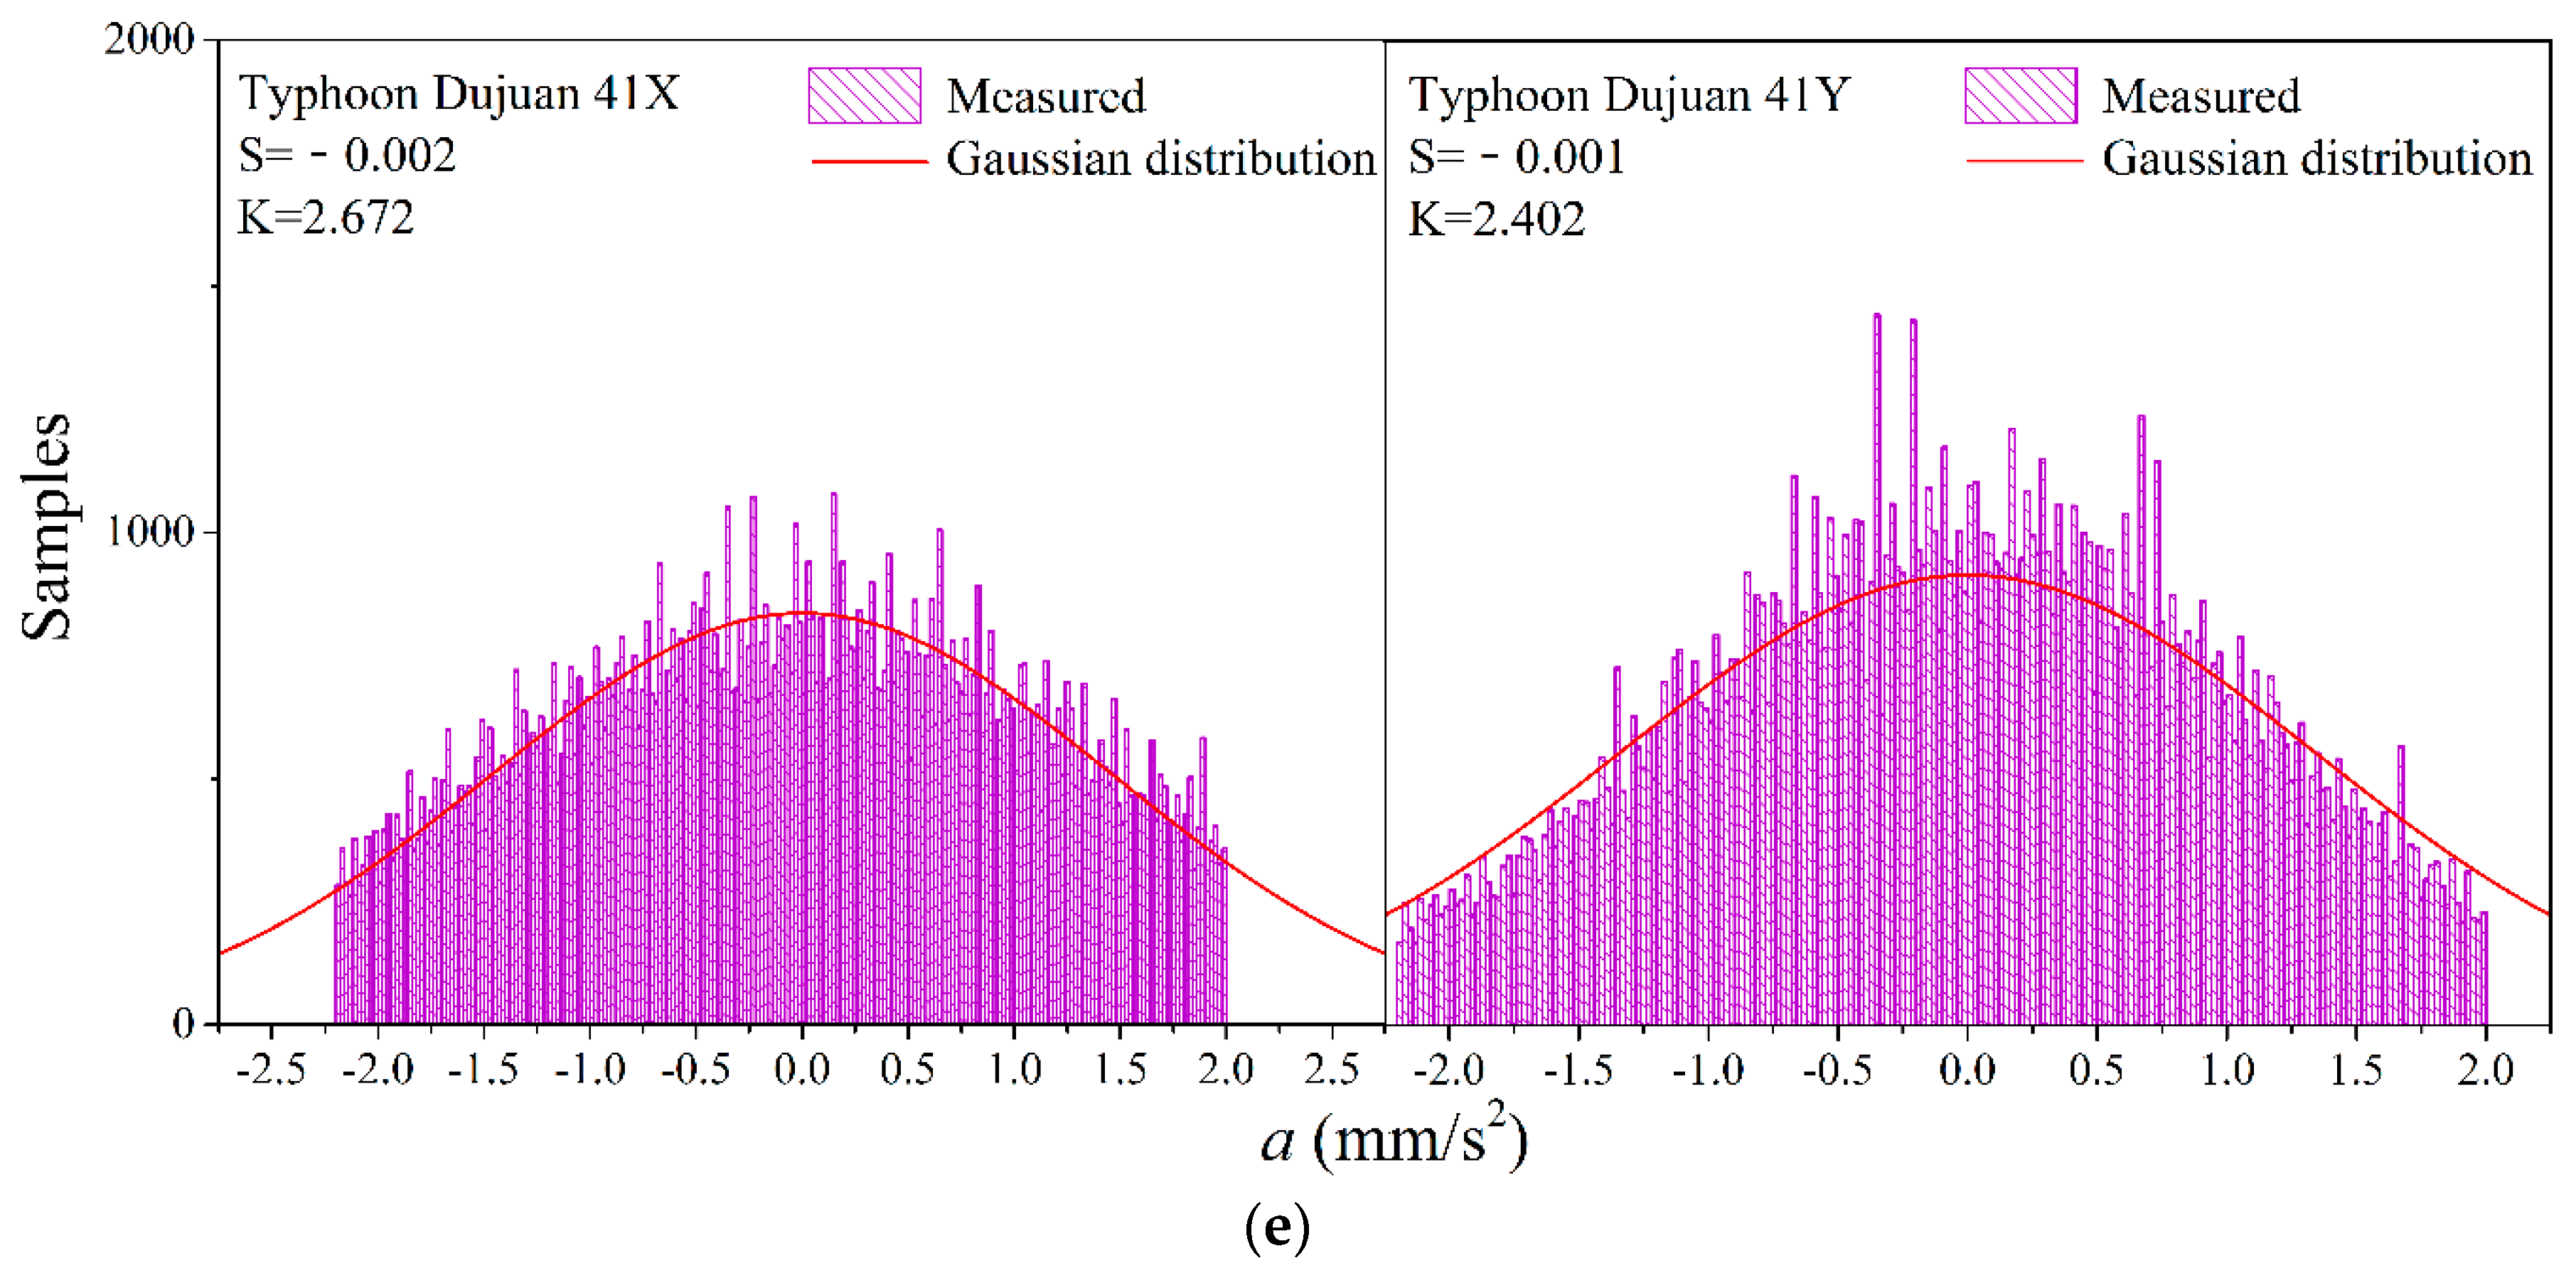
5.1. Acceleration Probability Density
The structural acceleration response is a main indicator in evaluating the comfort level of high-rise building occupants. Studying the probability distribution characteristics of the measured acceleration is important for the structural design. The acceleration probability density distribution is commonly described by two statistical characteristics, namely, the skewness and kurtosis coefficients. The Gaussian distribution is met when the skewness coefficient is zero and the kurtosis coefficient is three. Table 3 shows the mean values of the skewness and kurtosis coefficients of the measured acceleration data of the five measuring points under three typhoons. Figure 6, Figure 7 and Figure 8 show the acceleration probability distribution along the X and Y directions of the five layers during Typhoons Fung-wong, Chan-hom and Dujuan, respectively. Figure 9 shows the relationship between the measured acceleration skewness and the kurtosis coefficients. The kurtosis coefficient of Typhoon Fung-wong is large, whereas the measured acceleration skewness coefficients of Typhoons Chan-hom and Dujuan are close to 0, and their kurtosis coefficients are close to 3. This finding is consistent with the Gaussian distribution.
5.2. Natural Frequency
The natural frequency is an important parameter that describes the dynamic characteristics of a structure. The accurate evaluation of a structure’s natural frequency is important to the wind-resistant design of super high-rise buildings. Eills [20] provided an evaluation equation for the natural frequency of high-rise building structures on the basis of the measured results of multi-story building structures:
where H is the height of the structure (m).
This empirical equation has been adopted by building codes in many countries and regions. In recent years, Tamura and Suganuma [21] provided a prediction equation for the natural frequency of vibration of high-rise steel–concrete composite and concrete structures on the basis of many on-site measurements conducted in Japan:
where H is the height of the structure (m).
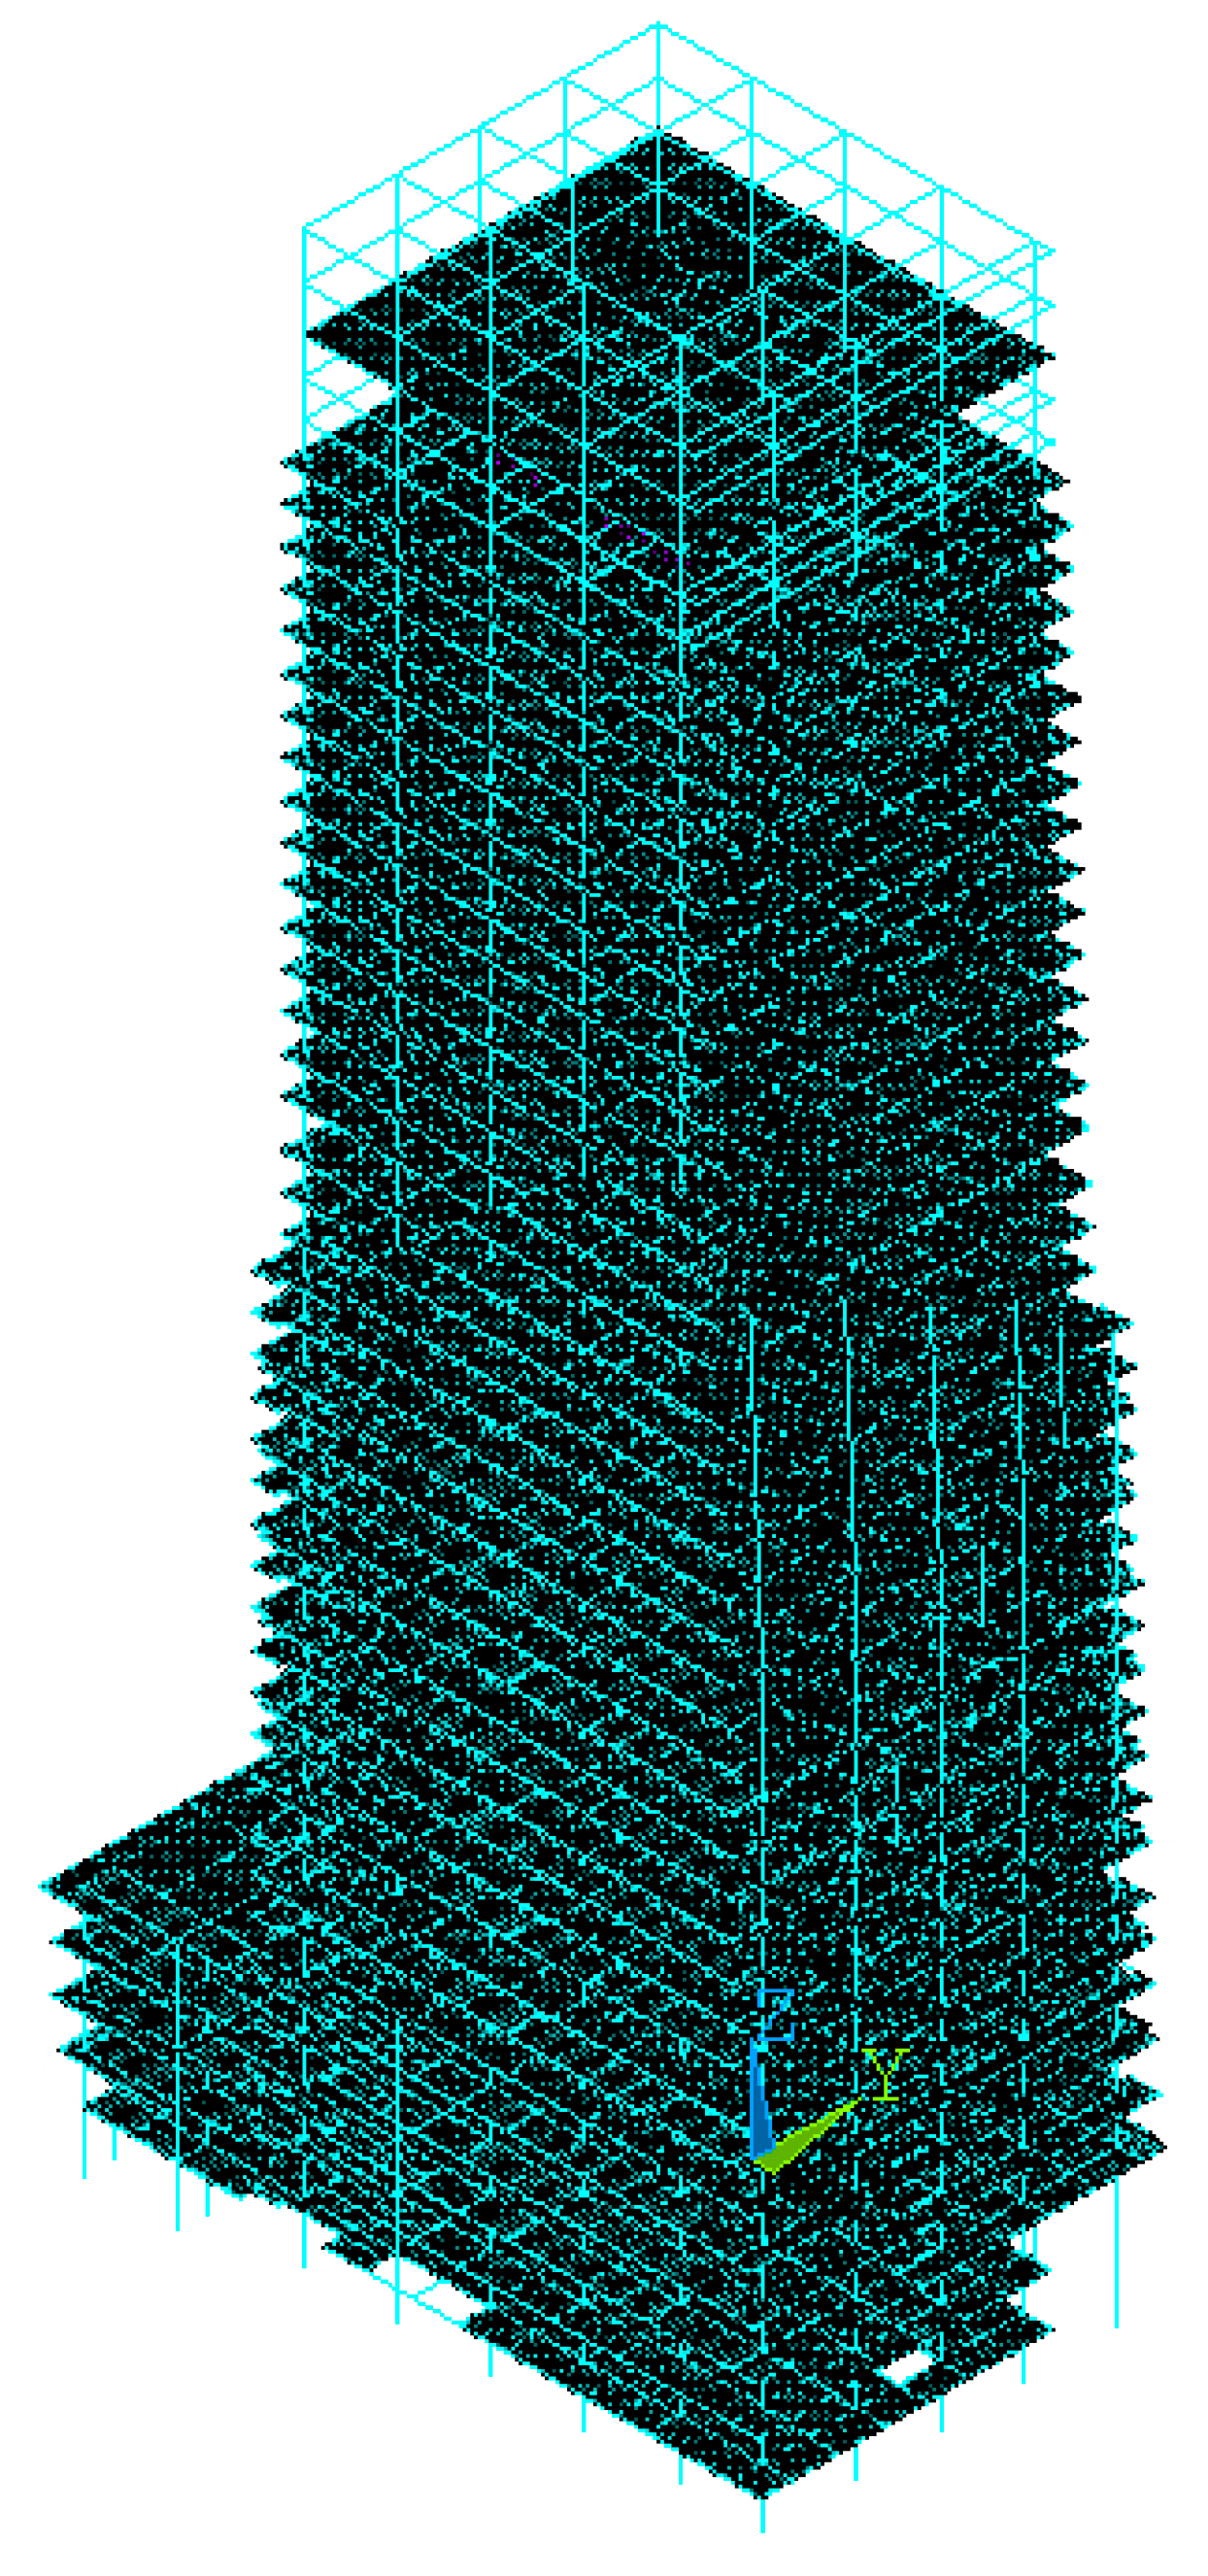
A finite element modelling of the measured high-rise building structure was conducted using ANSYS finite element software. The geometry of model components is taken from design drawings. BEAM188 three-dimensional beam elements are used to simulate the beams and columns. Floor slabs and shear walls contain two kinds of shell elements. A part of the shear walls with axial offsets are simulated by the three-dimensional shell unit SHELL181, and the rest are simulated by the SHELL63 elastic shell unit. Infilled walls used for separation and enclosing during modelling are established by increasing the density of the slabs, mainly taking into account its influence on the quality of the models. If the whole structure is rigidly connected to the ground, then the bottom constraint of the finite element model adopts a clamp-supported constraint. Figure 10 shows the finite element analysis model. A subspace iteration method is used for the modal calculation, and the results of the first three orders of the translational analysis of the high-rise buildings are identified from the extended 16th-order mode (Figure 11).
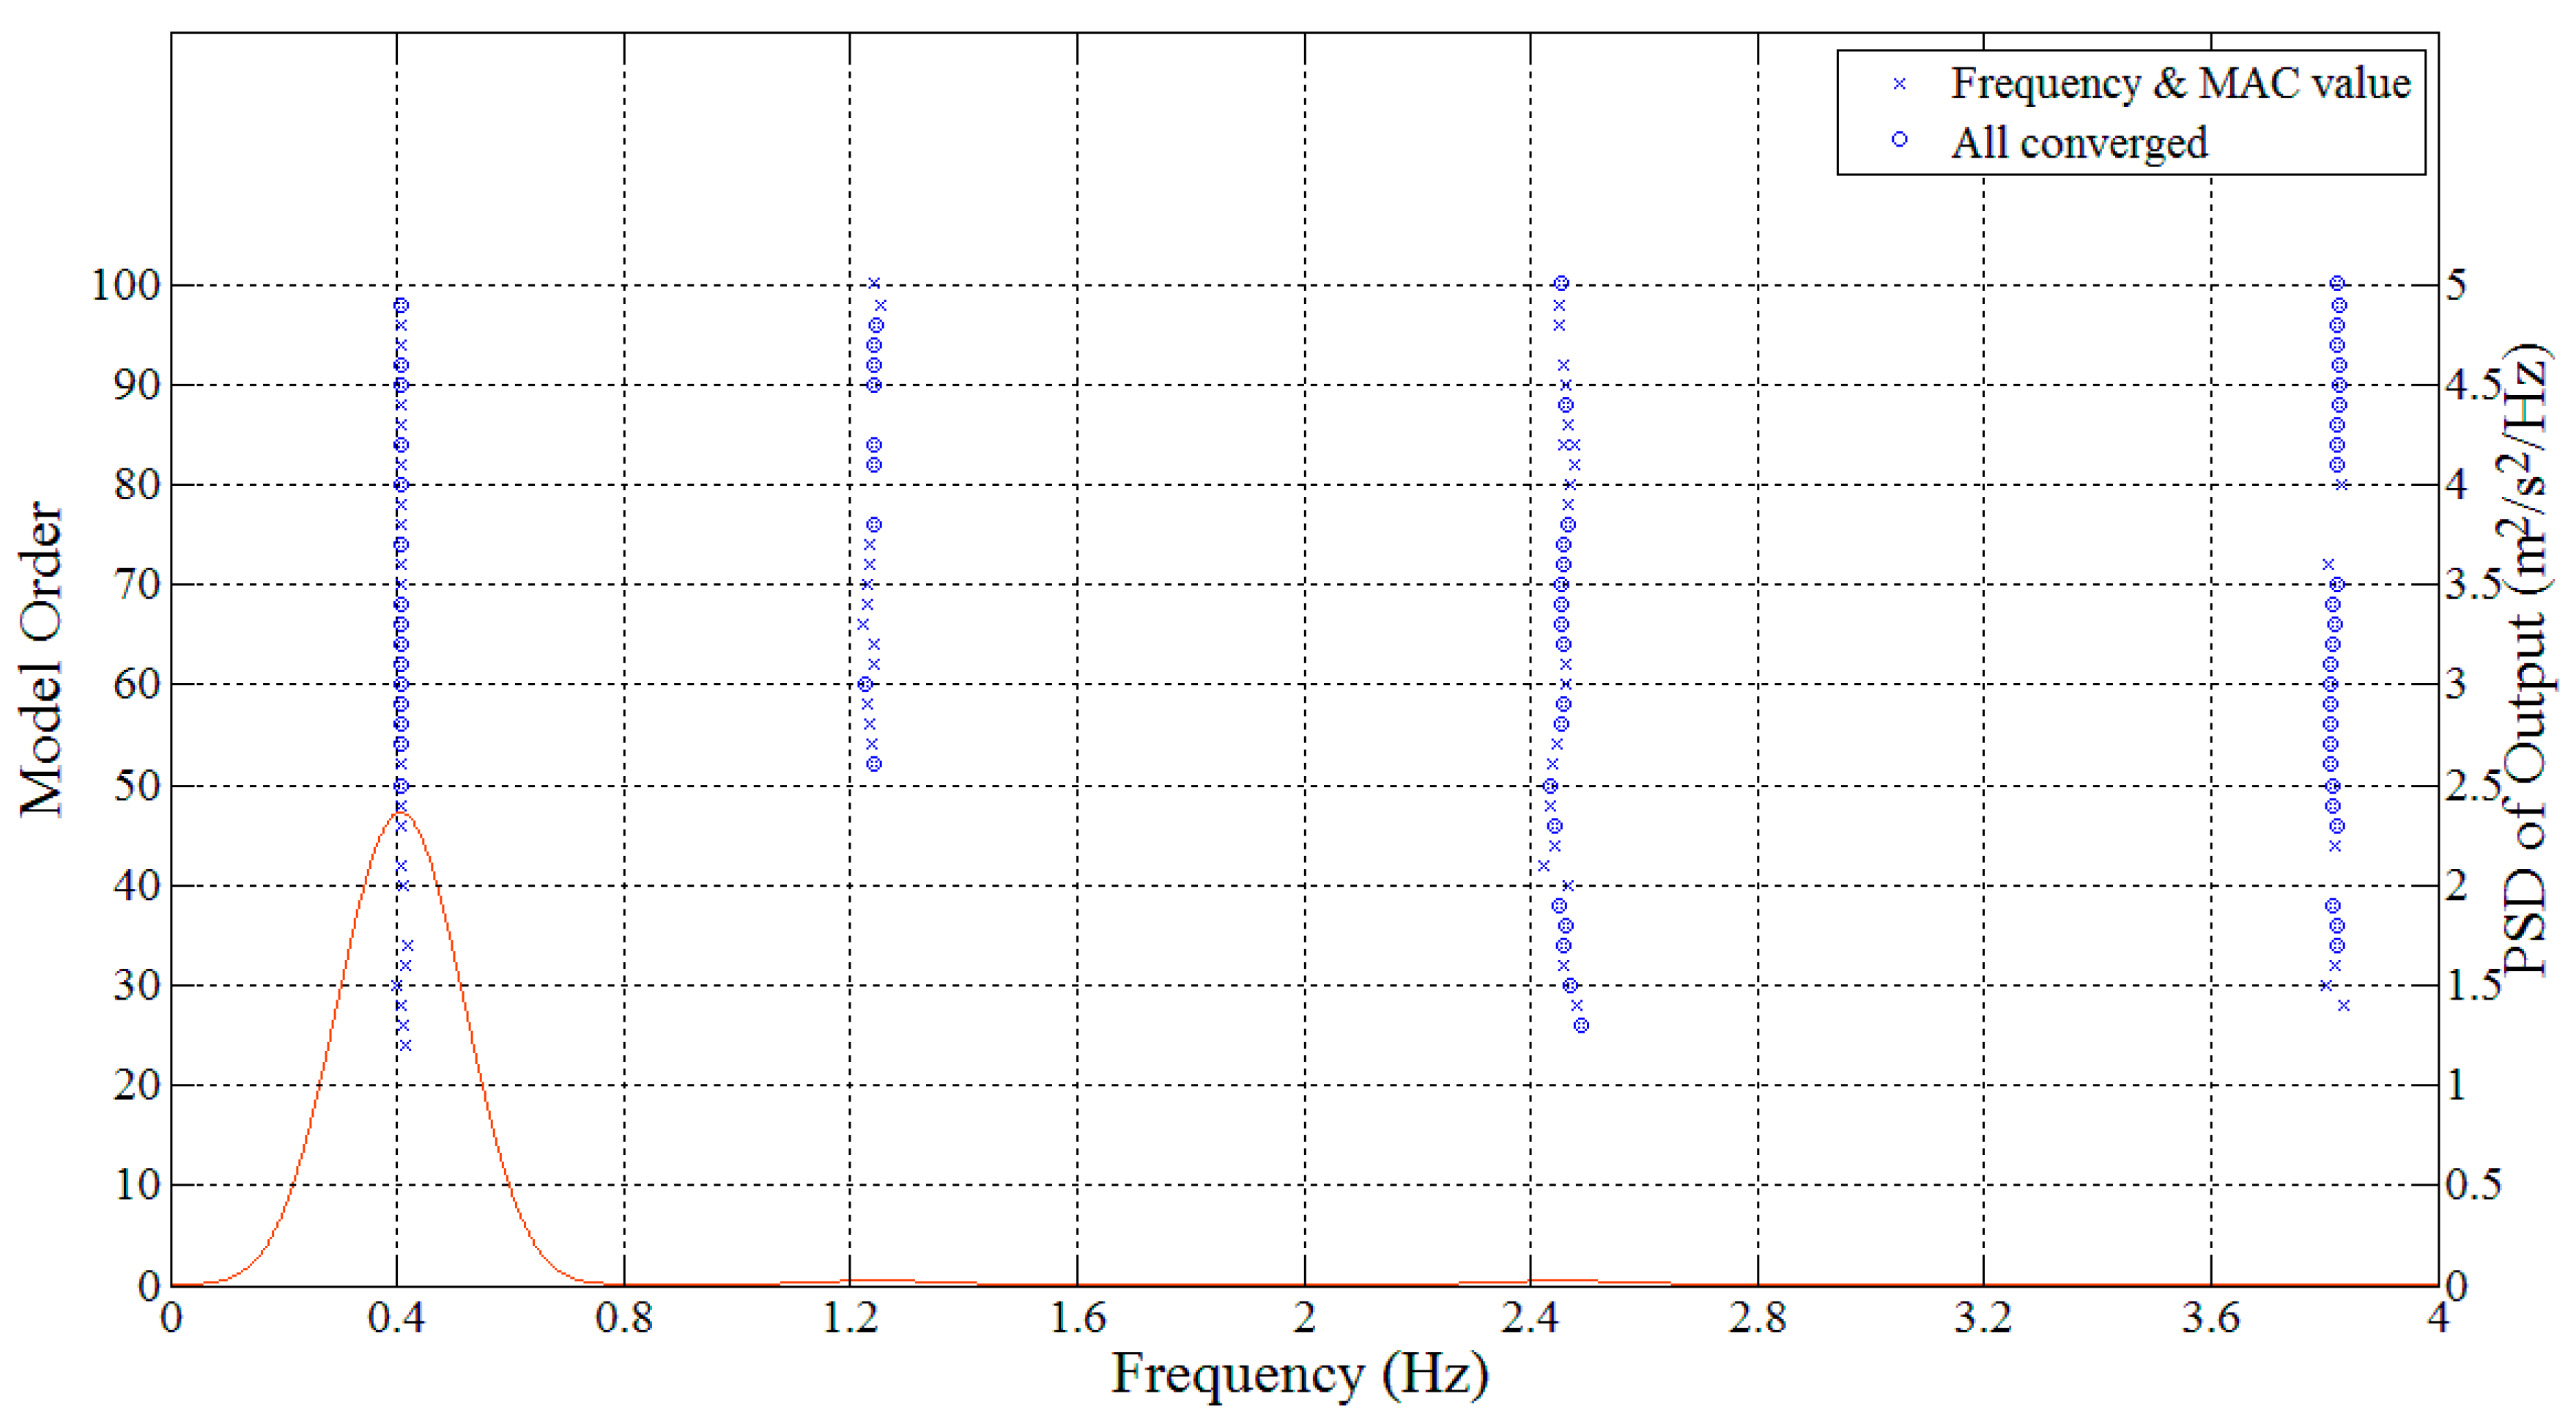
A comparison of Equations (12) and (13) shows that Tamura and Suganuma’s empirical equation gives relatively high evaluation results. The data of the mean wind speed of 14.5 m/s during Typhoon Dujuan are selected as the sample. Figure 12 shows the cross-correlation function between the two measuring points calculated by the NExT-AVG method. Figure 13, Figure 14, Figure 15, Figure 16 and Figure 17 show the power spectral density function and stabilisation graph of the measured acceleration response. The analysis results show that the high-order frequency of the structure can also be identified, but the vibration of super-high-rise buildings in both directions is still dominated by the first-order frequency under the action of typhoons.
Table 4 shows the natural frequency of vibration of the structure calculated and measured by a finite element model. The measured natural vibration frequency difference between the two methods reaches up to 1.286%, thereby proving the reliability of the NExT-AVG-ERA method. The measured values, except for the torsional mode, are larger than the finite element analysis results, as indicated by a comparison with the calculation results of the finite element model, because (1) the auxiliary components neglected in the finite element modelling participate in the actual structure, thereby improving the integral rigidity of the structure; and the (2) structural design live load does not reach full load during the field testing, thereby causing the actual load of the structure to be less than the total load in the finite element.
The structural height of the test building is 168 m, and the basic natural frequencies, calculated based on the Eills, and Tamura and Suganuma equations, are 0.273 and 0.399, respectively. The analysis results in Table 4 show that the first-order natural frequencies of the test building are 0.390 and 0.409, which is in good agreement with Tamura’s prediction results.
5.3. Damping Ratio
The damping ratio is an important parameter used to describe the energy dissipation capacity of a structure, and it is a key factor that affects the wind-induced vibration response of high-rise buildings. In general, prototype measurements are the most reliable method for obtaining structural damping ratios. In this study, the measured data are processed by the NExT-AVG-ERA method, and Table 5 shows the results. Notably, the second-order damping in both directions is the largest when typhoons, such as Typhoons Chan-hom and Dujuan, are northwesterly. The third-order damping in both directions is the largest when typhoons, such as Typhon Dujuan, are easterly. The first-order damping ratios of the three typhoons are less than their corresponding high-order damping test results.
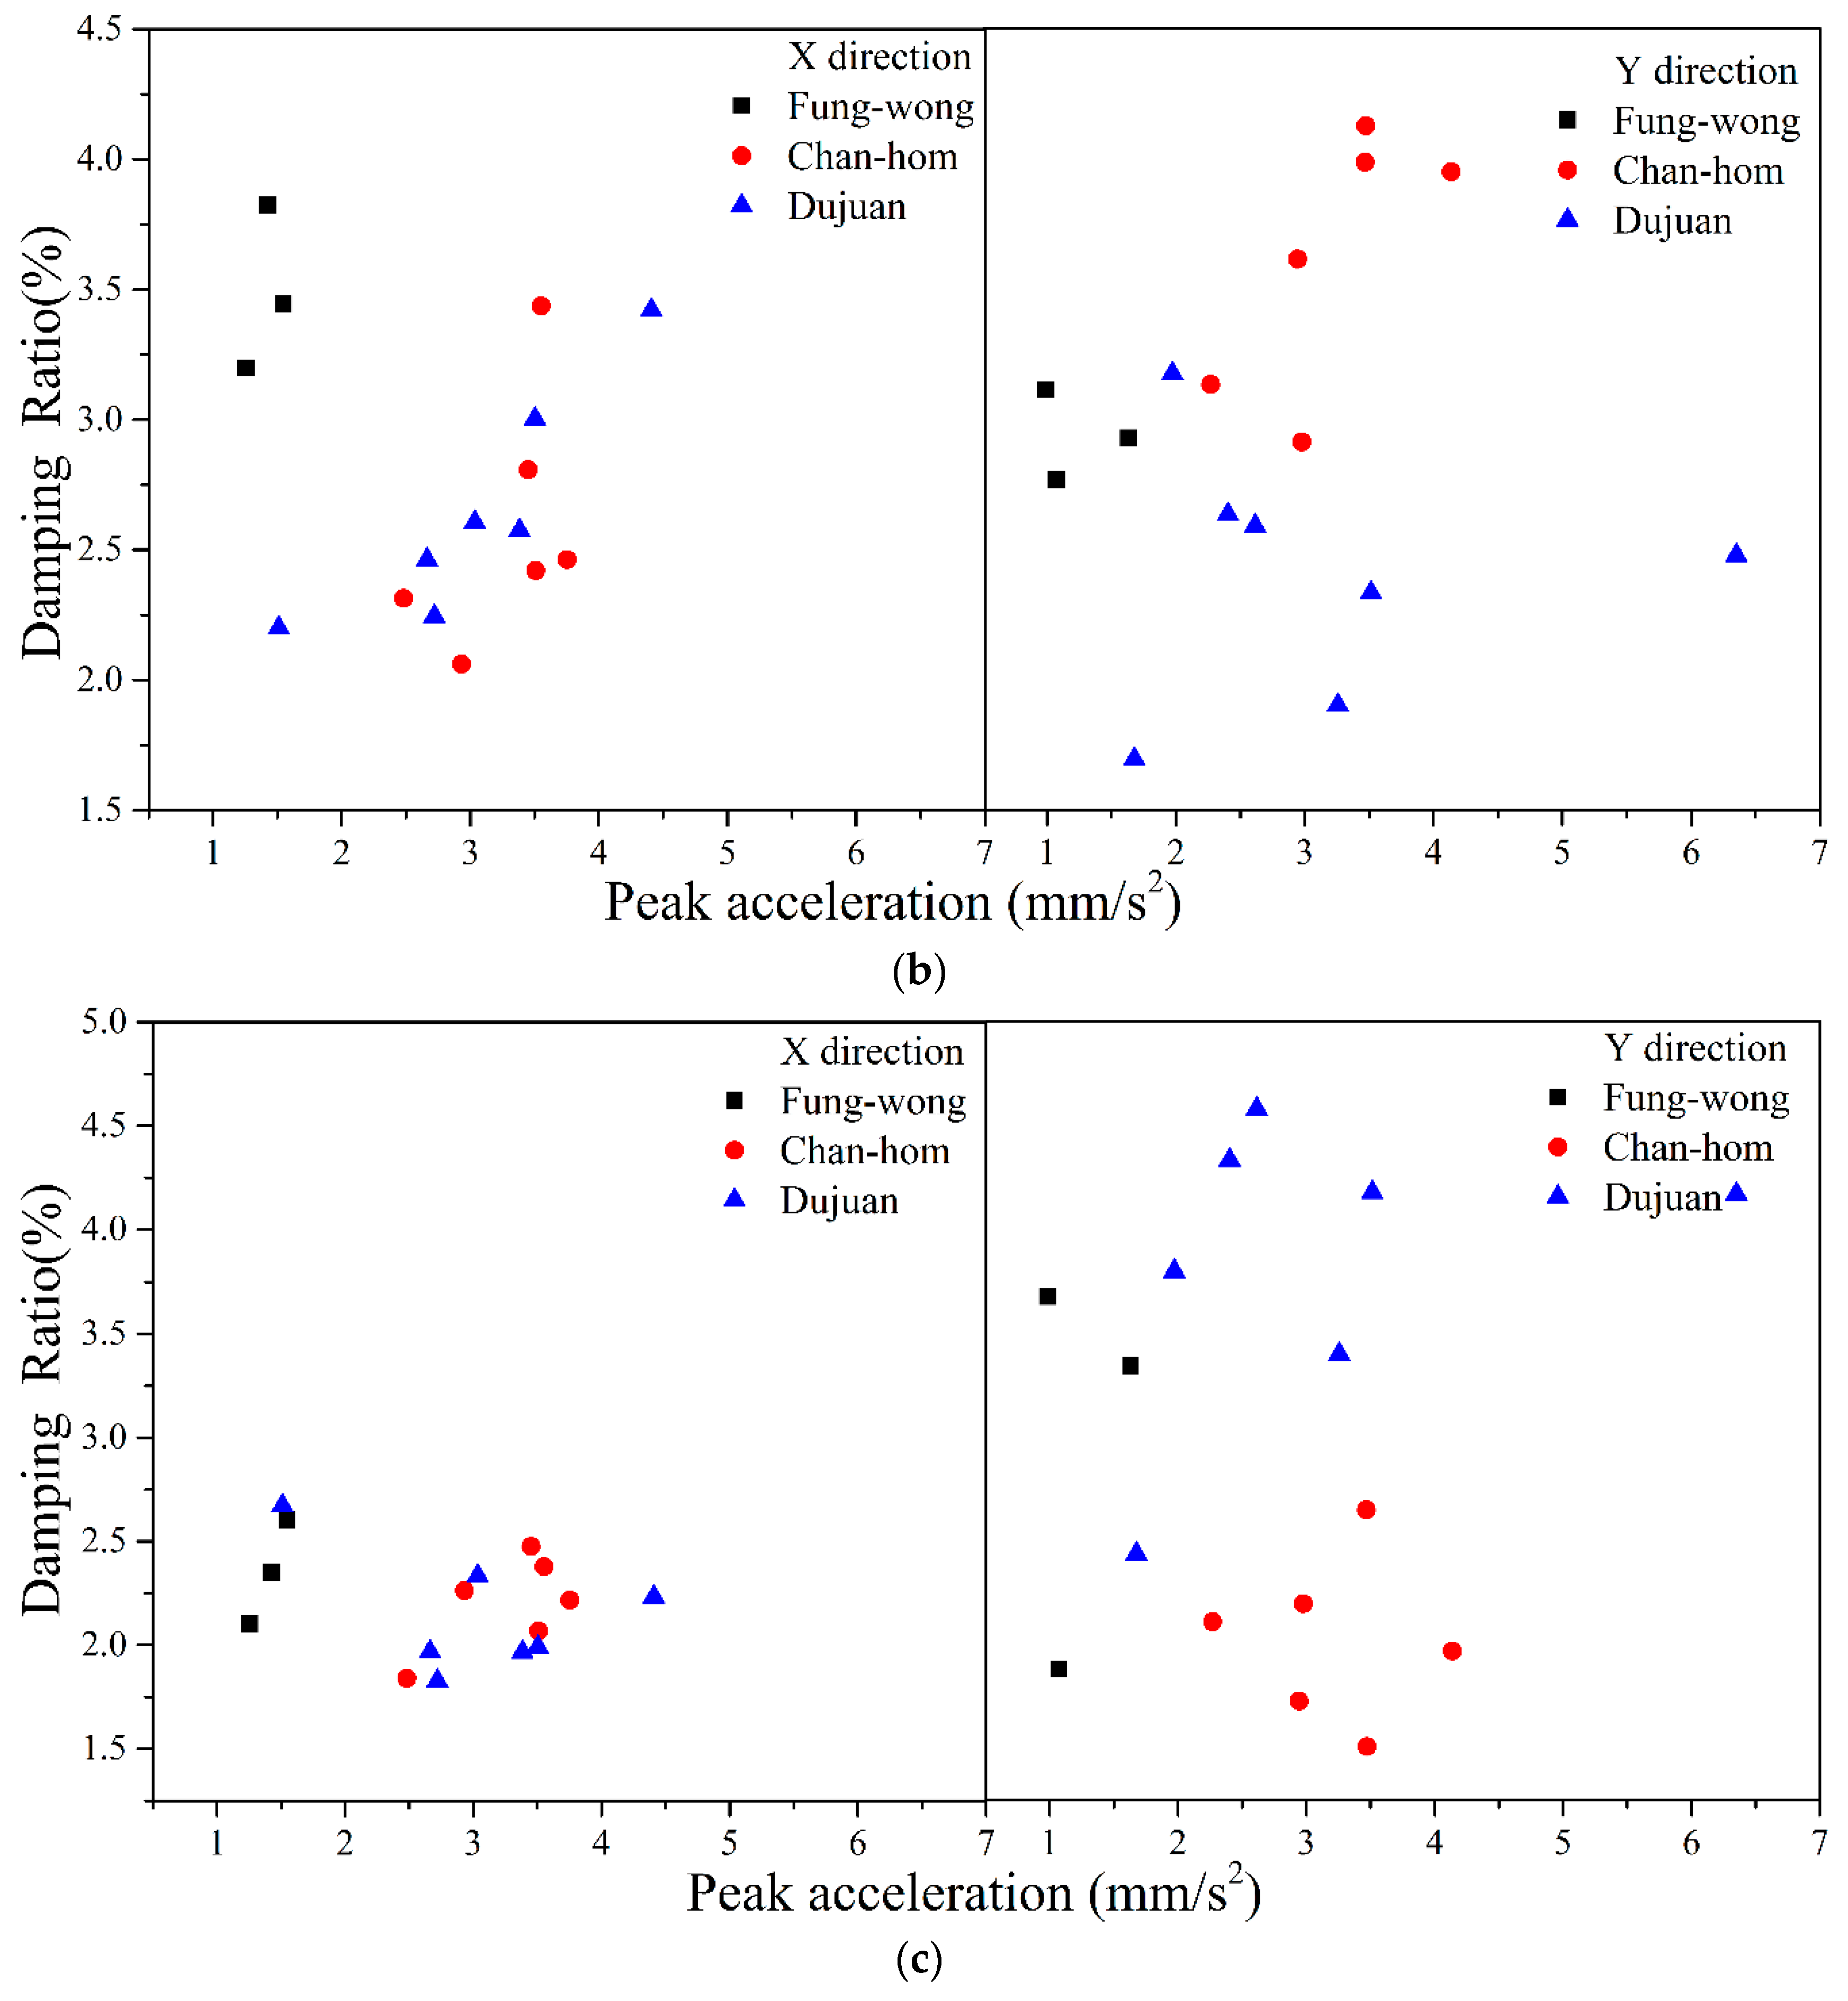
Li et al. [1] and Kim et al. [8] have shown that the damping performance of buildings exhibits nonlinear characteristics, and the structural damping ratio generally shows an increasing trend with a rise in amplitude. Figure 18 shows the changing curve of the damping ratio of the structural vibration mode obtained with the NExT-AVG-ERA method with the peak acceleration response of 41 layers. The first-, second- and third-order damping ratios of the structure during Typhoons Chan-hom and Dujuan increased with the peak acceleration, whereas the damping under Typhoon Fung-wong remained almost unchanged. The reason for this is that the measured acceleration amplitude during Typhoon Fung-wong is small without exceeding the lower critical value, and the damping is at a stable state. However, during Typhoons Chan-hom and Dujuan, the acceleration amplitude of the structure is large without reaching the upper critical value. Thus, damping increases with the amplitude, and the results are basically the same as those of Li et al. [1] and Kim et al. [8].
6. Wind-Induced Response Analysis
6.1. Acceleration Response
The relationship between the structural acceleration response and wind speed is a subject of concern among wind engineering researchers. This paper analyses the relationship between the measured acceleration and average wind speed under typhoons by taking Typhoons Chan-hom and Dujuan as the research objects (Figure 19). The figure also shows the fitting curves based on the measured data, with a fitting equation of:
where represents the root mean square (RMS) of the acceleration, is the 10 min mean wind speed at the top of the building and , are the fitting parameters.
Figure 19 shows that the root mean square of the acceleration response of the building structure during Typhoons Chan-hom and Dujuan increases with the wind speed, but that the increase rate of Typhoon Chan-hom is smaller because the angle between the incoming flow and the building is 45°, and because the acceleration response in the downwind and crosswind directions is not obvious. Table 6 shows that the fitting indexes of Typhoon Chan-hom are small, indicating a non-obvious dynamic response from this angle. The fitting indexes of the two directions of Typhoon Dujuan are at the same level, which is up to 1.634. Thus, the crosswind dynamic response should be considered in the design of high-rise buildings.
6.2. Acceleration Response
High-rise buildings can generate vibrations under the wind load. When the vibrations exceed a certain limit, occupants can feel uncomfortable. This phenomenon is known as the occupant comfort problem. Johann et al. [22] and Li et al. [23] have shown that factors that affect human comfort mainly include the vibration amplitude and frequency. When these two factors form a certain relationship, human bodies will feel uncomfortable. Many standards are applied for the measuring human comfort level. However, the most recognised standard is the use of the acceleration response amplitude. Therefore, many experts and specifications have given the calculation methods and limit values of the structural acceleration. The international standard organization (ISO 6897:1984) [24] for buildings with a frequency of 0.063~1.0 Hz, under a wind load with a return period of 5 years, gives the comfort limit value related to the natural vibration frequency in a horizontal direction:
where is the root mean square of the acceleration in the x direction and the y direction, respectively, and is the first-order frequency of the building in the x direction and the y direction, respectively. and can be calculated according to Equation (15):
We take into account the fact that the acceleration in the X and Y directions contributes to the motion of the building. Take AA as:
ISO suggests that, after considering the reduction factor of 0.72, Equation (18) can be used as the standard for the RMS acceleration limits of buildings under wind over a one-year recurrence period, and the one-year return period is .
To assess the comfort level of a building structure under typhoons, the recurrence period of a typhoon’s wind power needs to be determined first, according to the equation of the relationship between the basic wind pressure and speed:
where is the basic wind pressure, is the unit weight of air, . is the acceleration of gravity, , and is the basic wind speed.
The China Load Code (GB 5009-2012) indicates the basic wind pressures for the 10-, 50- and 100-year recurrence periods of the test building, which are 0.35, 0.6 and 0.7 kPa, respectively. The basic wind speeds of other recurrence periods T are calculated according to the following equation:
where is the basic wind speed of the recurrence period T, is the 10-min average wind speed at a height z, is the 10-min average wind speed at a height of 10 m, is the ground roughness index and .
The maximum mean wind speeds of Typhoons Chan-hom and Dujuan, measured in 10 min at a height of 177 metres, are 12.0 and 14.9 m/s, respectively. The wind recurrence periods of Typhoons Chan-hom and Dujuan are 0.18 and 0.25 years, respectively, which are both less than one year.
The maximum values of the 41-layer peak acceleration during Typhoons Chan-hom and Dujuan are 4.139 mm/s2 (Y-direction) and 6.351 mm/s2 (Y-direction), which are less than the limits of the corresponding specifications, respectively. The measurement results show that the working environment of the staff at the top of the building during the two typhoons meets comfort requirements.
7. Conclusions
This paper simultaneously measures the wind characteristics on the roof and the acceleration responses of the 10th, 18th, 25th, 32nd and 41st floors of a high-rise building in Wenzhou during the passing of a typhoon between 2014 and 2016. It also analyses the dynamic characteristics and wind-induced response of buildings by using the Welch and improved NExT-ERA methods. The results indicate the following:
(1) According to the test results, strong typhoons frequently affect Wenzhou. Thus, the wind load mainly controls loads for high-rise building designs in Wenzhou. The measurement results show that the typhoons that occurred in Wenzhou from 2014 to 2016 were dominated by winds from the east, northeast and northwest, with inflow directions that were mainly concentrated in three directions, namely, 0°–30°, 75°–105° and 300°–360°, respectively.
(2) The measured acceleration skewness coefficients of Typhoons Chan-hom and Dujuan are close to 0, and their kurtosis coefficients are close to 3, which is consistent with the Gaussian distribution.
(3) The Welch and NExT-AVG-ERA methods measured the natural vibration frequency difference between the two methods, which reached up to 1.286%, thereby proving the reliability of the NExT-AVG-ERA method. The measured values, except for the torsional mode, are larger than the finite element analysis results, as indicated by a comparison with the calculation results of the finite element model. The first-order natural vibration frequencies of the test building are between 0.390 and 0.409, which is in good agreement with Tamura’s prediction results.
(4) The second-order damping in both directions is the largest for northwesterly typhoons, such as Typhoons Chan-hom and Dujuan. The third-order damping in both directions is the largest when a typhoon, such as Typhoon Dujuan, is easterly. The first-order damping ratios of the three typhoons are less than their corresponding high-order damping test results.
(5) The damping performance of buildings has obvious nonlinear characteristics, and the structural damping ratio generally shows an increasing trend with the amplitude. The first-, second-, and third-order damping ratios of the structure during Typhoons Chan-hom and Dujuan increase with the peak acceleration, whereas the damping during Typhoon Fung-wong remains almost unchanged.
(6) The root mean square of the acceleration response of the building structure during Typhoons Chan-hom and Dujuan increases with the wind speed. However, the increase rate of Typhoon Chan-hom is small because the angle between the incoming flow and the building is 45°, and because the acceleration response in the downwind and crosswind directions is not obvious. Table 6 shows that the fitting indexes of Typhoon Chan-hom are small, indicating a non-obvious dynamic response from this angle. The fitting indexes of the two directions of Typhoon Dujuan are at the same level, which is up to 1.634. Thus, the crosswind dynamic response should be considered in the design of high-rise buildings.
(7) The measurement results show that the working environment of the staff at the top of the building under the two typhoons meets comfort requirements.
Author Contributions
C.W. conceived, designed, collected and analyzed data, wrote and revised the paper; Z.L. finalized the manuscript and provided the funding; L.H. and Q.L. contributed in the results and discussions and solution; Z.Z. contributed to the English; J.H. and X.Z. collected and analyzed data.
Funding
This work is financially supported by the National Natural Science Foundation of China with Grant No. 51478179 and No. 51678233.
Conflicts of Interest
The authors declare no conflict of interest.
References
- Li, Q.S.; Xiao, Y.Q.; Fu, J.Y.; Li, Z.N. Full-scale measurements of wind effects on the Jin Mao building. J.Wind Eng. Ind. Aerodyn. 2007, 6, 445–466. [Google Scholar] [CrossRef]
- Au, S.K.; Ping, T. Full-scale validation of dynamic wind load on a super-tall building under strong wind. J. Struct. Eng. 2012, 9, 1161–1172. [Google Scholar] [CrossRef]
- Bashor, R.; Bobby, S.; Kijewski-Correa, T.; Kareem, A. Full-scale performance evaluation of tall buildings under wind. J.Wind Eng. Ind. Aerodyn. 2012, 5, 88–97. [Google Scholar] [CrossRef]
- Wang, Z.; Chen, G. Analytical mode decomposition with Hilbert transform for modal parameter identification of buildings under ambient vibration. Eng. Struct. 2014, 2, 173–184. [Google Scholar] [CrossRef]
- He, Y.C.; Li, Q.S. Time–frequency analysis of structural dynamic characteristics of tall buildings. Struct. Infrastruct. Eng. 2015, 8, 971–989. [Google Scholar] [CrossRef]
- Li, Q.S.; Yi, Y. Monitoring of dynamic behaviour of super-tall buildings during typhoons. J. Struct. Infrastruct. Eng. 2016, 3, 289–311. [Google Scholar] [CrossRef]
- He, Y.H.; Han, X.L.; Li, Q.S.; Zhu, H.P.; He, Y.C. Monitoring wind effects of a landfall typhoon on a 600 m high skyscraper. Eng. Struct. 2018, 167, 308–326. [Google Scholar] [CrossRef]
- Kim, W.; Yoshida, A.; Tamura, Y.; Yi, J.H. Experimental study of aerodynamic damping of a twisted supertall building. J. Wind Eng. Ind. Aerod. 2018, 176, 1–12. [Google Scholar] [CrossRef]
- Wang, C.Q.; Li, Z.N.; Luo, Q.Z.; Hu, L.; Zhao, Z.F.; Hu, J.X.; Zhang, X.W. Wind Characteristics Investigation on The Roofs of Three Adjacent High-Rise Buildings in a Coastal Area during Typhoon Meranti. Appl. Sci. 2019, 3, 367. [Google Scholar] [CrossRef]
- Vickery, B.J.; Steckley, A. Aerodynamic damping and vortex excitation on an oscillating prism in turbulent shear flow. J.Wind Eng. Ind. Aerodyn. 1993, 1–3, 121–140. [Google Scholar] [CrossRef]
- Kareem, A.; Gurley, K. Damping in structures: Its evaluation and treatment of uncertainty. J. Wind Eng. Ind. Aerodyn. 1996, 2–3, 131–157. [Google Scholar] [CrossRef]
- Cooper, K.R.; Nakayama, M.; Sasaki, Y.; Fediw, A.A.; Resende-lde, S.; Zan, S.J. Unsteady aerodynamic force measurements on a super-tall building with a tapered cross section. J. Wind Eng. Ind. Aerodyn. 1997, 2, 199–212. [Google Scholar] [CrossRef]
- Li, Q.S.; Xiao, Y.Q.; Wong, C.K. Full-scale monitoring of typhoon effects on super tall buildings. J. Fluids Struct. 2005, 5, 697–717. [Google Scholar] [CrossRef]
- Jeary, A.P. The Damping Parameter as a Descriptor of Energy Release in Structures; Structural Engineers World Congress: San Francisco, CA, USA, 1998; pp. 8–9. [Google Scholar]
- Tamura, Y. Amplitude dependency of damping in buildings and critical tip drift ratio. Int. J. High-Rise Build. 2012, 1, 1–13. [Google Scholar]
- Li, Q.S.; Li, X.; He, Y.; Yi, J. Observation of wind fields over different terrains and wind effects on a super-tall building during a severe typhoon and verification of wind tunnel predictions. J. Wind Eng. Ind. Aerod. 2017, 162, 73–84. [Google Scholar] [CrossRef]
- Huang, Y.J.; Gu, M.; Huang, Z.F. Field Measurement of Wind and Acceleration on Shanghai World Financial Center. J. Tongji Univ. (Nat. Sci.) 2017, 6, 821–826. [Google Scholar] [CrossRef]
- Huang, M.F.; Wu, C.H.; Xu, Q.; Zhang, F.L.; Lou, W.J. Structural dynamic and aerodynamic parameters identification for a tall building with full-scale measurements. J. Vib. Shock 2017, 10, 31–37. [Google Scholar] [CrossRef]
- Xiang, H.F.; Ge, Y.J.; Zhu, L.D. Modern Theory and Practice on Bridge Wind Resistance, 1st ed.; China Communications Press: Beijing, China, 2005; pp. 82–105. [Google Scholar]
- Ellis, B.R. An assessment of the accuracy of predicting the fundamental natural frequencies of buildings and the implications concerning the dynamic analysis of structures. Proc. Inst. Civ. Eng. 1980, 3, 763–776. [Google Scholar]
- Tamura, Y.; Suganuma, S. Evaluation of amplitude-dependent damping and natural frequency of buildings during strong winds. J. Wind Eng. Ind. Aerodyn. 1996, 2–3, 1115–1130. [Google Scholar] [CrossRef]
- Johann, F.A.; Carlos, M.E.N.; Ricardo, F.L.S. Wind-induced motion on tall buildings: A comfort criteria overview. J. Wind Eng. Ind. Aerodyn. 2015, 142, 26–42. [Google Scholar] [CrossRef]
- Li, Z.N.; Hu, J.X.; Zhao, Z.F.; Wang, C.Q. Dynamic system identification of a high-rise building during Typhoon Kalmaegi. J. Wind Eng. Ind. Aerodyn. 2018, 181, 141–160. [Google Scholar] [CrossRef]
- International Organization for Standardization. Guidelines for the Evaluation of the Response of Occupants of Fixed Structures, Especially Buildings and Offshore Structures, to Low-Frequency Horizontal Motion (0.063 to 1.0 Hz); ISO 6897:1984; Int. Organization for Standardization: Geneva, Switzerland, 1984. [Google Scholar]
Figure 1.
Satellite view of the measurement point and the monitored building. (a) Diagram of the ground roughness in different directions; and (b) the actual measurements of the building and its surrounding environment.
Figure 1.
Satellite view of the measurement point and the monitored building. (a) Diagram of the ground roughness in different directions; and (b) the actual measurements of the building and its surrounding environment.

Figure 2.
The object building and monitoring system. (a) 10th floor plan; (b) 18th floor plan; (c) 25th floor plan; (d) 32nd floor plan; (e) 41st floor plan; and (f) Equipment Acquisition Information System.
Figure 2.
The object building and monitoring system. (a) 10th floor plan; (b) 18th floor plan; (c) 25th floor plan; (d) 32nd floor plan; (e) 41st floor plan; and (f) Equipment Acquisition Information System.


Figure 3.
Path of the typhoons provided by the Chinese Meteorological Administration.

Figure 4.
Sketch map of wind speeds and directions.

Figure 5.
Mean wind speed and direction.

Figure 6.
The acceleration probability density of 5 floors along the X and Y directions during Typhoon Feng-wong. (a) 10th floor; (b) 18th floor; (c) 25th floor; (d) 32th floor; and (e) 41th floor.
Figure 6.
The acceleration probability density of 5 floors along the X and Y directions during Typhoon Feng-wong. (a) 10th floor; (b) 18th floor; (c) 25th floor; (d) 32th floor; and (e) 41th floor.


Figure 7.
The acceleration probability density of 5 floors along the X and Y directions during Typhoon Chan-hom. (a) 10th floor; (b) 18th floor; (c) 25th floor; (d) 32th floor; and (e) 41th floor.
Figure 7.
The acceleration probability density of 5 floors along the X and Y directions during Typhoon Chan-hom. (a) 10th floor; (b) 18th floor; (c) 25th floor; (d) 32th floor; and (e) 41th floor.


Figure 8.
The acceleration probability density of 5 floors along the X and Y directions during Typhoon Dujuan. (a) 10th floor; (b) 18th floor; (c) 25th floor; (d) 32th floor; and (e) 41th floor.
Figure 8.
The acceleration probability density of 5 floors along the X and Y directions during Typhoon Dujuan. (a) 10th floor; (b) 18th floor; (c) 25th floor; (d) 32th floor; and (e) 41th floor.


Figure 9.
Measured acceleration skewness – kurtosis diagram. (a) Typhoon Fung-wong; (b) Typhoon Chan-hom; and (c) Typhoon Dujuan.
Figure 9.
Measured acceleration skewness – kurtosis diagram. (a) Typhoon Fung-wong; (b) Typhoon Chan-hom; and (c) Typhoon Dujuan.


Figure 10.
Finite element analysis model.

Figure 11.
The first three modes of the finite element model. (a) The first mode in the X-direction; (b) The second mode in the X-direction; (c) The third mode in the X-direction; (d) The first mode in the Y-direction; (e) The second mode in the Y-direction; and (f) The third mode in the Y-direction.

Figure 12.
Cross-correlation function between two measurement points calculated by the NExT method. (a) represents the X direction; and (b) represents the Y directions.
Figure 12.
Cross-correlation function between two measurement points calculated by the NExT method. (a) represents the X direction; and (b) represents the Y directions.


Figure 13.
Power spectral density of the acceleration response in the X-direction.

Figure 14.
Power spectral density of the acceleration response in the Y-direction.

Figure 15.
Stability diagram using the Eigensystem Realisation Algorithm-Natural Excitation Technique-Average (ERA-NExT-AVG) method identification in the X direction.
Figure 15.
Stability diagram using the Eigensystem Realisation Algorithm-Natural Excitation Technique-Average (ERA-NExT-AVG) method identification in the X direction.

Figure 16.
Stability diagram using the ERA-NExT-AVG method identification in the Y direction.

Figure 17.
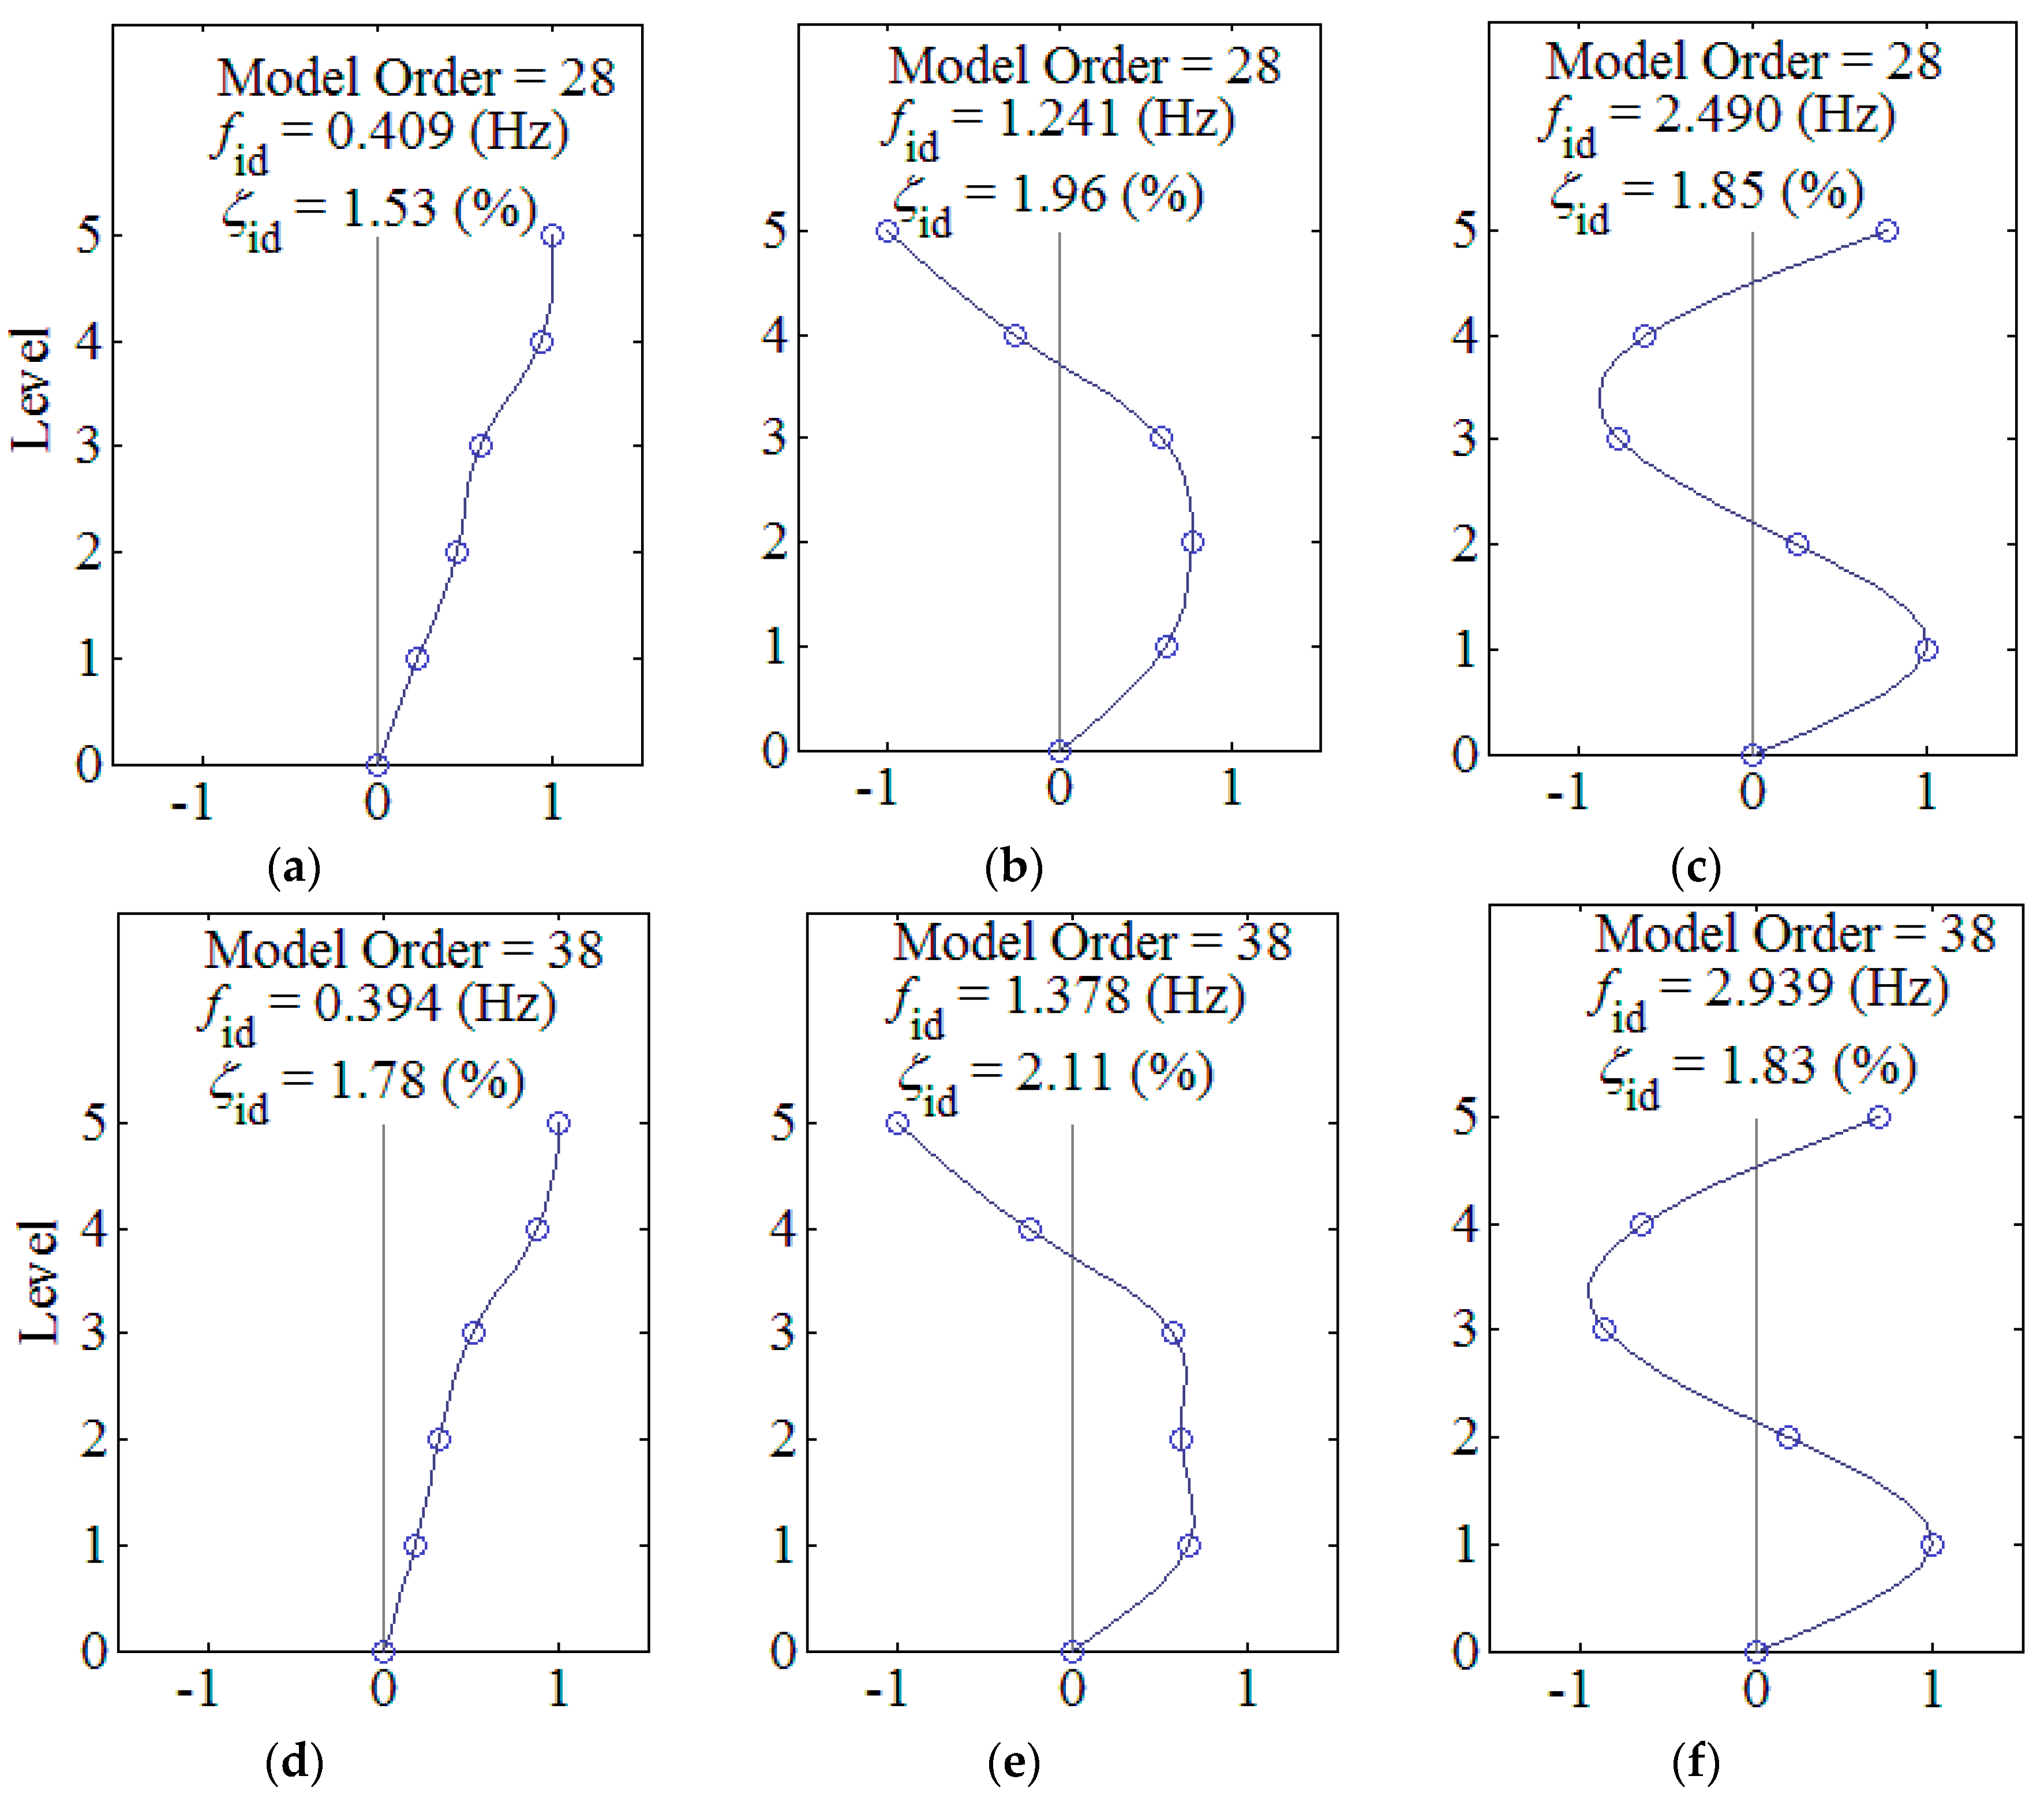
The first three modal parameters under static wind excitation identified by ERA-NEXT-AVG. (a) The first mode in the X-direction; (b) The second mode in the X-direction; (c) The third mode in the X-direction; (d) The first mode in the Y-direction; (e) The second mode in the Y-direction; and (f) The third mode in the Y-direction.
Figure 17.
The first three modal parameters under static wind excitation identified by ERA-NEXT-AVG. (a) The first mode in the X-direction; (b) The second mode in the X-direction; (c) The third mode in the X-direction; (d) The first mode in the Y-direction; (e) The second mode in the Y-direction; and (f) The third mode in the Y-direction.

Figure 18.
Variation in the damping ratios against the peak acceleration response at the 41st floor for the first three sway modes during the typhoons. (a) Mode 1; (b) Mode 2; and (c) Mode 3.
Figure 18.
Variation in the damping ratios against the peak acceleration response at the 41st floor for the first three sway modes during the typhoons. (a) Mode 1; (b) Mode 2; and (c) Mode 3.


Figure 19.
Relation between the RMS of the acceleration and the 10-min mean wind speed on top of the building. (a) and (b) Chan-hom; (c) and (d) Dujuan.
Figure 19.
Relation between the RMS of the acceleration and the 10-min mean wind speed on top of the building. (a) and (b) Chan-hom; (c) and (d) Dujuan.


Table 1.
Typhoon Information.
| Typhoon | Date | Maximum Wind Speed (m/s) |
|---|---|---|
| Matmo | 23 July 2014 | 31.1 |
| Fung-wong | 22 September 2014 | 17.7 |
| Chan-hom | 10 July 2015 | 24.8 |
| Dujuan | 29 September 2015 | 23.2 |
| Nepartak | 9 July 2016 | 14.8 |
Table 2.
Maximum mean wind speed in each direction.
| Wind Direction (°) | Maximum Mean Wind Speed (m/s) |
|---|---|
| 0–30 | 15.7 |
| 75–105 | 14.9 |
| 300–330 | 12.2 |
| 330–360 | 10.5 |
Table 3.
Measurement of the acceleration skewness and kurtosis coefficients.
| Floor | Fung-Wong | Chan-Hom | Dujuan | |||
|---|---|---|---|---|---|---|
| Skewness | Kurtosis | Skewness | Kurtosis | Skewness | Kurtosis | |
| 10X | −0.322 | 8.148 | 0.114 | 2.597 | −0.002 | 2.526 |
| 10Y | −0.083 | 6.986 | 0.059 | 2.286 | −0.010 | 3.324 |
| 18X | −0.296 | 10.832 | 0.002 | 2.618 | −0.008 | 3.226 |
| 18Y | −0.435 | 7.126 | 0.020 | 2.146 | −0.010 | 2.313 |
| 25X | −0.372 | 7.200 | 0.036 | 2.811 | −0.003 | 3.076 |
| 25Y | −0.045 | 6.552 | 0.001 | 1.532 | 0.075 | 2.852 |
| 32X | −0.321 | 6.248 | −0.020 | 1.914 | −0.001 | 2.756 |
| 32Y | −0.258 | 5.986 | 0.012 | 2.345 | −0.00 | 2.566 |
| 41X | −0.360 | 9.273 | 0.002 | 1.755 | −0.002 | 2.672 |
| 41Y | −0.132 | 5.727 | 0.013 | 2.932 | −0.001 | 2.402 |
Table 4.
Natural frequencies of the test building.
| Identified Mode No. | Results from Field Measurement (Hz) | Numerical Results from FEM (Hz) | Difference (%) | Mode Type | ||
|---|---|---|---|---|---|---|
| Welch | ERA-NExT-AVG | |||||
| 1st | 0.408 | 0.409 | 0.381 | 6.618 | 6.846 | 1st mode in X direction (sway) |
| 2nd | 0.390 | 0.394 | 0.372 | 4.615 | 5.584 | 1st mode in Y direction (sway) |
| 3rd | 1.252 | 1.241 | 1.210 | 3.355 | 2.498 | 2nd mode in X direction (sway) |
| 4th | 1.372 | 1.378 | 1.33 | 2.843 | 3.266 | 2nd mode in Y direction (sway) |
| 5th | 2.458 | 2.490 | 2.592 | −5.452 | −4.096 | 3rd mode in X direction (torsion) |
| 6th | 2.955 | 2.939 | 3.001 | −1.557 | −2.110 | 3rd mode in Y direction (torsion) |
Note: the results in the table are the average values of the test results under the mean wind speed of 14.5 m/s.
Table 5.
Damping ratios of HMBS (Sway Modes).
| Typhoon | Mean Wind Speed (m/s) | Mean Wind Direction (°) | Direction X | Direction Y | ||||
|---|---|---|---|---|---|---|---|---|
| Mode 1(%) | Mode 2(%) | Mode 3(%) | Mode 1(%) | Mode 2(%) | Mode 3(%) | |||
| Fung-wong | 5.154 | 324.229 | 1.627 | 3.198 | 2.103 | 0.600 | 3.113 | 3.677 |
| 6.204 | 326.059 | 1.445 | 3.823 | 2.349 | 1.337 | 2.767 | 1.881 | |
| 7.865 | 324.015 | 1.502 | 3.444 | 2.603 | 1.375 | 2.927 | 3.345 | |
| Chan-hom | 8.393 | 310.793 | 0.875 | 2.313 | 1.840 | 0.843 | 3.134 | 2.111 |
| 9.140 | 309.512 | 1.295 | 2.061 | 2.263 | 1.329 | 4.127 | 1.509 | |
| 10.256 | 309.241 | 1.021 | 2.807 | 2.476 | 0.759 | 3.987 | 2.650 | |
| 10.525 | 307.990 | 1.255 | 2.463 | 2.217 | 1.128 | 3.615 | 1.728 | |
| 11.910 | 305.509 | 1.020 | 2.421 | 2.069 | 1.879 | 2.913 | 2.198 | |
| 11.999 | 305.014 | 1.157 | 3.437 | 2.378 | 0.714 | 3.951 | 1.969 | |
| Dujuan | 8.495 | 88.395 | 1.094 | 2.200 | 2.673 | 0.783 | 1.695 | 2.437 |
| 9.164 | 89.330 | 1.007 | 2.245 | 1.827 | 1.004 | 3.175 | 3.799 | |
| 10.613 | 91.499 | 1.212 | 2.462 | 1.967 | 1.004 | 2.590 | 4.580 | |
| 11.759 | 90.694 | 1.343 | 2.574 | 1.9667 | 1.320 | 1.902 | 3.400 | |
| 12.357 | 94.307 | 1.250 | 2.607 | 2.334 | 1.132 | 2.635 | 4.333 | |
| 13.340 | 94.005 | 1.638 | 3.003 | 1.991 | 1.132 | 2.333 | 4.177 | |
| 14.468 | 97.366 | 1.274 | 3.421 | 2.233 | 0.916 | 2.477 | 4.170 | |
Note: the results in the table are the average results of the sub-samples.
Table 6.
Curve fitting parameters.
| Floor | Chan-Hom | Dujuan | ||
|---|---|---|---|---|
| C1 | C2 | C1 | C2 | |
| 10X | 7.377 | 0.6243 | 3.624 | 0.518 |
| 10Y | 11.878 | 0.703 | 21.711 | 1.018 |
| 18X | 27.061 | 0.888 | 516.465 | 1.633 |
| 18Y | 16.580 | 0.720 | 67.443 | 1.183 |
| 25X | 33.712 | 0.899 | 675.032 | 1.634 |
| 25Y | 27.579 | 0.790 | 133.243 | 1.272 |
| 32X | 17.620 | 0.583 | 259.722 | 1.307 |
| 32Y | 34.511 | 0.782 | 95.346 | 1.072 |
| 41X | 19.231 | 0.490 | 1162.793 | 1.602 |
| 41Y | 43.138 | 0.782 | 51.566 | 0.875 |
© 2019 by the authors. Licensee MDPI, Basel, Switzerland. This article is an open access article distributed under the terms and conditions of the Creative Commons Attribution (CC BY) license (http://creativecommons.org/licenses/by/4.0/).
Share and Cite
MDPI and ACS Style
Wang, C.; Li, Z.; Hu, L.; Zhao, Z.; Luo, Q.; Hu, J.; Zhang, X. Field Research on the Wind-Induced Response of a Super High-Rise Building under Typhoon. Appl. Sci. 2019, 9, 2180. https://doi.org/10.3390/app9112180
AMA Style
Wang C, Li Z, Hu L, Zhao Z, Luo Q, Hu J, Zhang X. Field Research on the Wind-Induced Response of a Super High-Rise Building under Typhoon. Applied Sciences. 2019; 9(11):2180. https://doi.org/10.3390/app9112180
Chicago/Turabian StyleWang, Chequan, Zhengnong Li, Lan Hu, Zhefei Zhao, Qizhi Luo, Jiaxing Hu, and Xuewen Zhang. 2019. "Field Research on the Wind-Induced Response of a Super High-Rise Building under Typhoon" Applied Sciences 9, no. 11: 2180. https://doi.org/10.3390/app9112180
Note that from the first issue of 2016, this journal uses article numbers instead of page numbers. See further details here.