Effects of Aging, Cognitive Dysfunction, Brain Atrophy on Hemoglobin Concentrations and Optical Pathlength at Rest in the Prefrontal Cortex: A Time-Resolved Spectroscopy Study


Abstract
:Featured Application
Abstract
1. Background
2. Methods
2.1. Subjects
2.2. TRS Measurement
2.3. Assessment of Cognitive Function
2.4. MRI
2.5. Data Analysis
3. Results
3.1. Correlations between MMSE Scores and Subject’s Age
3.2. Correlations Between TRS Parameters and MMSE Scores, Subject’s Age
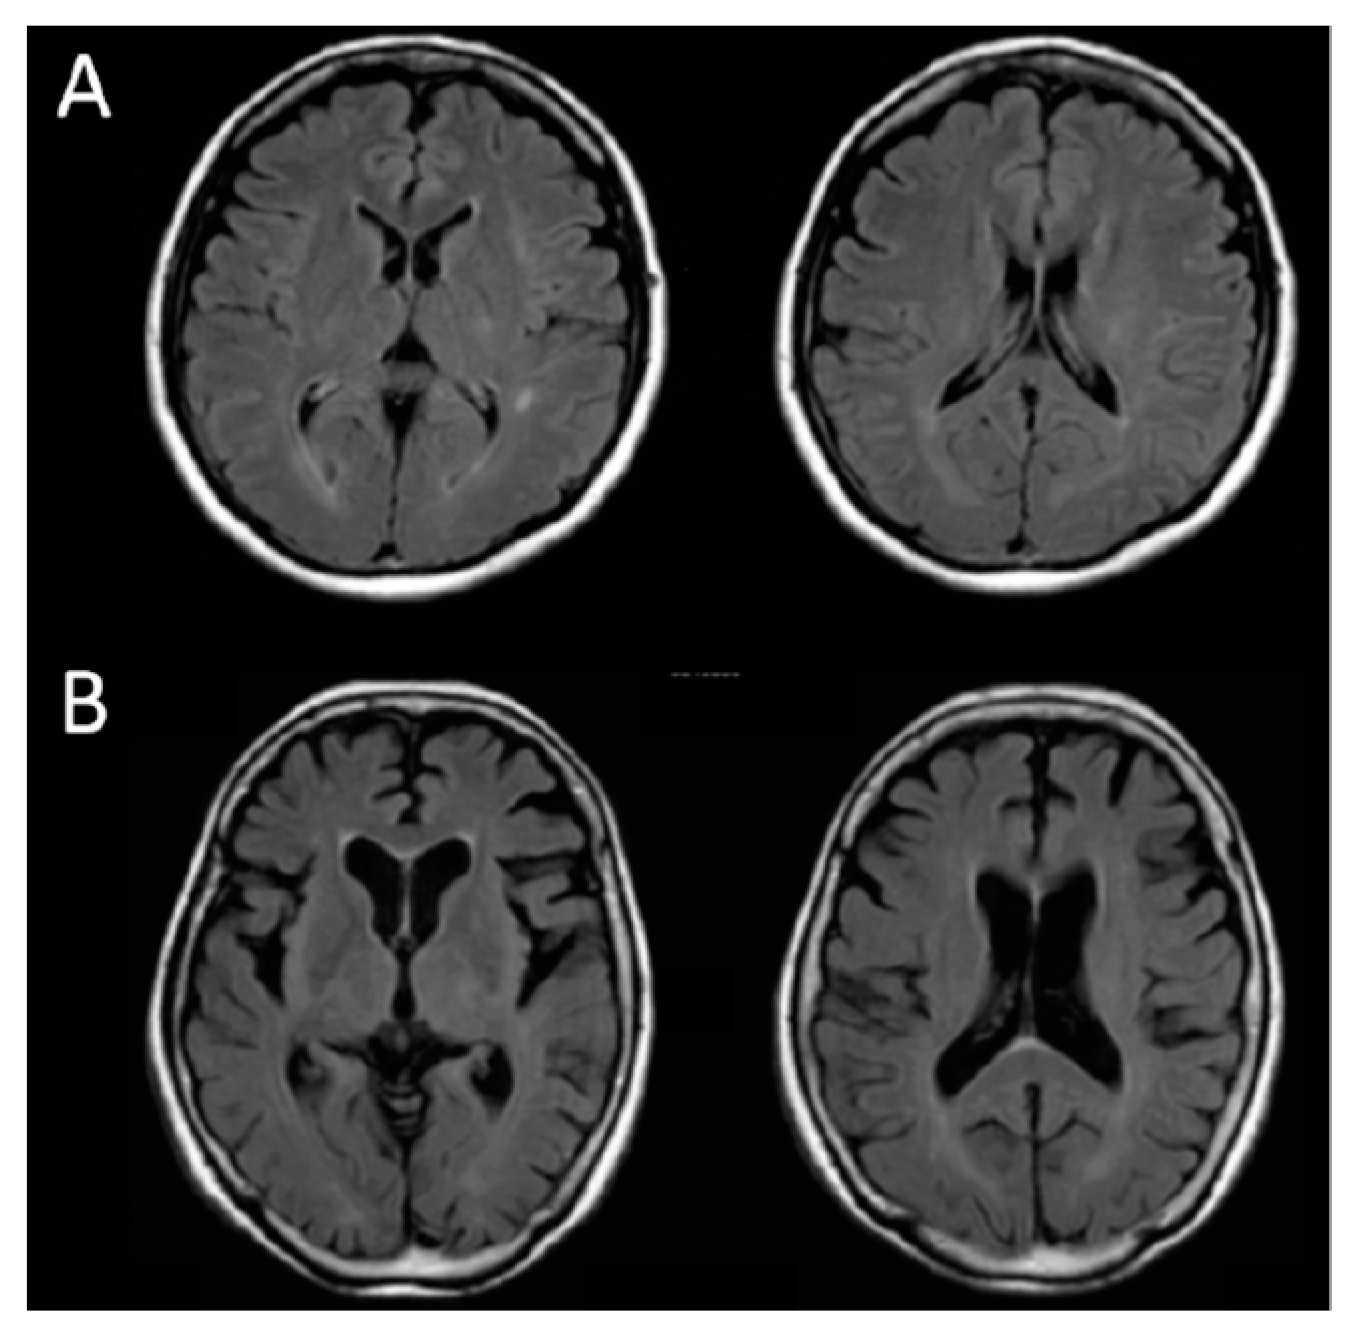
3.3. Correlations between VSRAD Parameters and MMSE Scores, Subject’s Age
3.4. Correlations between OPL and VSRAD Parameters
4. Discussion
5. Conclusions
Author Contributions
Funding
Conflicts of Interest
References
- Livingston, G.; Sommerlad, A.; Orgeta, V.; Costafreda, S.G.; Huntley, J.; Ames, D.; Ballard, C.; Banerjee, S.; Burns, A.; Cohen-Mansfield, J.; et al. Dementia prevention, intervention, and care. Lancet 2017, 390, 2673–2734. [Google Scholar] [CrossRef] [Green Version]
- Folstein, M.F.; Folstein, S.E.; McHugh, P.R. “Mini-mental state”. A practical method for grading the cognitive state of patients for the clinician. J. Psychiatr. Res. 1975, 12, 189–198. [Google Scholar] [CrossRef]
- Arevalo-Rodriguez, I.; Smailagic, N.; Roqué, I.; Figuls, M.; Ciapponi, A.; Sanchez-Perez, E.; Giannakou, A.; Pedraza, O.L.; Bonfill Cosp, X.; Cullum, S. Mini-Mental State Examination (MMSE) for the detection of Alzheimer’s disease and other dementias in people with mild cognitive impairment (MCI). Cochrane Database Syst. Rev. 2015, 3, CD010783. [Google Scholar]
- Scheltens, P.; Blennow, K.; Breteler, M.M.; de Strooper, B.; Frisoni, G.B.; Salloway, S.; Van der Flier, W.M. Alzheimer’s disease. Lancet 2016, 388, 505–517. [Google Scholar] [CrossRef]
- Jöbsis, F.F. Noninvasive, infrared monitoring of cerebral and myocardial oxygen sufficiency and circulatory parameters. Science 1977, 198, 1264–1267. [Google Scholar] [CrossRef]
- Reynolds, E.O.; Wyatt, J.S.; Azzopardi, D.; Delpy, D.T.; Cady, E.B.; Cope, M.; Wray, S. New non-invasive methods for assessing brain oxygenation and hemodynamics. Br. Med. Bull. 1988, 44, 1052–1075. [Google Scholar] [CrossRef]
- Chance, B.; Leigh, J.S.; Miyake, H.; Smith, D.S.; Nioka, S.; Greenfeld, R.; Finander, M.; Kaufmann, K.; Levy, W.; Young, M. Comparison of time-resolved and -unresolved measurements of deoxyhemoglobin in brain. Proc. Natl. Acad. Sci. USA 1988, 85, 4971–4975. [Google Scholar] [CrossRef] [PubMed]
- Patterson, M.S.; Chance, B.; Wilson, C. Time resolved reflectance and transmittance for the non-invasive measurement of tissue optical properties. Appl. Opt. 1989, 28, 2331–2336. [Google Scholar] [CrossRef] [PubMed]
- Katagiri, A.; Dan, I.; Tuzuki, D.; Okamoto, M.; Yokose, N.; Igarashi, K.; Hoshino, T.; Fujiwara, T.; Katayama, Y.; Yamaguchi, Y.; et al. Mapping of optical pathlength of human adult head at multi-wavelengths in near infrared spectroscopy. Adv. Exp. Med. Biol. 2010, 662, 205–212. [Google Scholar]
- Yokose, N.; Sakatani, K.; Murata, Y.; Awano, T.; Igarashi, T.; Nakamura, S.; Hoshino, T.; Katayama, Y. Bedside monitoring of cerebral blood oxygenation and hemodynamics after aneurysmal subarachnoid hemorrhage by quantitative time-resolved near-infrared spectroscopy. World Neurosurg. 2010, 73, 508–513. [Google Scholar] [CrossRef]
- Oda, M.; Nakano, T.; Suzuki, A.; Shimomura, F.; Suzuki, T. Near infrared time-resolved spectroscopy system for tissue oxygenation monitor. SPIE 2000, 4160, 204–210. [Google Scholar]
- Okada, E.; Delpy, D.T. Near-infrared light propagation in an adult head model. I. Modeling of low-level scattering in the cerebrospinal fluid layer. Appl. Opt. 2003, 42, 2906–2914. [Google Scholar] [CrossRef]
- Brayne, C.; Calloway, P. The association of education and socioeconomic status with the Mini Mental State Examination and the clinical diagnosis of dementia in elderly people. Age Ageing 1990, 19, 91–96. [Google Scholar] [CrossRef]
- Crum, R.M.; Anthony, J.C.; Bassett, S.S.; Folstein, M.F. Population-based norms for the Mini-Mental State Examination by age and educational level. JAMA 1993, 269, 2386–2391. [Google Scholar] [CrossRef] [PubMed]
- Tombaugh, T.N.; McIntyre, N.J. The mini-mental state examination: A comprehensive review. J. Am. Geriatr. Soc. 1992, 40, 922–935. [Google Scholar] [CrossRef] [PubMed]
- Matsuda, H.; Mizumura, S.; Nemoto, K.; Yamashita, F.; Imabayashi, E.; Sato, N. Automatic voxel-based morphometry of structural MRI by SPM8 plus diffeomorphic anatomic registration through exponentiated lie algebra improves the diagnosis of probable Alzheimer Disease. Am. J. Neuroradiol. 2012, 33, 1109–1114. [Google Scholar] [CrossRef]
- Matsuda, H. Voxel-based Morphometry of Brain MRI in Normal Aging and Alzheimer’s Disease. Aging Dis. 2013, 4, 29–37. [Google Scholar] [PubMed]
- Ohmae, E.; Ouchi, Y.; Oda, M. Cerebral hemodynamics evaluation by near-infrared time-resolved spectroscopy: Correlation with simultaneous positron emission tomography measurements. NeuroImage 2006, 29, 697–705. [Google Scholar] [CrossRef]
- Sakatani, K.; Yamashita, D.; Yamanaka, T. Changes of cerebral blood oxygenation and optical pathlength during activation and deactivation in the prefrontal cortex measured by time-resolved near infrared spectroscopy. Life Sci. 2006, 78, 2734–2741. [Google Scholar] [CrossRef]
- Machida, A.; Shirato, M.; Tanida, M.; Kanemaru, C.; Nagai, S.; Sakatani, K. Effects of Cosmetic Therapy on Cognitive Function in Elderly Women Evaluated by Time-Resolved Spectroscopy Study. Adv. Exp. Med. Biol. 2016, 876, 289–295. [Google Scholar] [PubMed]
- Martin, A.J.; Friston, K.J.; Colebatch, J.G.; Frackowiak, R.S. Decreases in regional cerebral blood flow with normal aging. J. Cereb. Blood Flow Metab. 1991, 11, 684–689. [Google Scholar] [CrossRef]
- Sze, V.; Chen, Y.H.; Yang, T.J.; Joel, S. Efficient Processing of Deep Neural Networks: A tutorial and Survey. Proc. IEEE 2017, 105, 2295–2329. [Google Scholar] [CrossRef]
- Hosny, A.; Parmar, C.; Quackenbush, J.; Schwartz, L.H.; Aerts, H.J.W.L. Artificial intelligence in radiology. Nat. Rev. Cancer 2018, 18, 500–510. [Google Scholar] [CrossRef]
- Liu, S.; Liu, S.; Cai, W.; Pujol, S.; Kikinis, R.; Feng, D. Early diagnosis of Alzheimer’s disease with deep learning. In Proceedings of the 2014 IEEE 11th International Symposium on Biomedical Imaging (ISBI), Beijing, China, 29 April–2 May 2014; pp. 1015–1018. [Google Scholar]
- Oyama, K.; Hu, L.; Sakatani, K. Prediction of MMSE score using time-resolved near-infrared spectroscopy. In Proceedings of the 45th Annual Meeting of the International Society on Oxygen Transport to Tissue (ISOTT), Halle, Germany, 19–23 August 2017. [Google Scholar]
- Sato, Y.; Komuro, Y.; Lin, L.; Tang, Z.; Hu, L.; Kadowaki, S.; Ugawa, Y.; Yamada, Y.; Sakatani, K. Differences in Tissue Oxygenation, Perfusion and Optical Properties in Brain Areas Affected by Stroke: A Time-Resolved NIRS Study. Adv. Exp. Med. Biol. 2018, 1072, 63–67. [Google Scholar]
- Minkova, L.; Habich, A.; Peter, J.; Kaller, C.P.; Eickhoff, S.B.; Klöppel, S. Gray matter asymmetries in aging and neurodegeneration: A review and meta-analysis. Hum. Brain Mapp. 2017, 38, 5890–5904. [Google Scholar] [CrossRef] [Green Version]
- Koyama, T.; Iwasaki, A.; Ogoshi, Y.; Okada, E. Practical and adequate approach to modeling light propagation in an adult head with low-scattering regions by use of diffusion theory. Appl. Opt. 2005, 44, 2094–2103. [Google Scholar] [CrossRef]
- Oyama, K.; Hu, L.; Sakatani, K. Prediction of MMSE score using time-resolved near-infrared spectroscopy. Adv. Exp. Med. Biol. 2018, 1072, 145–150. [Google Scholar]


| Lifestyle-Related Diseases | |||||||||||||
|---|---|---|---|---|---|---|---|---|---|---|---|---|---|
| HT | DM | HL | HT | HT | HT | HL | HT | HT | HT | HT | none | Total | |
| DM | HL | G | G | HL | HL | DM | HL | ||||||
| DM | DM | G | G | ||||||||||
| G | |||||||||||||
| CH | 18 | 1 | 0 | 6 | 6 | 0 | 0 | 6 | 1 | 0 | 0 | 3 | 41 |
| SAH | 9 | 0 | 4 | 1 | 3 | 0 | 0 | 3 | 0 | 0 | 0 | 1 | 21 |
| CI | 16 | 3 | 6 | 12 | 10 | 2 | 2 | 14 | 1 | 1 | 5 | 7 | 79 |
| HI | 2 | 0 | 0 | 0 | 0 | 0 | 0 | 0 | 0 | 0 | 0 | 1 | 3 |
| BF | 16 | 1 | 0 | 4 | 4 | 0 | 0 | 2 | 0 | 0 | 0 | 12 | 39 |
| others | 8 | 0 | 0 | 4 | 0 | 0 | 0 | 1 | 0 | 1 | 1 | 4 | 19 |
| Total | 69 | 5 | 10 | 27 | 23 | 2 | 2 | 26 | 2 | 2 | 6 | 28 | 202 |
| Age | Male | Female | Total |
|---|---|---|---|
| ≤50 | 11 | 4 | 15 |
| 51–60 | 15 | 8 | 23 |
| 61–70 | 20 | 14 | 34 |
| 71–80 | 19 | 38 | 57 |
| ≥80 | 22 | 51 | 73 |
| total | 87 | 115 | 202 |
| Age | MMSE | ||
|---|---|---|---|
| Right PFC | Coxy-Hb [µM] | −0.196 ** | 0.230 ** |
| Cdeoxy-Hb [µM] | 0.029 | −0.047 | |
| Ct-Hb [µM] | −0.127 | 0.142 * | |
| SO2 [%] | −0.270 ** | 0.396 ** | |
| Left PFC | Coxy-Hb [µM] | −0.189 ** | 0.135 |
| Cdeoxy-Hb [µM] | 0.084 | −0.191 ** | |
| Ct-Hb [µM] | −0.107 | 0.022 | |
| SO2 [%] | −0.302 ** | 0.398 ** | |
| VSRAD | ||||
|---|---|---|---|---|
| Severity | Brain Extent (%) | Extent (%) | Ratio | |
| Age | 0.406 ** | 0.404 ** | 0.476 ** | 0.400 ** |
| MMSE | −0.453 ** | −0.409 ** | −0.484 ** | −0.402 ** |
| Case | Age/sex | MMSE | Severity | Whole Brain Extent (%) | Extent of VOI atrophy (%) | Ratio |
|---|---|---|---|---|---|---|
| A | 50/F | 30 | 0.27 | 1.40 | 0.00 | 0.00 |
| B | 77/F | 9 | 3.48 | 6.48 | 86.17 | 13.29 |
| Case | Right | Left | Average | ||||
|---|---|---|---|---|---|---|---|
| OPL1 (761 nm) | OPL2 (791 nm) | OPL3 (836 nm) | OPL1 (761 nm) | OPL2 (791 nm) | OPL3 (836 nm) | ||
| A | 217.9 | 220.8 | 208.4 | 226.2 | 227.2 | 211.4 | 218.7 (1.00) |
| B | 177.1 | 179.0 | 169.6 | 171.8 | 174.0 | 162.9 | 172.4 (0.79) |
| VSRAD | |||||
|---|---|---|---|---|---|
| Severity | Whole Brain Extent (%) | Extent of VOI Atrophy (%) | Ratio | ||
| Right PFC | OPL1 | −0.305 * | 0.073 | −0.312 * | −0.396 ** |
| OPL2 | −0.284 * | 0.095 | −0.292 * | −0.386 ** | |
| OPL3 | −0.306 * | 0.052 | −0.312 * | −0.395 ** | |
| Left PFC | OPL1 | −0.211 | −0.038 | −0.242 | −0.248 |
| OPL2 | −0.228 | −0.023 | −0.262 | −0.283 * | |
| OPL3 | −0.240 | −0.038 | −0.276 * | −0.294 * | |
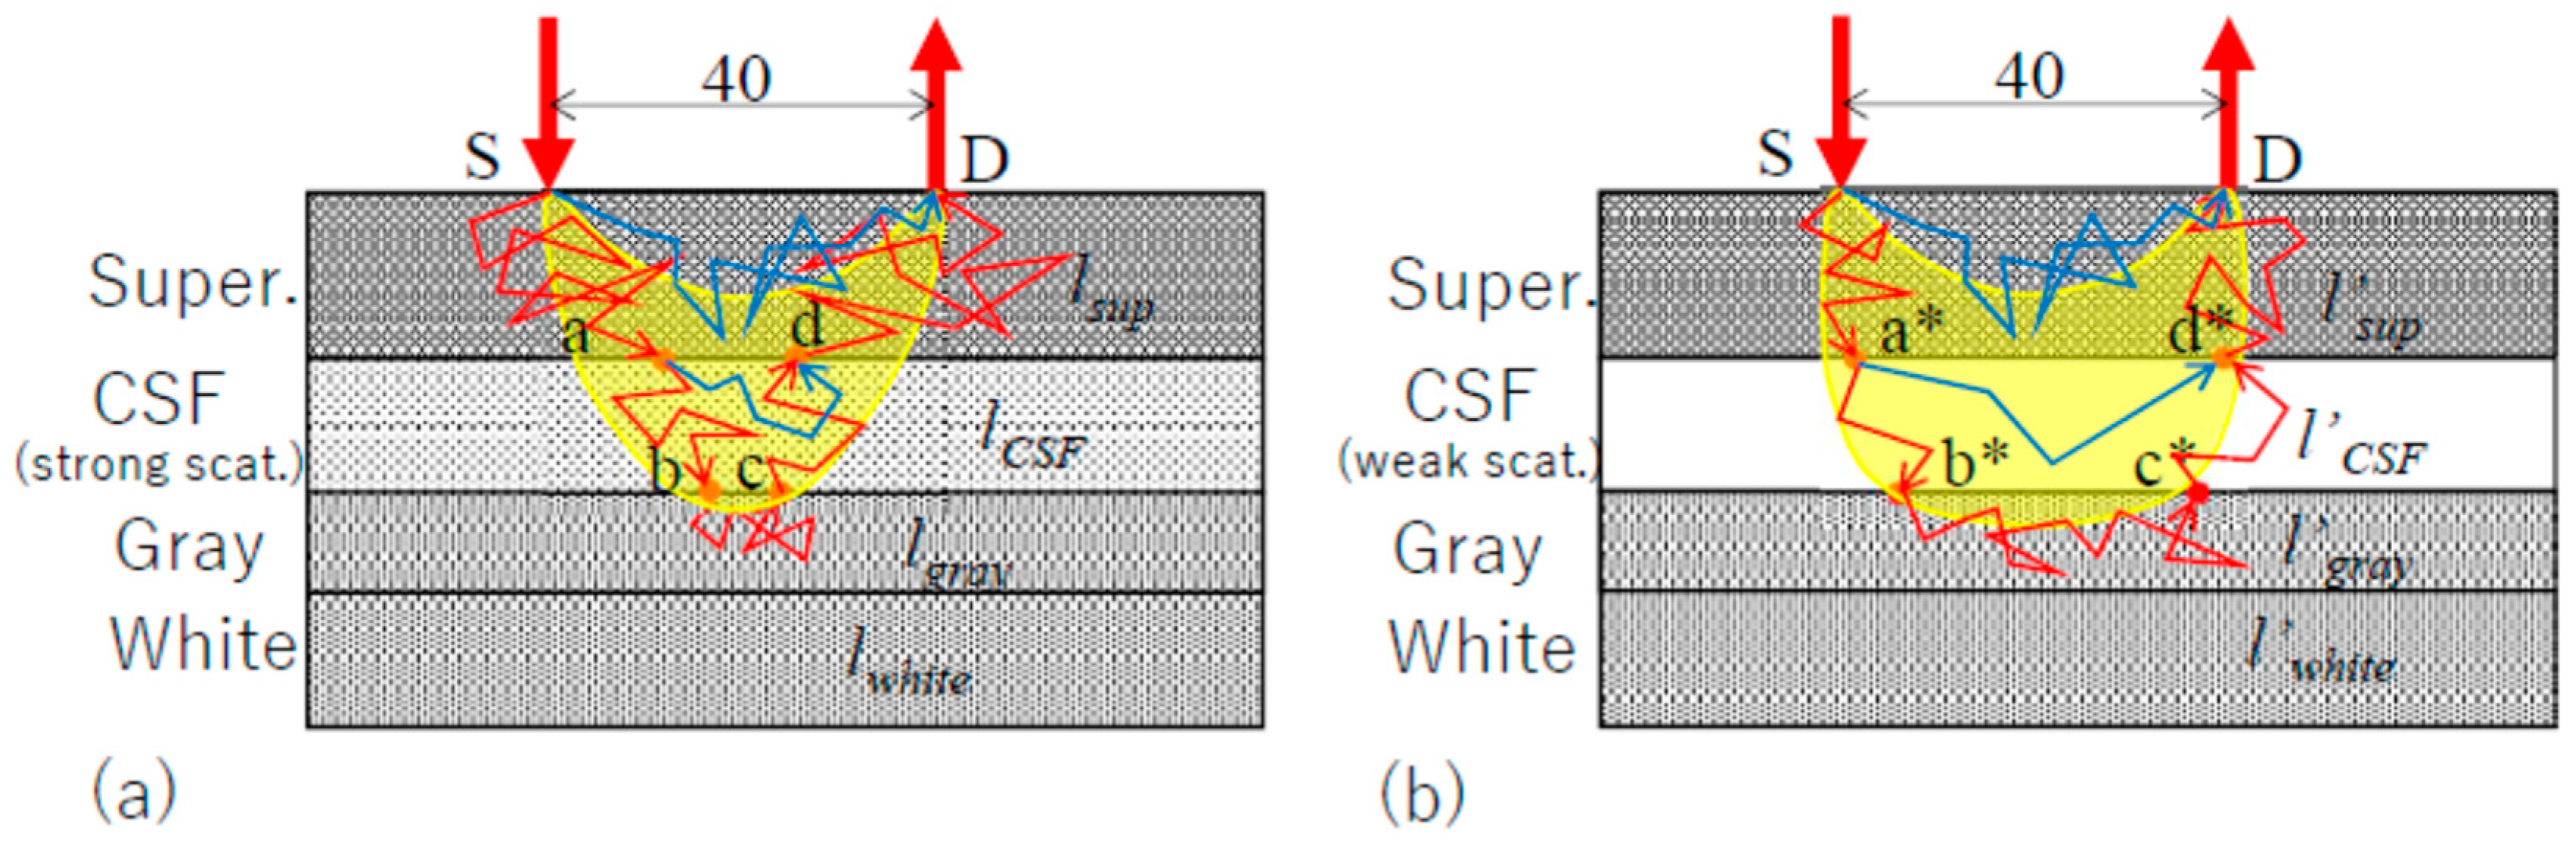
| µ′s-CSF (mm−1) | OPL (mm) | lsup (mm) | lCSF (mm) | lgray (mm) | lwhite (mm) |
|---|---|---|---|---|---|
| 1.0 (soft tissue) | 320 | 268 | 35 | 16 | 0.5 |
| 0.3 (weak scat.) | 298 | 224 | 51 | 22 | 0.6 |
| 0.01 (very weak scat.) | 239 | 170 | 53 | 16 | 0.4 |
© 2019 by the authors. Licensee MDPI, Basel, Switzerland. This article is an open access article distributed under the terms and conditions of the Creative Commons Attribution (CC BY) license (http://creativecommons.org/licenses/by/4.0/).
Share and Cite
Sakatani, K.; Hu, L.; Oyama, K.; Yamada, Y. Effects of Aging, Cognitive Dysfunction, Brain Atrophy on Hemoglobin Concentrations and Optical Pathlength at Rest in the Prefrontal Cortex: A Time-Resolved Spectroscopy Study. Appl. Sci. 2019, 9, 2209. https://doi.org/10.3390/app9112209
Sakatani K, Hu L, Oyama K, Yamada Y. Effects of Aging, Cognitive Dysfunction, Brain Atrophy on Hemoglobin Concentrations and Optical Pathlength at Rest in the Prefrontal Cortex: A Time-Resolved Spectroscopy Study. Applied Sciences. 2019; 9(11):2209. https://doi.org/10.3390/app9112209
Chicago/Turabian StyleSakatani, Kaoru, Lizhen Hu, Katsunori Oyama, and Yukio Yamada. 2019. "Effects of Aging, Cognitive Dysfunction, Brain Atrophy on Hemoglobin Concentrations and Optical Pathlength at Rest in the Prefrontal Cortex: A Time-Resolved Spectroscopy Study" Applied Sciences 9, no. 11: 2209. https://doi.org/10.3390/app9112209