A Novel Neural Network-Based Method for Decoding and Detecting of the DS8-PSK Scheme in an OCC System


Department of Electronics Engineering, Kookmin University, Seoul 02707, Korea
*
Author to whom correspondence should be addressed.
Appl. Sci. 2019, 9(11), 2242; https://doi.org/10.3390/app9112242
Submission received: 18 April 2019
/
Revised: 22 May 2019
/
Accepted: 27 May 2019
/
Published: 30 May 2019
(This article belongs to the Special Issue Applications of AI for 5G and Beyond Communications: Network Management, Operation, and Automation)
Abstract
:This paper proposes a novel method of training and applying a neural network to act as an adaptive decoder for a modulation scheme used in optical camera communication (OCC). We present a brief discussion on trending artificial intelligence applications, the contemporary ways of applying them in a wireless communication field, such as visible light communication (VLC), optical wireless communication (OWC) and OCC, and its potential contribution in the development of this research area. Furthermore, we proposed an OCC vehicular system architecture with artificial intelligence (AI) functionalities, where dimmable spatial 8-phase shift keying (DS8-PSK) is employed as one out of two modulation schemes to form a hybrid waveform. Further demonstration of simulating the blurring process on a transmitter image, as well as our proposed method of using a neural network as a decoder for DS8-PSK, is provided in detail. Finally, experimental results are given to prove the effectiveness and efficiency of the proposed method over an investigating channel condition.
1. Introduction
Nowadays, light-emitting diodes (LEDs) are widely used as common lighting sources because of their numerous advantages, such as excellent visibility, durability, and low power consumption. Moreover, the ability to switch the light intensity fast [1,2] gives LEDs the abilities to transmit high-speed data, provided that the switching rate, or frequency, is higher than 200Hz for human eyes’ safety [3]. On the receiver side, two types of light receivers can be used, which classifies the LED-based communication into two research directions [4]. OWC/OCC utilized cameras to receive modulated light, and photodiodes have been widely employed in the VLC system. Although OCC has a lower data rate compared to VLC since it receives data via an image sensor [4,5], OCC is still preferable in applications where mobility is crucial because of the wider field of view (FoV) of a camera compared to a photodiode, for example, indoor localization using a personal smartphone [6,7] or vehicular OCC system [8,9,10].
On the basis of the point of view of OCC technologies, internet of vehicles (IoV) is one of the most promising areas where these technologies could be deployed. Compared to using the traditional radio frequency (RF) communication, OWC/OCC and VLC are considered as reliable, safe for human health, and low-cost communication technologies [4,11]. Regarding classification into sub-areas, IoV can be divided into two communication fields: Vehicles-to-vehicles (V2V) and vehicle-to-infrastructure (V2X). In either sub-area, the vehicles can either act as transmitters or receivers in the OCC system. For transmitting optical data, there are light sources that are designed at both the front and back sides of vehicles. For receiving data, there are also various kinds of cameras that could be attached to vehicles.
Despite the enormous potential of the OWC/OCC vehicular system for a lucrative industrial market, the development of these new technologies still suffers several challenges, as has been pointed out in [12]. However, sources of white, noise such as ambient light radiation from the sun and streetlight, are one of the main factors causing the degradation of OWC/OCC vehicular systems. Many studies have been carried out to demonstrate the feasibility of OWC/OCC technology in V2V/V2X systems (see, for example, [8,9,10]), and mostly, the performance is investigated with respect to Gaussian white noise with different signal-to-noise ratio (SNR) values. Another type of distortion that can reduce the performance of a vehicular OWC/OCC system is blurred phenomenon, which generally occurs in any system related to camera and image processing. In an OWC/OCC vehicular scenario, vehicle vibration and mobility, weather conditions (rainy, foggy, and snowy, to mention a few), and camera focusing are the dominant candidates that can cause the blurring of received images. However, there are various coding techniques for decoding and error correction. Eventually, these techniques are developed to perform well in RF communication systems. Hence, to deal with white noise caused by ambient light in OCC vehicular systems, these techniques could also yield similar performance. However, the decoding accuracy of an OCC vehicular system can be extremely low when the blur effect occurs because the blurring process can sum up and fairly redistribute all intensity values using a point-spread function [13], which decreases the gap between logic state ON and OFF of an LED, and increases the bit error probability while decoding data from an image.
Fortunately, recent developments in deep learning technologies provide us with a new way to approach and deal with this issue. Instead of deriving a complex mathematical algorithm from a pre-defined system model, deep learning, or AI technologies allow the system to learn and approximate an optimizing model directly from training data. Deep learning has proved itself as an efficient tool to deal with various types of problems, including computer vision [14], speech recognition [15], autonomous vehicles [16], and many others. Inspired by these developments, recently many efforts have been made to apply deep learning/AI technologies in communication field (including channel decoding) [17,18,19,20,21,22]. In a vehicular OCC system, the function of the receiver (Rx) mainly includes two tasks: The first is decoding data from the transmitter (Tx), however, to achieve this, it should be able to detect and set up a communication link with the transmitter LED array among thousands of possible artificial lights within an acceptable duration. The second is decoding data from the LED image. The performances of these two tasks could be enhanced significantly by deep learning/AI technologies.
The remainder of this paper is structured as follows. In Section 2, we will briefly introduce the fundamental concept of AI and neural networks, as well as a method of applying them to a channel decoding problem. In Section 3, we point out the contributions of this paper to vehicular OCC systems. Section 4 provides the vehicular OCC system architecture with AI functionalities proposed in this paper after discussing the hybrid scheme that we developed in [4]. The principle and method of analyzing the effect of a blurred LED image on the performance of an OCC decoder are also provided in this section. On the basis of those effects, we propose extra features extracting as an input of a neural network (NN)-based decoder. Furthermore, we also provide in Section 4 the experimental results to compare the accuracy of an NN-based decoder and an original over noisy blurred transmitting image, which is evaluated using symbol error rate (SER) value. Finally, Section 5 concludes the paper.
2. Related Work
2.1. Fundamental AI
In recent times, the concept of AI is more clearly understood and widely applied in research related to many practical areas, such as optical wireless communication. The idea of using AI is mostly due to the increasing demand for an automatic, self-learning, and adaptive ability embedded in every system in real life. AI takes advantage of reducing human brain heavy workload in big data analysis to figure out which model is the most suitable and optimized to reflect the relationship between the input data and the desired system output. The input data of a real system can be varied depending on the area of AI employed.
By taking a more in-depth look into the architecture of a neural network, which is one of the simplest forms of AI, it can be observed as a multi-layer model which has parameter matrices between layers that are adjustable and adaptable through training to approximately reflect the correlation between the input and output labels. Figure 1 illustrates the architecture of an NN that is used in a regression problem as well as an illustration of how each neuron processes the input data.
The training process is a process in which the weight and bias matrices of every neuron are updated through every epoch in order to make the predicting value of an output closer to the actual output value based on the training dataset. Moreover, and are, respectively, the weight matrix and bias value of the neuron. To accomplish the training process, AI attempts to minimize the value of a loss function which is unique for each kind of task using a particular optimization algorithm.
2.1.1. Loss Function
The loss function is a critical component of artificial NNs which is utilized to measure the inconsistency between a predicted value () and an actual label (). It is a non-negative real-valued function, and the robustness of the model increases as the loss function values decrease. The loss function is at the core of empirical risk function as well as a significant component of the structural risk function. Generally, the structural risk function of a model is composed of an empirical risk term and a regularization term and is represented as follows:
where is the regularization term of a penalty term, denotes the parameters of the model to be learned, represents the activation function, and denotes the training sample.
Here, we only concentrate on the empirical risk term (loss function):
There are several frequently used loss functions, as has been pointed out in [24]. Regarding the model proposed in this paper, we will utilize categorical cross-entropy loss or softmax loss since our NN is designed for a multi-class classification problem.
2.1.2. Optimization Algorithm
Currently, in machine learning, there are various optimization algorithms for supervised learning. In [25], a theoretical explanation and the implementation of the results of optimization algorithms for comparing several models are presented for reference and development. A conclusion is also reached that there is no such universal optimization algorithm for all problems. However, for the problem of building a decoder for the DS8-PSK scheme using an NN, which could be assumed to be a softmax classifier, AdaGrad [26] is the most suitable solution method for such a straightforward problem. The reason is that Adagrad performs much larger updates for infrequent parameters than frequent parameters. Moreover, the need to manually tune the learning rate of stochastic gradient descent methods is eliminated in AdaGrad [27], and the robustness of the stochastic gradient descent method is greatly improved by this method [28].
| The Adagrad algorithm |
|
From [29], the update rule of the Adagrad algorithm could also be simplified by (3) and (4):
where is the smoothing term that avoids division by zero (usually on the order of 1e−8). One can see that the parameter is modified based on a ratio that involves its current gradient and the sum over its past gradients.
2.2. Reference Architecture of a Vehicular OCC System
Figure 2 illustrates the architecture of region-of-interest (RoI) signaling. The transmission of RoI is beneficial when the camera Rx has the ability to capture the area in which the communication link should be set up. The light source Tx continuously notifies the camera Rx via a known signal for differentiating it from other unwanted light sources and other bright objects. The transmission of the known signal is a type of light source identification, where the high-speed data stream is embedded into the low-speed RoI stream [8]. Moreover, dual streaming of light source identification signaling and high-speed data link is performed as a hybrid modulation.
For the Rx, Tx light source identification and high-speed data demodulation can be time-slotted using a single camera. Therefore, the camera Rx first detects the RoI from the identification signal and then selects the RoI to accelerate the frame rate and achieve a high-speed data link. However, the movement between Tx and Rx is considered, and the RoI may also change. An alternative solution is the use of a dual-camera system in which one camera simultaneously detects the RoI, while another camera demodulates data at a high speed based on the constantly updated RoI from a low-speed (e.g., 30fps) camera.
A vehicular OWC/OCC system using a hybrid waveform that consists of low-rate and high-rate data streams can mitigate the computational load on the receiver and thus reduce the processing time. The hybrid spatial phase-shift keying (HS-PSK) single carrier is such a hybrid waveform (see [4] and [30]). HS-PSK is a dedicated combination of spatial 2-phase shift keying (S2-PSK) and dimmable spatial multiple-PSK (DSM-PSK). The S2-PSK data stream is generated based on the changes between the low and high dimming levels of the DS8-PSK waveform, as illustrated in Appendix 2 of [30]. S2-PSK had been fully demonstrated with implementation results in [8]. In Section 4, we will illustrate DSM-PSK with M = 8 for eight LEDs in each LED array before proceeding further on our proposed decoding method based on an NN for decoding the high-rate data stream.
3. Our contributions
In this section, we will present our contributions to the development of vehicular OCC systems. Precisely, this paper provides and investigates the principle of the blurring phenomenon on an image and the impact of this phenomenon on the quality of a camera-based communication system. Currently, many studies have been carried out on blurring images, and possible solutions based on many advanced computer vision (CV) algorithms have been provided to process and recover blurry images. However, these deblurring and denoizing algorithms are mostly based on convolutional NNs and have already been studied extensively (see, for example, [31,32,33,34,35,36,37]). Moreover, to be carried out in such a communication system, these algorithms are computationally expensive, highly complex, and time-consuming. The reason being that most of these algorithms are specifically developed for reconstructing a latent image from a degraded image that has been contaminated by the blurring process, noise, and other factors. To do that, most of the existing techniques need to pass through many post-processing steps, such as object recognition and feature extraction, which heavily rely on the input of a clear image. The number of images required for image reconstruction could be one [31,32,33] or multiple [34,35,36,37].
In the OCC system, the data being transmitted using LED light and an image frame are captured using a camera. Often, the LED states can be extracted from a small partition of an image frame, which occasionally are points intensity values [8,30]. Provided that the RoI information is made available and updated from other sources, such as low exposure camera [4,8,30,38,39], to decode high-rate data, the receiver does not need to process the whole image or recover it when the blurring process appears.
Consequently, in this paper, we propose and design an NN-based decoder for decoding data from the received image frame in the OCC receiver. Further, we shall provide a brief discussion on critical factors to be considered when designing any NN model. From that point of view, we also highlight our novel contributions on data preprocessing and input features extraction which enable the enhancement of decoder performance.
Moreover, to the best of our knowledge, little or none has been done to analyze the performance and measure the bit or SER of a decoder of an OCC system, including implementation and simulation, over a hybrid channel of blur and noise.
In summary, our contributions in this paper are as follows:
- We define a novel channel model which can give the nearest approximation of the channel model in vehicular OCC system, considering the blur effect caused by a different type of environment condition, such as rainy, foggy, snowy, etc. The defined channel model is also designed to be able to simulate.
- We provide the principle of the blurred phenomenon on the image: How it affects the quality of the communication channel and the performance of the traditional decoder in an image sensor-based communication system.
- We propose a new method of using deep learning and NN to decode the high-rate OCC waveform (DS8-PSK): The model architecture and dataset preparation for training and performance testing.
- We prove the robustness of a new AI-based decoder on a novel channel model by analyzing the SER performance of each decoding method. Thus, making a performance comparison between using the traditional decoder and our proposed AI-based decoder.
4. System Architecture and Performance Analysis
4.1. Reference High-rate Modulation Scheme
4.1.1. DS8-PSK Encoder
Figure 3 shows the reference architecture of the DS8-PSK transmitter. The DS8-PSK waveform is transmitted using a pair of light sources, which comprise a reference LED group and a data LED group. Clusters of three bits from the input high-rate data stream are modulated based on the phase-shift value between two transmitted waveforms, which are driven by a pair of light sources. In order to enable the mapping of the clusters of three bits of an input bit string to a phase-shift value, the DS8-PSK duty cycle must be separated into eight time-slots. Additionally, the number of LEDs in each light source should be eight. The waveform generated by each LED in a light source is a square wave. Within a light source, the waveform is delayed by 1/8 of a duty cycle compared to the waveform.
When transmitting Tx data, all phases of the waveforms which are generated by the reference LED group are maintained from 0, T/8, to 7T/8, and all phases of the waveforms generated by the data LED group are shifted in comparison with the waveforms in the first LED group based on the phase-shift value. The phase-shift value of a pair of light sources is called S_Phase_Shift. It is calculated using (5) by considering the value of i, where T is the duty cycle of a LED waveform. Moreover, Table 1 shows the mapping of three bits onto the S_Phase_Shift value by considering the value of i.
DS8-PSK supports dimming in steps of 1/8 (12.5%) of a duty cycle T. The dimming level can be calculated by the sum of ”1” states among eight time slots in a duty cycle T as expressed by (6). Thus, the DS8-PSK waveform can support seven dimming levels from 1/8 (12.5%) and 2/8 (25%) to 7/8 (87.5%). The data rate of each data LED group is calculated by (7). For example, with an optical clock rate and a symbol rate of 10 kHz and 10 symbols/s, respectively, the transmission data rate that can be achieved by a data LED group is 30 bps.
4.1.2. DS8-PSK Decoder
At a given sampling time, the Rx camera simultaneously captures two groups of light sources in an image. Each LED group in an image will form a discrete waveform, comprising eight “1” or ”0” states. Each set of states is called S_Phase. On the basis of the dimming levels enabled by DS8-PSK, seven tables can be formed for decoding at seven corresponding dimming levels. In the first step of the process of decoding a DS8-PSK waveform, the S_Phase value should be selected from the proper S_Phase decoding table, as presented in Table 2. In the next step, the spatial phase value (S_Phase_Shift) can be calculated based on the S_Phase value of the reference LED group and the S_Phase value of the data LED group. Equation (8) shows how to calculate the S_Phase_Shift value, and Figure 4 shows an example of how to determine S_Phase_Shift. When the S_Phase_Shift value is detected, the data bits can be decoded inversely using the mapping table, which is presented in Table 1.
However, there is still a probability that the Rx camera may capture an unclear state of an LED waveform, which is called bad sampling. Figure 5 illustrates the bad sampling issue which occurs when the Rx camera captures at a transition time of an LED. In [27], we denote these unclear states as “x” states, which will take a value between zero and one. From that, we can also re-define the S_Phase value for all bad-sampling cases corresponding to each dimming level, as described in Table 3.
4.2. Proposed System Architecture
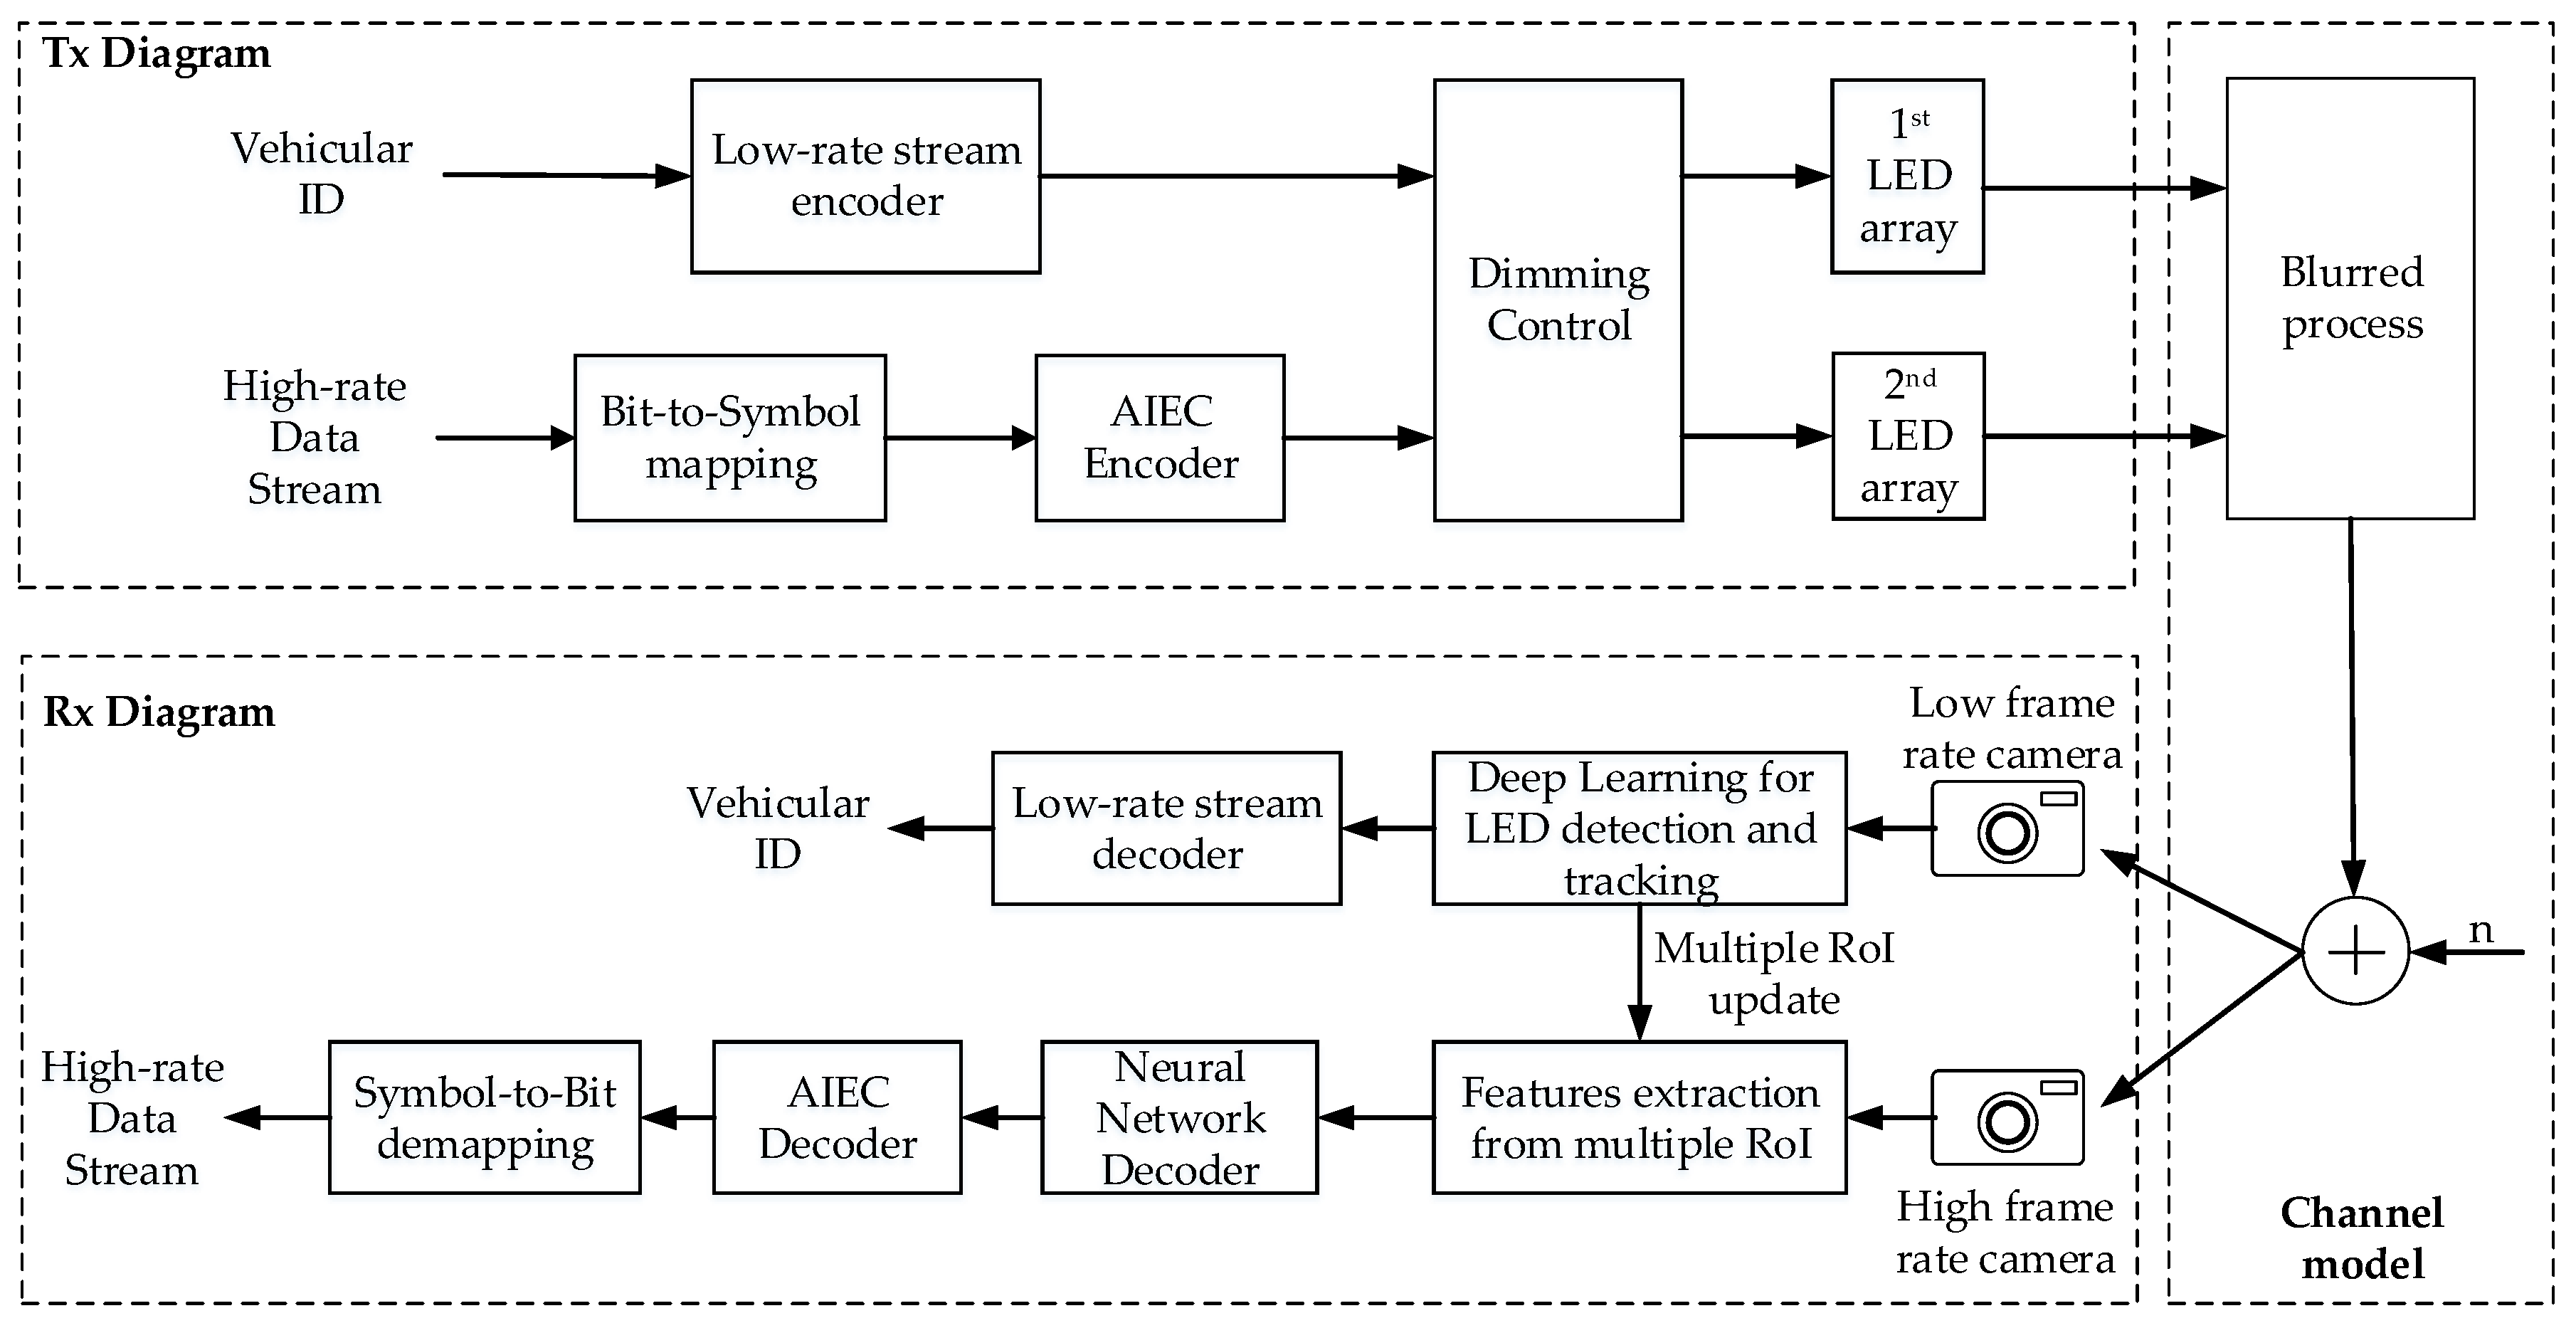
In this subsection, we discuss the technical issues associated with the high-rate OCC system proposed in this paper and the role of AI techniques in our analyzed system. Figure 6 shows the overall architecture of the proposed system. At first, the Tx diagram should remain the same as in the architecture of the vehicular RoI signaling system in [4]. The innovation in our work here mostly relies on the channel condition after Tx, where we considered the blurring process on LED images before the noise addition process. This consideration makes it more challenging for Rx to detect RoI and decode a high-rate data stream, notably when using the traditional method based on a linear mathematical model with fixed parameters.
These technical issues lead to the design of an adaptive Rx that could be trained to self-modify its parameters and better reflect the correlation between real-world input data and our desired system output. To be more detailed, AI algorithms could be applied in Rx to enable the following two tasks: Multiple RoIs detection and tracking based on You Only Look Once (YOLO) framework [40] and the RoI information from S2-PSK scheme [8], enhancing the reliability of decoding data by using NN-based decoder for decoding the bit stream, and AI-based error correction (AIEC) for mitigating the error caused by channel condition [41]. In this paper, we focus on designing and analyzing the performance of an NN-based decoder to decode data which are contaminated by the blur process and noise.
Furthermore, Figure 7 illustrates a process where an NN decoder learning from real-world input data can adjust its parameters to minimize the bias between a predicted value and the actual S_Phase value of a LED group based on the optimization algorithm.
In our experiments, we utilized LabVIEW to generate datasets for training an NN-based decoder and SER evaluation for several cases. Each dataset had to label samples of a pair of LED groups. We trained our model with 80% of datasets with the lowest SNR at each dimming level. The theoretical principle of our simulation is discussed in the following subsection.
4.3. Performance Analysis
4.3.1. Blurred Image—Principle and Simulation Method
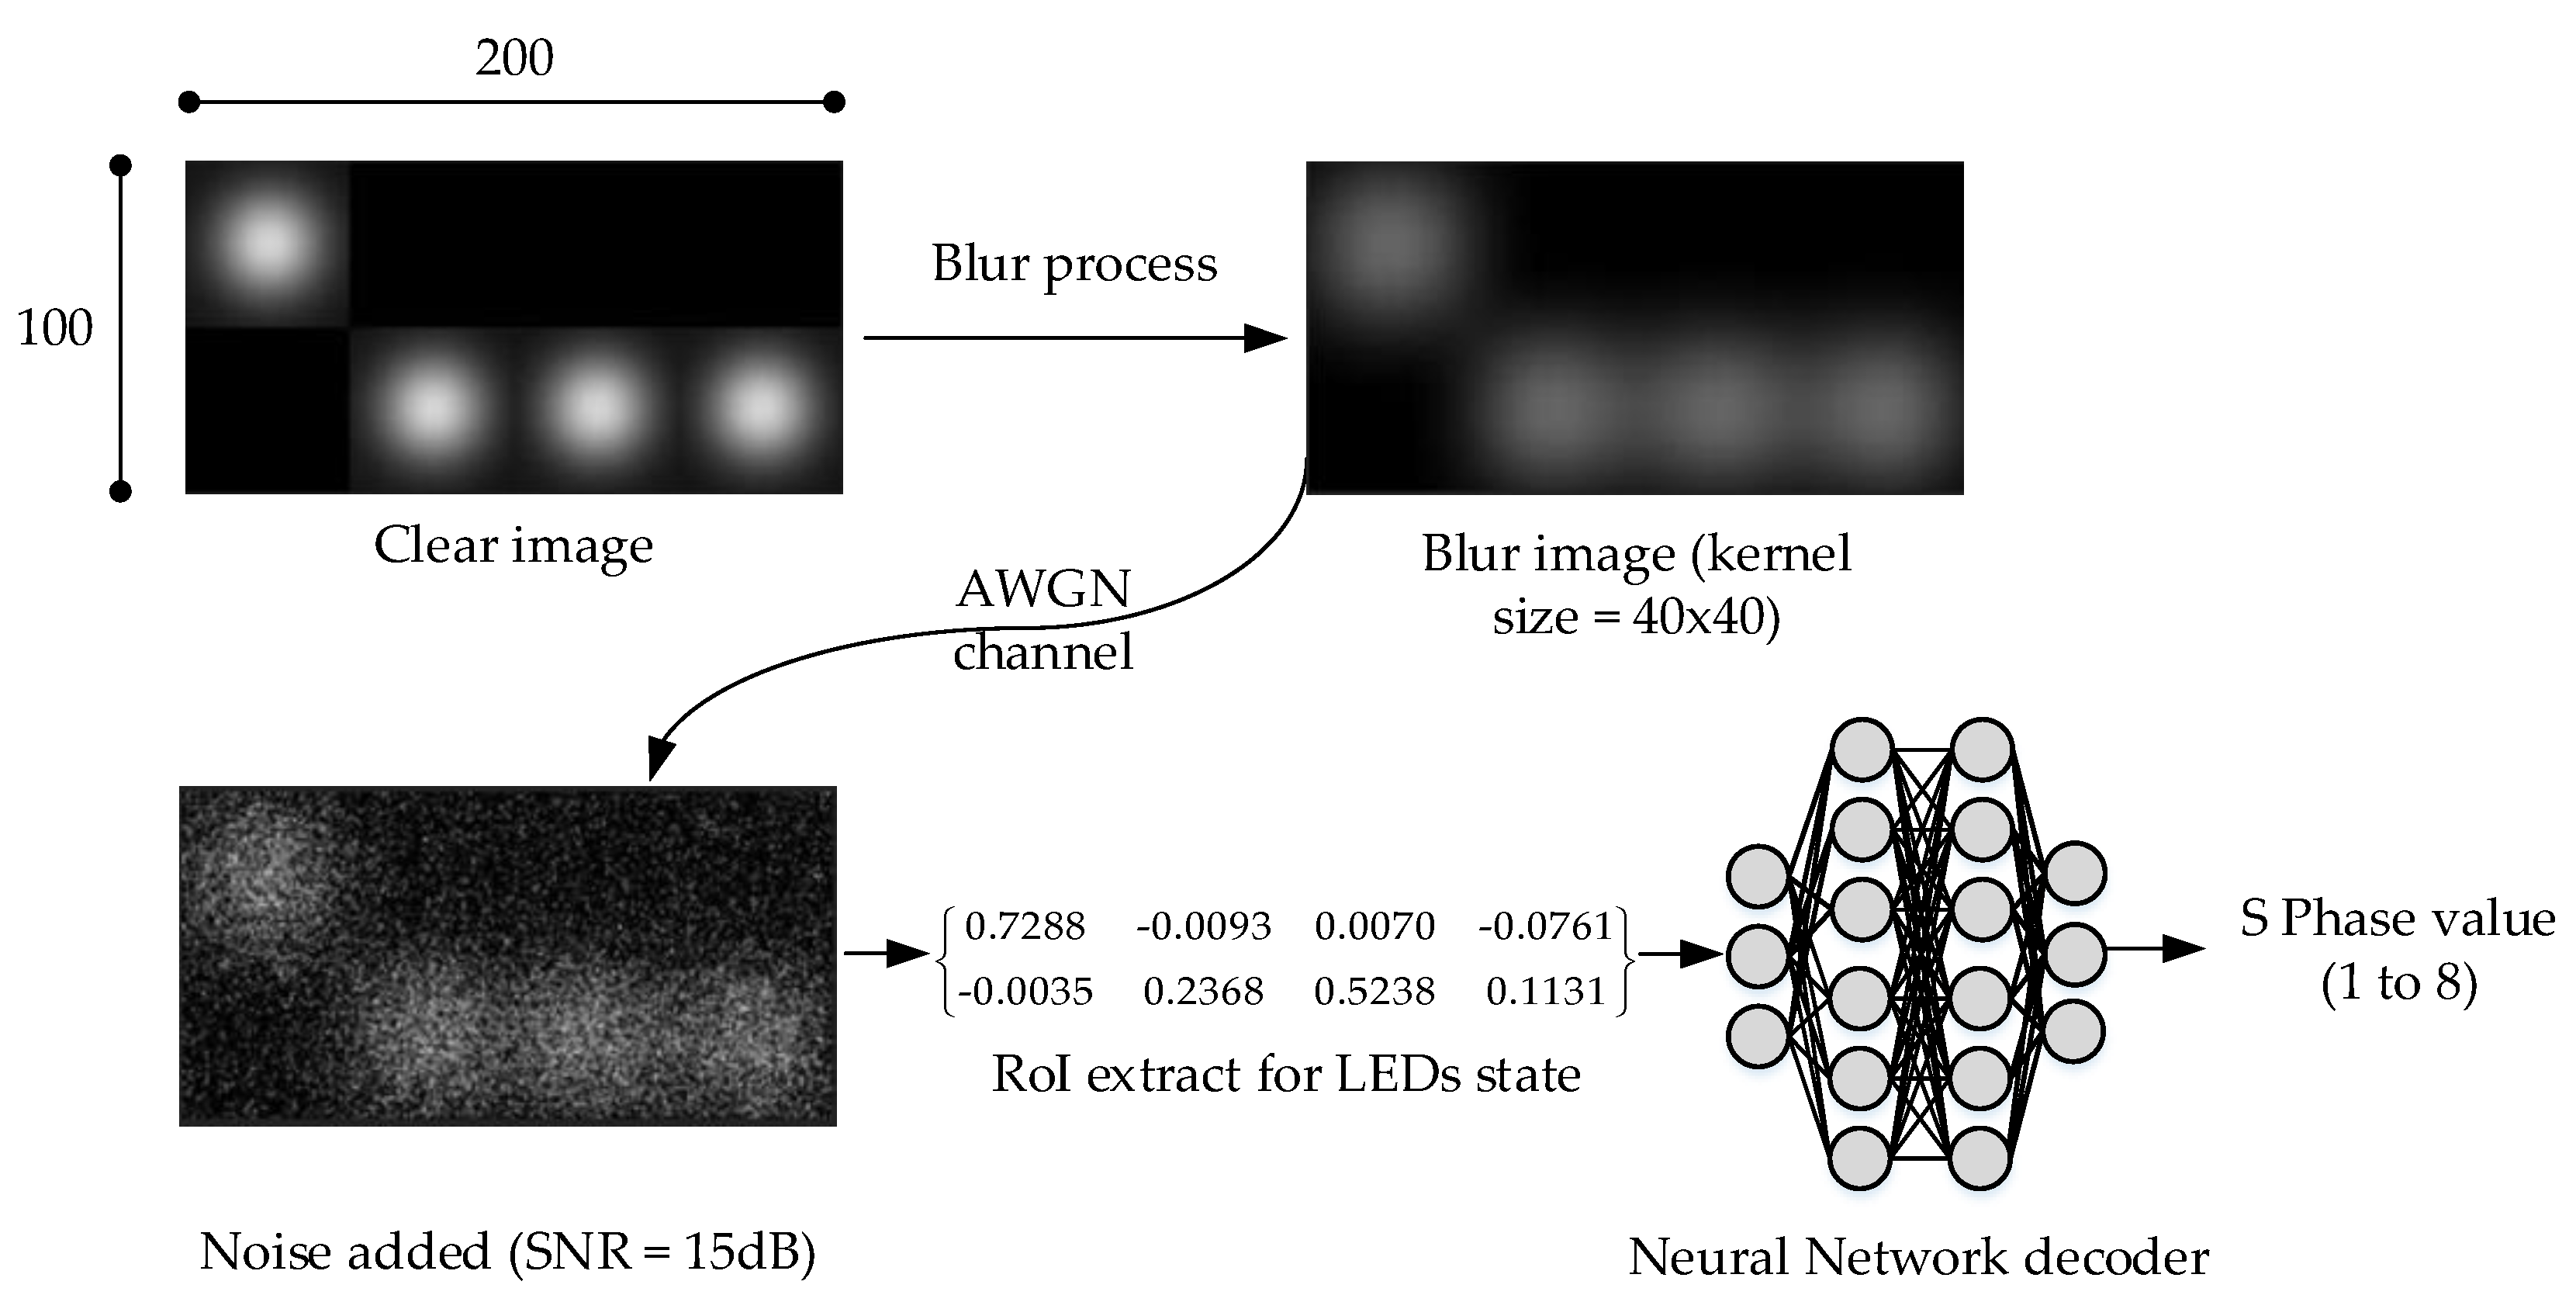
On the basis of the findings in [30,31,32,33,34,35,36], the received image of LEDs which is contaminated by the blur process and noise can be obtained by a convolutional process of the blur kernel with a clear image of LEDs, followed by the addition of noise, as follows:
where y is the captured image matrix, h is the blur kernel matrix, x is the original image matrix, and n is the noise matrix. Note that all of the matrices here are two-dimensional, as the LEDs image will be converted to a grayscale format.
In our experiment, each LED occupies a 50 × 50 area on the image. Thus, the clear image of LEDs group is a 2D matrix with size = 100 x 200 pixels (rows x columns). The blur kernel is also a 2D square matrix, with a matrix size is 20 x 20, 40 x 40, 60 x 60 and 80 x 80 pixels. All cells in a blur kernel will take equal values and add to one, so each cell of the blur kernel will take value of . The output matrix of the convolution between a blur kernel and a LEDs image will have a full size of: . To have the final blur image in our experiments with the same size as an original image, we make a crop on a product matrix C at the row and column index equal to blur_size/2.
For clarity purposes, in our data simulation for training and performance testing on SER value, firstly we collected a basic set of clean data. These basic sets should be sufficient to represent all S_Phase values corresponding to each dimming level, which are mapped in Table 2 or Table 3. Observe that, to use Table 3 as the basic clean set of images, the values of the two x variables need to be from zero to one, and the sum value of the two x has to be one (to guarantee that the sum of all LED states is equal to the dimming level). Figure 8 illustrates the whole process of contaminating the clean image set with blur and noise using (7) in order to create a dataset for training the neural-network-based decoder as well as the test set for SER evaluation.
4.3.2. Performance Analysis
(a) Blur kernel size
To analyze the effect of blur kernel size on data decoding quality, we performed a simulation analysis on several sets of images which are blurred by different blur kernel sizes. Figure 9 shows the testing performance of decoding data from images which are non-blurry, blurred by a 40 × 40 kernel, and blurred by an 80 × 80 kernel using two different methods: A general PSK scheme decoding technique using a matched filter and our proposed technique using an NN. The dimming level is set to 4/8 or 50% throughout this simulation.
The results of this experiment reveal that our NN-based decoder improves the decoding SER more significantly than the general decoding technique using a matched filter. Generally, our target SER value for the feasibility of a vehicular OCC system is . We analyzed the required SNR and achieved this target value.
In the non-blur case, to achieve an SER below , the required SNR of our NN decoding must be improved by 2 dB, in contrast to using a matched filter. With a blur kernel size of 40 × 40, the improvement on the SNR of the NN-based decoding is approximately 2.2 dB. However, with a blur kernel size of 80 × 80, our decoder achieved the target SER value at an SNR of 40 dB, and the matched filter achieved an SER of at the same SNR value. Notably, the improvement of the required SNR increases when the blur kernel size is increased (see Figure 9).
The difference in our data preprocessing technique is attributed to the key factor. From each image of the transmitter LED group, we extracted central point intensities of eight LEDs in each group and translated them to fuzzy logic states of 16 LEDs (two groups) for input features of the NN-based decoder. For the AWGN channel feature, we used the standard deviation value , which can be measured and calculated from the SNR value utilized in [8].
From Figure 7, besides the LED states and the standard deviation of Gaussian noise, we propose new features which reflect the dimming cases and blur kernel property, calculated as follows:
Here, the dimming value is from 1 to 7, kernel_area is the number of pixels that the blur kernel occupied on the LED image, and image_area is the total number of pixels on the LED image (200 × 100 pixels). It is worthy of note that the kernel area in this equation is calculated on the central point of each LED in the LED group, which is clearly illustrated in Figure 10 and Figure 11.
In Figure 10, we considered the case where the blur kernel size does not exceed the size of one LED area on the image (50 × 50 in this case). Therefore, when calculating the after-blurred intensity of the LED central point, the whole area of a blur kernel will be inside the cropped image of the LED group.
In Figure 11, the size of a blur kernel (60 × 60) exceeds the size of one LED area on the image (50 × 50), so the exact area of the blur kernel inside a cropped image for calculating the after-blurred intensity of the LED central point will be part of the blur kernel.
(b) Dimming
Dimming level is also one of the essential features that directly affect the decoding performance of a communication system, especially when the blur effect is occurring. This impact could be significant or trivial depending on the blur kernel size. More precisely, the dimming level is the ratio of the blur kernel size and the LED area on the image. From Figure 10, when the blur kernel area is within the LED area of an image, the blur effect for the central points of LEDs will occur in each LED illumination area. Thus, in this case, the impact of dimming level on the decoding performance is trivial, as illustrated in Figure 12 with a blur kernel size of 40 × 40.
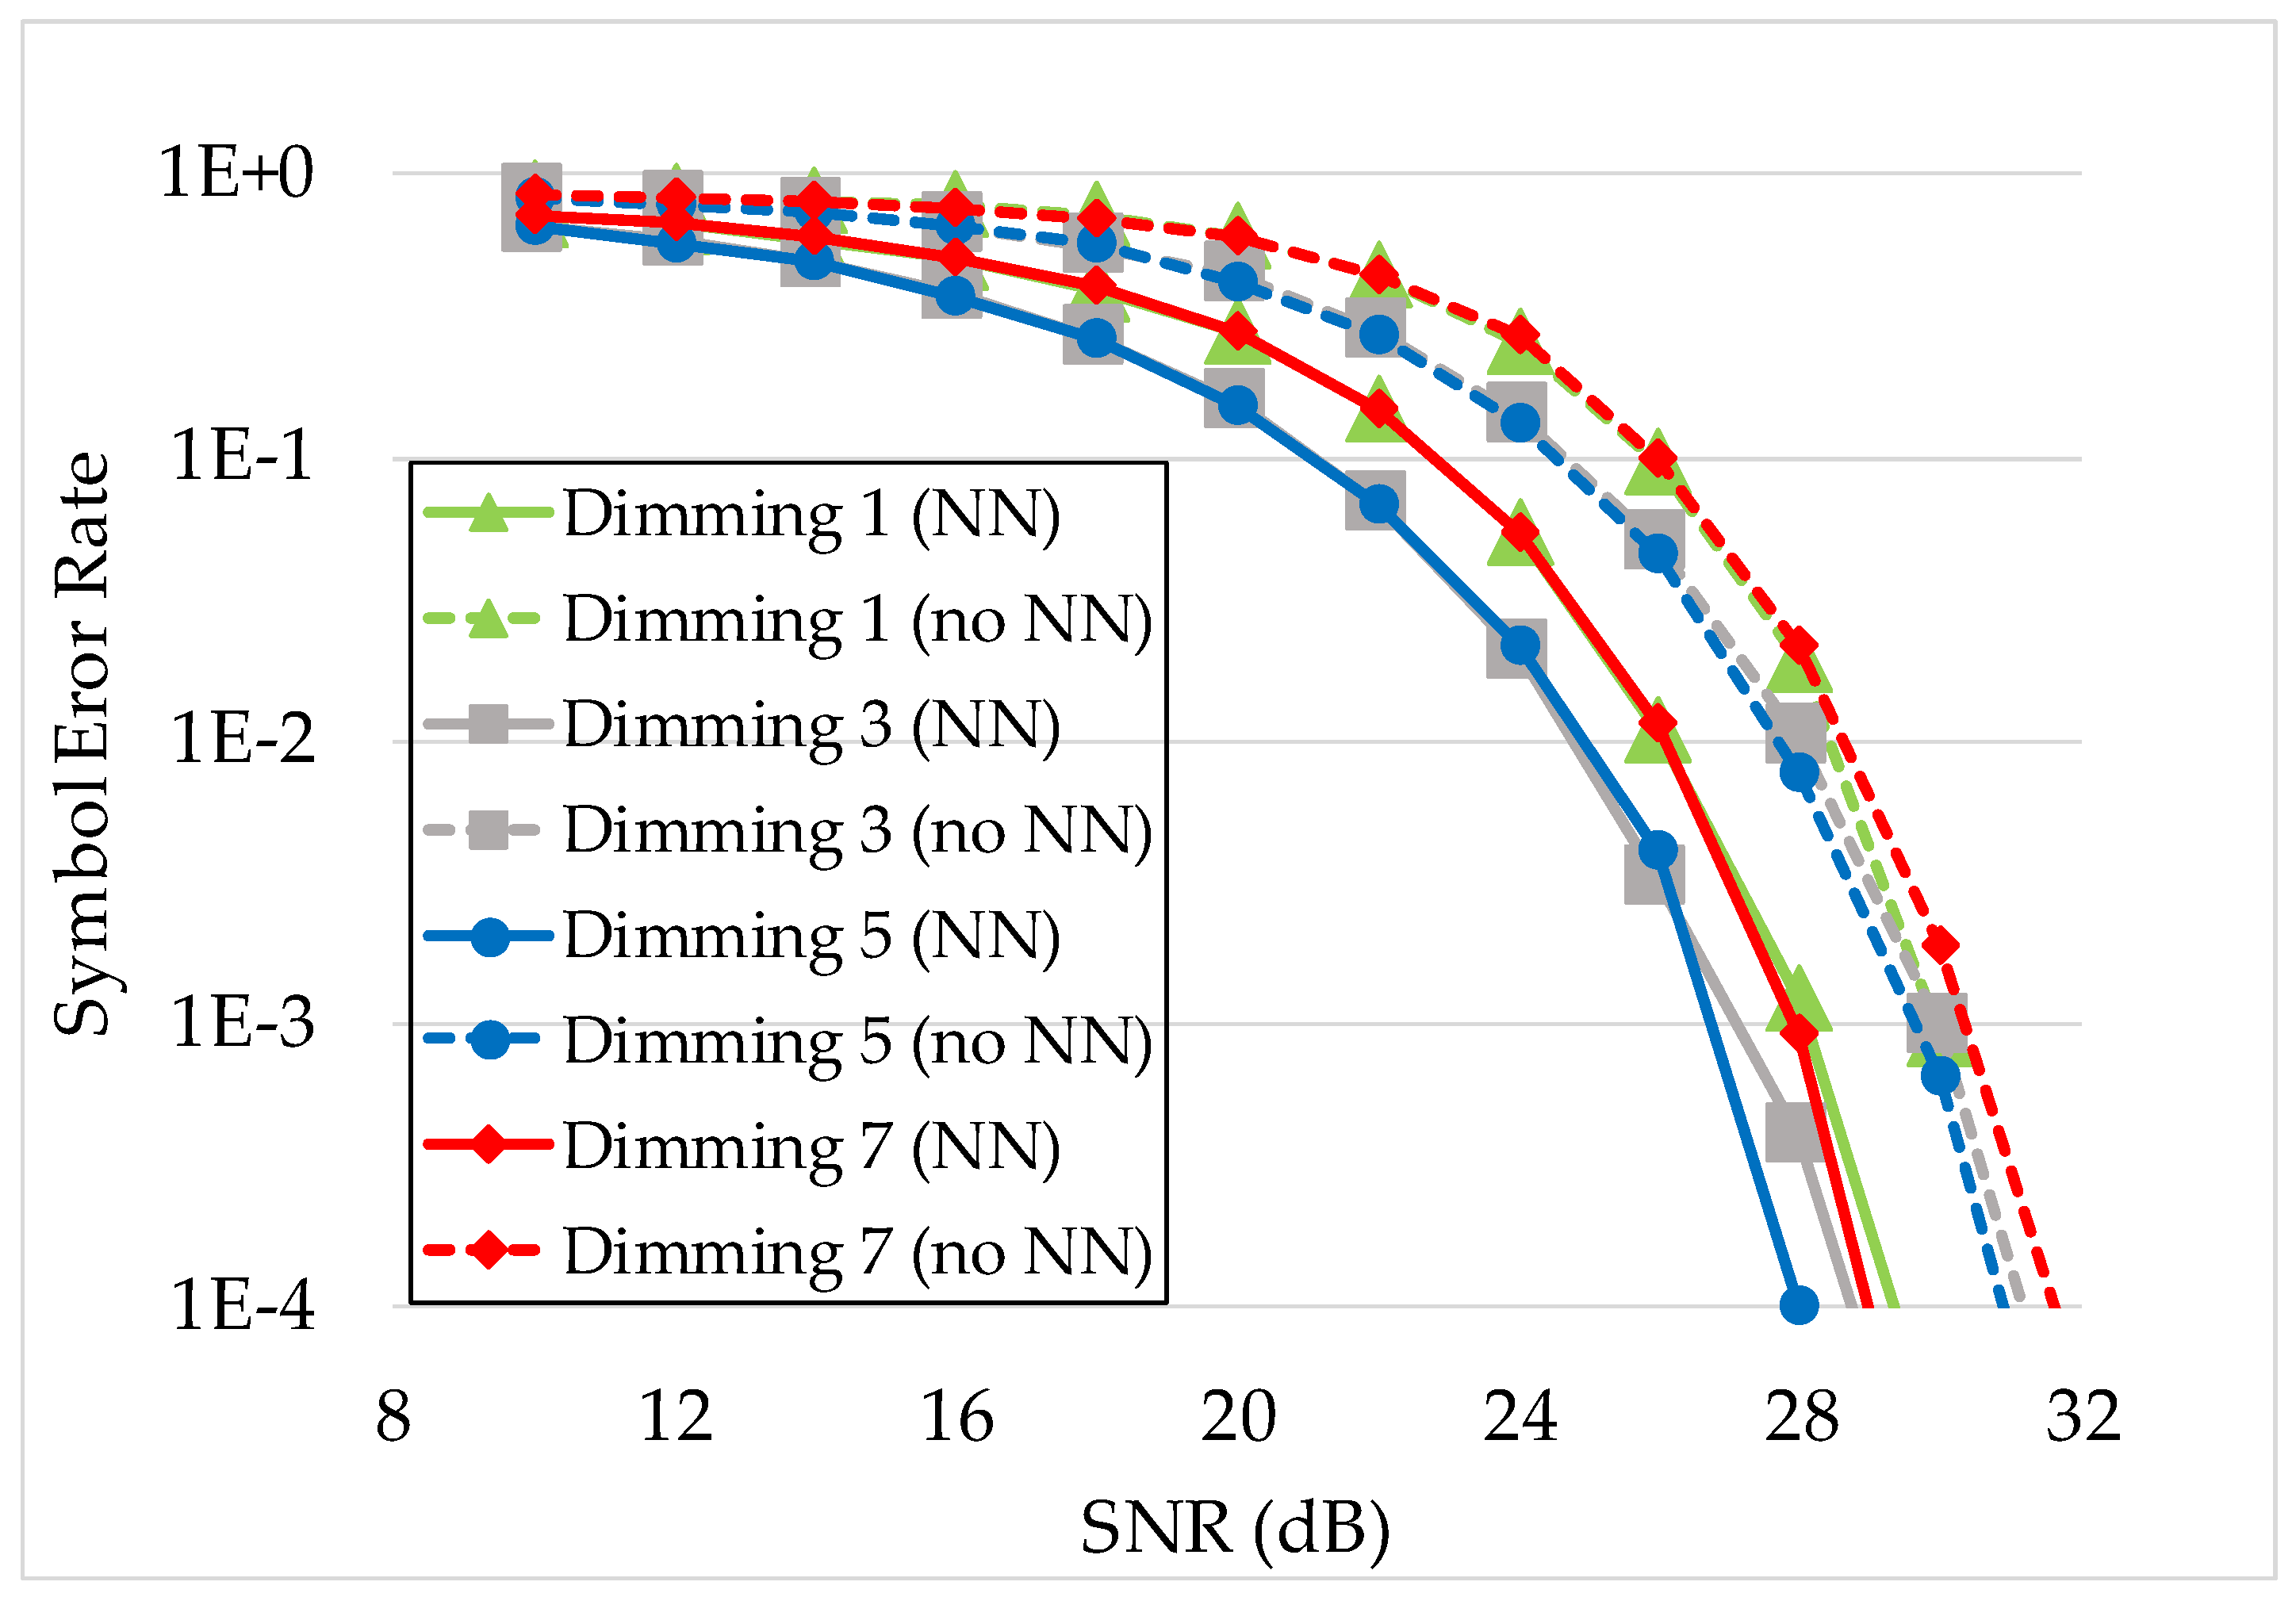
On the other hand, when the blur kernel size exceeds the area of one LED on the image, the blur effect to the central point of each LED is also mixed with a part of other nearby LED illumination area. Thus, the impact of the dimming level could be significant. Figure 13 shows the decoding performance of our NN-based decoder for DS8-PSK, which are evaluated based on the SER value with a blur kernel size of 60 × 60.
The similarity feature that can be realized from both cases is that there always the significant separation of the dimming 1 and dimming 7 lines from other dimming lines. To be more detailed, these two dimming cases always yield the worst SER performance. The reason is that the two cases have one LED ON (or OFF in dimming 7/8) and seven other LEDs have the opposite state. Consequently, the probability of wrongly decoding in these cases happens when the unique LED and one among other seven similar LEDs are detected with false states. This error probability can be expressed as follows:
With the dimming from 2/8 to 6/8, the performance lines are approximately similar. Moreover, the theoretical error decoding probability of each dimming case could be easily calculated as follows:
Notably, it can also be assumed that the portions of error probability with an exponent equal or greater than four could be insignificant, in which case the error probability of all dimming cases from 2/8 to 6/8 could be approximately the same (), provided that the bit error probability () is equal for all LEDs.
5. Conclusions
In this paper, we discussed the technical challenges in vehicular OCC systems. Owing to these challenges, many studies has been carried out to enhance the performance of the OCC to be feasible with the vehicular communication scenario. The blurring process on an image is also a critical issue that needs to be considered in this context. This paper focuses on analyzing the blurring phenomenon on an image and its effects on vehicular OCC systems. In this regard, we provided a mathematical model and a simulation method of a blurred image.
We also introduced a vehicular OCC system using a hybrid waveform of RoI signaling and a high-rate waveform for data streaming. HS-PSK, which is a combination of the low-rate scheme S2-PSK and the high-rate scheme DS8-PSK, was introduced in IEEE 802.15.7-2019 standard [30] as a solution for vehicular OCC systems, and S2-PSK was already presented in [8]. As an update, we contribute a novel decoding method using AI concept for the existing DS8-PSK single-carrier modulation scheme. A simulation was performed on grayscale images of the LED array which were captured and rescaled to be all 100 × 200 in size. Our SER versus SNR simulation has not only considered the blurring level but also concerned the AWGN effect on all images in both training and testing dataset. Also, the performance of our proposed decoder for DS8-PSK has been compared to a previous DS8-PSK decoder using a traditional matched filter. Finally, we provided experimental results to validate the robustness of the proposed NN-based decoder over simulating channel conditions.
Author Contributions
All authors contributed to this paper: T.L.P. and T.N. proposed the idea and simulation methodology; T.N. collect data and create the first version of data augmentation software; T.L.P. optimized software, proposed and designed the NN-based decoder, performed all experiments and wrote paper; H.N. verified the experiment process and results, reviewed and edited paper; and Y.M.J. supervised the work and provided funding support.
Funding
This research was supported by the MSIT (Ministry of Science and ICT), Korea, under the ITRC (Information Technology Research Center) support program (IITP-2018-0-01396) supervised by the IITP (Institute for Information & communications Technology Promotion).
Conflicts of Interest
The authors declare no conflict of interest.
References
- Nagura, T.; Yamazato, T.; Katayama, M.; Yendo, T.; Fujii, T.; Okada, H. Improve decoding method of visible light communication system for ITS using LED array and high-speed camera. In Proceedings of the IEEE 71st Vehicular Technology Conference, Taipei, Taiwan, 16–19 May 2010. [Google Scholar]
- Pathak, P.H.; Feng, X.; Hu, P.; Mohapatra, P. Visible light communication networking and sensing: A survey potential and challenges. IEEE Commun. Surv. Tutor. 2015, 17, 2047–2077. [Google Scholar] [CrossRef]
- Rajagopal, S.; Roberts, R.D.; Lim, S.-K. IEEE 802.15.7 visible light communication: Modulation and dimming support. IEEE Commun. Mag. 2012, 50, 72–82. [Google Scholar] [CrossRef]
- Nguyen, T.; Islam, A.; Hossan, T.; Jang, Y.M. Current status and performance analysis of optical camera communication technologies for 5G networks. IEEE Access 2017, 5, 4574–4594. [Google Scholar] [CrossRef]
- Nguyen, D.T.; Park, S.; Chae, Y.; Park, Y. VLC/OCC hybrid optical wireless systems for versatile indoor applications. IEEE Access 2019, 7, 22371–22376. [Google Scholar] [CrossRef]
- Lin, B.; Ghassemlooy, Z.; Lin, C.; Tang, X.; Li, Y.; Zhang, S. An indoor visible light positioning system based on optical camera communications. IEEE Photonics Technol. Lett. 2017, 29, 579–582. [Google Scholar] [CrossRef]
- Jiao, J.; Li, F.; Deng, Z.; Ma, W. A smartphone camera-based indoor positioning algorithm of crowded scenarios with the assistance of deep CNN. Sensors 2017, 17, 704. [Google Scholar] [CrossRef]
- Nguyen, T.; Islam, A.; Jang, Y.M. Region-of-interest signaling vehicular system using optical camera communications. IEEE Photonics J. 2017, 9. [Google Scholar] [CrossRef]
- Ji, P.; Tsai, H.M.; Wang, C.; Liu, F. Vehicular visible light communications with LED tail light and rolling shutter camera. In Proceedings of the IEEE 79th Vehicular Technology Conference (VTC Spring), Seoul, Korea, 18–21 May 2014; pp. 1–6. [Google Scholar]
- Tram, V.T.B.; Yoo, M. Vehicle-to-vehicle distance estimation using a low-resolution camera based on visible light communications. IEEE Access 2018, 6, 4521–4527. [Google Scholar] [CrossRef]
- Cailean, A.-M.; Dimian, M. Current challenges for visible light communications usage in vehicle applications: A survey. IEEE Commun. Surv. Tutor. 2017, 19, 2681–2703. [Google Scholar] [CrossRef]
- Khan, L.U. Visible light communication: Applications, architecture, standardization, and research challenges. Digit. Commun. Netw. 2017, 3, 78–88. [Google Scholar] [CrossRef]
- Kundur, D.; Hatzinakos, D.; Leung, H. Robust classification of blurred imagery. IEEE Trans. Image Process. 2000, 9, 9–243. [Google Scholar] [CrossRef] [PubMed]
- He, K.; Zhang, X.; Ren, S.; Sun, J. Deep residual learning for image recognition. In Proceedings of the 2016 IEEE Conference on Computer Vision and Pattern Recognition, Las Vegas, NV, USA, 27–30 June 2016; pp. 770–778. [Google Scholar]
- Sutskever, I.; Vinyals, O.; Le, Q.V. Sequence to sequence learning with neural networks. In Proceedings of the 27th International Conference on Neural Information Processing Systems, Montreal, QC, Canada, 8–13 December 2014; pp. 3104–3112. [Google Scholar]
- Chen, C.; Seff, A.; Kornhauser, A.; Xiao, J. DeepDriving: Learning affordance for direct perception in autonomous driving. In Proceedings of the IEEE International Conference on Computer Vision, Santiago, Chile, 7–13 December 2015; pp. 2722–2730. [Google Scholar]
- Nachmani, E.; Be’ery, Y.; Burshtein, D. Learning to decode linear codes using deep learning. In Proceedings of the 54th Annual Allerton Conference on Communication, Control, and Computing (Allerton), Monticello, IL, USA, 27–30 September 2016; pp. 341–346. [Google Scholar]
- O’Shea, T.J.; Hoydis, J. An introduction to deep learning for the physical layer. IEEE Trans. Cogn. Commun. Netw. 2017, 3, 563–575. [Google Scholar] [CrossRef]
- Cammerer, S.; Gruber, T.; Hoydis, J.; ten Brink, S. Scaling deep learning-based decoding of polar codes via partitioning. arXiv 2015, arXiv:1702.06901. [Google Scholar]
- Ye, H.; Li, G.Y.; Juang, B. Power of deep learning for channel estimation and signal detection in OFDM systems. IEEE Wirel. Commun. Lett. 2018, 7, 114–117. [Google Scholar] [CrossRef]
- Dörner, S.; Cammerer, S.; Hoydis, J.; Brink, S.T. Deep learning based communication over the air. IEEE J. Sel. Top. Signal. Process. 2018, 12, 12–132. [Google Scholar] [CrossRef]
- Liang, F.; Shen, C.; Wu, F. An iterative BP-CNN architecture for channel decoding. IEEE J. Sel. Top. Signal. Process. 2018, 12, 12–144. [Google Scholar] [CrossRef]
- Ghassemlooy, Z.; Rajbhandari, S. Performance of diffused indoor optical wireless links employing neural and adaptive linear equalizers. In Proceedings of the 2007 6th International Conference on Information, Communications & Signal Processing, Singapore, 10–13 December 2007; pp. 1–6. [Google Scholar]
- Zhang Hao. Loss Functions in Neural Networks. Available online: https://isaacchanghau.github.io/post/loss_functions/ (accessed on 10 May 2019).
- Optimization techniques comparison in Julia: SGD, Momentum, Adagrad, Adadelta, Adam. Available online: https://int8.io/comparison-of-optimization-techniques-stochastic-gradient-descent-momentum-adagrad-and-adadelta/ (accessed on 17 April 2019).
- Duchi, J.; Hazan, E.; Singer, Y. Adaptive subgradient methods for online learning and stochastic optimization. J. Mach. Learn. Res. 2011, 12, 2121–2159. [Google Scholar]
- Goodfellow, I.; Bengio, Y.; Courville, A.C. Deep Learning; MIT Press: Cambridge, MA, USA, 2016. [Google Scholar]
- Dean, J.; Corrado, G.; Monga, R.; Chen, K.; Devin, M.; Mao, M.; Ranzato, M.; Senior, A.; Tucker, P.; Yang, K.; et al. Large scale distributed deep networks. Neural Inf. Process. Syst. 2012, 1, 1232–1240. [Google Scholar]
- Ran, X.; Shan, Z.; Fang, Y.; Lin, C. Travel Time Prediction by Providing Constraints on a Convolutional Neural Network. IEEE Access 2018, 6, 6–59336. [Google Scholar] [CrossRef]
- Kookmin University PHY sub-proposal for ISC using Dimmable Spatial M-PSK (DSM-PSK). 2016. Available online: https://mentor.ieee.org/802.15/dcn/16/15-16-0015 -02-007a-kookmin-university-phy-sub-proposal-for-isc-using-dimmablespatial-m-psk-dsm-psk.pptx (accessed on 3 April 2019).
- Reeves, S.J.; Mersereau, R.M. Blur identification by the method of generalized cross-validation. IEEE Trans. Image Process. 1992, 1, 301–311. [Google Scholar] [CrossRef]
- Kundur, D.; Hatzinakos, D. Blind image deconvolution. IEEE Signal. Process. Mag. 1996, 13, 43–64. [Google Scholar] [CrossRef]
- Shan, Q.; Jia, J.; Agarwala, A. High-quality motion deblurring from a single image. ACM Trans. Graph. 2008, 27, 73. [Google Scholar] [CrossRef]
- Cai, J.-F.; Ji, H.; Liu, C.; Shen, Z. Blind motion deblurring using multiple images. J. Comput. Phys. 2009, 228, 5057–5071. [Google Scholar] [CrossRef]
- Zhang, H.; Wipf, D.; Zhang, Y. Multi-observation blind deconvolution with an adaptive sparse prior. IEEE Trans. Pattern Anal. Mach. Intell. 2014, 36, 1628–1643. [Google Scholar] [CrossRef] [PubMed]
- Sroubek, F.; Milanfar, P. Robust multichannel blind deconvolution via fast alternating minimization. IEEE Trans. Image Process. 2012, 21, 1687–1700. [Google Scholar] [CrossRef] [PubMed]
- Lin, T.; Hou, L.; Liu, H.; Li, Y.; Truong, T. Reconstruction of single image from multiple blurry measured images. IEEE Trans. Image Process. 2018, 27, 27–2762. [Google Scholar] [CrossRef]
- Roberts, R.D. A MIMO protocol for camera communications (CamCom) using undersampled frequency shift ON-OFF keying (UFSOOK). In Proceedings of the IEEE Globecom Workshops (GC Wkshps), Atlanta, GA, USA, 9–13 December 2013; pp. 1052–1057. [Google Scholar]
- Roberts, R.D. Intel Proposal in IEEE 802.15.7r1, Slide 1-129. Available online: https://mentor.ieee. org/802.15/dcn/16/15-16-0006-01-007a-intel-occ-proposal.pdf (accessed on 3 April 2019).
- Redmon, J.; Divvala, S.K.; Girshick, R.B.; Farhadi, A. You only look once: Unified, real-time object detection. arXiv 2015, arXiv:1506.02640. [Google Scholar]
- Pham, T.L.; Nguyen, T.; Thieu, M.D.; Nguyen, H.; Nguyen, H.; Jang, Y.M. An Artificial Intelligence-based Error Correction for Optical Camera Communication. Presented at the 2019 Eleventh International Conference on Ubiquitous and Future Networks (ICUFN), Zagreb, Croatia, 2–5 July 2019. in press. [Google Scholar]
Figure 1.
(a) A regression neural network and (b) the processing role of each neuron. (Adapted from [23]).
Figure 1.
(a) A regression neural network and (b) the processing role of each neuron. (Adapted from [23]).

Figure 2.
Reference architecture of the region-of-interest (RoI) signaling system employing DS8-PSK.
Figure 2.
Reference architecture of the region-of-interest (RoI) signaling system employing DS8-PSK.

Figure 3.
Reference architecture of the dimmable spatial 8-phase shift keying (DS8-PSK) transmitter.
Figure 3.
Reference architecture of the dimmable spatial 8-phase shift keying (DS8-PSK) transmitter.

Figure 4.
An illustration of sampling DS8-PSK waveform and calculate S_Phase_Shift with dimming level = 4/8 (50%).
Figure 4.
An illustration of sampling DS8-PSK waveform and calculate S_Phase_Shift with dimming level = 4/8 (50%).

Figure 5.
An illustration of bad-sampling issues on the receiver (Rx) camera and the set of LED group states including unclear LED states (dimming level = 4/8).
Figure 5.
An illustration of bad-sampling issues on the receiver (Rx) camera and the set of LED group states including unclear LED states (dimming level = 4/8).

Figure 6.
Proposed optical camera communication (OCC) system architecture using AI algorithms for RoI detection and decoding the DS8-PSK scheme from LED arrays.
Figure 6.
Proposed optical camera communication (OCC) system architecture using AI algorithms for RoI detection and decoding the DS8-PSK scheme from LED arrays.

Figure 7.
The principle of training a neural network (NN)-based decoder for blurry and noisy data.

Figure 8.
Illustration of data augmentation with the blur process and noisy channel for neural network-based decoder training and performance evaluation.
Figure 8.
Illustration of data augmentation with the blur process and noisy channel for neural network-based decoder training and performance evaluation.

Figure 9.
The decoding performance analysis of the matched filter and neural network-based decoder on blurred and noisy images (difference blur kernel, AWGN channel).
Figure 9.
The decoding performance analysis of the matched filter and neural network-based decoder on blurred and noisy images (difference blur kernel, AWGN channel).

Figure 10.
The calculation of the ratio of the blur kernel area in the image with kernel size = 40 × 40.
Figure 10.
The calculation of the ratio of the blur kernel area in the image with kernel size = 40 × 40.

Figure 11.
The calculation of the ratio of the blur kernel area in the image with kernel size = 60 × 60.
Figure 11.
The calculation of the ratio of the blur kernel area in the image with kernel size = 60 × 60.

Figure 12.
The comparison of symbol error rate (SER) performance between an NN-based decoder and a matched filter on different dimming cases with a blur kernel size of 40 × 40.
Figure 12.
The comparison of symbol error rate (SER) performance between an NN-based decoder and a matched filter on different dimming cases with a blur kernel size of 40 × 40.

Figure 13.
The comparison of SER performance between an NN-based decoder and a matched filter on different dimming cases with a blur kernel size of 60 × 60.
Figure 13.
The comparison of SER performance between an NN-based decoder and a matched filter on different dimming cases with a blur kernel size of 60 × 60.


Table 1.
Mapping table from bits to S_Phase_Shift value (Adapted from [30]).
Table 1.
Mapping table from bits to S_Phase_Shift value (Adapted from [30]).
| 3 bits Input | S_Phase_Shift/(T/8) Output |
|---|---|
| 000 | 0 |
| 001 | 1 |
| 010 | 2 |
| 011 | 3 |
| 100 | 4 |
| 101 | 5 |
| 110 | 6 |
| 111 | 7 |
Table 2.
S_Phase value definition for the captured set of binary LED group states under dimming condition (Adapted from [30]).
Table 2.
S_Phase value definition for the captured set of binary LED group states under dimming condition (Adapted from [30]).
| 8 States Input | S_Phase Output | ||||||
|---|---|---|---|---|---|---|---|
| Dimming 1/8 | Dimming 2/8 | Dimming 3/8 | Dimming 4/8 | Dimming 5/8 | Dimming 6/8 | Dimming 7/8 | |
| 10000000 | 10000001 | 10000011 | 10000111 | 10001111 | 10011111 | 10111111 | 1 |
| 01000000 | 11000000 | 11000001 | 11000011 | 11000111 | 11001111 | 11011111 | 2 |
| 00100000 | 01100000 | 11100000 | 11100001 | 11100011 | 11100111 | 11101111 | 3 |
| 00010000 | 00110000 | 01110000 | 11110000 | 11110001 | 11110011 | 11110111 | 4 |
| 00001000 | 00011000 | 00111000 | 01111000 | 11111000 | 11111001 | 11111011 | 5 |
| 00000100 | 00001100 | 00011100 | 00111100 | 01111100 | 11111100 | 11111101 | 6 |
| 00000010 | 00000110 | 00001110 | 00011110 | 00111110 | 01111110 | 11111110 | 7 |
| 00000001 | 00000011 | 00000111 | 00001111 | 00011111 | 00111111 | 01111111 | 8 |
Table 3.
S_Phase value definition for the captured set of unclear LED group states under dimming condition (Adapted from [30]).
Table 3.
S_Phase value definition for the captured set of unclear LED group states under dimming condition (Adapted from [30]).
| 8 States Input | S_Phase Output | ||||||
|---|---|---|---|---|---|---|---|
| Dimming 1/8 | Dimming 2/8 | Dimming 3/8 | Dimming 4/8 | Dimming 5/8 | Dimming 6/8 | Dimming 7/8 | |
| xx000000 | 1x00000x | 1x0000x1 | 1x000x11 | 1x00x111 | 1x0x1111 | 1xx11111 | 1 |
| 0xx00000 | x1x00000 | 11x0000x | 11x000x1 | 11x00x11 | 11x0x111 | 11xx1111 | 2 |
| 00xx0000 | 0x1x0000 | x11x0000 | 111x000x | 111x00x1 | 111x0x11 | 111xx111 | 3 |
| 000xx000 | 00x1x000 | 0x11x000 | x111x000 | 1111x00x | 1111x0x1 | 1111xx11 | 4 |
| 0000xx00 | 000x1x00 | 00x11x00 | 0x111x00 | x1111x00 | 11111x0x | 11111xx1 | 5 |
| 00000xx0 | 0000x1x0 | 000x11x0 | 00x111x0 | 0x1111x0 | x11111x0 | 111111xx | 6 |
| 000000xx | 00000x1x | 0000x11x | 000x111x | 00x1111x | 0x11111x | x111111x | 7 |
| x000000x | x00000x1 | x0000x11 | x000x111 | x00x1111 | x0x11111 | xx111111 | 8 |
© 2019 by the authors. Licensee MDPI, Basel, Switzerland. This article is an open access article distributed under the terms and conditions of the Creative Commons Attribution (CC BY) license (http://creativecommons.org/licenses/by/4.0/).
Share and Cite
MDPI and ACS Style
Pham, T.L.; Nguyen, H.; Nguyen, T.; Jang, Y.M. A Novel Neural Network-Based Method for Decoding and Detecting of the DS8-PSK Scheme in an OCC System. Appl. Sci. 2019, 9, 2242. https://doi.org/10.3390/app9112242
AMA Style
Pham TL, Nguyen H, Nguyen T, Jang YM. A Novel Neural Network-Based Method for Decoding and Detecting of the DS8-PSK Scheme in an OCC System. Applied Sciences. 2019; 9(11):2242. https://doi.org/10.3390/app9112242
Chicago/Turabian StylePham, Tung Lam, Huy Nguyen, Trang Nguyen, and Yeong Min Jang. 2019. "A Novel Neural Network-Based Method for Decoding and Detecting of the DS8-PSK Scheme in an OCC System" Applied Sciences 9, no. 11: 2242. https://doi.org/10.3390/app9112242
Note that from the first issue of 2016, this journal uses article numbers instead of page numbers. See further details here.