Mapping Areal Precipitation with Fusion Data by ANN Machine Learning in Sparse Gauged Region


1
Department of Hydraulic Engineering, Tsinghua University, Beijing 100084, China
2
State Key Laboratory of Hydro-Science and Engineering, Tsinghua University, Beijing 100084, China
3
State Key Lab of Plateau Ecology and Agriculture, Qinghai University, Xining 810016, China
4
China Renewable Energy Engineering Institute, Beijing 100120, China
*
Author to whom correspondence should be addressed.
Appl. Sci. 2019, 9(11), 2294; https://doi.org/10.3390/app9112294
Submission received: 30 March 2019
/
Revised: 18 May 2019
/
Accepted: 28 May 2019
/
Published: 4 June 2019
(This article belongs to the Special Issue Machine Learning Techniques Applied to Geoscience Information System and Remote Sensing)
Abstract
:Focusing on water resources assessment in ungauged or sparse gauged areas, a comparative evaluation of areal precipitation was conducted by remote sensing data, limited gauged data, and a fusion of gauged data and remote sensing data based on machine learning. The artificial neural network (ANN) model was used to fuse the remote sensing precipitation and ground gauge precipitation. The correlation coefficient, root mean square deviation, relative deviation and consistency principle were used to evaluate the reliability of the remote sensing precipitation. The case study in the Qaidam Basin, northwest of China, shows that the precision of the original remote sensing precipitation product of Tropical Precipitation Measurement Satellite (TRMM)-3B42RT and TRMM-3B43 was 0.61, 72.25 mm, 36.51%, 27% and 0.70, 64.24 mm, 31.63%, 32%, respectively, comparing with gauged precipitation. The precision of corrected TRMM-3B42RT and TRMM-3B43 improved to 0.89, 37.51 mm, –0.08%, 41% and 0.91, 34.22 mm, 0.11%, 42%, respectively, which indicates that the data mining considering elevation, longitude and latitude as the main influencing factors of precipitation is efficient and effective. The evaluation of areal precipitation in the Qaidam Basin shows that the mean annual precipitation is 104.34 mm, 186.01 mm and 174.76 mm based on the gauge data, corrected TRMM-3B42RT and corrected TRMM-3B43. The results show many differences in the areal precipitation based on sparse gauge precipitation data and fusion remote sensing data.
1. Introduction
Precipitation is one of the essential links in the water cycle process and varies significantly whether it is spatial or temporal [1,2]. Traditionally, the measurement of precipitation is based on a ground gauge station such as a hydrometric station or meteorological station. The gauge precipitation is identified in terms of both effectiveness and accuracy due to its direct measurement. The spatial distribution of precipitation is mostly interpolated from the gauged data. However, the accuracy of interpolation in the sparse and uneven gauged area is generally not reliable [3]. Therefore, the fusion of remote sensing data and gauged data for evaluation has become a challenging topic [4,5,6,7,8].
There are many high-resolution rainfall products at both the global and regional scales which have been released successively [9,10], such as the Global Precipitation Climate Program (GPCP), Global Satellite Mapping Precipitation Program (GSMaP), Tropical Precipitation Measurement Satellite (TRMM) and Global Precipitation Measurement (GPM) [11,12,13]. Many remote sensing precipitation products [14,15,16,17] are widely used to compensate for the shortage of gauged data areas [18,19,20,21].
However, the remote sensing precipitation production is not highly reliable due to its indirect observation which needs adjusting and evaluation [22,23,24,25]. There are many achievements published about the evaluation of remote sensing precipitation products. [26,27,28,29,30]. The precision evaluation index of remote sensing precipitation products mainly includes a correlation coefficient, determination coefficient, scatter slope, fuzzy comprehensive score, etc. [31,32,33,34]. For those remote sensing precipitation products with low precision, it is necessary to be corrected. The most used method is machine learning, such as the classification and regression tree (CART), random forest (RF), multi-factor data mining set correction, etc. [18,35]. An artificial neural network (ANN) is a powerful machine learning algorithm with a complex network structure formed by the interconnection of a large number of processing units (neurons) [36]. It is an information processing system based on imitating the structure and function of the brain neural network [37]. The theory of an ANN has made significant progress in pattern recognition [38,39], automatic control, signal processing [40], assistant decision-making, artificial intelligence [41], networking and healthcare [42,43,44,45]. It has been successfully introduced into the field of hydrology and water resources [46,47].
There are many publications on TRMM remote sensing precipitation products for applicability in specific areas [48,49,50]. Dominque et al. [51] found that the accuracy of both the total and the monthly precipitation of TRMM in the Amazon basin are high enough. Ji et al. [52] validated the accuracy of TRMM precipitation products and found it has a high accuracy in Sichuan and Chongqing in China on seasonal and monthly scales. Wang et al. [53] analyzed TRMM precipitation products with the observation data of meteorological stations in the Tianshan Mountains and its surrounding areas, and the results showed that the TRMM products had good applicability. A large number of research results showed that the accuracy of TRMM precipitation products was higher on monthly and annual scales [54,55], which could be used for analyzing the dynamic variability of a long-time precipitation sequence [56].
However, Qu et al. [57] evaluated the daily precipitation products of TRMM in the Irrawaddy River basin and found that the remote sensing precipitation and the measured values had a high correlation but a large deviation. Xu et al. [58] evaluated the TRMM precipitation in the southern part of the Qinghai–Tibet Plateau by gauged data from high-density rainfall stations and found that TRMM overestimated the amount of light rains. The altitude, slope, direction, latitude, longitude and other factors impact the accuracy of TRMM precipitation [18]. Therefore, TRMM precipitation products should be corrected before being applied in some areas, especially high mountain areas. Based on the evaluation of TRMM 3B42RT and 3B43 in the Qaidam Basin, northwest of China, this paper fused the gauged data and remote sensing data of precipitation by machine learning and assessed the rainfall resources in the Qaidam Basin. The methodology can be used in other sparse gauged areas.
2. Data and Methods
2.1. Study Area and Data Sources
2.1.1. Study Area
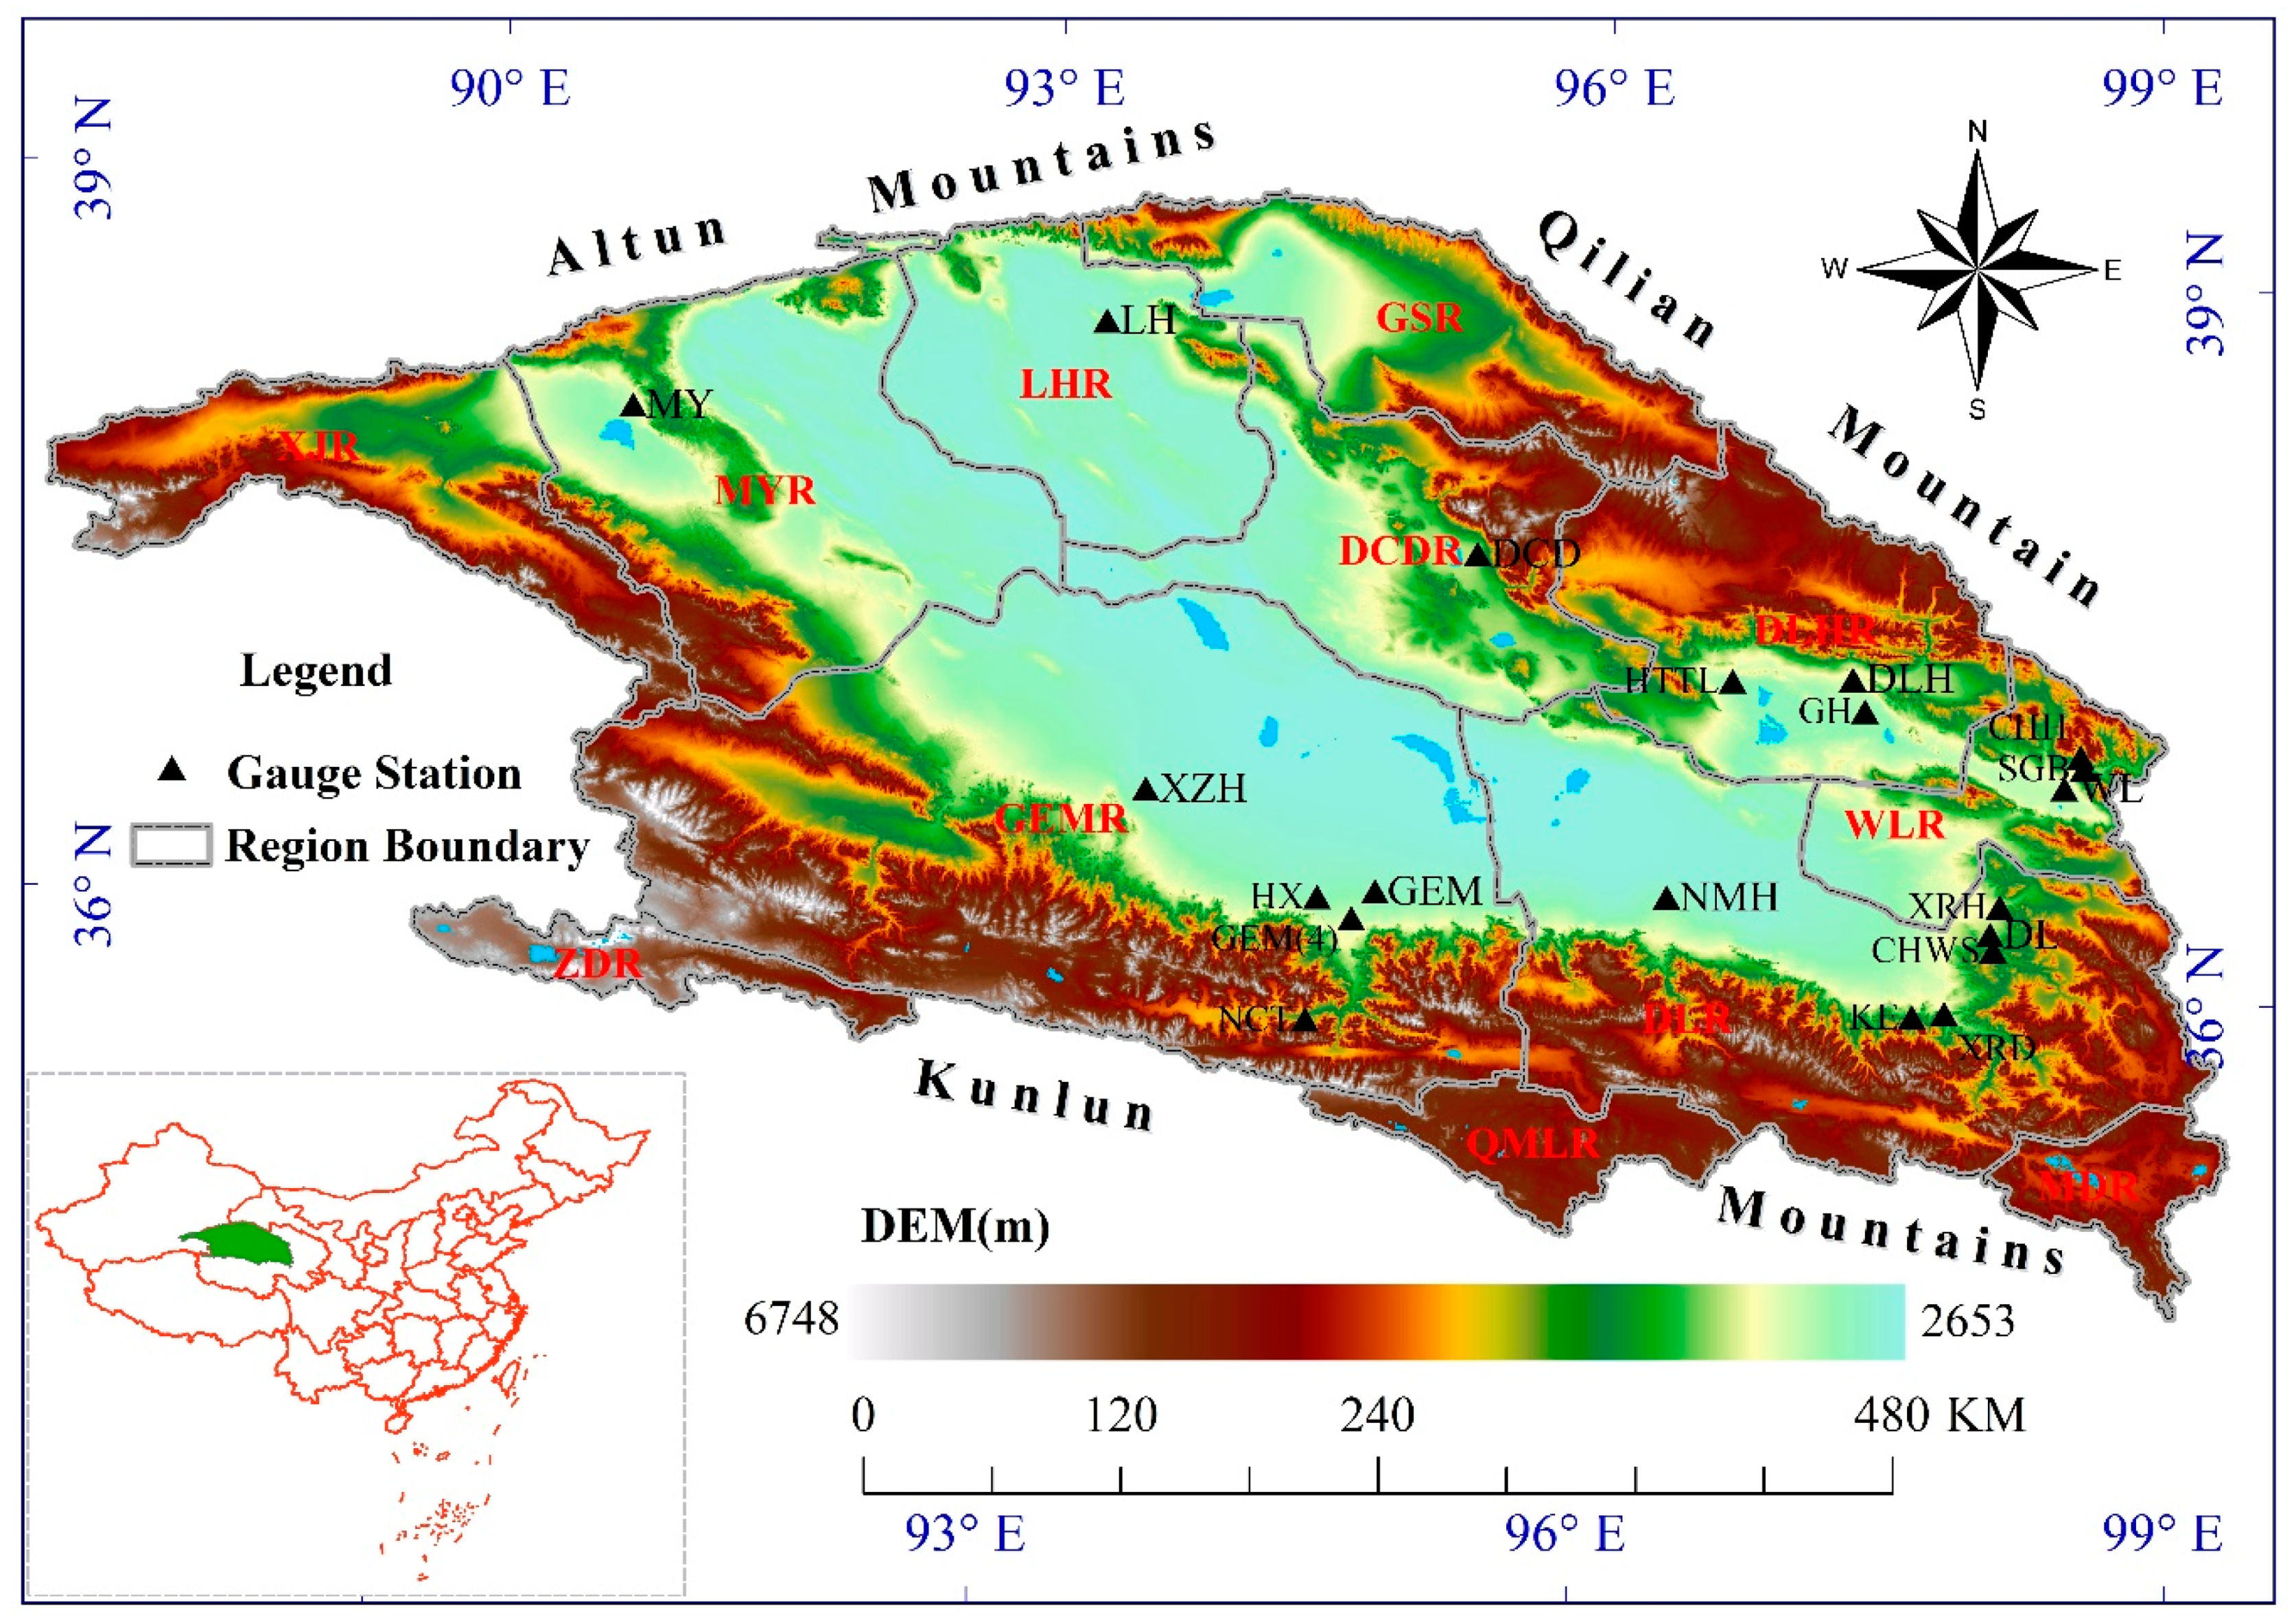
The Qaidam Basin is located in the northeastern edge of the Tibetan Plateau. The geographical coordinates are 34°41′–39°20′ N and 87°48′–99°18′ E, spanning the Gansu Province, Qinghai Province and Xinjiang Uygur Autonomous Region. The vast majority of the Qaidam Basin is in the Qinghai Province with an area of 234.14 thousand km2. The area in Xinjiang Uygur Autonomous Region is 17.42 thousand km2 and that in the Gansu Province is 17.89 thousand km2. The northwest, northeast and south of the Qaidam Basin are surrounded by the Altun Mountains, Qilian Mountains and Kunlun Mountains, respectively, as shown in Figure 1. The Qaidam Basin is the only large plateau inland basin in the world and its elevation ranges from 2653 m to 6748 m. The basin is deep in the mainland and surrounded by mountains. It is hard for the warm and humid airflow from the southwest to reach the basin, forming the typical cold-dry continental climate. Affected by the topography and latitude, the temperature of the basin is high in the central portion, but low all around. The lowest temperature occurs in January with −9.8–−16.1 °C in the basin area and −14.7–−17.2 °C in the mountainous area. The highest temperature is in July with 13.5–19.2 °C in the basin area and 5.6–10.4 °C in the mountainous area. The annual sunshine duration is generally above 3100 h.
2.1.2. Data Sources
The data used in this study include Digital Elevation Model (DEM), representing ground elevation, TRMM 3B42RT and 3B43, representing remote sensing precipitation, and gauged precipitation data by surface ground meteorological and hydrometric stations. The DEM data is from the Geographical Information Monitoring Cloud Platform (GIM Cloud) [59], and the spatial resolution is 1 km × 1 km. The TRMM 3B42RT and 3B43 are from the NASA website [60] with a spatial resolution of 0.25° × 0.25° and a time resolution of 3 h. The TRMM products were processed by ArcGIS to fit the Qaidam Basin and the data is from 2001 to 2016. In order to consider the effect of elevation, the 1 km × 1 km spatial resolution matched with DEM data was used when resampling the TRMM data. The gauged precipitation data, including 9 meteorological stations and 11 hydrometric stations from 2001 to 2016, was from China Meteorological Science Data Sharing Service Network [61] and Hydrological Red Book of the People’s Republic of China [62], respectively.
2.2. Methodology
2.2.1. Evaluation of Remote Sensing Precipitation Precision
(1) The TRMM products’ precision in gauged grids:
The correlation coefficient (R2), relative deviation (Bias) and root mean square deviation (RMSD) were calculated in the grids where a gauge station was located. The data series is from 2001 to 2016 and the temporal resolution is all on an annual scale. The formulas are as follows:
where, Ps is the gauged precipitation by the ground gauge stations (mm); Pt is the remote sensing precipitation retrieved from TRMM products (mm); and are the average value of Ps and Pt, respectively; n is the number of years (2001–2016). The R reflects the correlation between the gauged precipitation and the TRMM precipitation. The relative deviation (Bias) and root mean square deviation (RMSD) reflect the deviation degree between the gauged precipitation data and the TRMM precipitation.
(2) The TRMM products’ precision in ungauged grids:
There are only 20 gauges in the study area which means the gauged grids are equal or less than 20. All the other grids are ungauged. According to Xia’s achievements [9], the accuracy of the remote sensing precipitation on the grids without a gauge station can be evaluated by the criteria of the consistency rate (CR). The formulas are as follows:
where, D is the precipitation-elevation mask (PEM) derived from the relationship of gauged precipitation and the elevation of the gauge stations; N is the total number of grids without gauge stations; S is the total number of grids in which remote sensing precipitation falls into the PEM. If the remote sensing precipitation value falls into the mask, then the remote sensing precipitation is considered consistent with the gauged precipitation at the same elevation region, that is, the remote sensing precipitation is reliable and vice versa.
2.2.2. Correction of Remote Sensing Precipitation by ANN Model
A three-layer ANN model was set up for remote sensing precipitation correction. The model has five input variables (i.e., gauged precipitation (Ps), elevation (DEM), longitude (X) and latitude (Y) of the gauge stations, and TRMM precipitation). Specifically, the Ps is the target value of the model, and the four others are the variables of the model input layer. The output variable is only the corrected precipitation in the model output layer. The hidden layer nodes are set to 20 by the preferred selection. The structure of the ANN model in this paper is shown in Figure 2.
The model training function is ’trainlm’ which updates weight and bias values according to Levenberg–Marquardt optimization. At the same time, we chose the ‘tansig’ as the model neural transfer function to calculate a layer’s output from its net input. The divide function is accessed automatically whenever the network is trained, which is used to divide the data into training, validation and testing subsets. In this study, the net divide function is set to ‘dividerand’, and the ratios for training, validation and testing are 0.7, 0.0 and 0.3 according to the needs of the training function of ‘trainlm’. The prepared sequence data is randomly divided into the training subset (70%) and testing subset (30%) using the division parameters by the divide function. The fusion models for 3B42RT and 3B43 correction completed 103 and 127 times of training, and the convergence error (mean square error) was 0.0036 and 0.0041, respectively.
The process of data fusion mainly includes four steps: (1) the Pt is extracted by combining ArcGIS technology according to the spatial locations of the gauge stations. Moreover, the data of Ps, DEM, X, Y and Pt are stored in a one-to-one correspondence; (2) training and testing the model after setting each function of the artificial neural network. When the parameters such as the R2 reach certain conditions, the construction of the model is completed; (3) correction remote sensing precipitation based on the fusion model which is established in the previous step; (4) the fused precipitation data are inversed to the research area on a spatial–temporal scale according to the spatial information of the grids.
2.2.3. Assessment of Rainwater Resources
The areal rainwater resources (i.e., precipitation) is evaluated by the mean value. The variation trend of the areal precipitation is predicted by the improved Mann–Kendall method [63,64,65].
Corresponding to the time series X with n sample sizes, the order column is constructed as follows:
It can be seen that the order sequence S is the cumulative number of values at the ith moment greater than that at the jth moment. Under the assumption that the time series is randomly independent, the statistics are defined as follows:
where UFk = 0, E(Sk) and Var(Sk) are the mean and variance of the cumulative number Sk, respectively. When x1, x2, …, xn are independent of each other and have the same continuous distribution, they can be calculated by the following formula:
where UFi is the standard normal distribution, which is the statistical sequence calculated according to the time series X (x1, x2, …, xn). The significance level α is determined and the normal distribution table is checked. If |UFi| > Uα, it indicates that there is a significant trend change in the sequence.
Repeating the above process according to the time series X in inverse order xn, xn−1, …, x1, while letting UBk = −UFk, k = n, n − 1, …, 1, UB1 = 0. If the calculated value of UBk or UFk is greater than 0, it indicates that the sequence has an upward trend; if lower than 0, it indicates a downward trend. When they exceed the critical line, it suggests that the upward or downward trend is significant.
3. Results and Discussion
3.1. Precision of Original TRMM Products
3.1.1. Grids with the Gauge Station
According to the methods above, the precision criteria of original TRMM products on the 20 grids with the gauge station are shown in Table 1. The names of the gauge stations are LengHu (LH), XiaoZaoHuo (XZH), GeErMu (GEM), HeXi (HX), MangYa (MY), NuoMuHong (NMH), GeErMu4 (GEM4), DaChaDan (DCD), HuaiTouTaiLa (HTTL), GaHai (GH), NaChiTai (NCT), WuLan (WL), DeLingHa (DLH), DuLan (DL), ChaHanWuSu (CHWS), XiaRiHa (XRH), XiangRiDe (XRD), KeEr (KE), ShangGaBa (SGB), ChaHanHe (CHH), respectively.
It is clear in Table 1 that the average mean annual precipitation (MAP) of 3B42RT and 3B43 on the 20 grids are 163.12 mm and 163.92 mm, respectively, which look quite close to that of the gauged precipitation (170.72 mm). However, it can be found that the TRMM precipitation is higher in the low gauged precipitation areas (LGPA), including the stations of LH, XZH, GEM, HX, MY, NMH, GEM4, DCD and HTTL. On the contrary, the TRMM precipitation is lower in the high gauged precipitation area (HGPA), including the stations of WL, DLH, DL, CHWS, XRH, XRD, KE, SGB and CHH. As a result, the average MAP of TRMM is approximately equal to that of the gauged precipitation, but the underestimated HGPA and overestimated LGPA will lead to systematic bias. The systematic error is considered the result of planarization of the original TRMM when calibration was done with too limited gauged data.
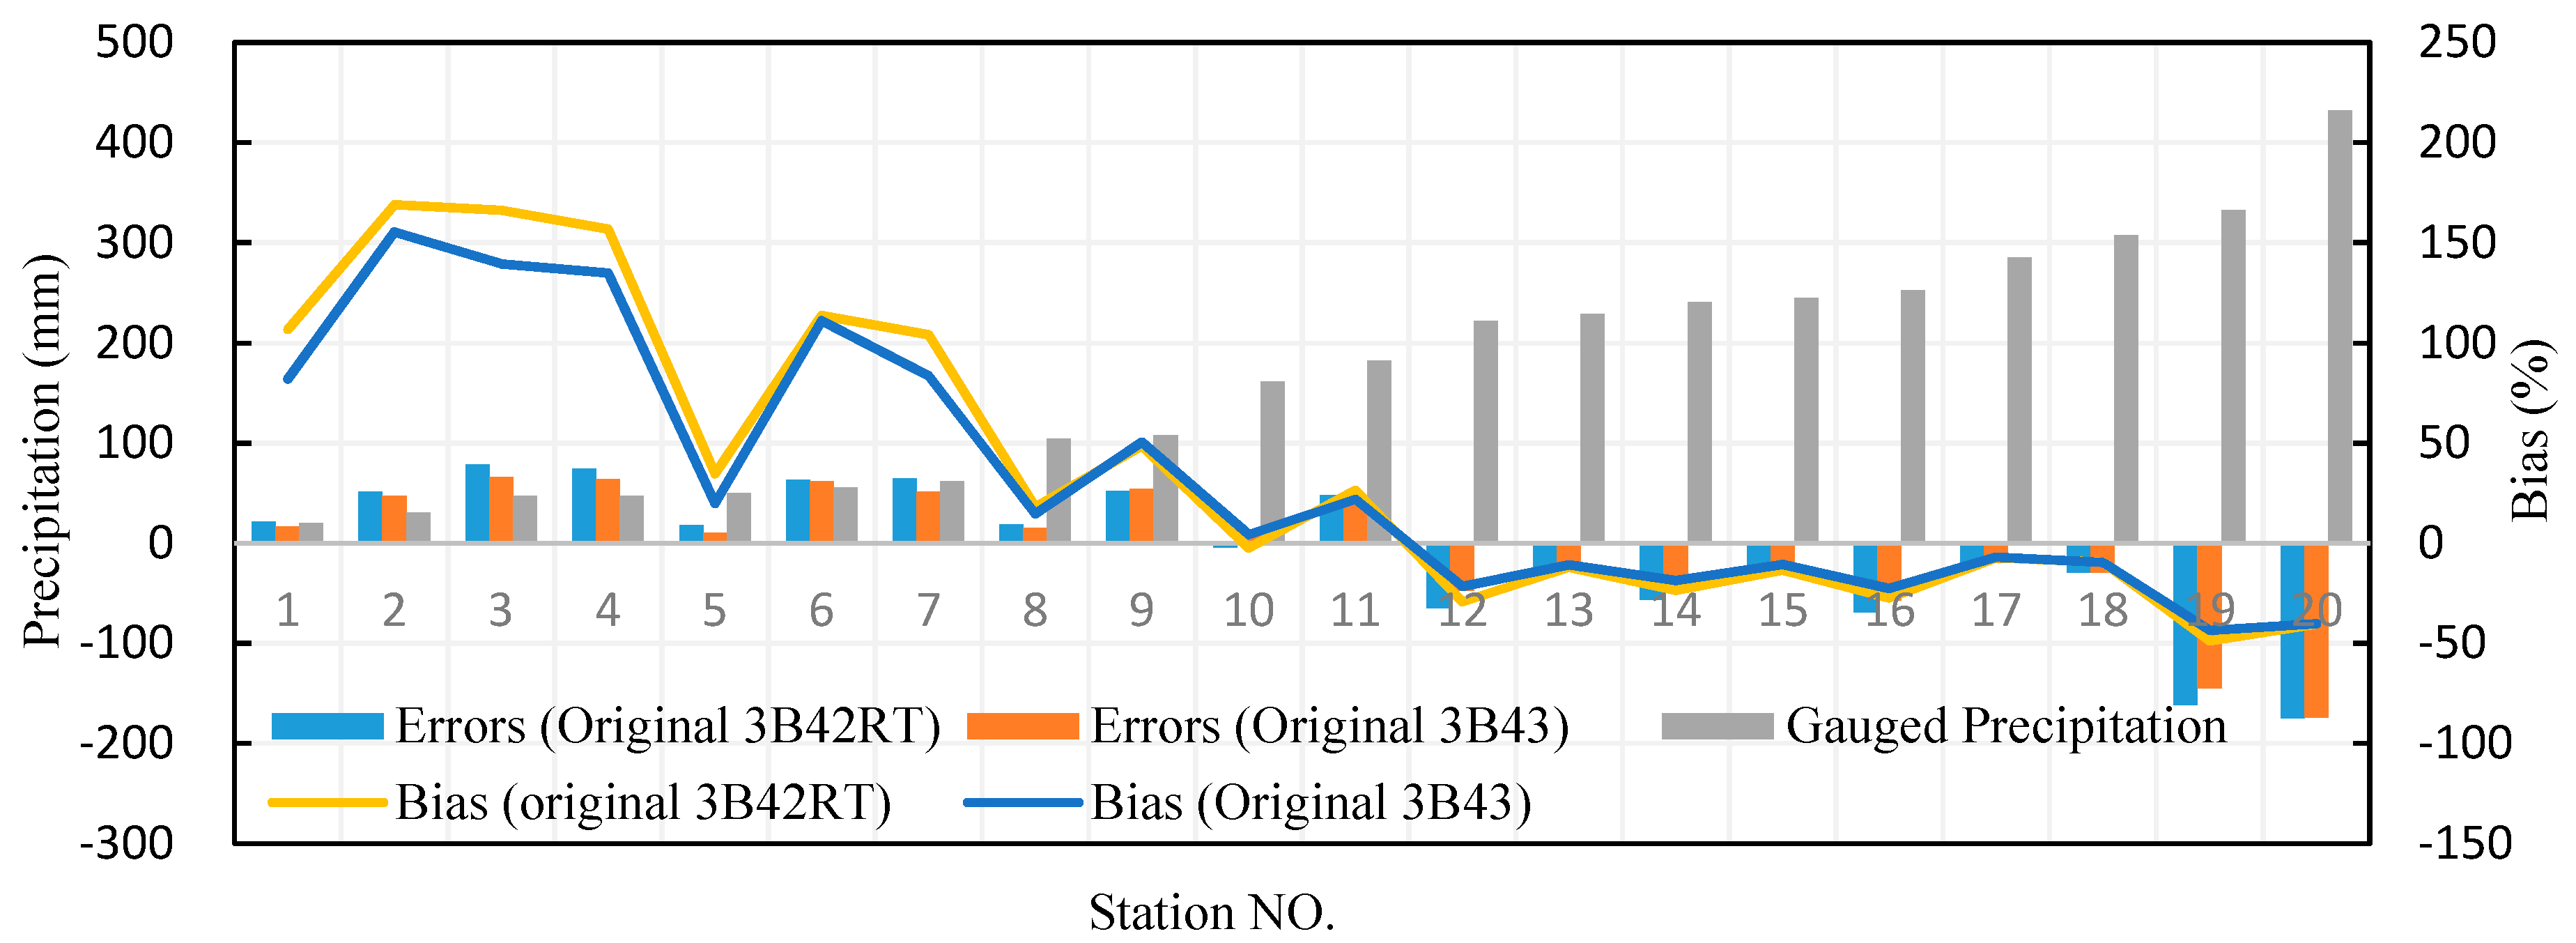
The average RMSD of the original 3B42RT and 3B43 in the Qaidam Basin is 72.25 mm and 64.24 mm, respectively. Considering with the bias together, the minimum RMSD (23.17 mm of 3B43RT and 18.42mm of 3B43) relates to the overestimation (bias of 106.79%, 82.07% and value of 21.26 mm, 16.31 mm) of 3B42RT and 3B43 in the LGPA (LH station), while the maximum RMSD (189.76 mm of 3B43RT and 187.08 mm of 3B43) relates to the underestimation (bias of –40.49%, –40.20% and value of –175.04 mm, –174.09 mm) in the HGPA (CHH station). It is obvious that the bias of underestimation is smaller than that of overestimation, but the absolute amount of underestimation is far greater than that of overestimation, as shown in Figure 3. Therfore, it is supposed that the average TRMM precipitation in the Qaidam Basin would be an underestimation overall.
3.1.2. Grids without a Gauge Station
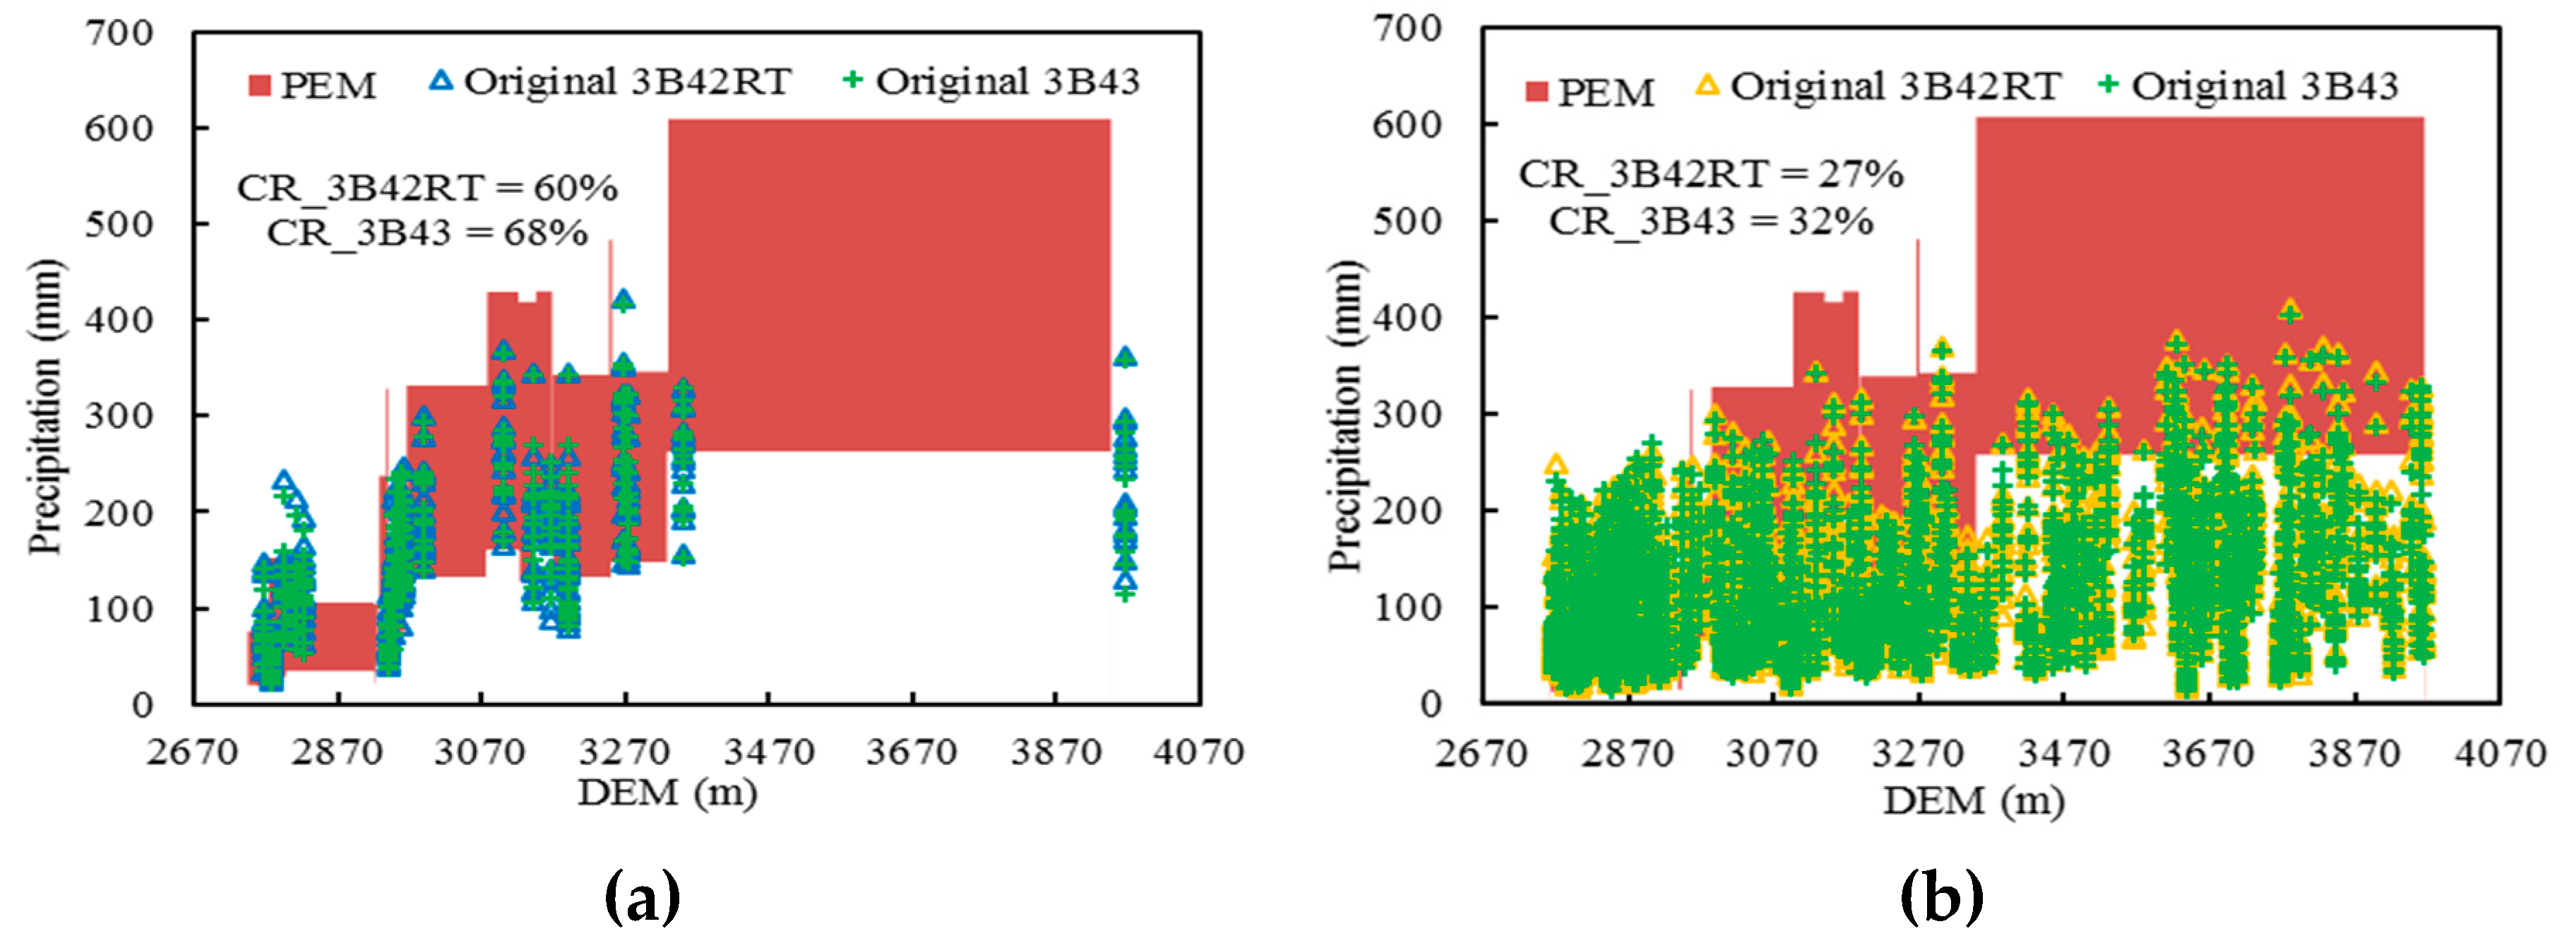
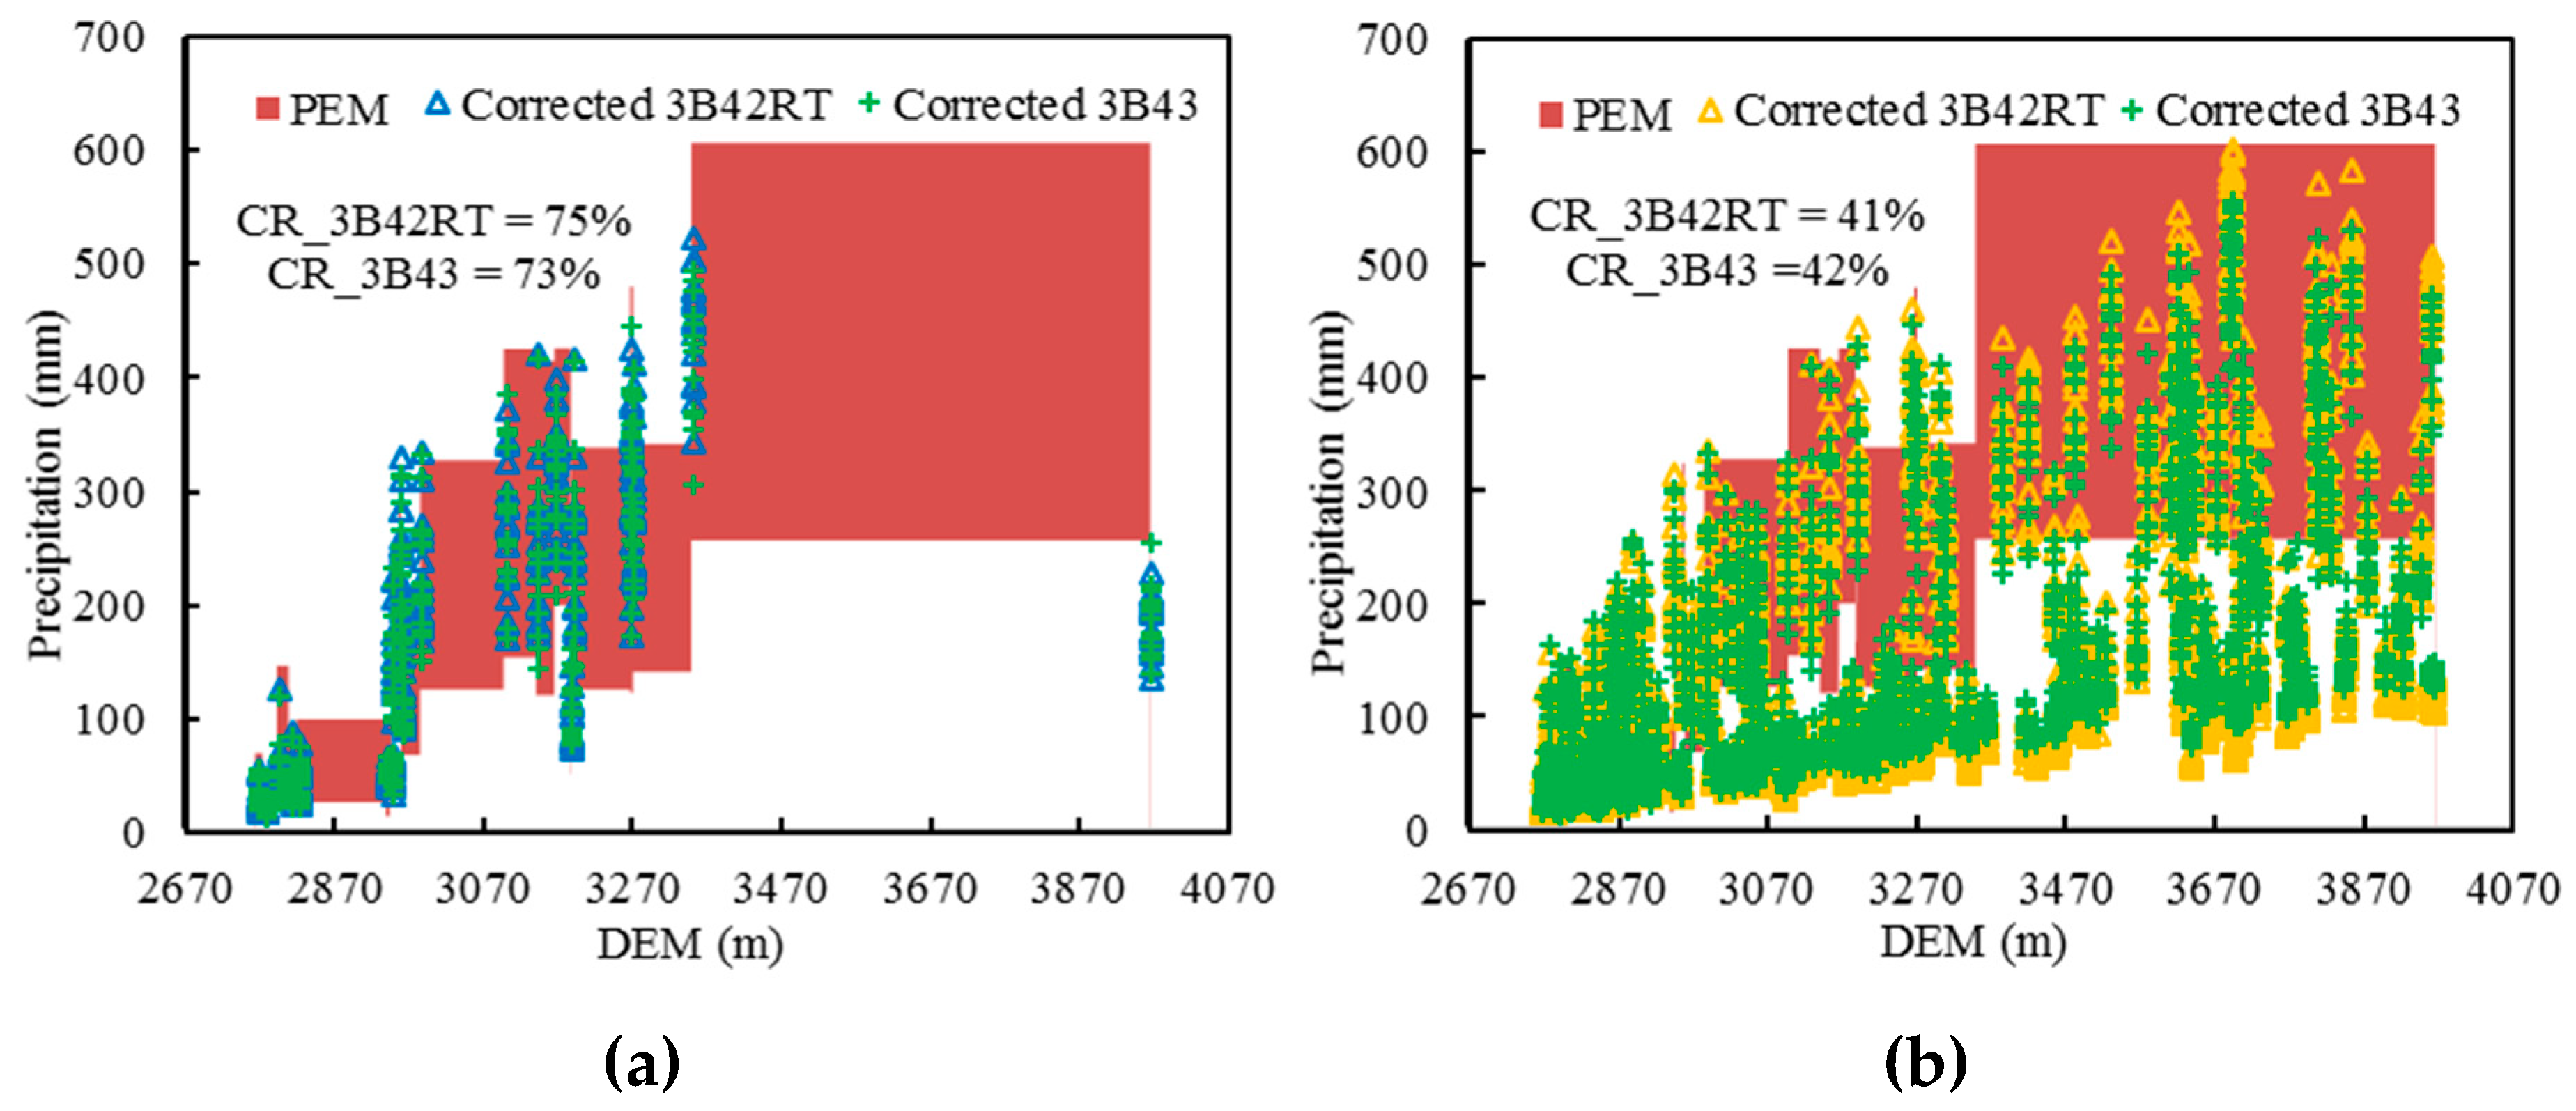
Most of the grids have no ground gauge so that we could not evaluate the precision by precipitation itself. Some other validation principle is introduced. Here, it is the consistency principle (CR), which is a relationship rule of rainfall and elevation retrieved from the gauged data. The situation of 3B42RT and 3B43 precipitation falling into the PEM is shown in Figure 4.
It can be found that the CR value of original 3B42RT and 3B43 precipitation on the grids with gauge is 60% and 68%, while on the grids without gauge it is only 27% and 32%, respectively. It means the TRMM precipitation on the gauged grids is more reliable than that on the ungauged grids.
3.2. Correction of TRMM Products
3.2.1. Calibration and Validation
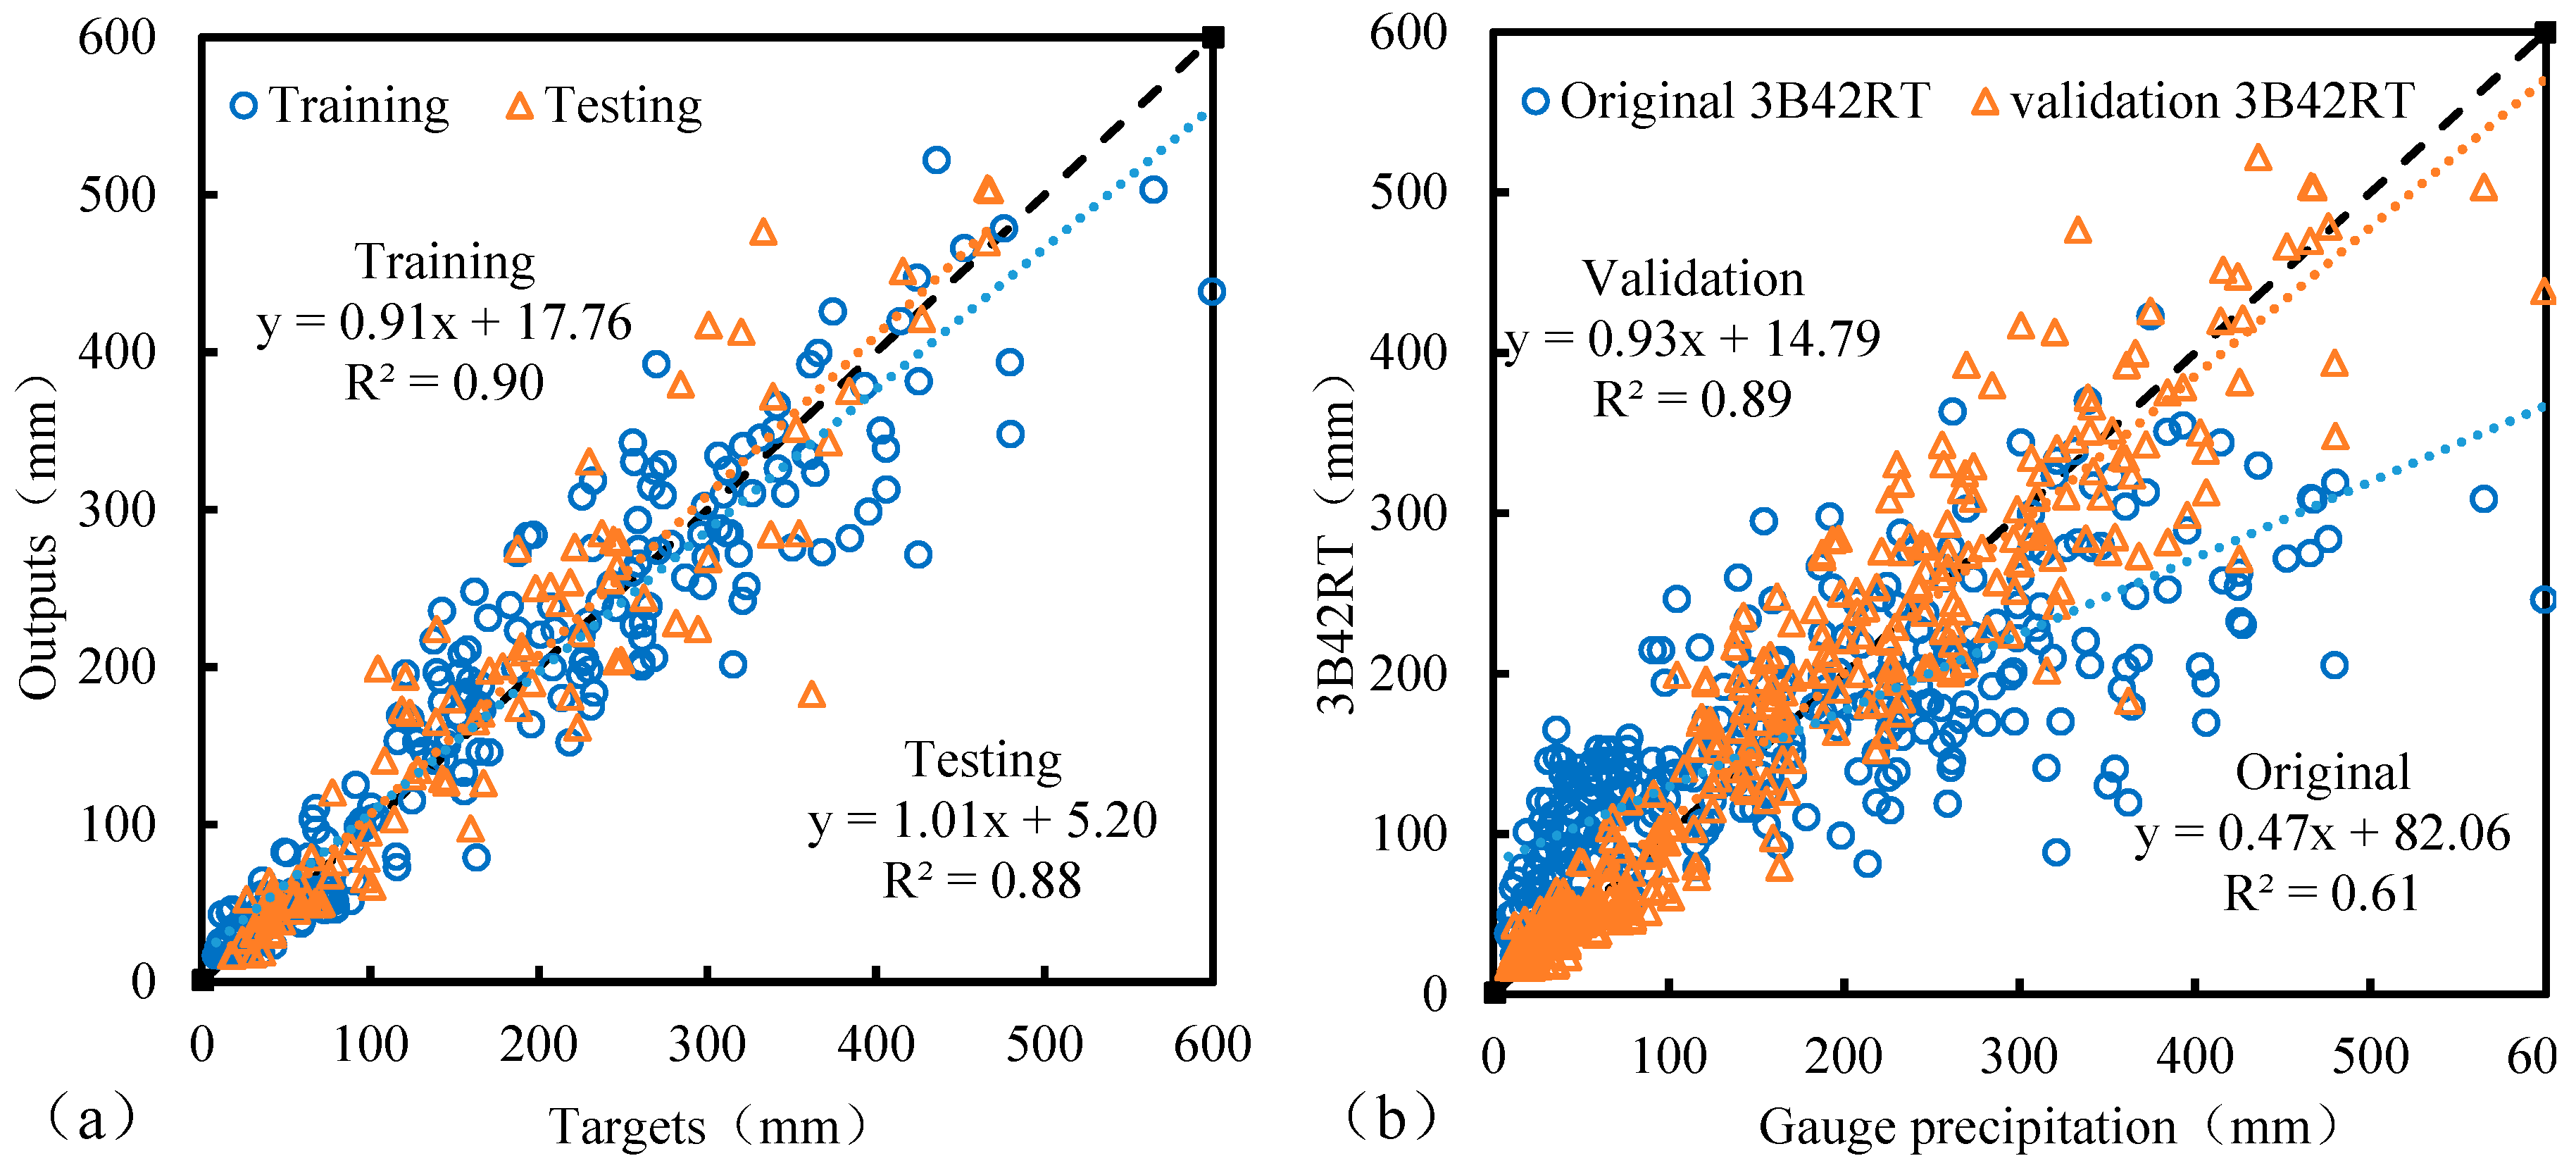
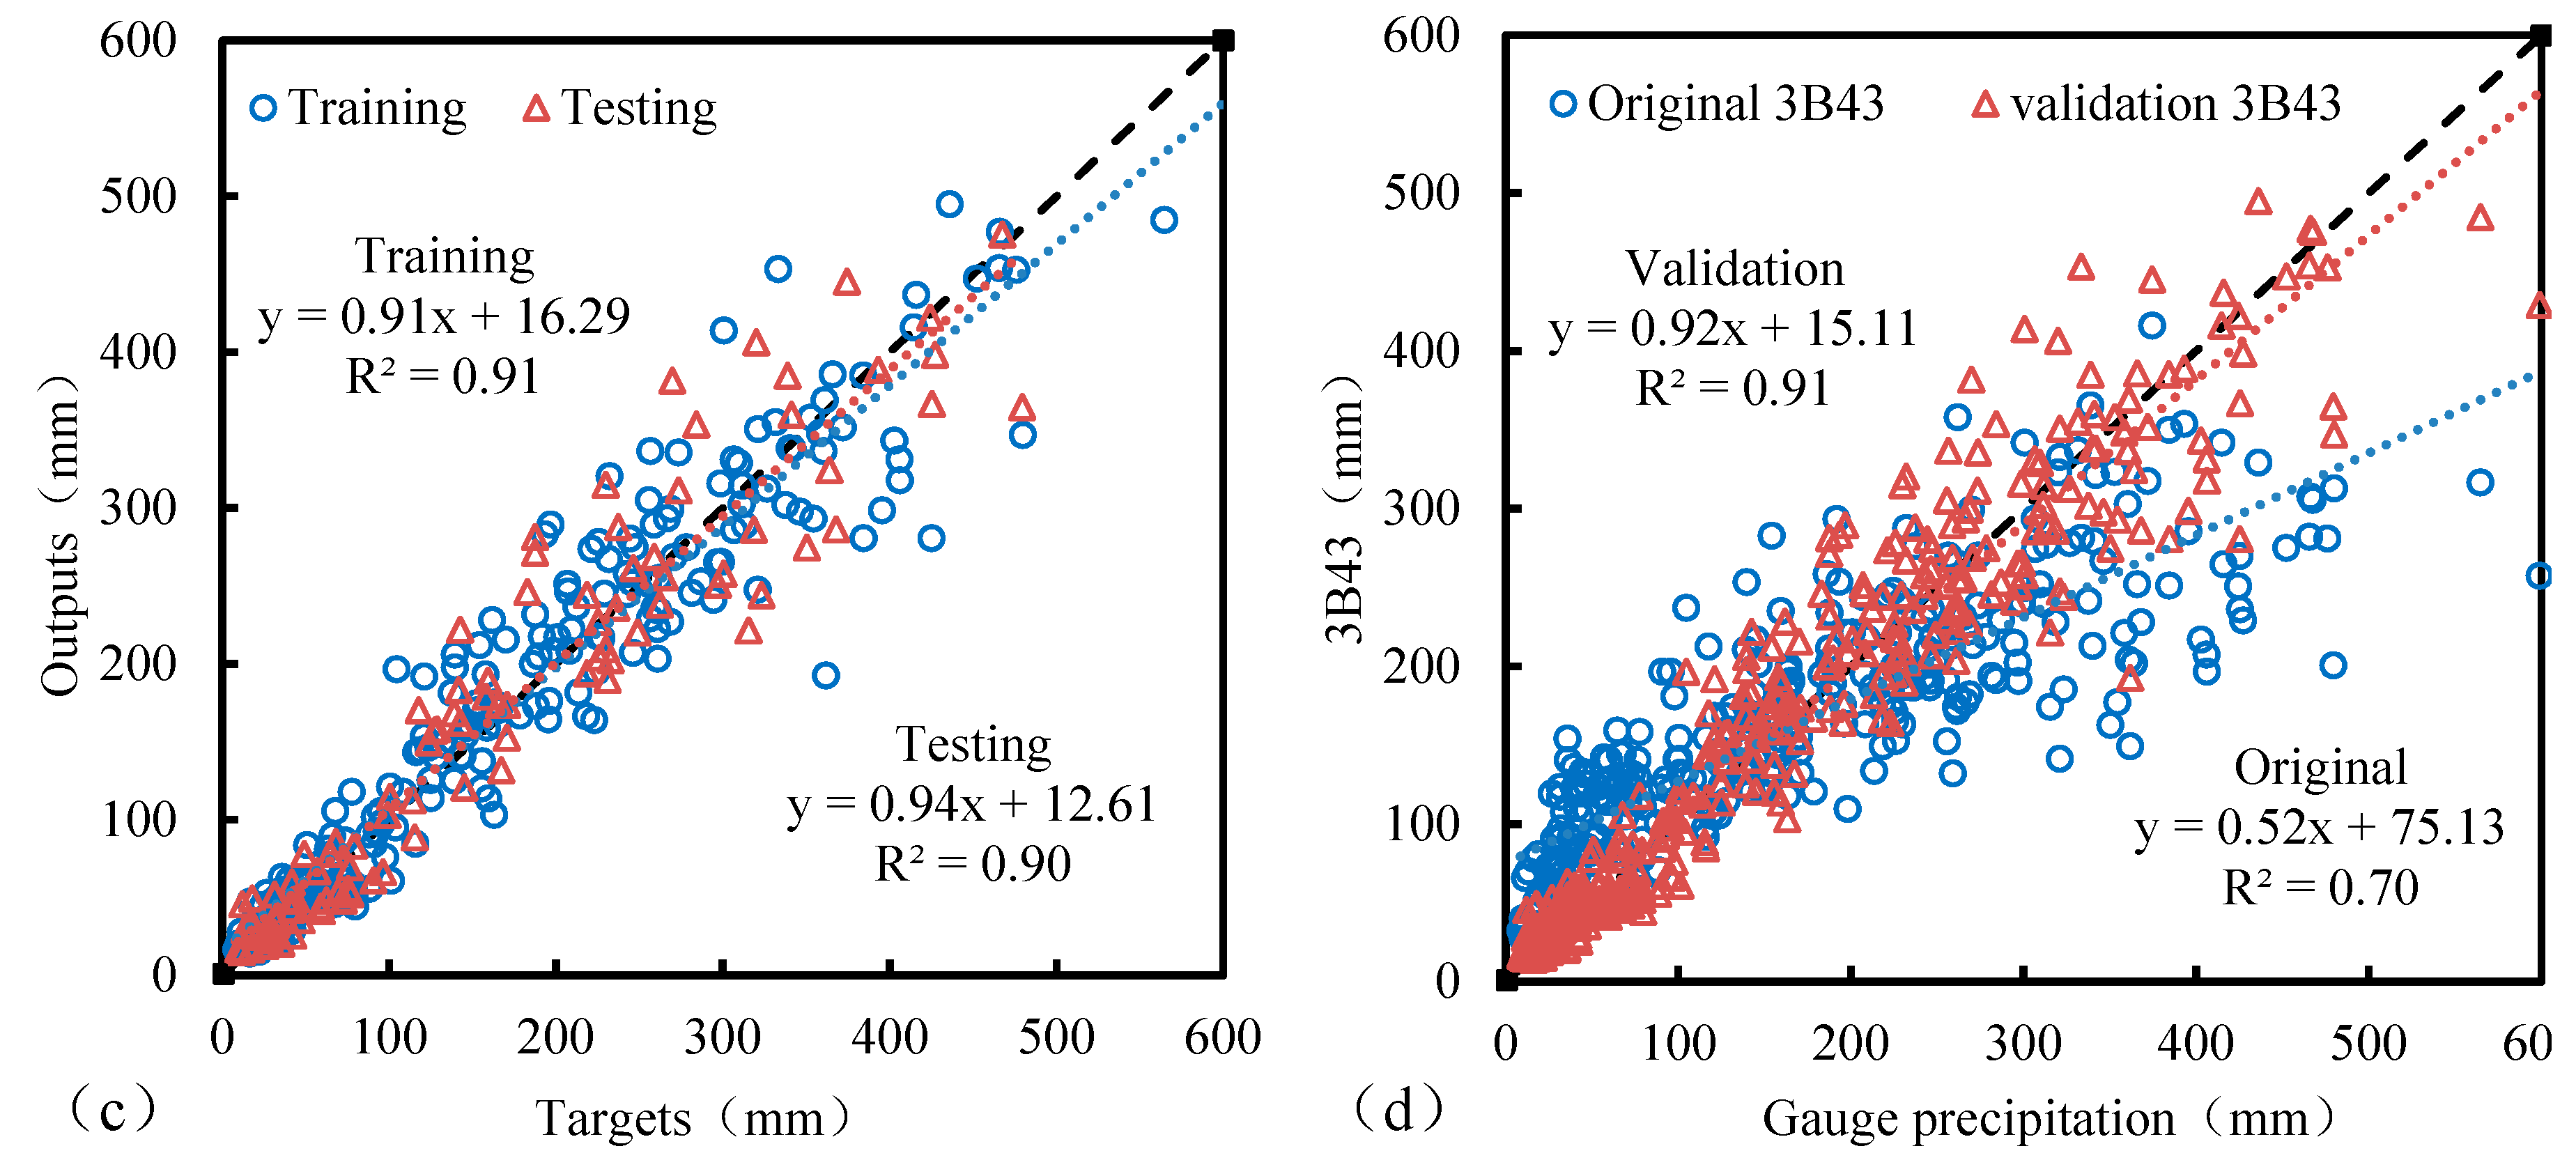
The regression machine learning by the ANN model mentioned above was carried out. In the process, we have a total of 20 gauges with 16 years of data sets, of which 224 sets of data are used for the model training, and the remaining 96 sets are used for model testing. The result of a comparison of output and target is shown in Figure 5.
It can be seen from Figure 5a,c that the training and testing are very good with the determinant coefficients 0.90, 0.91 and 0.88, 0.90, respectively. There was also improvement with the determinant coefficients 0.89, 0.91 of corrected TRMM precipitation compared with the original TRMM determinant coefficients of 0.61, 0.70. It also can be seen that the values of original 3B42RT and 3B43 are all mostly above the 1:1 line when gauged precipitation was less than 100 mm, while a lot of the values of original TRMM precipitation are under the 1:1 line when gauged precipitation was more than 200 mm. This indicates that the original TRMM precipitation in the LGPA was overestimated and the TRMM precipitation in the HGPA was underestimated. On the whole, the dispersion of TRMM precipitation points on both sides of the 1:1 line is large and uneven, the R2 is only 0.61 and 0.70, respectively. Fortunately, the 3B42RT and 3B43 precipitation improved significantly both in the LGPA and HGPA. They closely dispersed on the both sides of the 1:1 line after the correction by the ANN model. The R2 increased to 0.89 and 0.91, respectively. It was proven that the fusion model based on an ANN is effective for the correction of TRMM products.
3.2.2. The Precision of Corrected TRMM Products
After the correction, the precision of TRMM precipitation in the Qaidam Basin on the grids with the gauge station is shown in Table 2. It can be found that the average bias is significantly reduced, from 36.51% to –0.08% (3B42RT) and 31.63% to 0.11% (3B43), respectively. It also can be seen from the RMSD that the fusion model has a significant correction effect on TRMM products. The average RMSD value decreased from 72.25 mm and 64.24mm to 37.51 mm and 34.22 mm after correction.
For those grids without gauges, the CR values were also evaluated. The CR of 3B42RT and 3B43 on the grids with and without the gauge station improved up to 75%, 73% and 41%, 42% after correction (Figure 6). This means the precision of TRMM precipitation on grids with and without gauge station are also improved.
3.3. Assessment of Rainwater Resources of the Qaidam Basin
3.3.1. The Average Amount of Precipitation
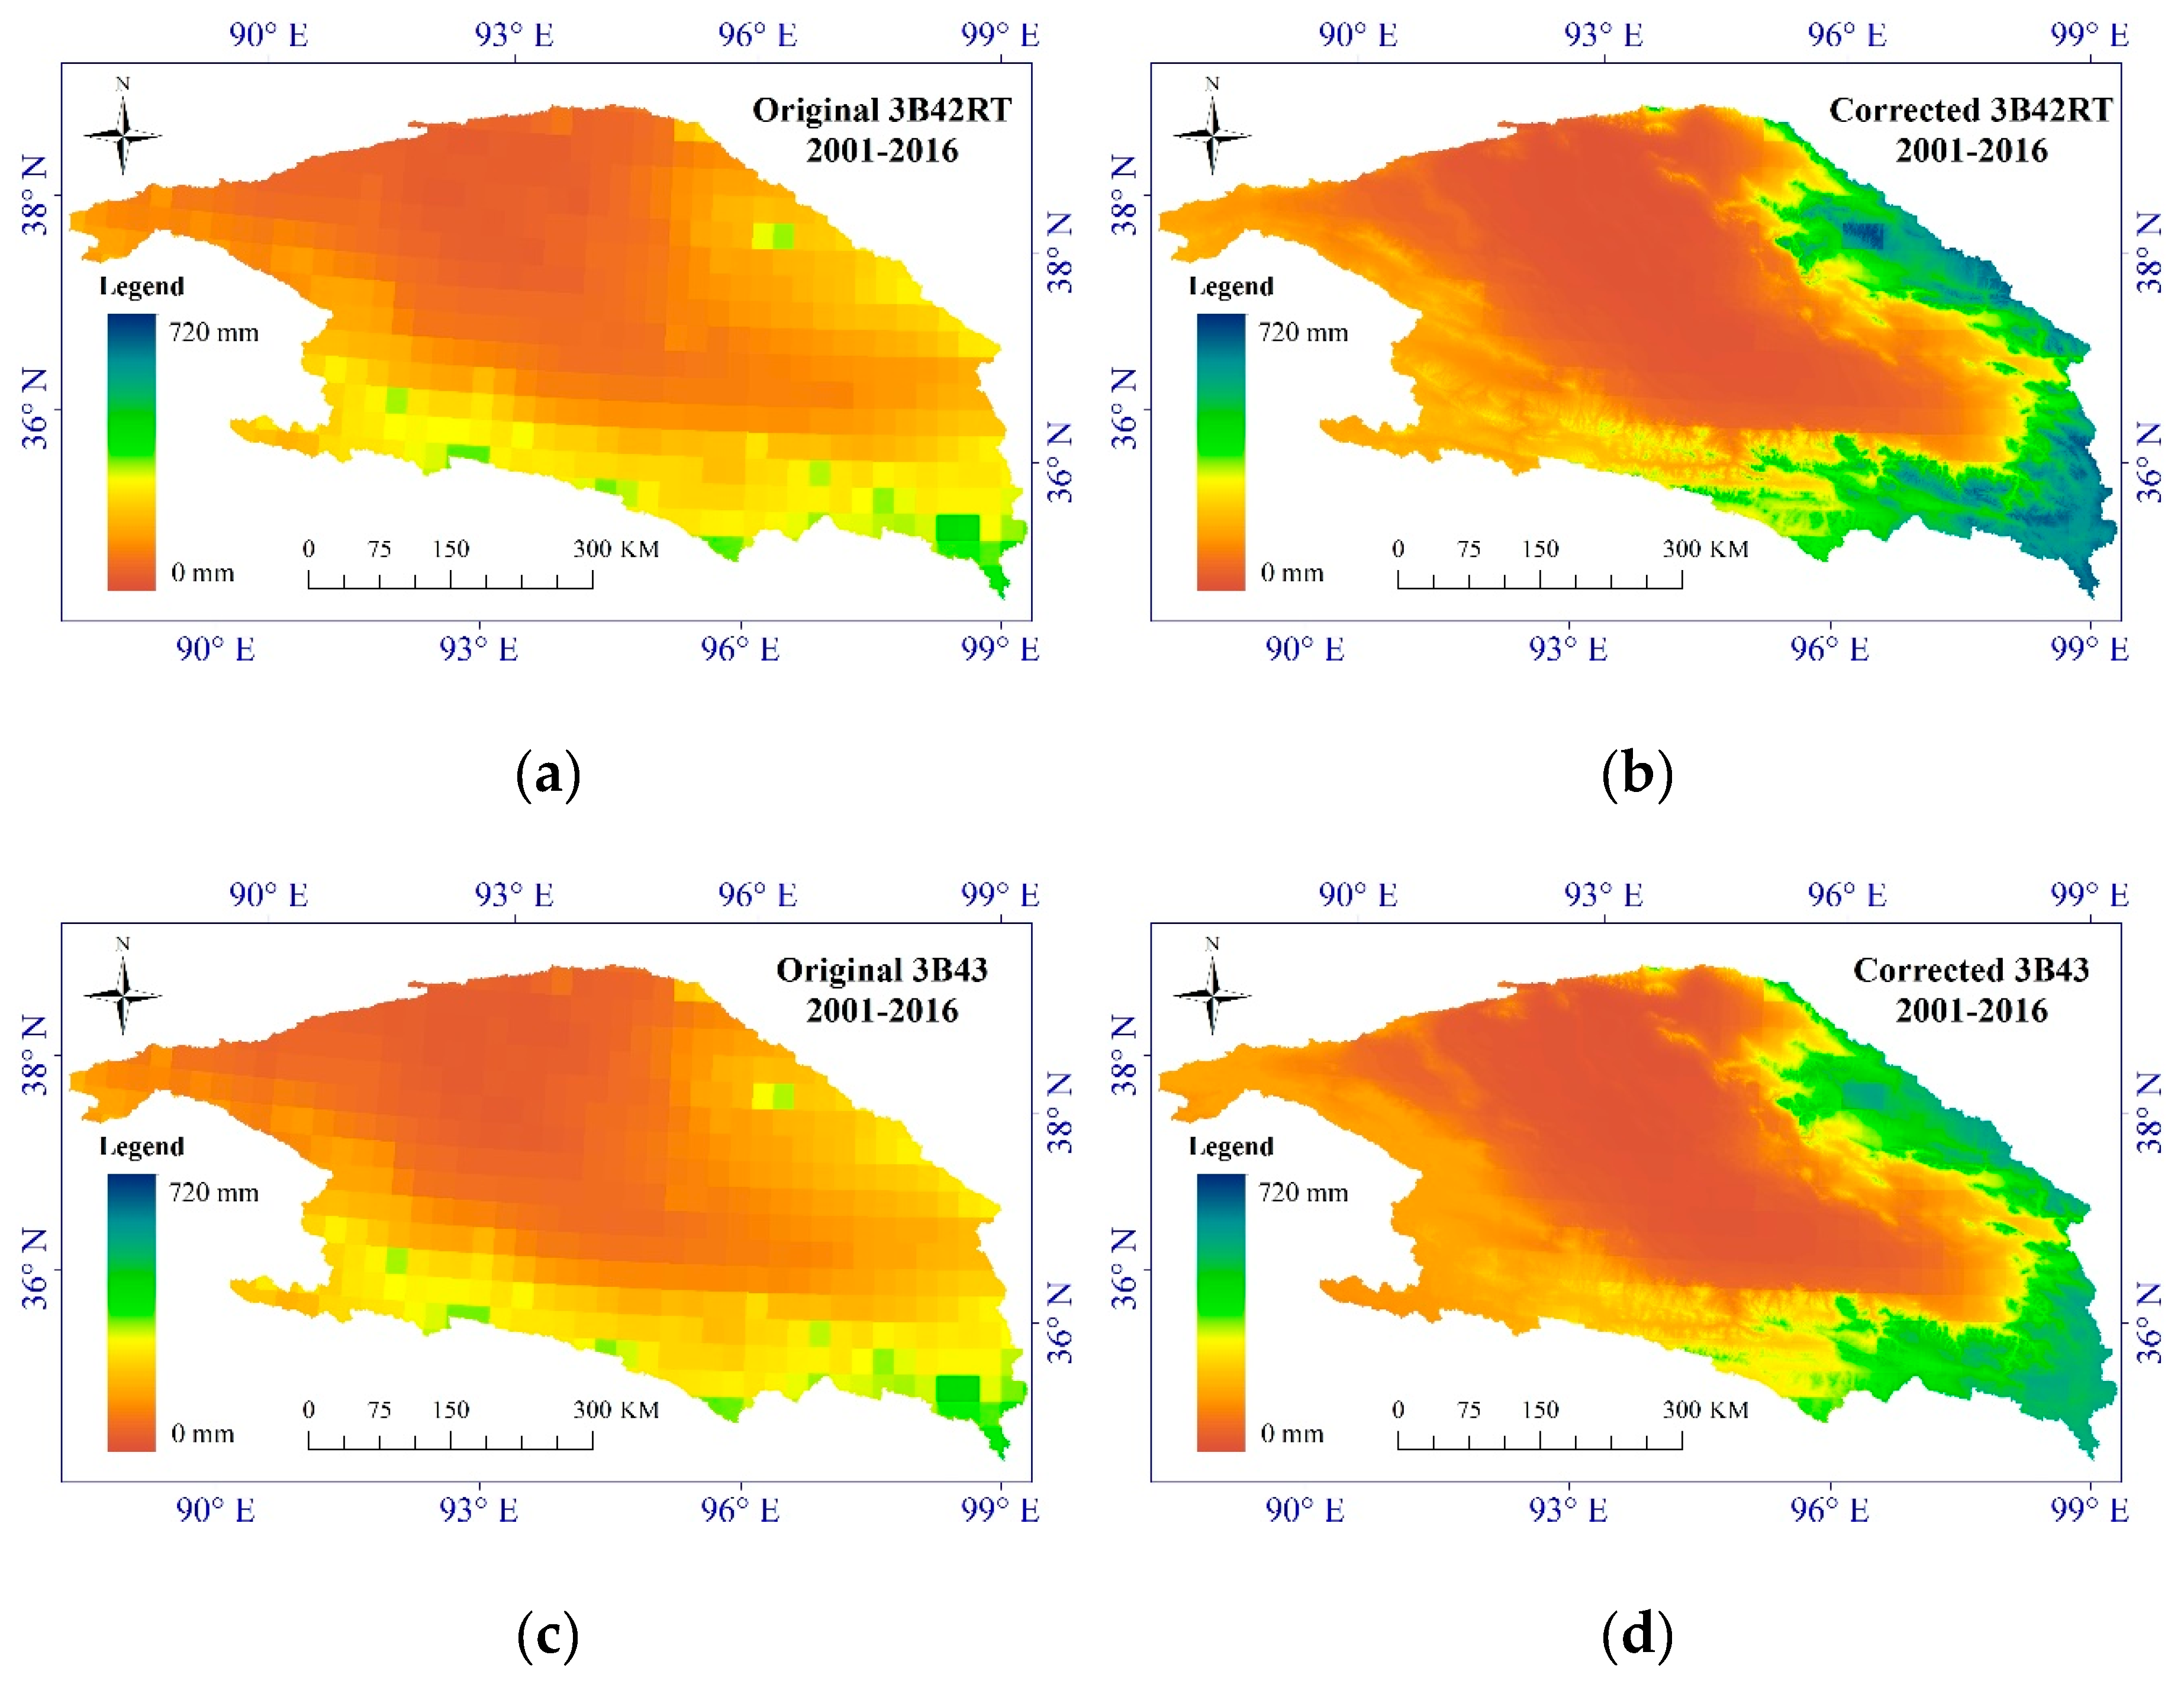
The spatial distribution of the mean annual precipitation from 2001 to 2016 before and after the correction of 3B42RT and 3B43 in the Qaidam Basin is shown in Figure 7. It can be seen that the precipitation on the eastern, southern and southeastern edges of the Qaidam Basin is high, while in the center and northwest it is small. The original distribution of precipitation in the east and west of the Kunlun Mountains is not even, but the trend of decreasing from east to west is enhanced significantly after the correction. The main reason for this is the increase of precipitation in the eastern Kunlun Mountains after the TRMM products corrected. The precipitation in the Qilian Mountains and the southeastern edges of the Qaidam Basin was also relatively high and increased after correction. At the same time, there was a higher consistency between precipitation and elevation in those regions, that is, precipitation increased with elevation.
For the 12 subregions of the basin, including MA, LE, DCD, DLH, WL, DL, GEM, QML, MD, ZD, XJR and GSR as shown in Figure 1, the areal precipitation in each region is shown in Table 3.
We can see from Table 3 that the average annual precipitation of the Qaidam Basin based on the original 3B42RT and 3B43 are 148.45 mm and 146.26 mm, respectively, while the new assessment value is 186.01 mm and 174.76 mm based on corrected TRMM 3B42 and 3B43. It is obvious that the annual precipitation (104.34 mm) based on the interpolated precipitation by gauges is significantly less than that of original and corrected TRMM products.
The previous studies on precipitation in the Qaidam Basin were mostly based on the gauged precipitation data to get the areal precipitation of the Qaidam Basin according to the traditional interpolation method. The pity is that the gauge distribution is too sparse and uneven, causing an unreliable interpolation result. It is obvious that the precipitation in the area was underestimated in the past. The fusion remote sensing precipitation with local ground information in high mountainous areas is helpful.
3.3.2. The Precipitation Variation Trend
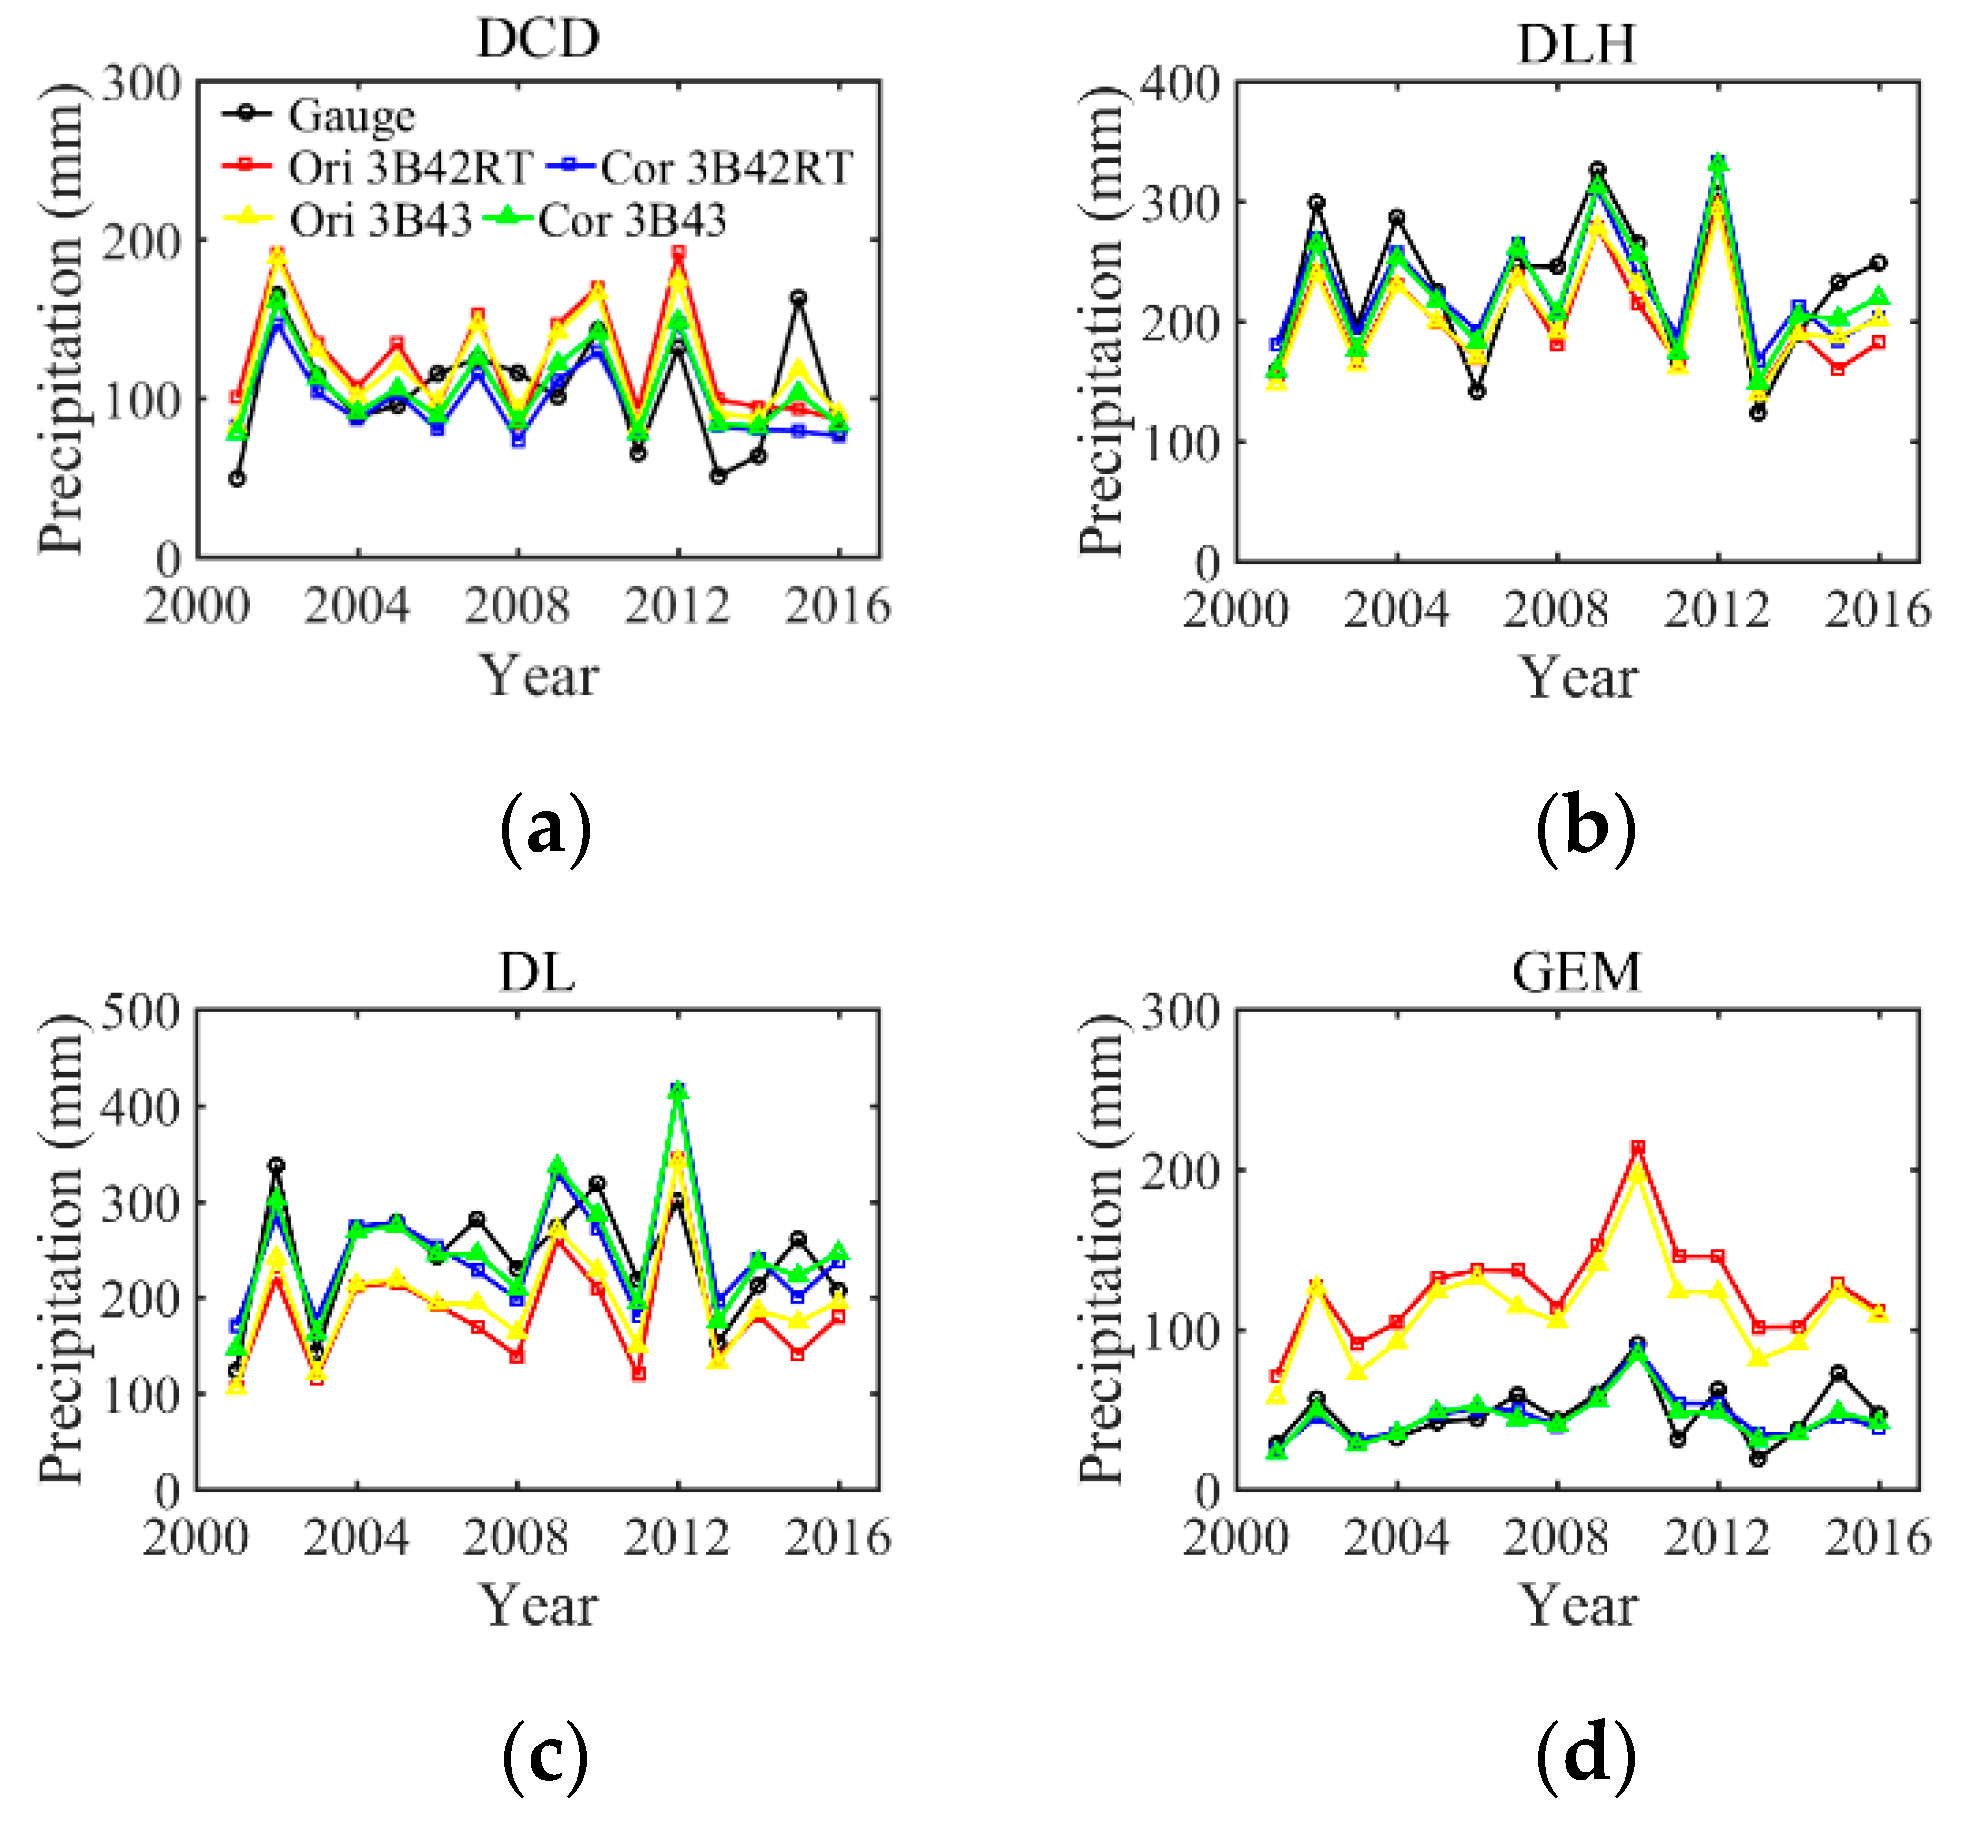
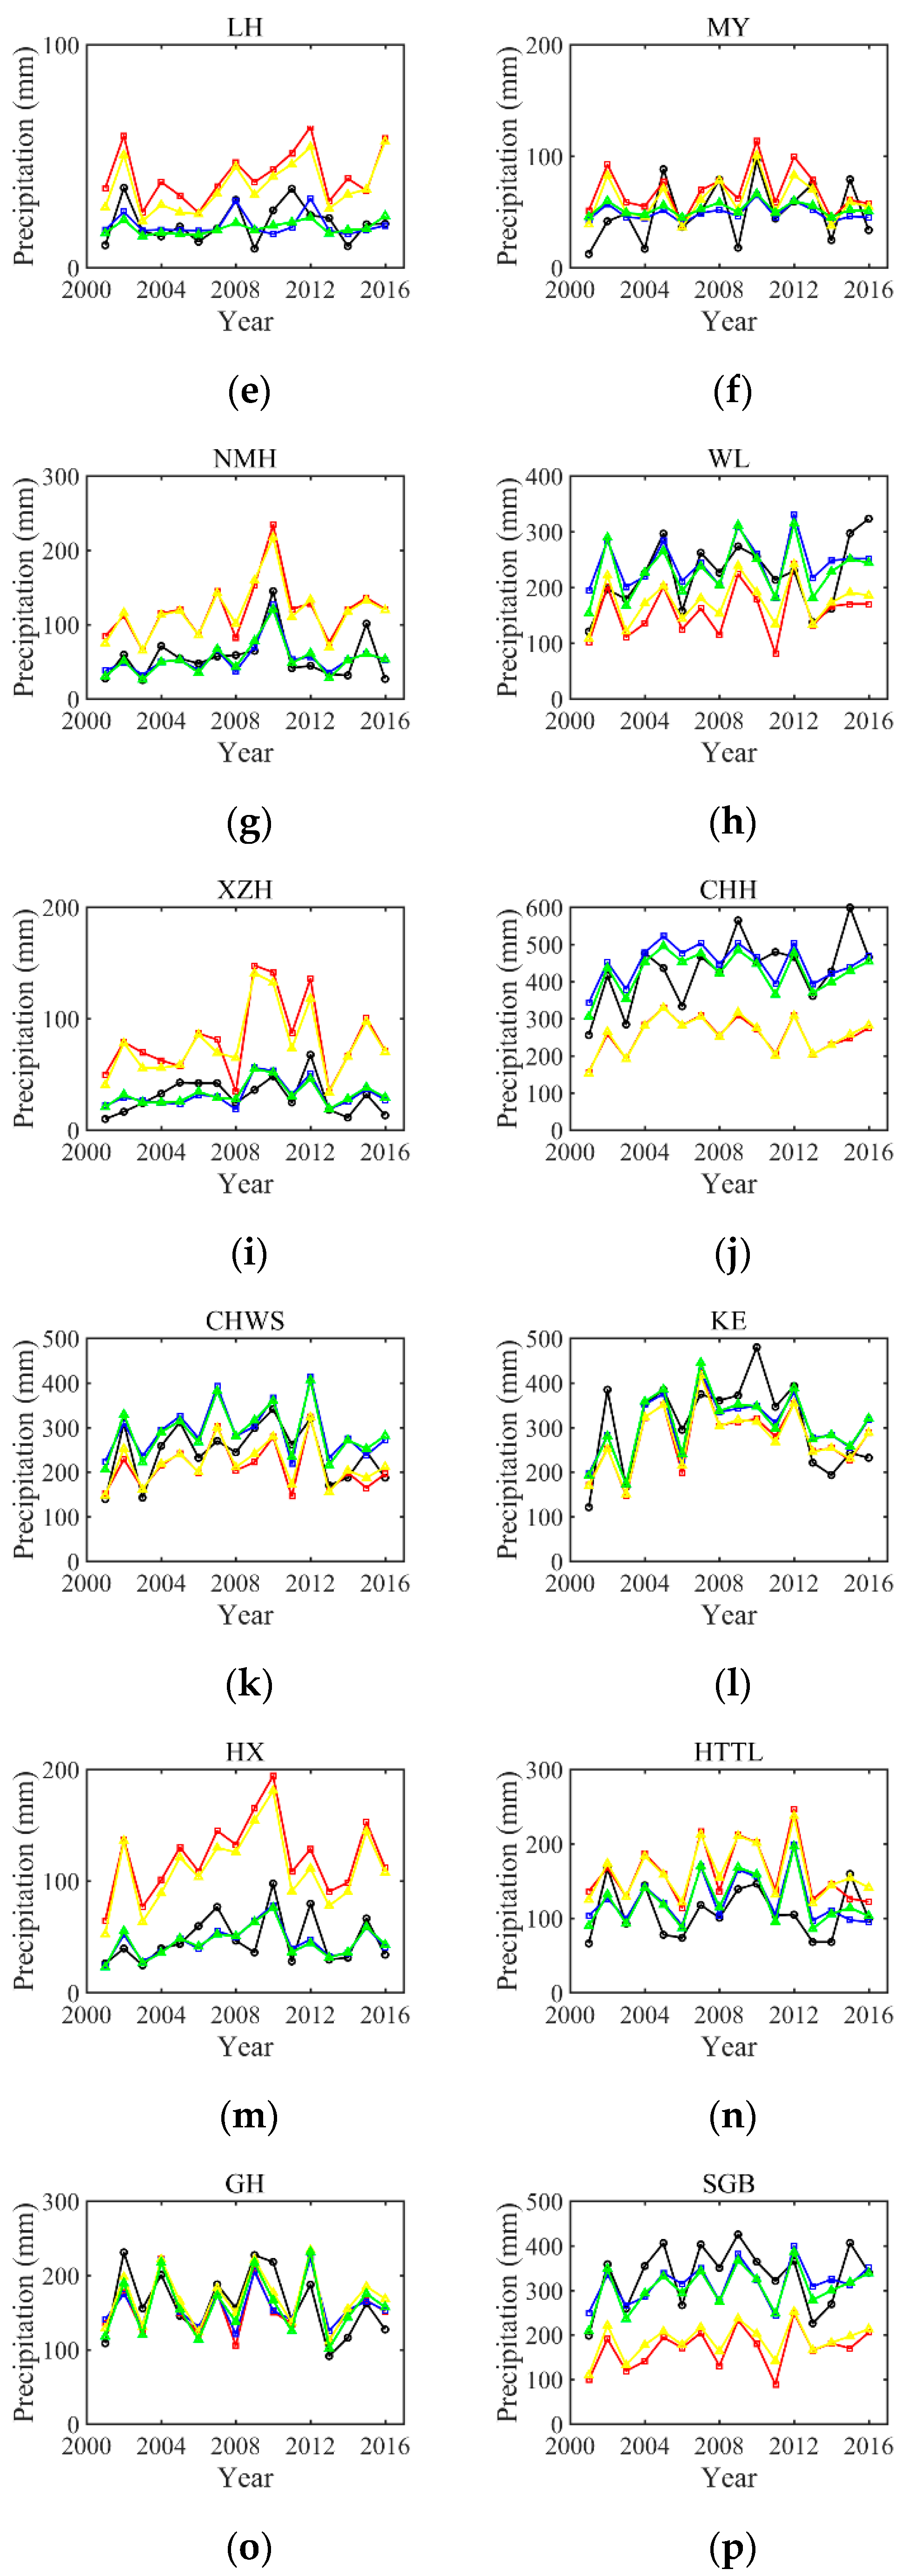
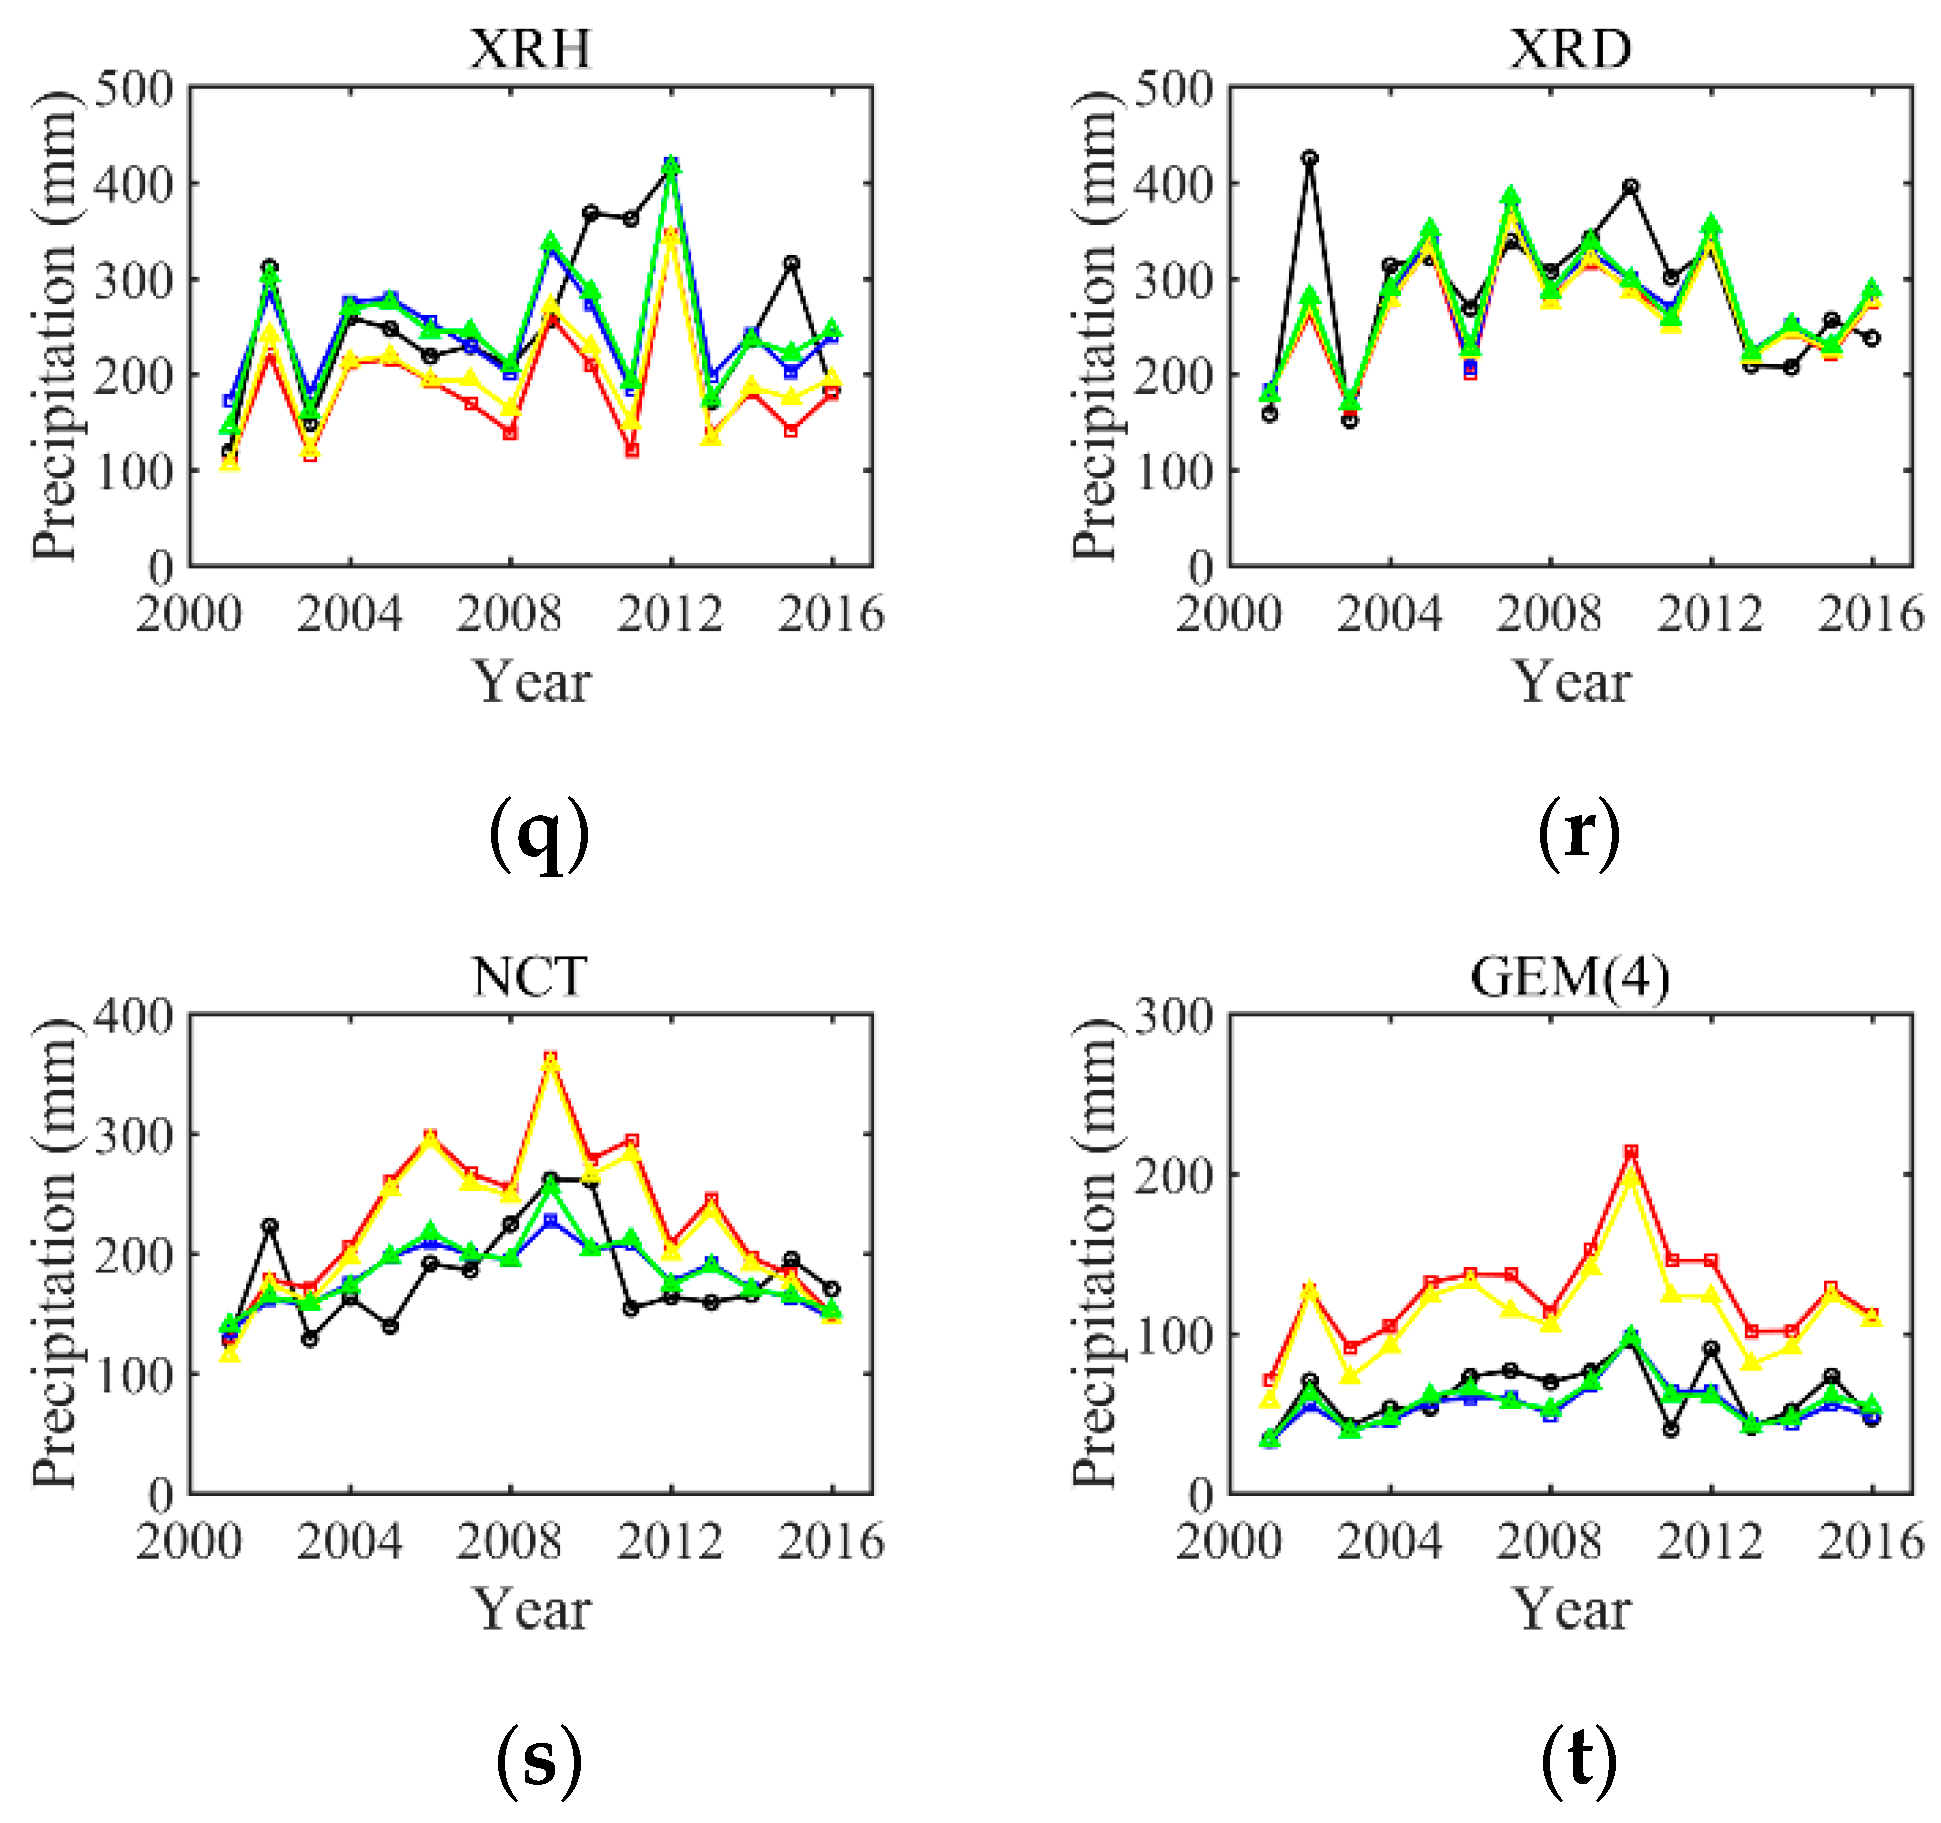
The annual precipitation time series and its variation trend of the gauged precipitation, original and corrected 3B42RT and 3B43 products at the 20 gauge stations are shown in Figure 8 and Table 4. From Figure 8 we can know that the original 3B42RT and 3B43 precipitation at the GEM, LH, NMH, XZH. HX, NCT and GEM4 stations, where the precipitation is low, is obviously higher than the gauged precipitation. On the contrary, the original 3B42RT and 3B43 precipitation at the CHH and SGB stations, where the precipitation is high, is obviously less than the gauged precipitation. This again indicates that the original 3B42RT and 3B43 are significantly overestimated in the LGPA and underestimated in the HGPA. What is nice is that the 3B42RT and 3B43 decreases or increases significantly and tends to the gauged precipitation values after the fusion model was corrected.
From the average change trends of precipitation at the 20 gauge stations in the three data sources, the annual precipitation of the Qaidam Basin shows an increasing trend. The gauged precipitation at GH, XRD DCD, KE, DLH and HTTL stations showed a decreasing trend, and the others showed an increasing trend in different degrees at the other 14 gauge stations. The change trend direction is basically the same. Therefore, the spatial distribution and temporal variation trend of TRMM products after correction can characterize the spatial–temporal variation characteristics of precipitation in the Qaidam Basin.
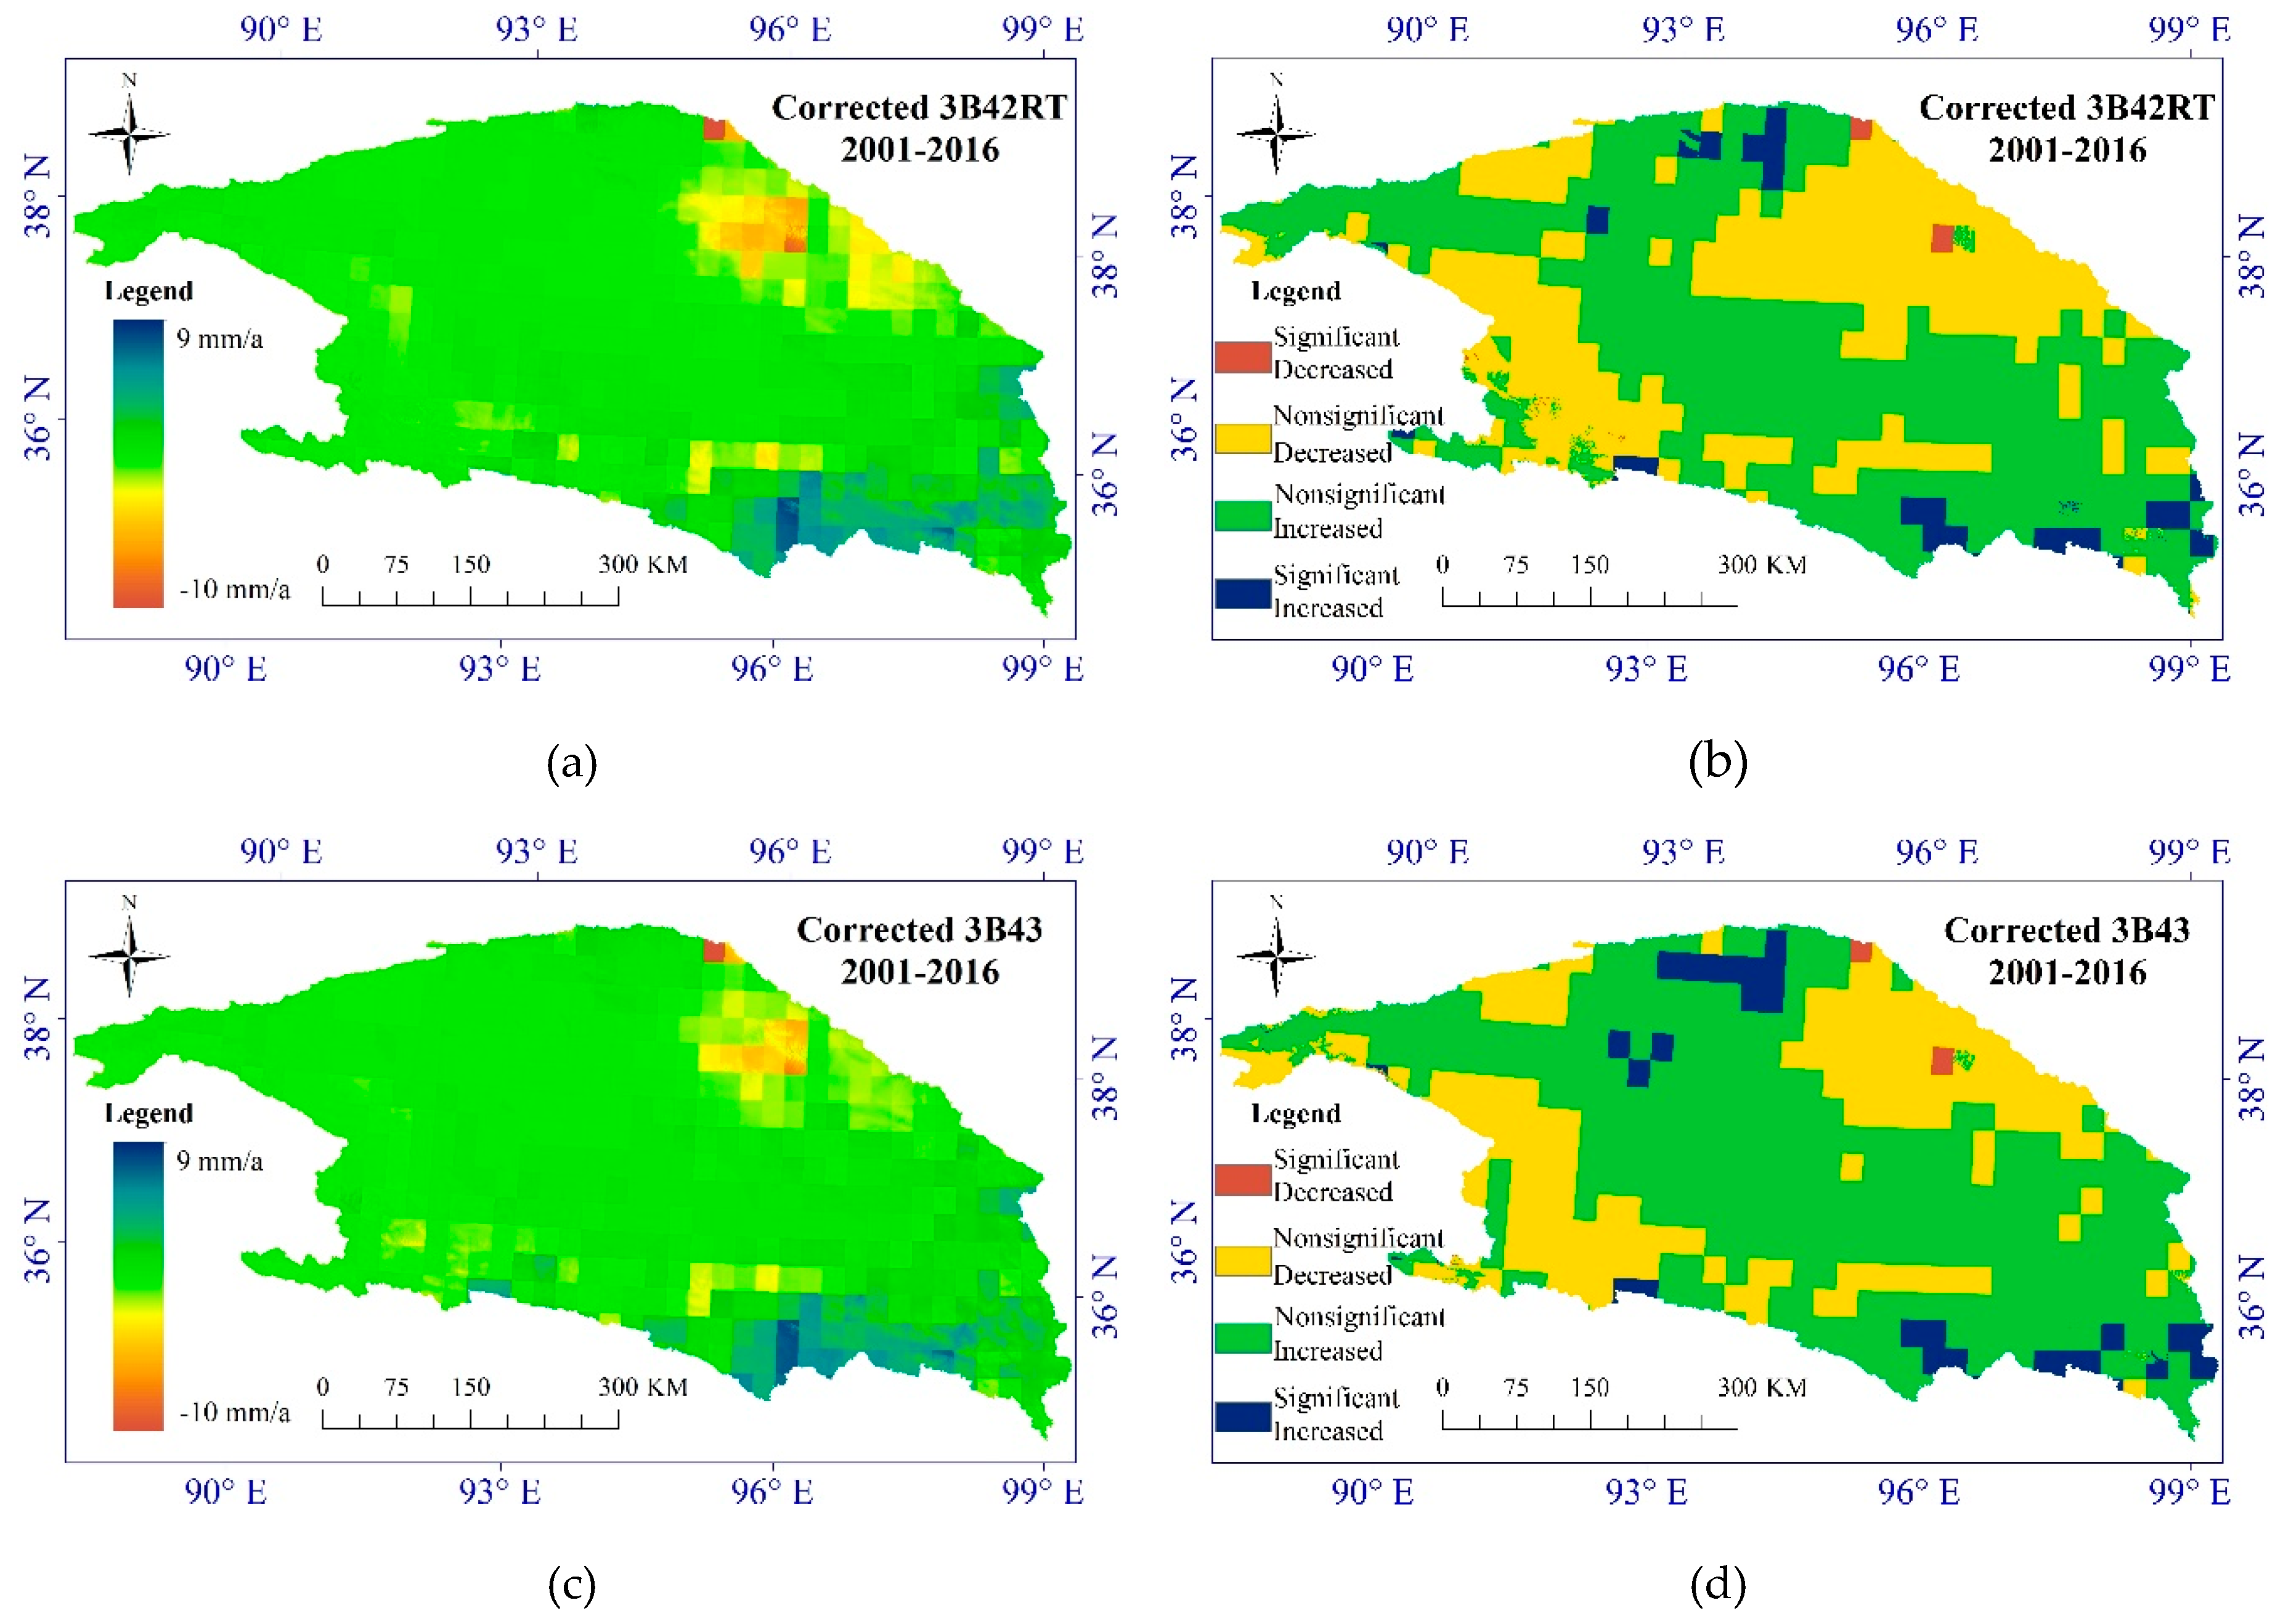
According to the corrected 3B42RT and 3B43 precipitation in the Qaidam Basin from 2001 to 2016, the change trend and significance on the grid scale in the study area were calculated, as shown in Figure 9.
It can be seen from the Figure 9a,b that the precipitation in the northeast of the Qaidam Basin (Qilian Mountain area) showed a decreasing trend, while in the southeastern edge of the basin (east of the Kunlun Mountains) showed an increasing trend based on corrected 3B42RT and 3B43 products. It is obvious the precipitation slightly increased at the center and northwest of the basin. Figure 9b,d showed the significant test results of the precipitation change trend. We know that most areas of the Qaidam Basin were non-significantly increased or decreased, and only a small part of the areas passed the significant change test (Z ≥ 2.58).
4. Conclusions
(1) The Qaidam Basin is located in an arid and semi-arid region with a dry climate and fragile natural ecological environment. The precipitation process in the Qaidam Basin is significantly different spatially and temporally. Due to the sparse gauge stations and maldistribution, the rainwater resources are hard to assess. A fusion of remote sensing precipitation of TRMM products and gauged precipitation is helpful.
(2) The average mean annual precipitation is only 104.34 mm by ground gauges interpolation, and 148.45 mm and 146.26 mm by original 3B42RT and 3B43. However, the precision evaluation of TRMM precipitation shows it was overestimated in the LGPA and underestimated in the HGPA. The original TRMM products need a correction.
(3) The correction result shows the average mean annual precipitation is 186.01 mm by 3B42RT and 174.74 mm by 3B43. The average bias of 3B42RT and 3B43 at gauge stations are significantly reduced to −0.08% and 0.11% after being corrected, and the average RMSD is significantly reduced to 37.51 mm and 34.22 mm, respectively. All of those indicated that the precipitation products fusion model based on ANN could effectively work on TRMM products.
(4) The final result shows there are many differences in areal precipitation based on sparse gauge precipitation data, original TRMM data and fusion remote sensing data. The rainwater resources in the study basin have been underestimated in the past year, and both were derived from ground gauge stations and from original TRMM products.
In the future, research needs to test the ANN effectivity on mining the normalized difference vegetation index and rainwater resources in this area.
Author Contributions
Conceptualization, Z.W. and G.X.; methodology, Z.W. and T.X.; formal analysis, G.X.; writing—original draft preparation, G.X.; writing—review and editing, Z.W. All authors read and approved the final manuscript.
Funding
This research was funded by the National Key Research and Development Program (No. 2016YFC0402900), Key R&D and Transformation Projects in Qinghai Province (No. 2017-SF-116), and the National Natural Science Foundation of China (NSFC, Grant No. 41671020).
Acknowledgments
The authors would like to thank all the colleagues who generously provided their dataset. The authors greatly thank the editors and reviewers for providing thorough and constructive comments to improve the manuscript.
Conflicts of Interest
The authors declare no conflicts of interest.
References
- Bohnenstengel, S.I.; Schlünzen, K.H.; Beyrich, F. Representativity of in situ precipitation measurements—A case study for the LITFASS area in North-Eastern Germany. J. Hydrol. 2011, 400, 387–395. [Google Scholar] [CrossRef]
- Marzano, F.S.; Cimini, D.; Montopoli, M. Investigating precipitation microphysics using ground-based microwave remote sensors and disdrometer data. Atmos. Res. 2010, 97, 583–600. [Google Scholar] [CrossRef]
- Zhuoqi, C.; Xiaogu, Z.; Shupeng, Z.; Tao, L. Mapping Daily Precipitation over China Based on TRMM Multisatellite Precipitation Analysis and Gauge Data. In Proceedings of the International Conference on Remote Sensing, Kyoto, Japan, 29 October–1 November 2012. [Google Scholar]
- XIE, P.; Arkin, P.A. Analyses of Global Monthly Precipitation Using Gauge Observations, Satellite Estimates, and Numerical Model Predictions. J. Clim. 1996, 9, 840–858. [Google Scholar] [CrossRef] [Green Version]
- Huffman, G.J.; Adler, R.F.; Rudolf, B.; Schneider, U.; Keehn, P.R. Global Precipitation Estimates Based on a Technique for Combining Satellite-Based Estimates, Rain Gauge Analysis, and NWP Model Precipitation Information. J. Clim. 1995, 8, 1284–1295. [Google Scholar] [CrossRef] [Green Version]
- Vila, D.; Goncalves, L.; Toll, D.; Rozante, J.R. Statistical Evaluation of Combined Daily Gauge Observations and Rainfall Satellite Estimates over Continental South America. J. Hydrometeorol. 2009, 10, 533–543. [Google Scholar] [CrossRef]
- Rozante, J.R.; Moreira, D.S.; de Goncalves, L.G.G.; Vila, D.A. Combining TRMM and Surface Observations of Precipitation: Technique and Validation over South America. Weather 2010, 25, 885–894. [Google Scholar] [CrossRef] [Green Version]
- Shen, Y.; Zhao, P.; Pan, Y.; Yu, J. A high spatiotemporal gauge-satellite merged precipitation analysis over China. J. Geophys. Res. Atmos. 2014, 119, 3063–3075. [Google Scholar] [CrossRef]
- Huffman, G.J.; Robert, F.A.; David, T.B.; Nelkin, E.J.; Acheampong, M. The TRMM Multi-Satellite Precipitation Analysis (TMPA); Springer: Berlin, Germany, 2008. [Google Scholar]
- Kubota, T.; Ushio, T.; Shige, S.; Kida, S.; Kachi, M.; Okamoto, K. Verification of High-Resolution Satellite-Based Rainfall Estimates around Japan Using a Gauge-Calibrated Ground-Radar Dataset. J. Meteorol. Soc. Jpn. 2009, 87, 203–222. [Google Scholar] [CrossRef]
- Kidd, C.; Huffman, G. Global precipitation measurement. Meteorol. Appl. 2011, 18, 334–353. [Google Scholar] [CrossRef]
- Tapiador, F.J.; Turk, F.J.; Petersen, W.; Hou, A.Y.; García-Ortega, E.; Machado, L.A.T.; Angelis, C.F.; Salio, P.; Kidd, C.; Huffman, G.J.; et al. Global precipitation measurement: Methods, datasets and applications. Atmos. Res. 2012, 104, 70–97. [Google Scholar] [CrossRef]
- Seto, S.; Iguchi, T.; Oki, T. The Basic Performance of a Precipitation Retrieval Algorithm for the Global Precipitation Measurement Mission’s Single/Dual-Frequency Radar Measurements. IEEE Trans. Geosci. Remote 2013, 51, 5239–5251. [Google Scholar] [CrossRef]
- Zhu, Z.; Yong, B.; Ke, L.; Wang, G.; Ren, L.; Chen, X. Tracing the Error Sources of Global Satellite Mapping of Precipitation for GPM (GPM-GSMaP) Over the Tibetan Plateau, China. IEEE J. Stars 2018, 11, 2181–2191. [Google Scholar] [CrossRef]
- Guo, H.; Chen, S.; Bao, A.; Behrangi, A.; Hong, Y.; Ndayisaba, F.; Hu, J.; Stepanian, P.M. Early assessment of Integrated Multi-satellite Retrievals for Global Precipitation Measurement over China. Atmos. Res. 2016, 176–177. [Google Scholar] [CrossRef]
- Haile, A.T.; Yan, F.; Habib, E. Accuracy of the CMORPH satellite-rainfall product over Lake Tana Basin in Eastern Africa. Atmos. Res. 2015, 163, 177–187. [Google Scholar] [CrossRef] [Green Version]
- Liu, S.; Yan, D.; Qin, T.; Weng, B.; Li, M. Correction of TRMM 3B42V7 Based on Linear Regression Models over China. Adv. Meteorol. 2016, 2016, 1–13. [Google Scholar] [CrossRef]
- Xia, T.; Wang, Z.; Zheng, H. Topography and Data Mining Based Methods for Improving Satellite Precipitation in Mountainous Areas of China. Atmosphere 2015, 6, 983–1005. [Google Scholar] [CrossRef] [Green Version]
- Zheng, X.; Zhu, J. A methodological approach for spatial downscaling of TRMM precipitation data in North China. Int. J. Remote Sens. 2015, 36, 144–169. [Google Scholar] [CrossRef]
- Tao, Z.; Yuanqing, H.; Jian, M.; Juan, P. Spatial and temporal distribution of precipitation based on corrected TRMM data around the Hexi Corridor, China. Sci. Cold Arid Reg. 2014, 6, 159–167. [Google Scholar]
- Shi, Y.; Song, L.; Xia, Z.; Lin, Y.; Myneni, R.; Choi, S.; Wang, L.; Ni, X.; Lao, C.; Yang, F. Mapping Annual Precipitation across Mainland China in the Period 2001–2010 from TRMM3B43 Product Using Spatial Downscaling Approach. Remote Sens. 2015, 7, 5849–5878. [Google Scholar] [CrossRef]
- Dinku, T.; Chidzambwa, S.; Ceccato, P.; Connor, S.J.; Ropelewski, C.F. Validation of high-resolution satellite rainfall products over complex terrain. Int. J. Remote Sens. 2008, 29, 4097–4110. [Google Scholar] [CrossRef]
- Bitew, M.M.; Gebremichael, M. Assessment of satellite rainfall products for streamflow simulation in medium watersheds of the Ethiopian highlands. Hydrol. Earth Syst. Sci. 2011, 15, 1147–1155. [Google Scholar] [CrossRef] [Green Version]
- Condom, T.; Rau, P.; Espinoza, J.C. Correction of TRMM 3B43 monthly precipitation data over the mountainous areas of Peru during the period 1998–2007. Hydrol. Process. 2011, 25, 1924–1933. [Google Scholar] [CrossRef]
- Darand, M.; Amanollahi, J.; Zandkarimi, S. Evaluation of the performance of TRMM Multi-satellite Precipitation Analysis (TMPA) estimation over Iran. Atmos. Res. 2017, 190, 121–127. [Google Scholar] [CrossRef]
- Romilly, T.G.; Gebremichael, M. Evaluation of satellite rainfall estimates over Ethiopian river basins. Hydrol. Earth Syst. Sci. 2011, 15, 1505–1514. [Google Scholar] [CrossRef] [Green Version]
- Moazami, S.; Golian, S.; Kavianpour, M.R.; Hong, Y. Uncertainty analysis of bias from satellite rainfall estimates using copula method. Atmos. Res. 2014, 137, 145–166. [Google Scholar] [CrossRef]
- Wang, Z.; Zhong, R.; Lai, C.; Chen, J. Evaluation of the GPM IMERG satellite-based precipitation products and the hydrological utility. Atmos. Res. 2017, 196, 151–163. [Google Scholar] [CrossRef]
- Lu, X.; Wei, M.; Tang, G.; Zhang, Y. Evaluation and correction of the TRMM 3B43V7 and GPM 3IMERGM satellite precipitation products by use of ground-based data over Xinjiang, China. Env. Earth Sci. 2018, 77, 209. [Google Scholar] [CrossRef]
- Lekula, M.; Lubczynski, M.W.; Shemang, E.M.; Verhoef, W. Validation of satellite-based rainfall in Kalahari. Phys. Chem. Earth Parts A/B/C 2018, 105, 84–97. [Google Scholar] [CrossRef]
- Duan, Z.; Bastiaanssen, W.G.M. First results from Version 7 TRMM 3B43 precipitation product in combination with a new downscaling–calibration procedure. Remote Sens. Env. 2013, 131, 1–13. [Google Scholar] [CrossRef]
- Guofeng, Z.; Dahe, Q.; Yuanfeng, L.; Fenli, C.; Pengfei, H.; Dongdong, C.; Kai, W. Accuracy of TRMM precipitation data in the southwest monsoon region of China. Appl. Clim. 2017, 129, 353–362. [Google Scholar] [CrossRef]
- Jia, S.; Zhu, W.; Lű, A.; Yan, T. A statistical spatial downscaling algorithm of TRMM precipitation based on NDVI and DEM in the Qaidam Basin of China. Remote Sens. Env. 2011, 115, 3069–3079. [Google Scholar] [CrossRef]
- Liu, S.; Yan, D.; Wang, H.; Li, C.; Qin, T.; Weng, B.; Xing, Z. Evaluation of TRMM 3B42V7 at the basin scale over mainland China. Adv. Water Sci. 2016, 27, 639–651. [Google Scholar]
- Seyyedi, H.; Anagnostou, E.N.; Beighley, E.; McCollum, J. Satellite-driven downscaling of global reanalysis precipitation products for hydrological applications. Hydrol. Earth Syst. Sci. 2014, 18, 5077–5091. [Google Scholar] [CrossRef] [Green Version]
- Agatonovic-Kustrin, S.; Beresford, R. Basic Concepts of Artificial Neural Network (ANN) Modeling and its Application in Pharmaceutical Research. J. Pharm. Biomed. Anal. 2000, 22, 717–727. [Google Scholar] [CrossRef]
- Partridge, D.; Rae, S.; Wang, W.J. Artificial neural networks. J. Roy. Soc. Med. 1999, 92, 385. [Google Scholar] [CrossRef]
- Lyons, W.B.; Flanagan, C.; Lewis, E.; Ewald, H.; Lochmann, S. Interrogation of multipoint optical fibre sensor signals based on artificial neural network pattern recognition techniques. Sens. Actuators A Phys. 2004, 114, 7–12. [Google Scholar] [CrossRef]
- Lyons, W.; Fitzpatrick, C.; Flanagan, C.; Lewis, E. A novel multipoint luminescent coated ultra violet fibre sensor utilising artificial neural network pattern recognition techniques. Sens. Actuators A Phys. 2004, 115, 267–272. [Google Scholar] [CrossRef]
- Nissar, A.I.; Upadhyaya, S.J. Fault Diagnosis of Mixed Signal VLSI Systems Using Artificial Neural Networks. In Proceedings of the Southwest Symposium on Mixed-Signal Design (SSMSD 99), Tucson, AZ, USA, 11–13 April 1999; IEEE: Piscataway, NY, USA, 1999; pp. 93–98. [Google Scholar]
- Huesken, D.; Lange, J.; Mickanin, C.; Weiler, J.; Asselbergs, F.; Warner, J.; Meloon, B.; Engel, S.; Rosenberg, A.; Cohen, D.; et al. Design of a genome-wide siRNA library using an artificial neural network. Nat. Biotechnol. 2005, 23, 995–1001. [Google Scholar] [CrossRef]
- Aceto, G.; Ciuonzo, D.; Montieri, A.; Pescapé, A. Mobile Encrypted Traffic Classification Using Deep Learning. In Proceedings of the 2018 Network Traffic Measurement and Analysis Conference (TMA), Vienna, Austria, 26–29 June 2018; IEEE: Piscataway, NJ, USA, 2018; pp. 1–8. [Google Scholar]
- Aceto, G.; Ciuonzo, D.; Montieri, A.; Pescape, A. Mobile Encrypted Traffic Classification Using Deep Learning: Experimental Evaluation, Lessons Learned, and Challenges. IEEE Trans. Netw. Serv. Manag. 2019. [Google Scholar] [CrossRef]
- Rucco, R.; Sorriso, A.; Liparoti, M.; Ferraioli, G.; Sorrentino, P.; Ambrosanio, M.; Baselice, F. Type and Location of Wearable Sensors for Monitoring Falls during Static and Dynamic Tasks in Healthy Elderly: A Review. Sensors 2018, 18, 1613. [Google Scholar] [CrossRef]
- Gardner, G.G.; Keating, D.; Williamson, T.H.; Elliott, A.T. Automatic detection of diabetic retinopathy using an artificial neural network: A screening tool. Brit. J. Ophthalmol. 1996, 80, 940–944. [Google Scholar] [CrossRef]
- Hsu, K.; Gupta, H.V.; Sorooshian, S. Artificial Neural Network Modeling of the Rainfall-Runoff Process. Water Resour. Res. 1995, 31, 2517–2530. [Google Scholar] [CrossRef]
- Hopfield, J.J. Neural networks and physical systems with emergent collective computational abilities. Proc. Natl. Acad. Sci. USA 1982, 79, 2554–2558. [Google Scholar] [CrossRef]
- AghaKouchak, A.; Nasrollahi, N.; Habib, E. Accounting for Uncertainties of the TRMM Satellite Estimates. Remote Sens. 2009, 1, 606–619. [Google Scholar] [CrossRef] [Green Version]
- Heidinger, H.; Yarlequé, C.; Posadas, A.; Quiroz, R. TRMM rainfall correction over the Andean Plateau using wavelet multi-resolution analysis. Int. J. Remote Sens. 2012, 33, 4583–4602. [Google Scholar] [CrossRef]
- Liu, Z.; Ostrenga, D.; Teng, W.; Kempler, S. Tropical Rainfall Measuring Mission (TRMM) Precipitation Data and Services for Research and Applications. B Am. Meteorol. Soc. 2012, 93, 1317–1325. [Google Scholar] [CrossRef] [Green Version]
- Courault, D.; Seguin, B.; Olioso, A. Review on estimation of evapotranspiration from remote sensing data: From empirical to numerical modeling approaches. Irrig. Drain. Syst. 2005, 19, 223–249. [Google Scholar] [CrossRef]
- Ji, T.; Yang, H.; Liu, R.; He, T.; Wu, J. Applicability analysis of the TRMM precipitation data in the Sichuan-Chongqing region. Prog. Geogr. 2014, 1375–1386. [Google Scholar]
- Wang, X.; Liu, H.; Bao, A. Applicability Research on TRMM Precipitation Data in Tianshan Mountains. J. China Hydrol. 2014, 58–64. [Google Scholar]
- Yongqing, B.; Juanle, W.; Yujie, W.; Xuehua, H.; Tsydypov, B.Z.; Ochir, A.; Davaasuren, D. Spatio-Temporal Distribution of Drought in the Belt and Road Area During 1998–2015 Based on TRMM Precipitation Data. J. Resour. Ecol. 2017, 8, 559–570. [Google Scholar] [CrossRef]
- Tian, Y.; Peters-Lidard, C.D.; Choudhury, B.J.; Garcia, M. Multitemporal Analysis of TRMM-Based Satellite Precipitation Products for Land Data Assimilation Applications. J. Hydrometeorol. 2007, 8, 1165–1183. [Google Scholar] [CrossRef]
- Bookhagen, B.; Burbank, D.W. Topography, relief, and TRMM-derived rainfall variations along the Himalaya. Geophys. Res. Lett. 2006, 33. [Google Scholar] [Green Version]
- Qu, W.; Lu, J.; Song, W.; Zhang, T.; Tan, Y.; Huang, P. Research on Accuracy Validation and Calibration Methods of TRMM Remote Sensing Precipitation Data in Irrawaddy Basin. Adv. Earth Sci. 2014, 1262–1270. [Google Scholar]
- Xu, R.; Tian, F.; Yang, L.; Hu, H.; Lu, H.; Hou, A. Ground validation of GPM IMERG and TRMM 3B42V7 rainfall products over southern Tibetan Plateau based on a high-density rain gauge network. J. Geophys. Res. Atmos. 2017, 122, 910–924. [Google Scholar] [CrossRef]
- Geographical Information Monitoring Cloud Platform. Available online: http://www.dsac.cn/ (accessed on 25 May 2018).
- National Aeronautics and Space Administration. Available online: https://mirador.gsfc.nasa.gov/ (accessed on 17 March 2018).
- National Meteorological Information Center. Available online: http://data.cma.cn/ (accessed on 9 May 2018).
- Qinghai Water Conservancy Bureau. Annual Hydrological Report P. R. China: Hydrological Data of Inland Rivers and Lakes, 1st ed.; Journal of Qinghai Water Conservancy Bureau: Xining, China, 2016; pp. 64–73. [Google Scholar]
- Marden, J.; Kendall, M.; Gibbons, J. Rank Correlation Methods (5th ed.). J. Am. Stat. Assoc. 1992, 87, 249. [Google Scholar] [CrossRef]
- Mann, H.B. Nonparametric Tests Against Trend. Econometrica 1945, 13, 245. [Google Scholar] [CrossRef]
- Burn, D.H.; Hag Elnur, M.A. Detection of hydrologic trends and variability. J. Hydrol. 2002, 255, 107–122. [Google Scholar] [CrossRef]
Figure 1.
The research area of the Qaidam Basin.

Figure 2.
The artificial neural network (ANN) structure diagram.

Figure 3.
The Original TRMM Precipitation Products Errors.

Figure 4.
The gauged precipitation – elevation mask (PEM) and original TRMM precipitation filter from 2001 to 2016. (a) Grids with gauge station. (b) Grids without gauge station.
Figure 4.
The gauged precipitation – elevation mask (PEM) and original TRMM precipitation filter from 2001 to 2016. (a) Grids with gauge station. (b) Grids without gauge station.

Figure 5.
The calibration and validation of TRMM precipitation by artificial neural networks (ANN). (a) Training and testing for 3B42RT; (b) correction for 3B42RT; (c) training and testing for 3B43; (d) correction for 3B43.
Figure 5.
The calibration and validation of TRMM precipitation by artificial neural networks (ANN). (a) Training and testing for 3B42RT; (b) correction for 3B42RT; (c) training and testing for 3B43; (d) correction for 3B43.


Figure 6.
The consistency rate (CR) elevation for corrected TRMM from 2001 to 2016 in the Qaidam Basin. (a) Gauged grids. (b) Ungauged grids.
Figure 6.
The consistency rate (CR) elevation for corrected TRMM from 2001 to 2016 in the Qaidam Basin. (a) Gauged grids. (b) Ungauged grids.

Figure 7.
Comparison of spatial distribution of TRMM precipitation before and after correction. (a) Original 3B42RT precipitation; (b) Corrected 3B42RT precipitation; (c) Original 3B43 precipitation; (d) Corrected 3B43 precipitation.
Figure 7.
Comparison of spatial distribution of TRMM precipitation before and after correction. (a) Original 3B42RT precipitation; (b) Corrected 3B42RT precipitation; (c) Original 3B43 precipitation; (d) Corrected 3B43 precipitation.

Figure 8.
The annual precipitation time series of the gauged precipitation, original and corrected of 3B42RT and 3B43 products at the 20 gauge stations. (a) DCD: DaChaDan; (b) DLH: DeLingHa; (c) DL: DuLan; (d) GEM: GeErMu; (e) LH: LengHu; (f) MY: MangYa; (g) NMH: NuoMuHong; (h) WL: WuLan; (i) XZH: XiaoZaoHuo; (j) CHH: ChaHanHe (k) CHWS: ChaHanWuSu (l) KE: KeEr; (m) HX: HeXi; (n) HTTL: HuaiTouTaiLa; (o) GH: GaHai; (p) SGB: ShangGaBa; (q) XRH: XiaRiHa; (r) XRD: XiangRiDe; (s) NCT: NaChiTai; (t) GEM(4): GeErMu4.


Figure 9.
The variation trend and significance of precipitation in the Qaidam Basin. (a) Corrected 3B42RT change trend; (b) corrected 3B42RT change significance; (c) corrected 3B43 change trend; (d) corrected 3B43 change significance.
Figure 9.
The variation trend and significance of precipitation in the Qaidam Basin. (a) Corrected 3B42RT change trend; (b) corrected 3B42RT change significance; (c) corrected 3B43 change trend; (d) corrected 3B43 change significance.


Table 1.
The precision of original Tropical Precipitation Measurement Satellite (TRMM) products (2001–2016). LH: LengHu; XZH: XiaoZaoHuo; GEM: GeErMu; HX: HeXi; MY: MangYa; NMH: NuoMuHong; GEM4: GeErMu4; DCD: DaChaDan; HTTL: HuaiTouTaiLa; GH: GaHai; NCT: NaChiTai; WL: WuLan; DLH: DeLingHa; DL: DuLan; CHWS: ChaHanWuSu; XRH: XiaRiHa; XRD: XiangRiDe; KE: KeEr; SGB: ShangGaBa; CHH: ChaHanHe; MAP: Mean Annual Precipitation.
| Gauges | Original 3B42RT | Original 3B43 | |||||||||
|---|---|---|---|---|---|---|---|---|---|---|---|
| No. | Name | X (°) | Y (°) | DEM (m) | MAP (mm) | MAP (mm) | Bias (%) | RMSD (mm) | MAP (mm) | Bias (%) | RMSD (mm) |
| 1 | LH | 93.33 | 38.75 | 2777 | 19.88 | 41.10 | 106.79 | 23.17 | 36.19 | 82.07 | 18.42 |
| 2 | XZH | 93.68 | 36.80 | 2772 | 30.34 | 81.60 | 168.97 | 57.76 | 77.49 | 155.44 | 52.74 |
| 3 | GEM | 94.90 | 36.42 | 2812 | 47.32 | 126.01 | 166.30 | 81.28 | 113.31 | 139.46 | 68.68 |
| 4 | HX | 94.60 | 36.38 | 2822 | 47.34 | 121.63 | 156.91 | 77.60 | 111.21 | 134.89 | 68.22 |
| 5 | MY | 90.85 | 38.25 | 2942 | 50.16 | 68.37 | 34.55 | 26.85 | 60.59 | 19.79 | 20.07 |
| 6 | NMH | 96.42 | 36.43 | 2796 | 55.54 | 118.66 | 113.65 | 67.30 | 117.21 | 111.05 | 65.48 |
| 7 | GEM4 | 94.78 | 36.30 | 2957 | 61.76 | 126.01 | 104.05 | 67.61 | 113.31 | 83.48 | 55.44 |
| 8 | DCD | 95.37 | 37.85 | 3190 | 104.00 | 122.89 | 18.17 | 38.35 | 119.28 | 14.69 | 28.18 |
| 9 | HTTL | 96.73 | 37.35 | 2867 | 107.94 | 160.30 | 48.51 | 65.39 | 162.39 | 50.45 | 63.29 |
| 10 | GH | 97.43 | 37.23 | 2877 | 161.24 | 157.18 | −2.52 | 32.02 | 168.12 | 4.27 | 26.18 |
| 11 | NCT | 94.57 | 35.87 | 3966 | 182.31 | 230.40 | 26.38 | 70.91 | 222.21 | 21.89 | 65.31 |
| 12 | WL | 98.48 | 36.92 | 2959 | 222.26 | 157.31 | −29.22 | 83.38 | 174.37 | −21.55 | 66.26 |
| 13 | DLH | 97.37 | 37.37 | 2988 | 228.68 | 201.19 | −12.02 | 41.53 | 203.84 | −10.86 | 35.93 |
| 14 | DL | 98.10 | 36.30 | 3190 | 240.73 | 183.92 | −23.60 | 73.11 | 195.62 | −18.74 | 58.43 |
| 15 | CHWS | 98.12 | 36.23 | 3273 | 244.97 | 211.97 | −13.47 | 54.70 | 218.89 | −10.65 | 45.53 |
| 16 | XRH | 98.15 | 36.42 | 3143 | 252.91 | 183.92 | −27.28 | 95.16 | 195.62 | −22.65 | 81.60 |
| 17 | XRD | 97.87 | 35.97 | 3100 | 285.18 | 264.48 | −7.26 | 57.26 | 265.41 | −6.93 | 55.43 |
| 18 | KE | 97.70 | 35.95 | 3269 | 307.43 | 278.26 | −9.49 | 70.71 | 277.94 | −9.59 | 70.63 |
| 19 | SGB | 98.58 | 37.00 | 3168 | 332.05 | 170.04 | −48.79 | 171.22 | 187.25 | −43.61 | 151.87 |
| 20 | CHH | 98.57 | 37.05 | 3351 | 432.30 | 257.26 | –40.49 | 189.76 | 258.21 | –40.20 | 187.08 |
| -- | Average | -- | -- | -- | 170.72 | 163.12 | 36.51 | 72.25 | 163.92 | 31.63 | 64.24 |
Table 2.
The precision evaluation of corrected 3B42RT and 3B43 (2001–2016). - LH: LengHu; XZH: XiaoZaoHuo; GEM: GeErMu; HX: HeXi; MY: MangYa; NMH: NuoMuHong; GEM4: GeErMu4; DCD: DaChaDan; HTTL: HuaiTouTaiLa; GH: GaHai; NCT: NaChiTai; WL: WuLan; DLH: DeLingHa; DL: DuLan; CHWS: ChaHanWuSu; XRH: XiaRiHa; XRD: XiangRiDe; KE: KeEr; SGB: ShangGaBa; CHH: ChaHanHe; MAP: Mean Annual Precipitation.
| Gauges | Corrected 3B42RT | Corrected 3B43 | ||||||||
|---|---|---|---|---|---|---|---|---|---|---|
| Name | X (°) | Y (°) | DEM (m) | MAP (mm) | MAP (mm) | Bias (%) | RMSD (mm) | MAP (mm) | Bias (%) | RMSD (mm) |
| LH | 93.33 | 38.75 | 2777 | 19.88 | 19.03 | −12.15 | 8.21 | 17.80 | −10.44 | 7.21 |
| XZH | 93.68 | 36.80 | 2772 | 30.34 | 31.60 | 4.15 | 11.71 | 32.25 | 6.32 | 12.21 |
| GEM | 94.90 | 36.42 | 2812 | 47.32 | 45.53 | −3.78 | 11.06 | 44.48 | −6.00 | 10.49 |
| HX | 94.60 | 36.38 | 2822 | 47.34 | 45.53 | −3.82 | 14.92 | 45.09 | −4.77 | 15.71 |
| MY | 90.85 | 38.25 | 2942 | 50.16 | 48.87 | −2.46 | 22.2 | 52.54 | 4.52 | 22.01 |
| NMH | 96.42 | 36.43 | 2796 | 55.54 | 54.30 | −2.23 | 17.24 | 53.51 | −3.66 | 17.53 |
| GEM4 | 94.78 | 36.30 | 2957 | 61.76 | 55.26 | −10.52 | 13.57 | 56.97 | −7.74 | 12.57 |
| DCD | 95.37 | 37.85 | 3190 | 104.00 | 98.31 | −5.47 | 29.43 | 105.38 | 1.33 | 23.10 |
| HTTL | 96.73 | 37.35 | 2867 | 107.94 | 123.67 | 14.57 | 38.85 | 123.21 | 14.15 | 35.36 |
| GH | 97.43 | 37.23 | 2877 | 161.24 | 160.28 | −0.60 | 31.44 | 158.83 | −1.50 | 26.12 |
| NCT | 94.57 | 35.87 | 3966 | 182.31 | 182.35 | 0.02 | 35.08 | 185.47 | 1.74 | 34.19 |
| WL | 98.48 | 36.92 | 2959 | 222.26 | 243.09 | 9.38 | 56.33 | 231.36 | 4.10 | 48.45 |
| DLH | 97.37 | 37.37 | 2988 | 228.68 | 226.20 | −1.08 | 31.62 | 223.36 | −2.32 | 24.75 |
| DL | 98.11 | 36.30 | 3190 | 240.73 | 246.18 | 2.26 | 48.60 | 247.77 | 2.93 | 40.58 |
| CHWS | 98.12 | 36.23 | 3273 | 244.97 | 290.87 | 18.74 | 63.93 | 289.24 | 18.07 | 58.15 |
| XRH | 98.15 | 36.42 | 3143 | 252.91 | 247.61 | −2.11 | 66.42 | 247.41 | −2.17 | 59.82 |
| XRD | 97.87 | 35.97 | 3100 | 285.18 | 271.46 | −4.81 | 54.38 | 275.56 | −3.37 | 52.80 |
| KE | 97.7 | 35.95 | 3269 | 307.43 | 304.7 | −0.89 | 62.78 | 308.31 | 0.29 | 63.06 |
| SGB | 98.58 | 37 | 3168 | 332.05 | 316.19 | −4.78 | 57.49 | 305.51 | −7.99 | 51.4 |
| CHH | 98.57 | 37.05 | 3351 | 432.3 | 449.37 | 3.95 | 74.96 | 426.29 | –1.27 | 68.8 |
| Average | -- | -- | -- | 170.72 | 173.02 | –0.08 | 37.51 | 171.52 | 0.11 | 34.22 |
Table 3.
Assessment of annual precipitation in each region of the Qaidam Basin.
| Region Name | Area (103 km2) | Interpolated Precipitation by Gauges | Original 3B42RT | Corrected 3B42RT | Original 3B43 | Corrected 3B43 |
|---|---|---|---|---|---|---|
| LE | 19.3 | 29.65 | 43.79 | 22.42 | 39.43 | 25.3 |
| MY | 31.3 | 42.43 | 67.72 | 55.27 | 62.22 | 62.48 |
| GEM | 69.4 | 65.64 | 162.73 | 118.69 | 157.5 | 114.27 |
| DCD | 21.3 | 69.55 | 100.92 | 128.46 | 97.61 | 126.22 |
| XJ | 17.4 | 74.31 | 114.1 | 131.95 | 108.28 | 133.53 |
| ZD | 4.8 | 83.98 | 239.7 | 171.39 | 238.79 | 141.03 |
| GS | 17.9 | 86.57 | 112.33 | 221.02 | 107.09 | 208.24 |
| QML | 6.5 | 157.57 | 275.74 | 363.65 | 273.22 | 321.82 |
| DLH | 22.7 | 168.45 | 190.01 | 369.43 | 192.47 | 343.08 |
| DL | 43.8 | 183.01 | 203.43 | 302.37 | 205.56 | 273.62 |
| WL | 10.4 | 259.57 | 171.17 | 299.41 | 185.38 | 288.63 |
| MD | 4.7 | 292.9 | 354.29 | 602.71 | 358.21 | 523.32 |
| The entire basin | 269.4 | 104.34 | 148.45 | 186.01 | 146.26 | 174.76 |
Table 4.
Comparison of the annual precipitation variation trend (2001–2016) between gauged and TRMM products on the grids with the gauge station. LH: LengHu; XZH: XiaoZaoHuo; GEM: GeErMu; HX: HeXi; MY: MangYa; NMH: NuoMuHong; GEM4: GeErMu4; DCD: DaChaDan; HTTL: HuaiTouTaiLa; GH: GaHai; NCT: NaChiTai; WL: WuLan; DLH: DeLingHa; DL: DuLan; CHWS: ChaHanWuSu; XRH: XiaRiHa; XRD: XiangRiDe; KE: KeEr; SGB: ShangGaBa; CHH: ChaHanHe; MAP: Mean Annual Precipitation.
| Station Name | Gauged | Original 3B42RT | Corrected 3B42RT | Original 3B43 | Corrected 3B43 |
|---|---|---|---|---|---|
| GH | −2.21 | −0.23 | −0.18 | −0.27 | −0.85 |
| XRD | −1.32 | 0.01 | −0.02 | −0.06 | −0.07 |
| DCD | −0.63 | −1.55 | −0.75 | −1.07 | −0.77 |
| KE | −0.62 | −0.37 | −0.40 | −0.47 | −0.59 |
| DLH | −0.32 | −0.94 | −0.91 | −0.27 | −0.33 |
| HTTL | −0.15 | −1.05 | −0.63 | 0.13 | −0.10 |
| CHWS | 0.09 | 2.78 | 2.87 | 0.58 | 0.67 |
| LH | 0.13 | 0.91 | 0.05 | 1.10 | 0.26 |
| XZH | 0.14 | 1.44 | 0.39 | 1.94 | 0.57 |
| DL | 0.23 | 0.01 | 0.02 | 0.94 | 1.05 |
| GEM4 | 0.58 | 1.87 | 0.88 | 1.29 | 0.58 |
| NMH | 0.63 | 1.91 | 0.95 | 2.33 | 1.29 |
| HX | 0.89 | 2.08 | 0.69 | 2.23 | 0.85 |
| GEM | 0.93 | 1.87 | 0.84 | 1.29 | 0.54 |
| NCT | 1.31 | 0.63 | 0.32 | 0.86 | 0.35 |
| MY | 1.45 | 0.17 | 0.06 | 0.41 | 0.13 |
| SGB | 2.43 | 4.25 | 3.95 | 3.22 | 3.03 |
| WL | 4.71 | 3.14 | 2.77 | 2.28 | 2.69 |
| XRH | 3.21 | 2.21 | 2.29 | 2.94 | 3.06 |
| CHH | 10.45 | 0.19 | 0.18 | 1.16 | 1.78 |
| Average | 1.10 | 0.97 | 0.67 | 1.03 | 0.71 |
© 2019 by the authors. Licensee MDPI, Basel, Switzerland. This article is an open access article distributed under the terms and conditions of the Creative Commons Attribution (CC BY) license (http://creativecommons.org/licenses/by/4.0/).
Share and Cite
MDPI and ACS Style
Xu, G.; Wang, Z.; Xia, T. Mapping Areal Precipitation with Fusion Data by ANN Machine Learning in Sparse Gauged Region. Appl. Sci. 2019, 9, 2294. https://doi.org/10.3390/app9112294
AMA Style
Xu G, Wang Z, Xia T. Mapping Areal Precipitation with Fusion Data by ANN Machine Learning in Sparse Gauged Region. Applied Sciences. 2019; 9(11):2294. https://doi.org/10.3390/app9112294
Chicago/Turabian StyleXu, Guoyin, Zhongjing Wang, and Ting Xia. 2019. "Mapping Areal Precipitation with Fusion Data by ANN Machine Learning in Sparse Gauged Region" Applied Sciences 9, no. 11: 2294. https://doi.org/10.3390/app9112294
Note that from the first issue of 2016, this journal uses article numbers instead of page numbers. See further details here.