CO2 Emission of Electric and Gasoline Vehicles under Various Road Conditions for China, Japan, Europe and World Average—Prediction through Year 2040


Abstract
:1. Introduction
1.1. The Contribution of Road Traffic Emissions to Global Greenhouse Gas Emissions
1.2. The CO2 Emission from CV, EV and HEV of Different Countries/Regions
1.3. The Effect of Road Conditions on Vehicle CO2 Emission
2. Methodology
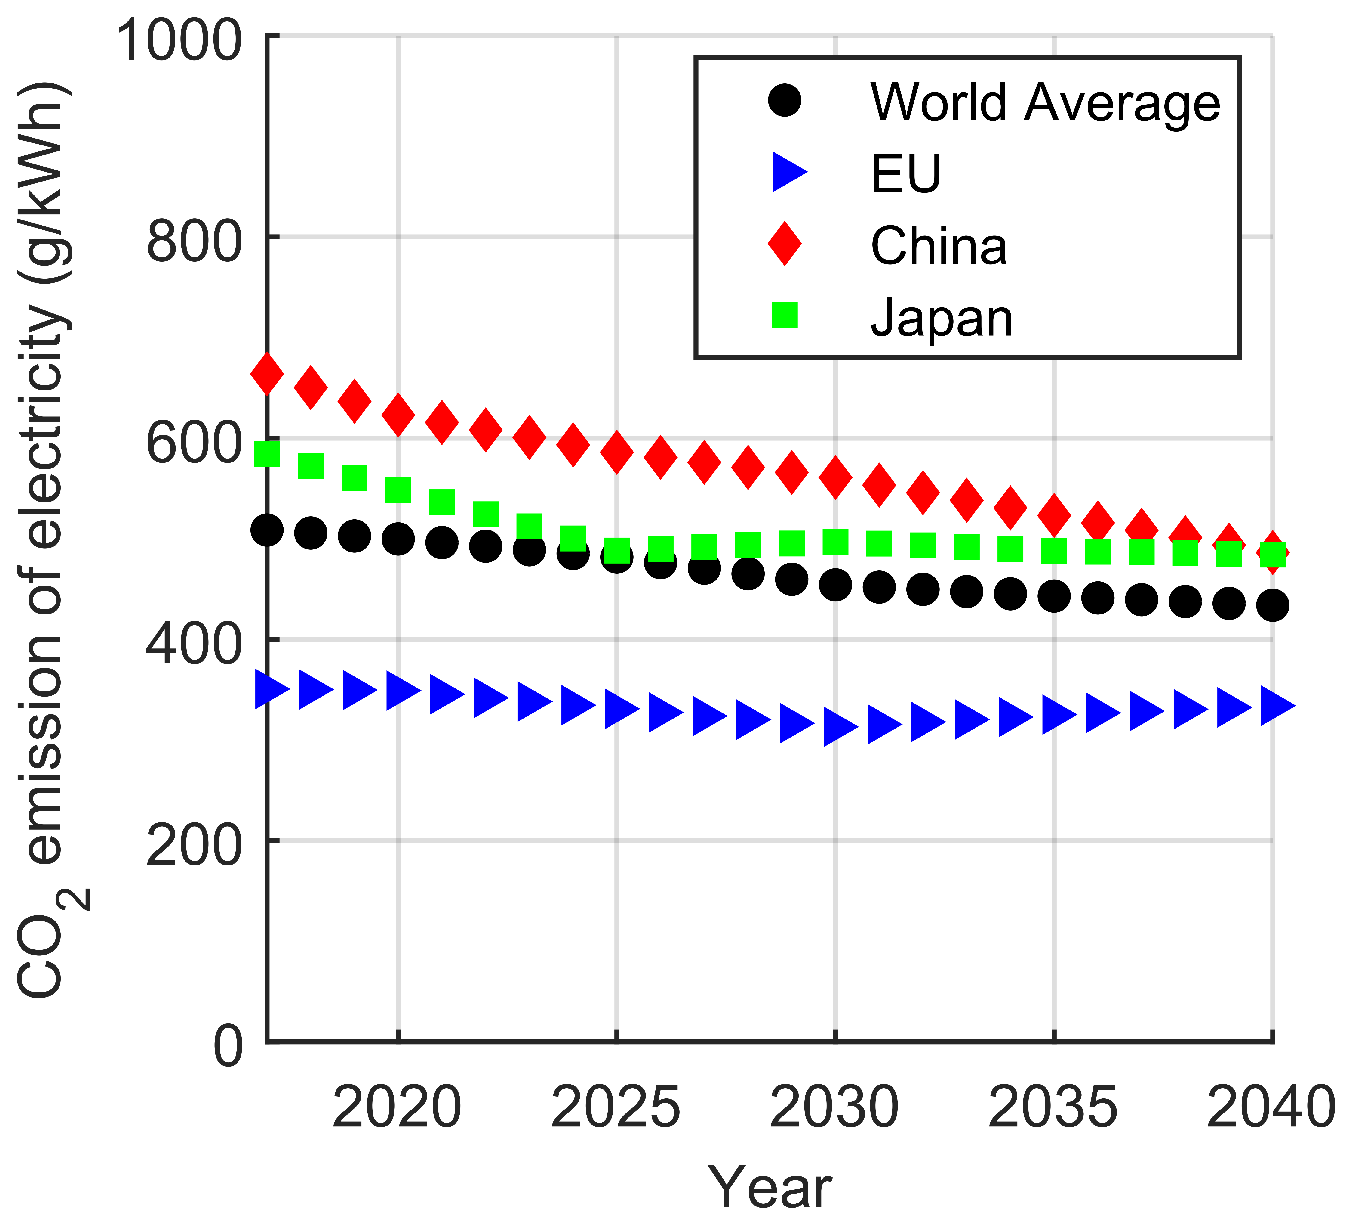
2.1. CO2 Emission of Electricity and Gasoline
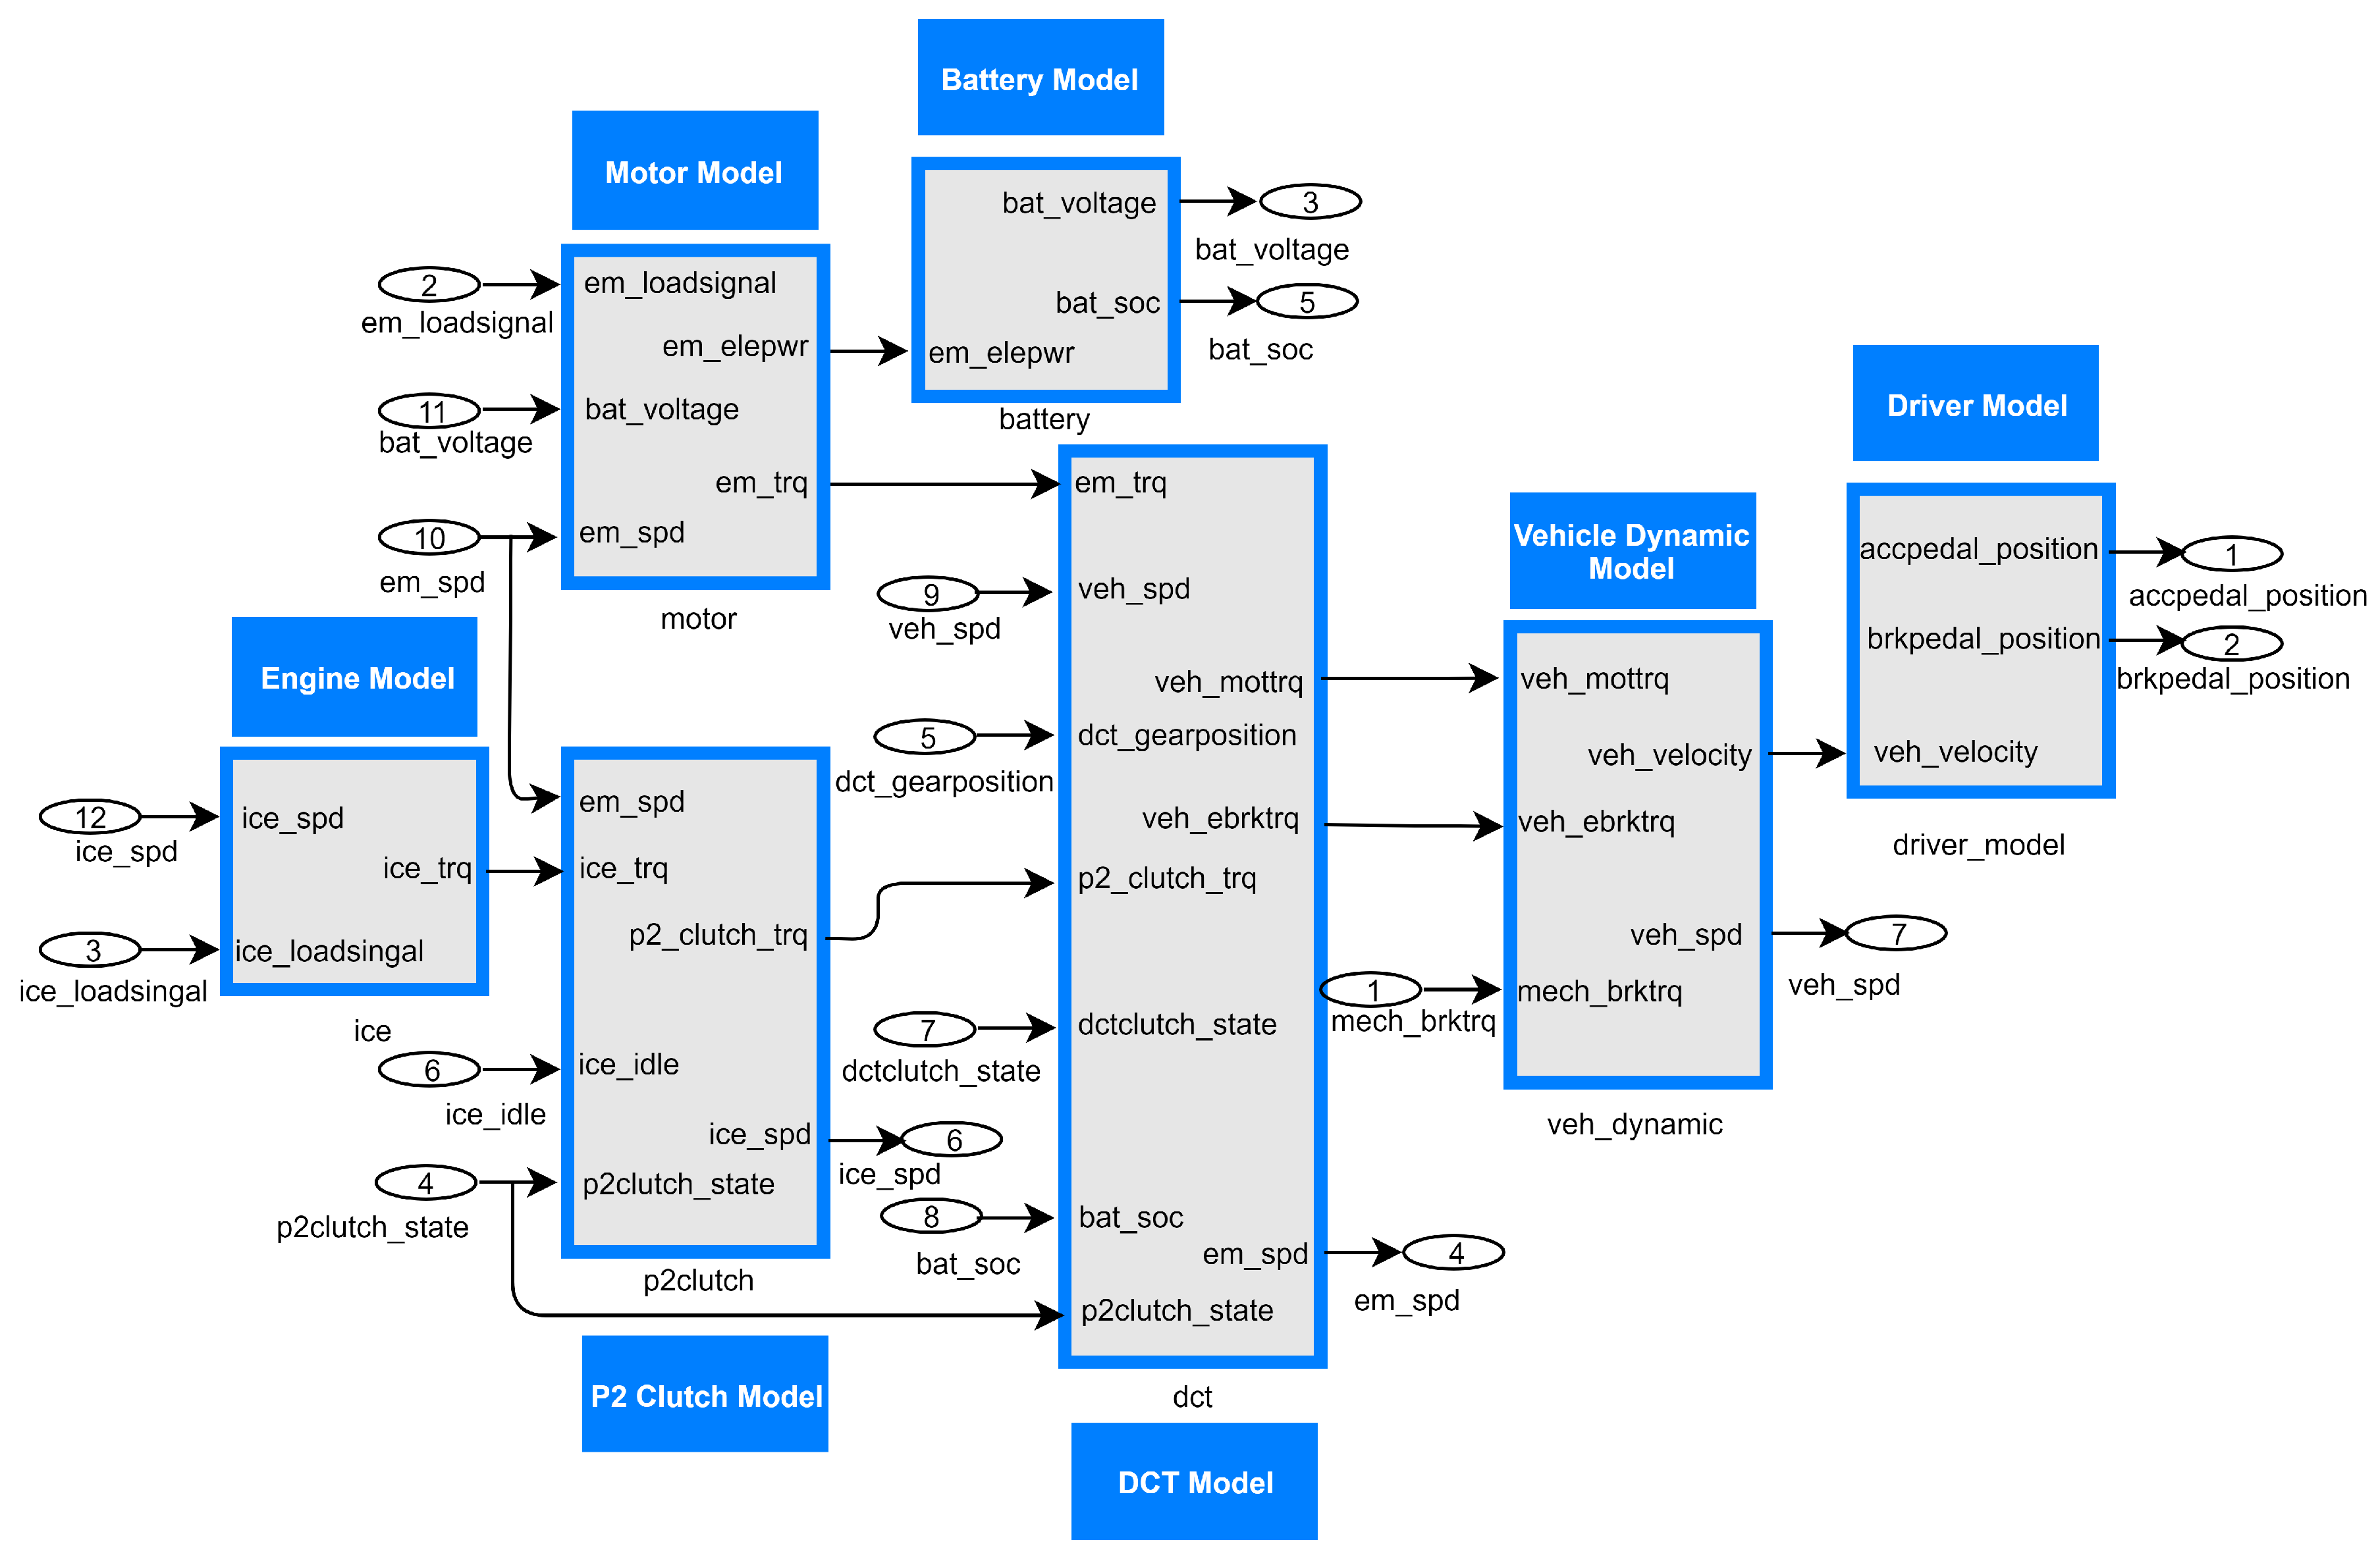
2.2. Vehicle Dynamic Model
2.2.1. Engine Model
2.2.2. Motor Module
2.2.3. P2 Clutch Model
2.2.4. Battery Model
2.2.5. DCT Model
2.2.6. Vehicle Dynamic Model and Driver’s Model
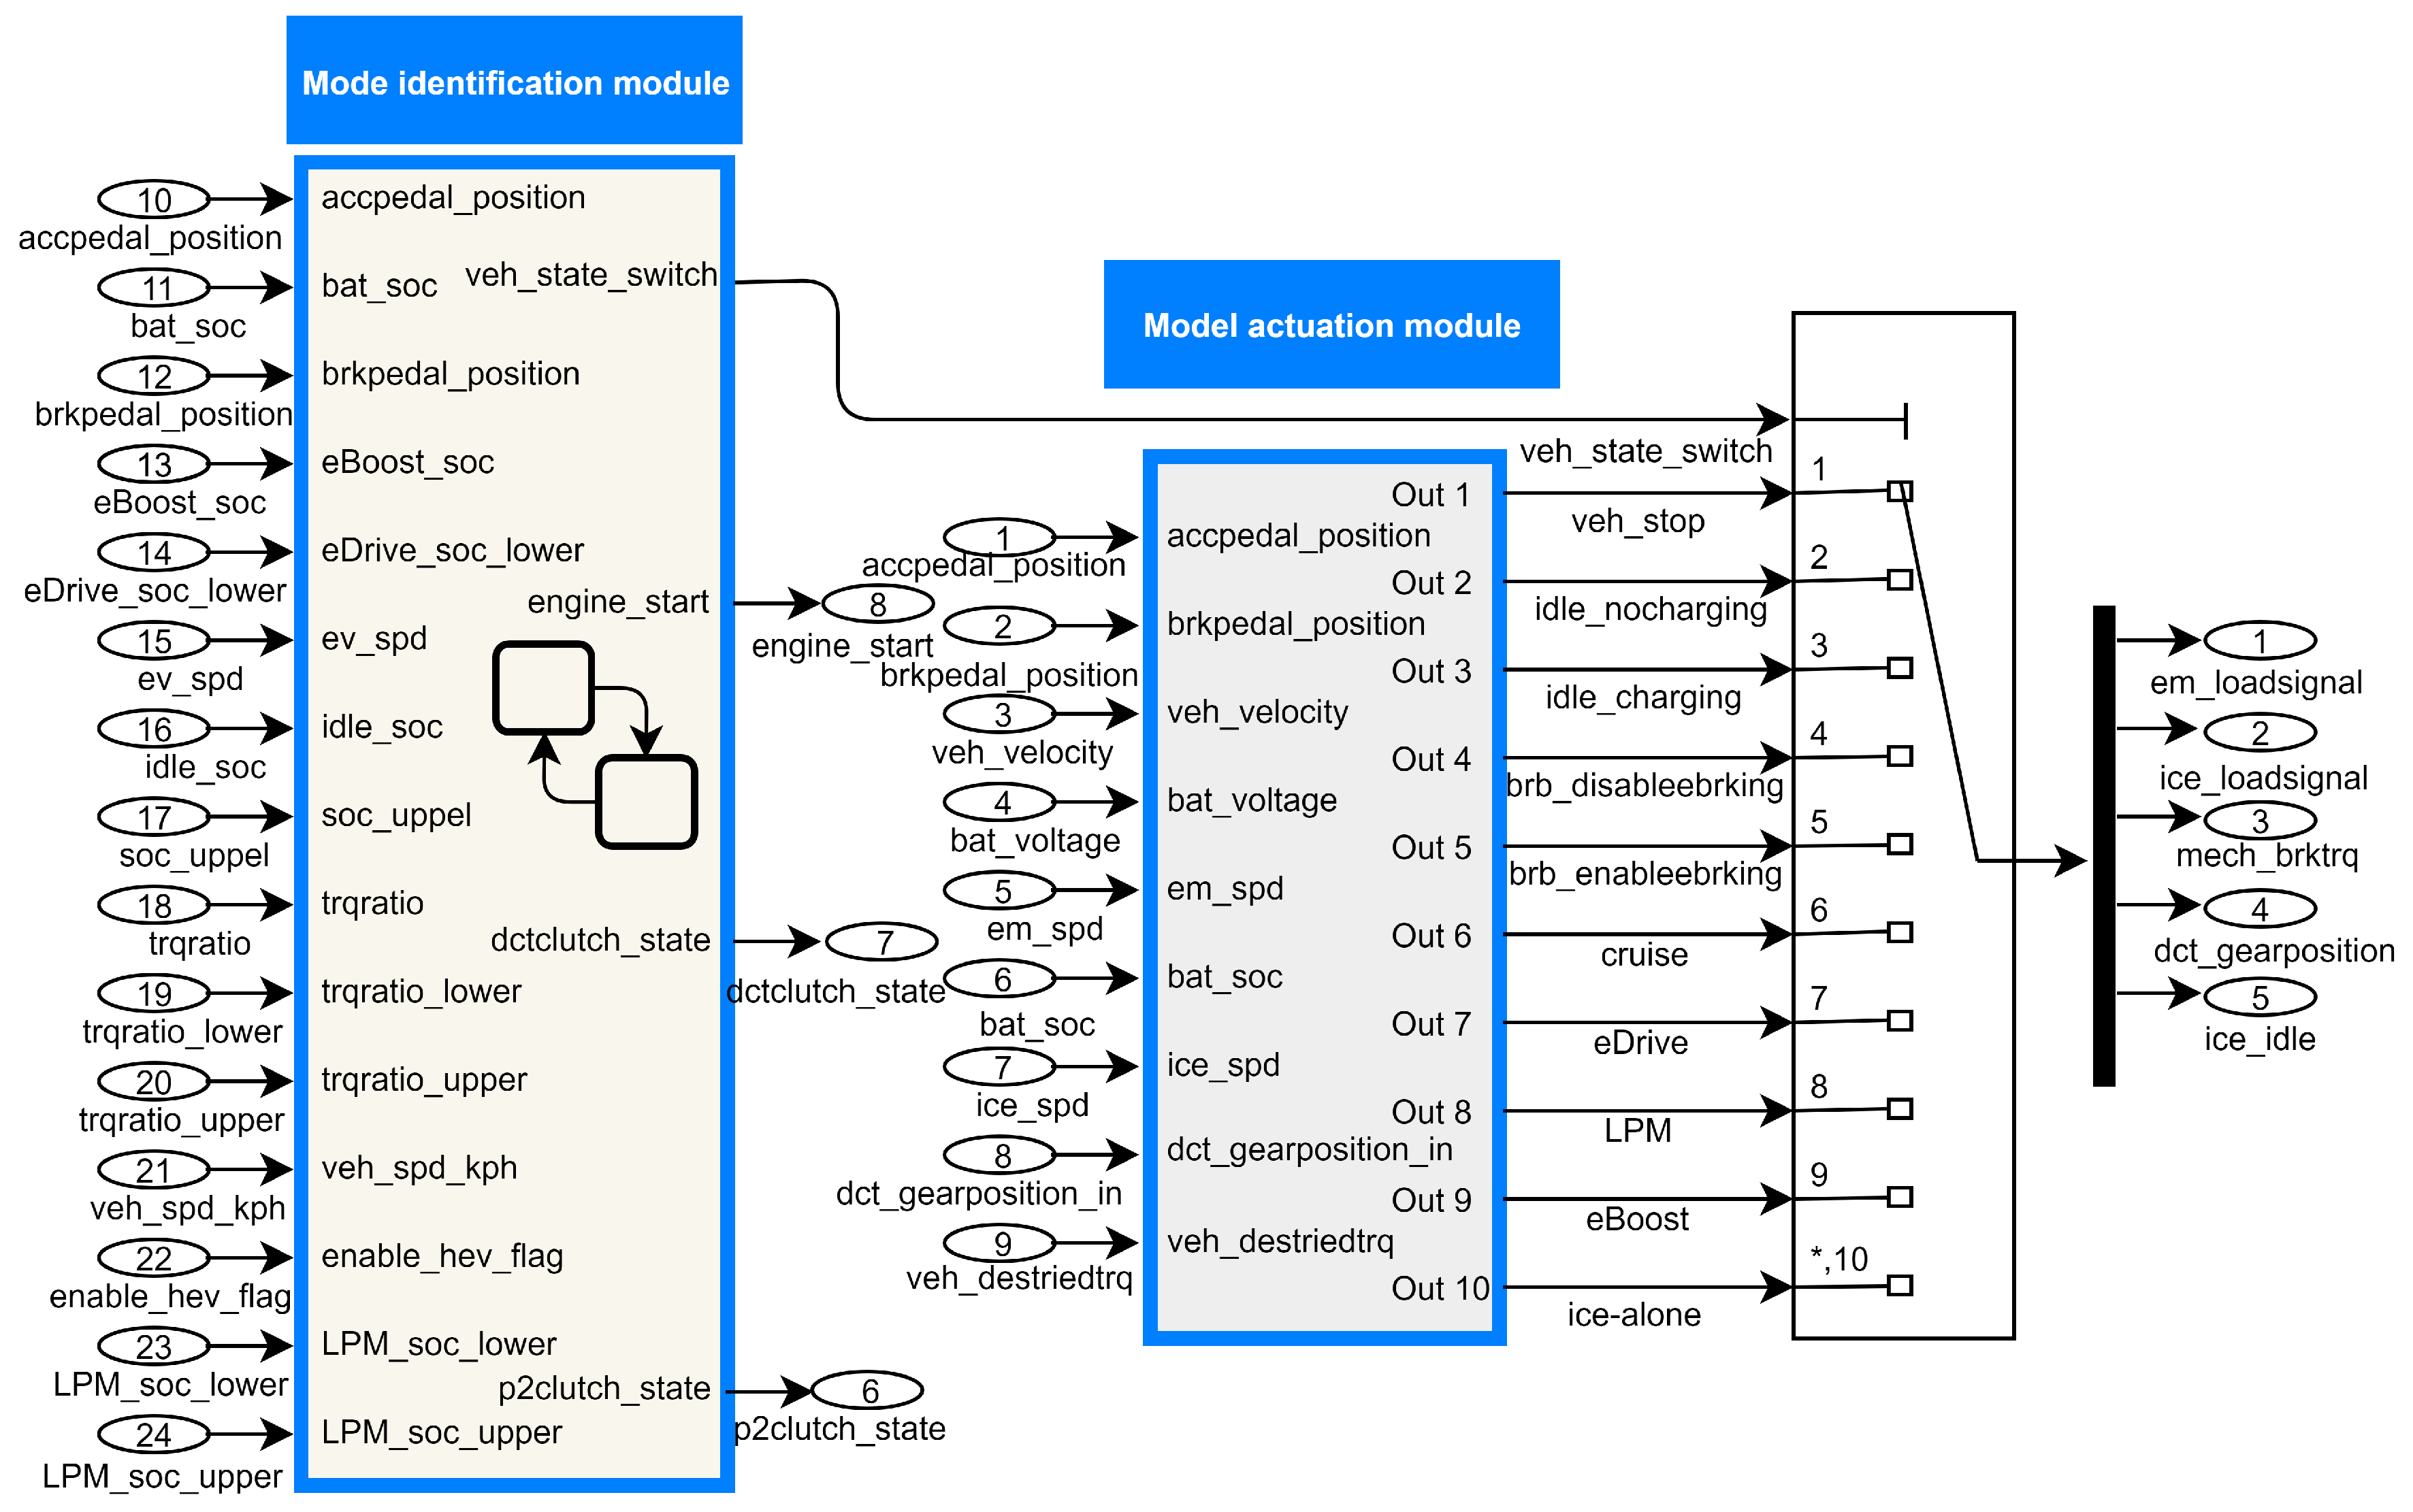
2.2.7. Control Strategy
2.3. Model Validation
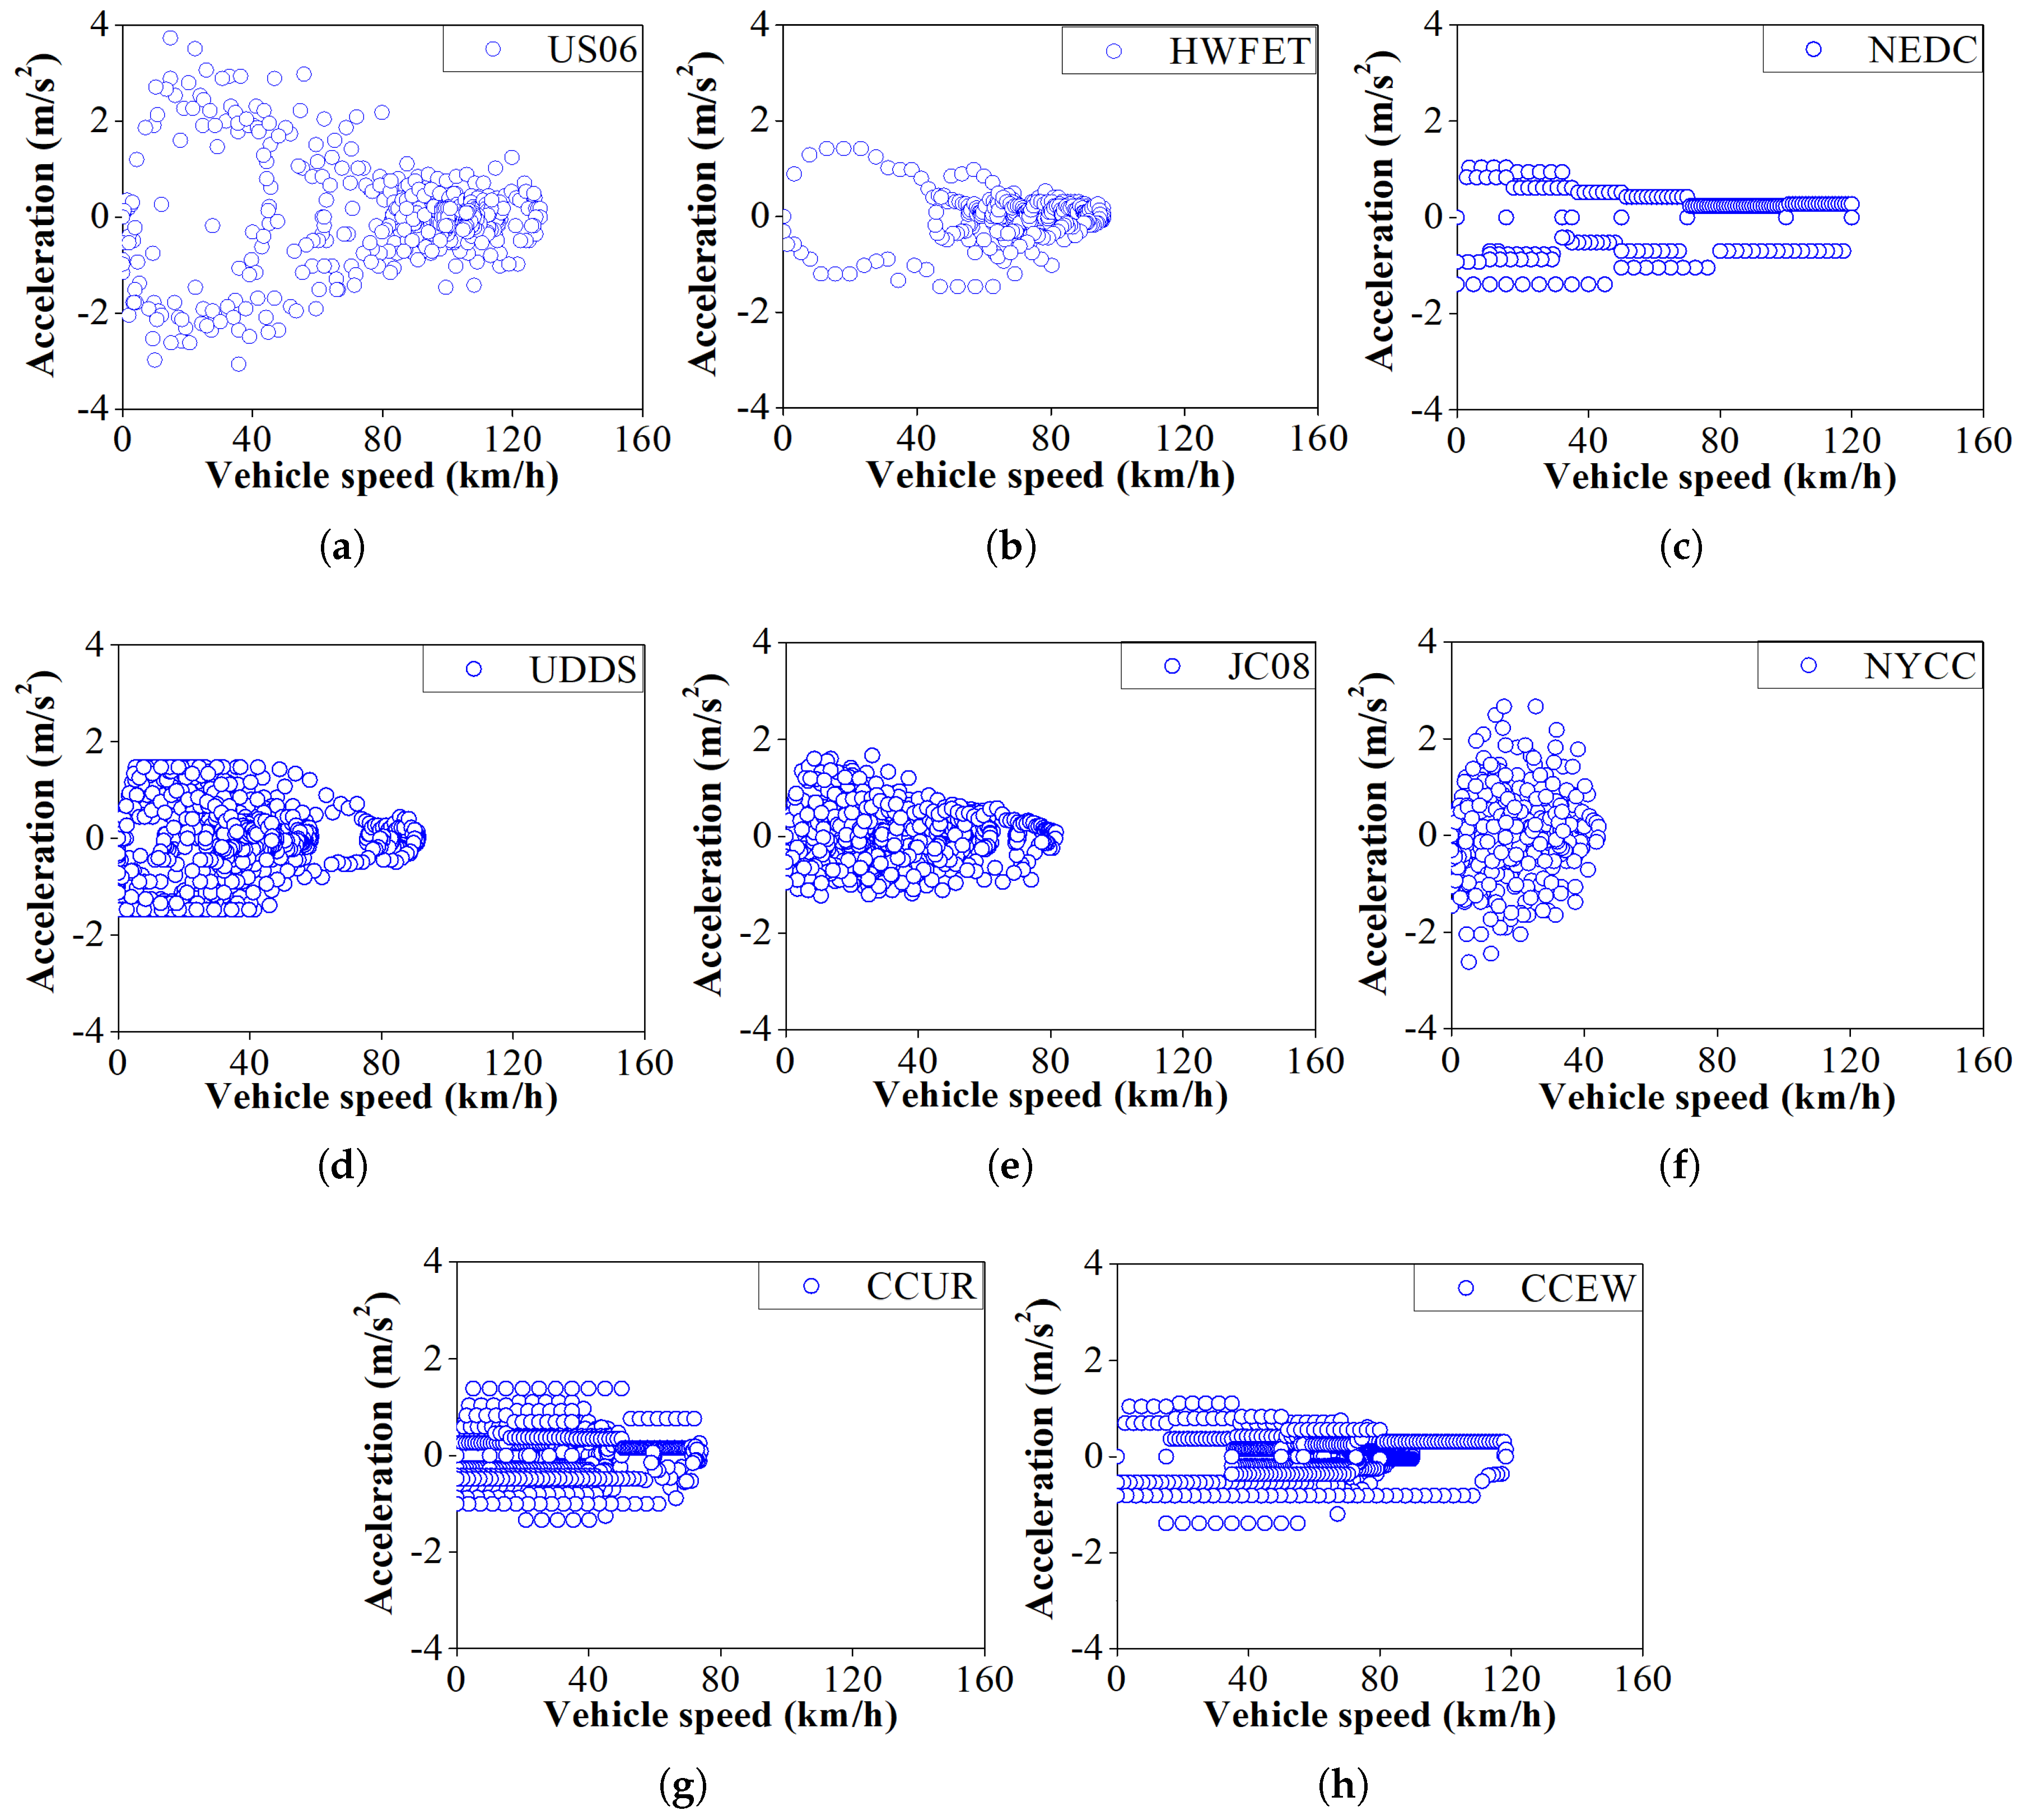
2.4. Description of Driving Cycles
3. Results and Discussion
4. Conclusions
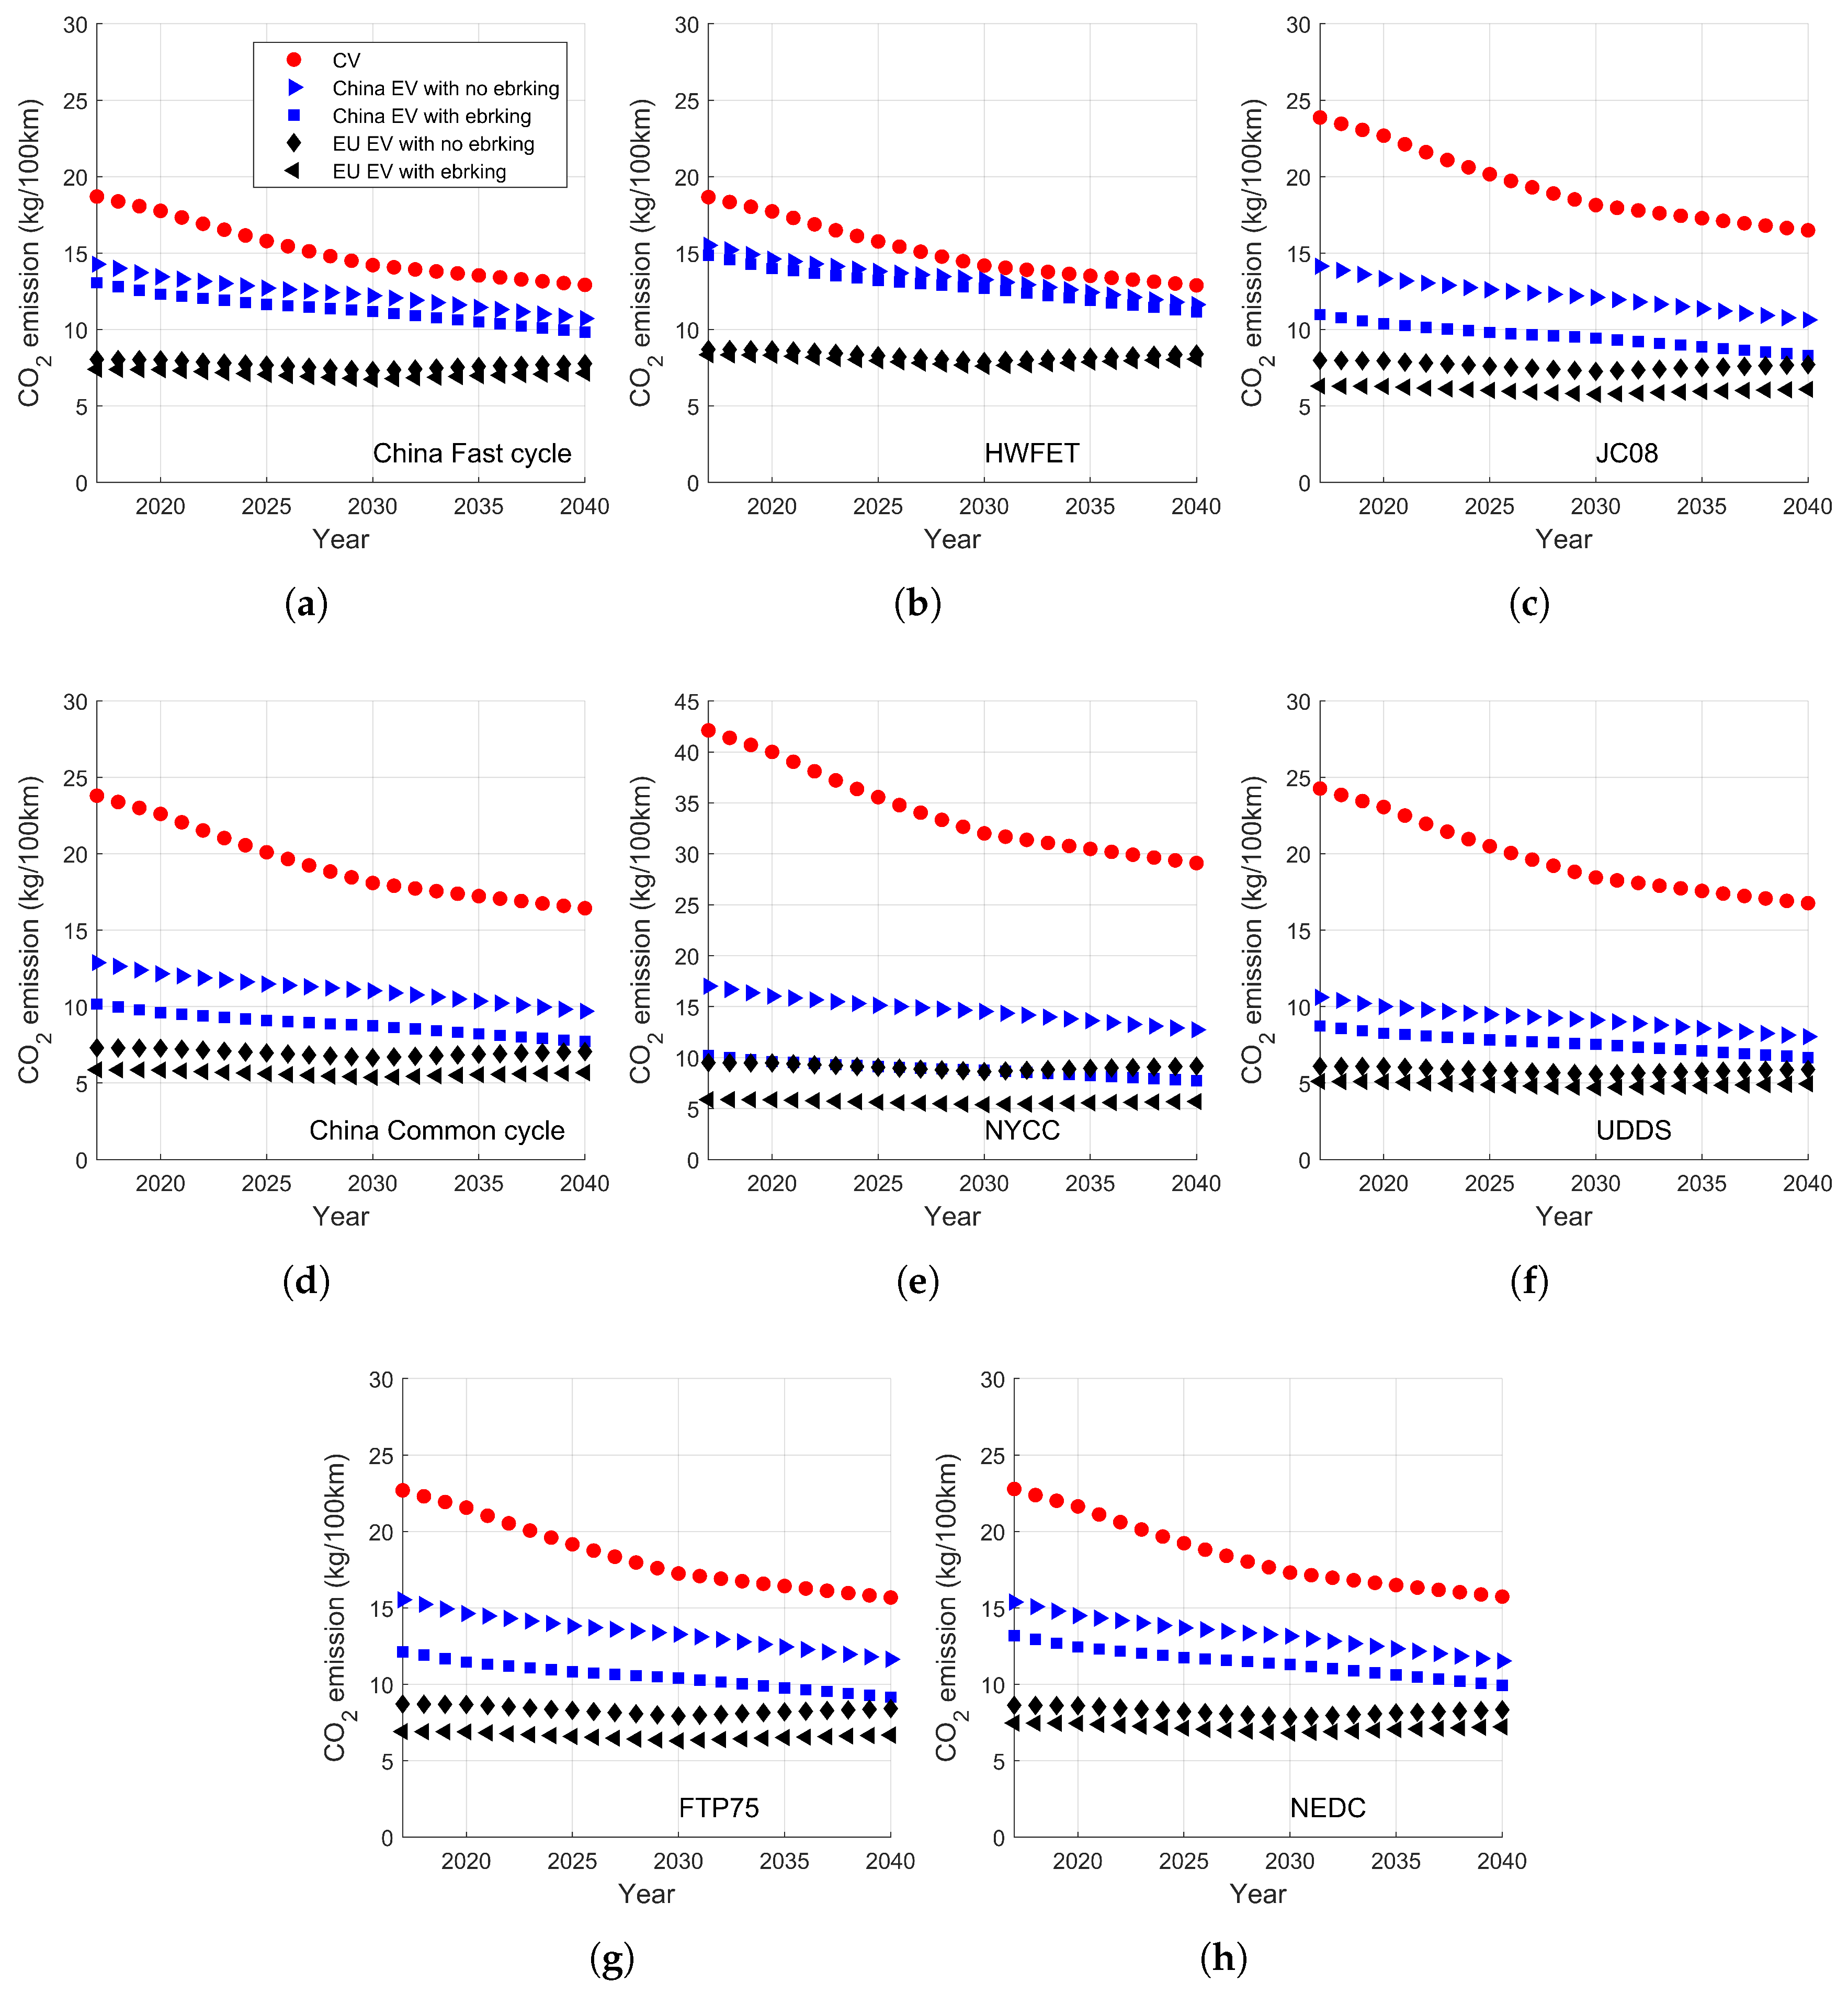
- The CO2 emission decreases over the years for both CVs and EVs, due to the increased engine efficiency and increased fraction of renewable energy in the power grid, respectively.
- For all the countries/regions studied, CVs have higher CO2 emission than EVs from year 2018 to 2040.
- For all the countries/regions studied, China has the highest CO2 emission for EVs, followed by Japan, the world average, and the EU. Their differences are determined by CO2 emission of electricity supply chain.
- The difference of CO2 emission from CVs and EVs is smaller under highway conditions, compared with those under urban driving conditions. For instance, the CO2 emission from CVs is 23% higher than that of EVs in China in year 2018, and decreases to 17% in year 2040 for China-fast driving conditions.
- For urban driving conditions, e.g., New York City Cycle, the carbon emission gap between CVs and EVs in China is 59% and 56% in year 2018 and year 2040, respectively. However, electricity regeneration during braking is found to be effective in reducing carbon emission for EVs under urban driving conditions.
Author Contributions
Funding
Conflicts of Interest
Abbreviations
| CVs | Conventional vehicles |
| EVs | Electric vehicles |
| HEV | Hybrid electric vehicle |
| PHEV | Plug-in hybrid electric vehicle |
| HWFET | High way fuel economy test |
| UDDS | Urban dynamometer driving schedule |
| NYCC | New York city cycle |
| NEDC | New European driving cycle |
| CCUR | Chinese city driving cycle for urban road |
| CCEW | Chinese city driving cycle for express way |
| DCT | Dual clutch transmission |
| SOC | State of charge |
| ebraking | Electricity regeneration during braking |
References
- O’Neill, B.C.; Oppenheimer, M. Dangerous climate impacts and the kyoto protocol. Science 2008, 296, 1971–1972. [Google Scholar] [CrossRef]
- Klein, R.J. Identifying countries that are particularly vulnerable to the adverse effects of climate change: An academic or a political challenge? CCRC 2009, 3, 284–291. [Google Scholar] [CrossRef]
- Takeshita, T. Assessing the co-benefits of CO2 mitigation on air pollutants emissions from road vehicles. Appl. Energy 2012, 97, 225–237. [Google Scholar] [CrossRef]
- Rogelj, J.; Elzen, M.D.; Höhne, N.; Fransen, T.; Fekete, H.; Winkler, H.; Schaeffer, R.; Sha, F.; Riahi, K.; Meinshausen, M. Paris Agreement climate proposals need a boost to keep warming well below 2 °C. Nature 2016, 534, 631–639. [Google Scholar] [CrossRef]
- United Nations. Paris Agreement; United Nations: New York, NY, USA, 2015. [Google Scholar]
- Hoffert, M.I.; Caldeira, K.; Benford, G.; Criswell, D.R.; Green, C.; Herzog, H.; Jain, A.K.; Kheshgi, H.S.; Lackner, K.S.; Lewis, J.S.; et al. Advanced technology paths to global climate stability: Energy for a greenhouse planet. Science 2002, 398, 981–987. [Google Scholar] [CrossRef]
- International Energy Outlook 2017; U.S. Energy Information Administration: Washington, DC, USA, 2017.
- Wang, D.; Zamel, N.; Jiao, K.; Zhou, Y.; Yu, S.; Du, Q.; Yin, Y. Life cycle analysis of internal combustion engine, electric and fuel cell vehicles for China. Energy 2013, 59, 402–412. [Google Scholar] [CrossRef]
- Bitonto, S.; Rico, T. Electromobility in Germany: Vision 2020 and Beyond; Gremany Trade & Invest: Berlin, Germany, 2015. [Google Scholar]
- Lin, B.; Ouyang, X. Energy demand in China: Comparison of characteristics between the US and China in rapid urbanization stage. Energy Convers. Manag. 2014, 79, 128–139. [Google Scholar] [CrossRef]
- Hu, X.; Chang, S.; Li, J.; Qin, Y. Energy for sustainable road transportation in China: Challenges, initiatives and policy implications. Energy 2010, 35, 4289–4301. [Google Scholar] [CrossRef]
- Wang, Z.; Jin, Y.; Wang, M.; Wu, W. New fuel consumption standards for Chinese passenger vehicles and their effects on reductions of oil use and CO2 emissions of the Chinese passenger vehicle fleet. Energy Policy 2010, 38, 5242–5250. [Google Scholar] [CrossRef]
- Hao, H.; Ou, X.; Du, J.; Wang, H.; Ouyang, M. China’s electric vehicle subsidy scheme: Rationale and impacts. Energy Policy 2014, 73, 722–732. [Google Scholar] [CrossRef]
- Hao, H.; Wang, H.; Ouyang, M. Comparison of policies on vehicle ownership and use between Beijing and Shanghai and their impacts on fuel consumption by passenger vehicles. Energy Policy 2011, 39, 1016–1021. [Google Scholar] [CrossRef]
- Howey, D.A.; Martinez-Botas, R.F.; Cussons, B.; Lytton, L. Comparative measurements of the energy consumption of 51 electric, hybrid and internal combustion engine vehicles. Transp. Res. Part D 2011, 16, 459–464. [Google Scholar] [CrossRef] [Green Version]
- Chan, Q.N.; Fattah, I.M.R.; Zhai, G.; Yip, H.L.; Chen, T.B.Y.; Yuen, A.C.Y.; Yang, W.; Wehrfritz, A.; Dong, X.; Kook, S.; et al. Color-ratio pyrometry methods for flame–wall impingement study. J. Energy Inst. 2018, in press. [Google Scholar] [CrossRef]
- Ming, C.; Fattah, I.M.R.; Chan, Q.N.; Pham, P.X.; Medwell, P.R.; Kook, S.; Yeoh, G.H.; Hawkes, E.R.; Masri, A.R. Combustion characterization of waste cooking oil and canola oil based biodiesels under simulated engine conditions. Fuel 2018, 224, 167–177. [Google Scholar] [CrossRef]
- Fattah, I.M.R.; Ming, C.; Chan, Q.N.; Wehrfritz, A.; Pham, P.X.; Yang, W.; Kook, S.; Medwell, P.R.; Yeoh, G.H.; Hawkes, E.R.; et al. Spray and combustion investigation of post injections under low-temperature combustion conditions with biodiesel. Energy Fuels 2018, 8727–8742, 167–177. [Google Scholar] [CrossRef]
- Sullivan, J.L.; Hu, J. Life Cycle Energy Analysis for Automobiles; SAE Technical Paper No. 951829; SAE International: Warrendale, PA, USA, 1995. [Google Scholar]
- Samaras, C.; Meisterling, K. Life cycle assessment of greenhouse gas emissions from plug-in hybrid vehicles: Implications for policy. Environ. Sci. Technol. 2008, 42, 3170–3176. [Google Scholar] [CrossRef]
- Hao, H.; Wang, H.; Ouyang, M. Fuel conservation and GHG (greenhouse gas) emissions mitigation scenarios for China’s passenger vehicle fleet. Energy 2011, 36, 6520–6528. [Google Scholar] [CrossRef]
- Peng, B.; Fan, Y.; Xu, J. Integrated assessment of energy efficiency technologies and CO2 abatement cost curves in China’s road passenger car sector. Energy Convers. Manag. 2016, 109, 195–212. [Google Scholar] [CrossRef]
- Plotkin, S.; Singh, M.; Patterson, P.; Ward, J.; Wood, F.; Kydes, N.; Holte, J.; Moore, J.; Miller, G.; Das, S.; et al. Multi-Path Transportation Futures Study: Vehicle Characterization and Scenario Analyses: Main Text and Appendices A, B, C, D, and F; Argonne National Laboratory: Argonne, IL, USA, 2009.
- Dynamometer Drive Schedules. Available online: https://www.epa.gov/vehicle-and-fuel-emissions-testing/dynamometer-drive-schedules (accessed on 15 February 2019).
- City Driving Cycle for Vehicle Testing; National Development and Reform Commission of the People’s Republic of China: Beijing, China, 2006.
- Bao, Y.; Chan, Q.N.; Kook, S.; Hawkes, E. Spray penetrations of ethanol, gasoline and iso-octane in an optically accessible spark-ignition direct-injection engine. SAE Int. J. Fuels Lubr. 2014, 7, 1010–1026. [Google Scholar] [CrossRef]
- Zhao, F.; Lai, M.C.; Harrington, D.L. Automotive spark-ignited direct-injection gasoline engines. Prog. Energy Combust. Sci. 1999, 25, 437–562. [Google Scholar] [CrossRef]
- Chan, Q.N.; Bao, Y.; Kook, S. Effects of injection pressure on the structural transformation of flash-boiling sprays of gasoline and ethanol in a spark-ignition direct-injection (SIDI) engine. Fuel 2014, 130, 228–240. [Google Scholar] [CrossRef]
- Yang, J.; Xu, M.; Hung, D.L.S.; Wu, Q.; Dong, X. Influence of swirl ratio on fuel distribution and cyclic variation under flash boiling conditions in a spark ignition direct injection gasoline engine. Energy Convers. Manag. 2017, 138, 565–576. [Google Scholar] [CrossRef]
- Yang, J.; Dong, X.; Wu, Q.; Xu, M. Influence of flash boiling spray on the combustion characteristics of a spark-ignition direct-injection optical engine under cold start. Combust. Flame 2018, 188, 66–76. [Google Scholar] [CrossRef]
- Hitomi, M. Our Direction for ICE; The Japan Society of Mechanical Engineers: Tokyo, Japan, 2017. [Google Scholar]
- Weng, S. “Jieneng Yu Xin Nengyuan Qiche Jishu Luxiantu” Zhengshi Fabu. Qiche Yu Peijian 2016, 46, 30–31. [Google Scholar]
- Whitefoot, J.W.; Ahn, K.; Papalambros, P.Y. The case for urban vehicles: Powertrain optimization of a power-split hybrid for fuel economy on multiple drive cycles. In Proceedings of the ASME 2010 International Design Engineering Technical Conferences & Computers and Information in Engineering Conference, Montreal, QC, Canada, 15–18 August 2010. [Google Scholar]
- The Potential Impact of Electric Vehicles on Global Energy Systems; McKinsey & Co.: New York, NY, USA, 2018.


| Number | HEV Working Mode | Specifications |
|---|---|---|
| 1 | veh_stop | Vehicle stops with engine and motor turned off |
| 2 | idle_nocharging | Idle condition for engine, no charging to battery |
| 3 | idle_charging | Idle condition for engine, charging to battery |
| 4 | brk_disableebrking | Mechanical brake |
| 5 | brk_enableebrking | Wheels drive motor to regenerate power, with mechanical brake being the assistance |
| 6 | cruise | Neither engine nor motor provides torque, the vehicle decelerates due to resistance |
| 7 | eDrive | The required torque was provided by motor only |
| 8 | LPM charging | The required torque was provided by engine, the engine works in optimized conditions, while the motor is charging the battery |
| 9 | eBoost | The required torque was provided by both engine and motor, the engine is working in optimized conditions, while the motor is charging the battery |
| 10 | ice_alone | The required torque was provided by engine only |
| CV | P2 HEV | |
|---|---|---|
| Start SOC | 70.0 | 63.0 |
| End SOC | 70.0 | 64.5 |
| Working modes experienced | 1, 2, 4, 10 | 1, 2, 5, 7, 8, 10 |
| Gasoline consumption (L/100km) | 9.733 | 6.975 |
| Deviation between the simulation and experiments | < 3% | < 3% |
© 2019 by the authors. Licensee MDPI, Basel, Switzerland. This article is an open access article distributed under the terms and conditions of the Creative Commons Attribution (CC BY) license (http://creativecommons.org/licenses/by/4.0/).
Share and Cite
Dong, X.; Wang, B.; Yip, H.L.; Chan, Q.N. CO2 Emission of Electric and Gasoline Vehicles under Various Road Conditions for China, Japan, Europe and World Average—Prediction through Year 2040. Appl. Sci. 2019, 9, 2295. https://doi.org/10.3390/app9112295
Dong X, Wang B, Yip HL, Chan QN. CO2 Emission of Electric and Gasoline Vehicles under Various Road Conditions for China, Japan, Europe and World Average—Prediction through Year 2040. Applied Sciences. 2019; 9(11):2295. https://doi.org/10.3390/app9112295
Chicago/Turabian StyleDong, Xue, Bin Wang, Ho Lung Yip, and Qing Nian Chan. 2019. "CO2 Emission of Electric and Gasoline Vehicles under Various Road Conditions for China, Japan, Europe and World Average—Prediction through Year 2040" Applied Sciences 9, no. 11: 2295. https://doi.org/10.3390/app9112295