Modeling and Analysis of High-Power Ti:sapphire Laser Amplifiers–A Review


1
Global Green Research and Development Center, Handong Global University, Pohang 37554, Korea
2
Department of Advanced Green Energy and Environment, Handong Global University, Pohang 37554, Korea
*
Author to whom correspondence should be addressed.
†
Current address: SEMES Co. Ltd., Cheonan 31040, Korea.
‡
These authors contributed equally to this work.
Appl. Sci. 2019, 9(12), 2396; https://doi.org/10.3390/app9122396
Submission received: 30 April 2019
/
Revised: 20 May 2019
/
Accepted: 28 May 2019
/
Published: 12 June 2019
(This article belongs to the Special Issue Ultrafast Laser Pulses)
Abstract
:We have introduced several factors that can be useful for the modeling and analysis of high-power Ti:sapphire laser amplifiers. The amplification model includes the phase distortion effect caused by the atomic phase shift (APS) in gain medium and the thermal-induced phase distortion effect caused by the high-average-power amplification. We have provided an accurate amplification model for the development of ultra-high-intensity and high-average-power lasers.
1. Introduction
Owing to features such as excellent thermal conductivity, high mechanical durability, and wide amplification bandwidth, Ti:sapphire is widely used as a medium for high-power chirped pulse amplification (CPA) technology [1,2]. Some researchers from RAL, SIOM, PEARL, Apollon Project, and APRI, ELI, J-KAREN, and Vulcan have previously generated several petawatt (PW) laser pulses and are targeting 10 PW or more [3,4,5,6,7,8,9,10,11]. A high-power laser can be used in applications such as laser–material interaction, particle acceleration, basic research about materials under extreme environments, and medical applications [12,13,14]. In addition, the realization of high-power laser applications will enable the pioneering of new scientific fields [8,15]. However, for using high-power lasers in scientific research and industrial applications, it is essential to have high-power pulses with both a high repetition rate and high spatio-temporal stability for practical applications [16,17]. The simulation model and analysis of the high-power laser amplifier introduced in this review will be useful for the design and development of laser systems.
In this review, the amplification model constructed by L. M. Frantz and J. S. Nodvik has further expanded to model the depletion of the pump energy and to provide an amplified pulse shape simulation [18,19]. In addition, we show how to apply the model to a CPA system and describe the analysis method of the square pump condition, which has attracted the interest of many research institutes in recent years [20]. Furthermore, an interpretation of the phase distortion occurring in the active medium, which has a significant impact on the energy and spatio-temporal shape of the pulse, is also included in this review [21,22]. The phase retardation generated inside a high-power laser medium, particularly in the case of Ti:sapphire, is relatively inadequately researched and is now essentially gaining attention for its effect [23]. We provide a model of the atomic phase shift (APS) and the improved form of the thermal distortion effect. The models introduced in this review are aimed at representing a laser system in a suitable form for the design and maintenance of high-power laser systems. Most of the considerations introduced in this review will be applicable to PW-class laser generators in general, regardless of PW pulses with an ultrashort pulse width (J/fs) or PW pulses with high-pulse-energy (kJ/ps). However, it should be noted that most of the examples used in this review relate to the ulstrashort PW pulse generation using Ti:sapphire as the CPA medium.
2. Amplification Model
2.1. Depletion and Pulse Shape Change
In this section, we describe the fundamental aspects and modeling method of a pulse amplification under the following assumptions: a quasi-monochromatic seed pulse, an initially population-inverted gain medium, an infinitely long fluorescence lifetime, a negligible loss, and a uniform transverse distribution of the pump and seed beam. In the following sections, we will expand the model for broadband chirped seed pulse, pumping during amplification, a finite fluorescence lifetime, and non-uniform beam profiles.
If we ignore the finite fluorescence lifetime and pumping during the amplification process, then the inversion density, , is dependent only on the stimulated emission. The time-dependent rate equation for will be
where , is the degeneracy of the lower and upper energy levels, c is the speed of light, is the emission cross-section, n is the photon density [1] (ch.4.1.1). The photon density increases as photons are generated by the stimulated emission and decreases as the photons flow out of the gain medium. The time-dependent photon-transfer equation [1] (ch.4.1.1) describes the rate of the photon density change as
L. M. Frantz and J. S. Nodvik solved the coupled equations given in Equations (1) and (2) and found a solution, i.e., Equations (3) and (4) [18]. This rate equation approach is valid only for the seed pulses for which the pulse duration is longer than the phase relaxation time of the gain medium [24] (Ch.3.2.2). the typical phase relaxation time of a solid laser medium is – s [24] (Ch.3.1). Therefore, the amplification modeling of a femtosecond pulse by using the Frantz-Nodvik solution is inappropriate. However, most femtosecond amplifiers achieving a high-energy pulse by using the CPA technique will be introduced in more detail in Section 2.2 [25]. A chirped pulse generally has a nanosecond pulse duration. Consequently, the Frantz-Nodvik solution can also be used for most Ti:sapphire laser amplifier modeling.
Equations (3) and (4) are applicable for an arbitrary seed pulse of and an arbitrary initial population inversion distribution of . These above arbitrary seed shape and inversion distribution are the functions for of the longitudinal (propagation) direction, and we will consider the transverse profile of for the seed beam and inversion density in Section 2.4.
If we assume a square seed pulse of duration and a homogeneous initial population inversion distribution, then the photon density equation can be further simplified [18].
where [cm] is the amplitude of the square pulse, [cm] is uniform inversion density, and [cm]. By integrating Equation (5) at the input and output of the gain medium, one can determine the energy gain, , between the seed and amplified pulse.
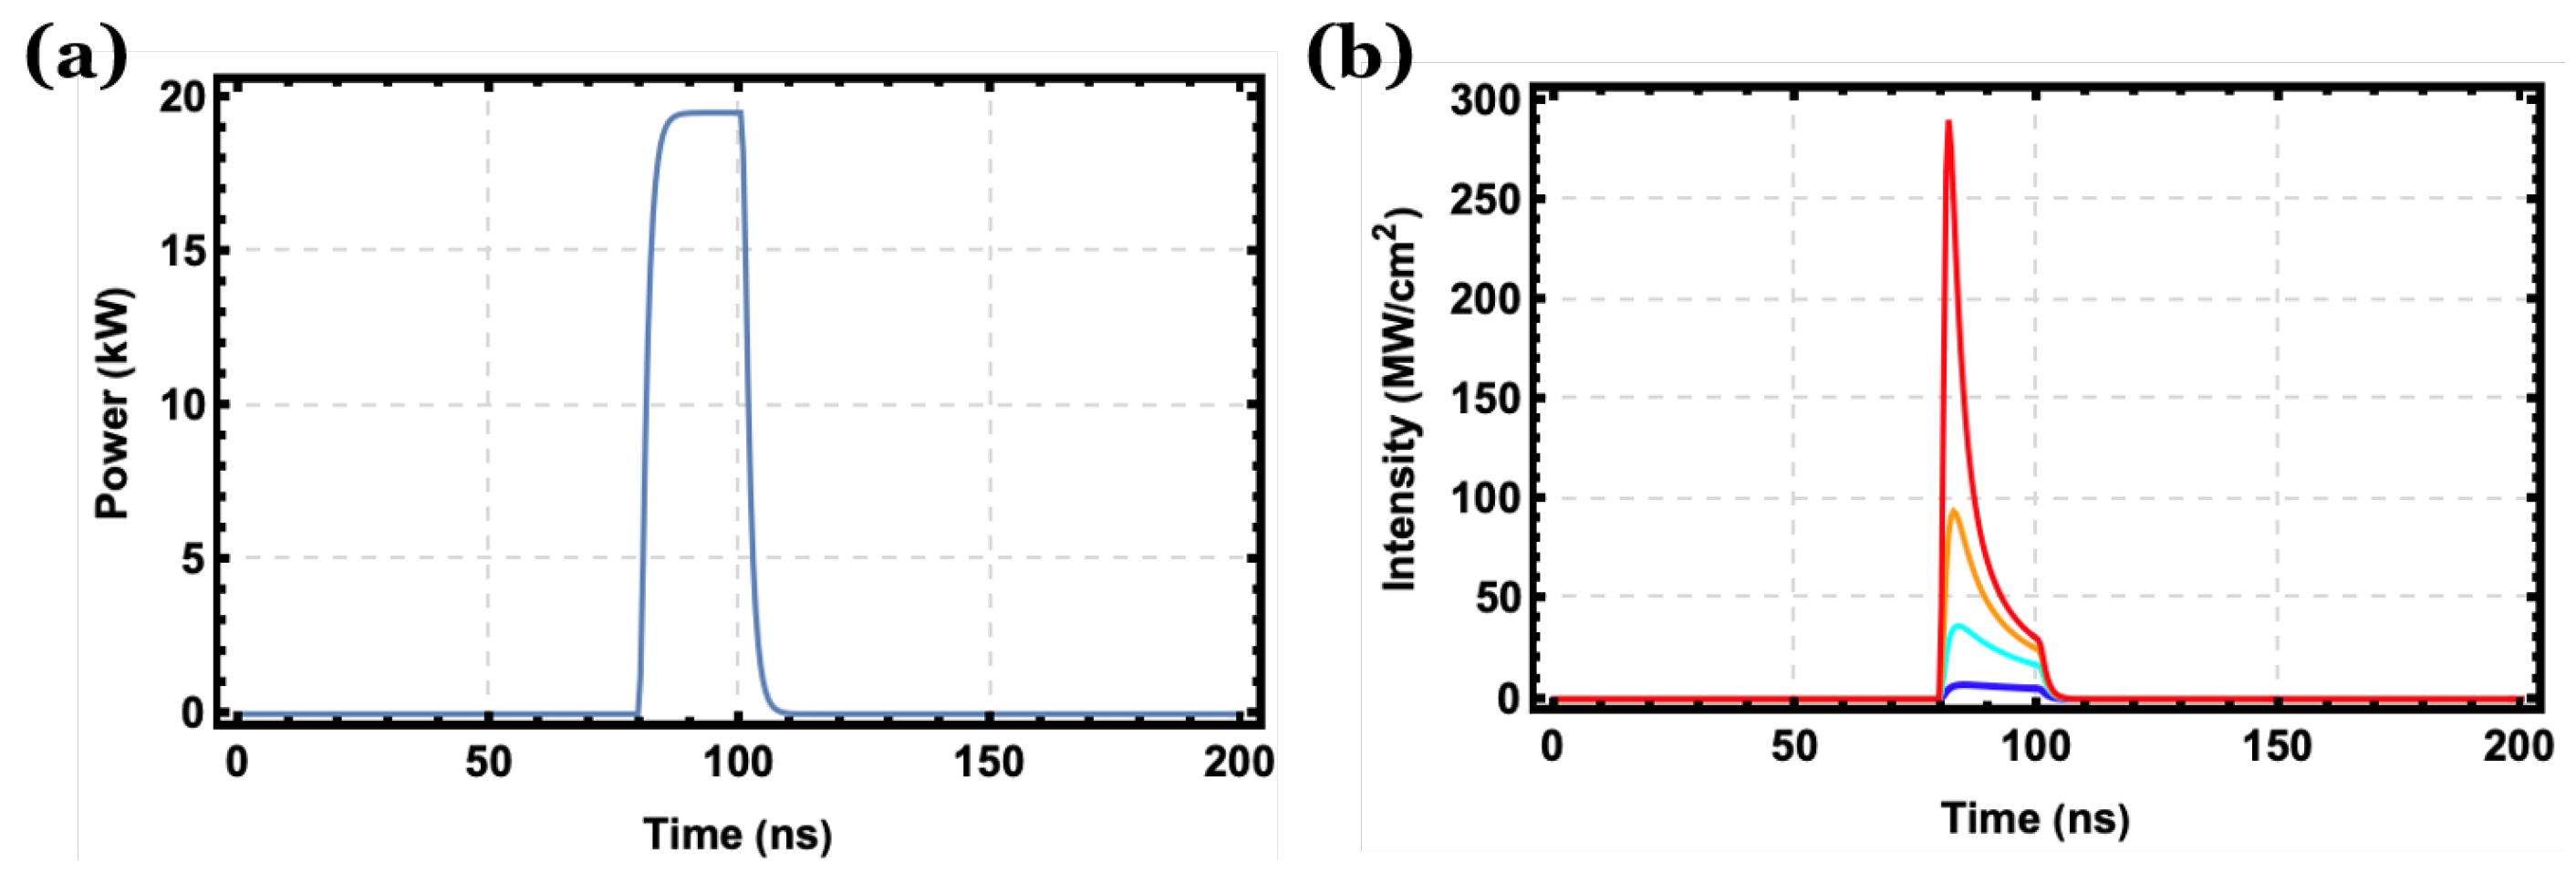
where L is the length of the gain medium. An example of a calculation using Equation (5) is shown in Figure 1. The graph based on Equation (5) shows not only the pulse shape change that is induced by the depletion effect but also the total energy increment. However, as depicted by the blue curve in Figure 2a,b, the more simple and practical energy gain equation given by Equation (6) merely results in an average increment in the pulse energy.
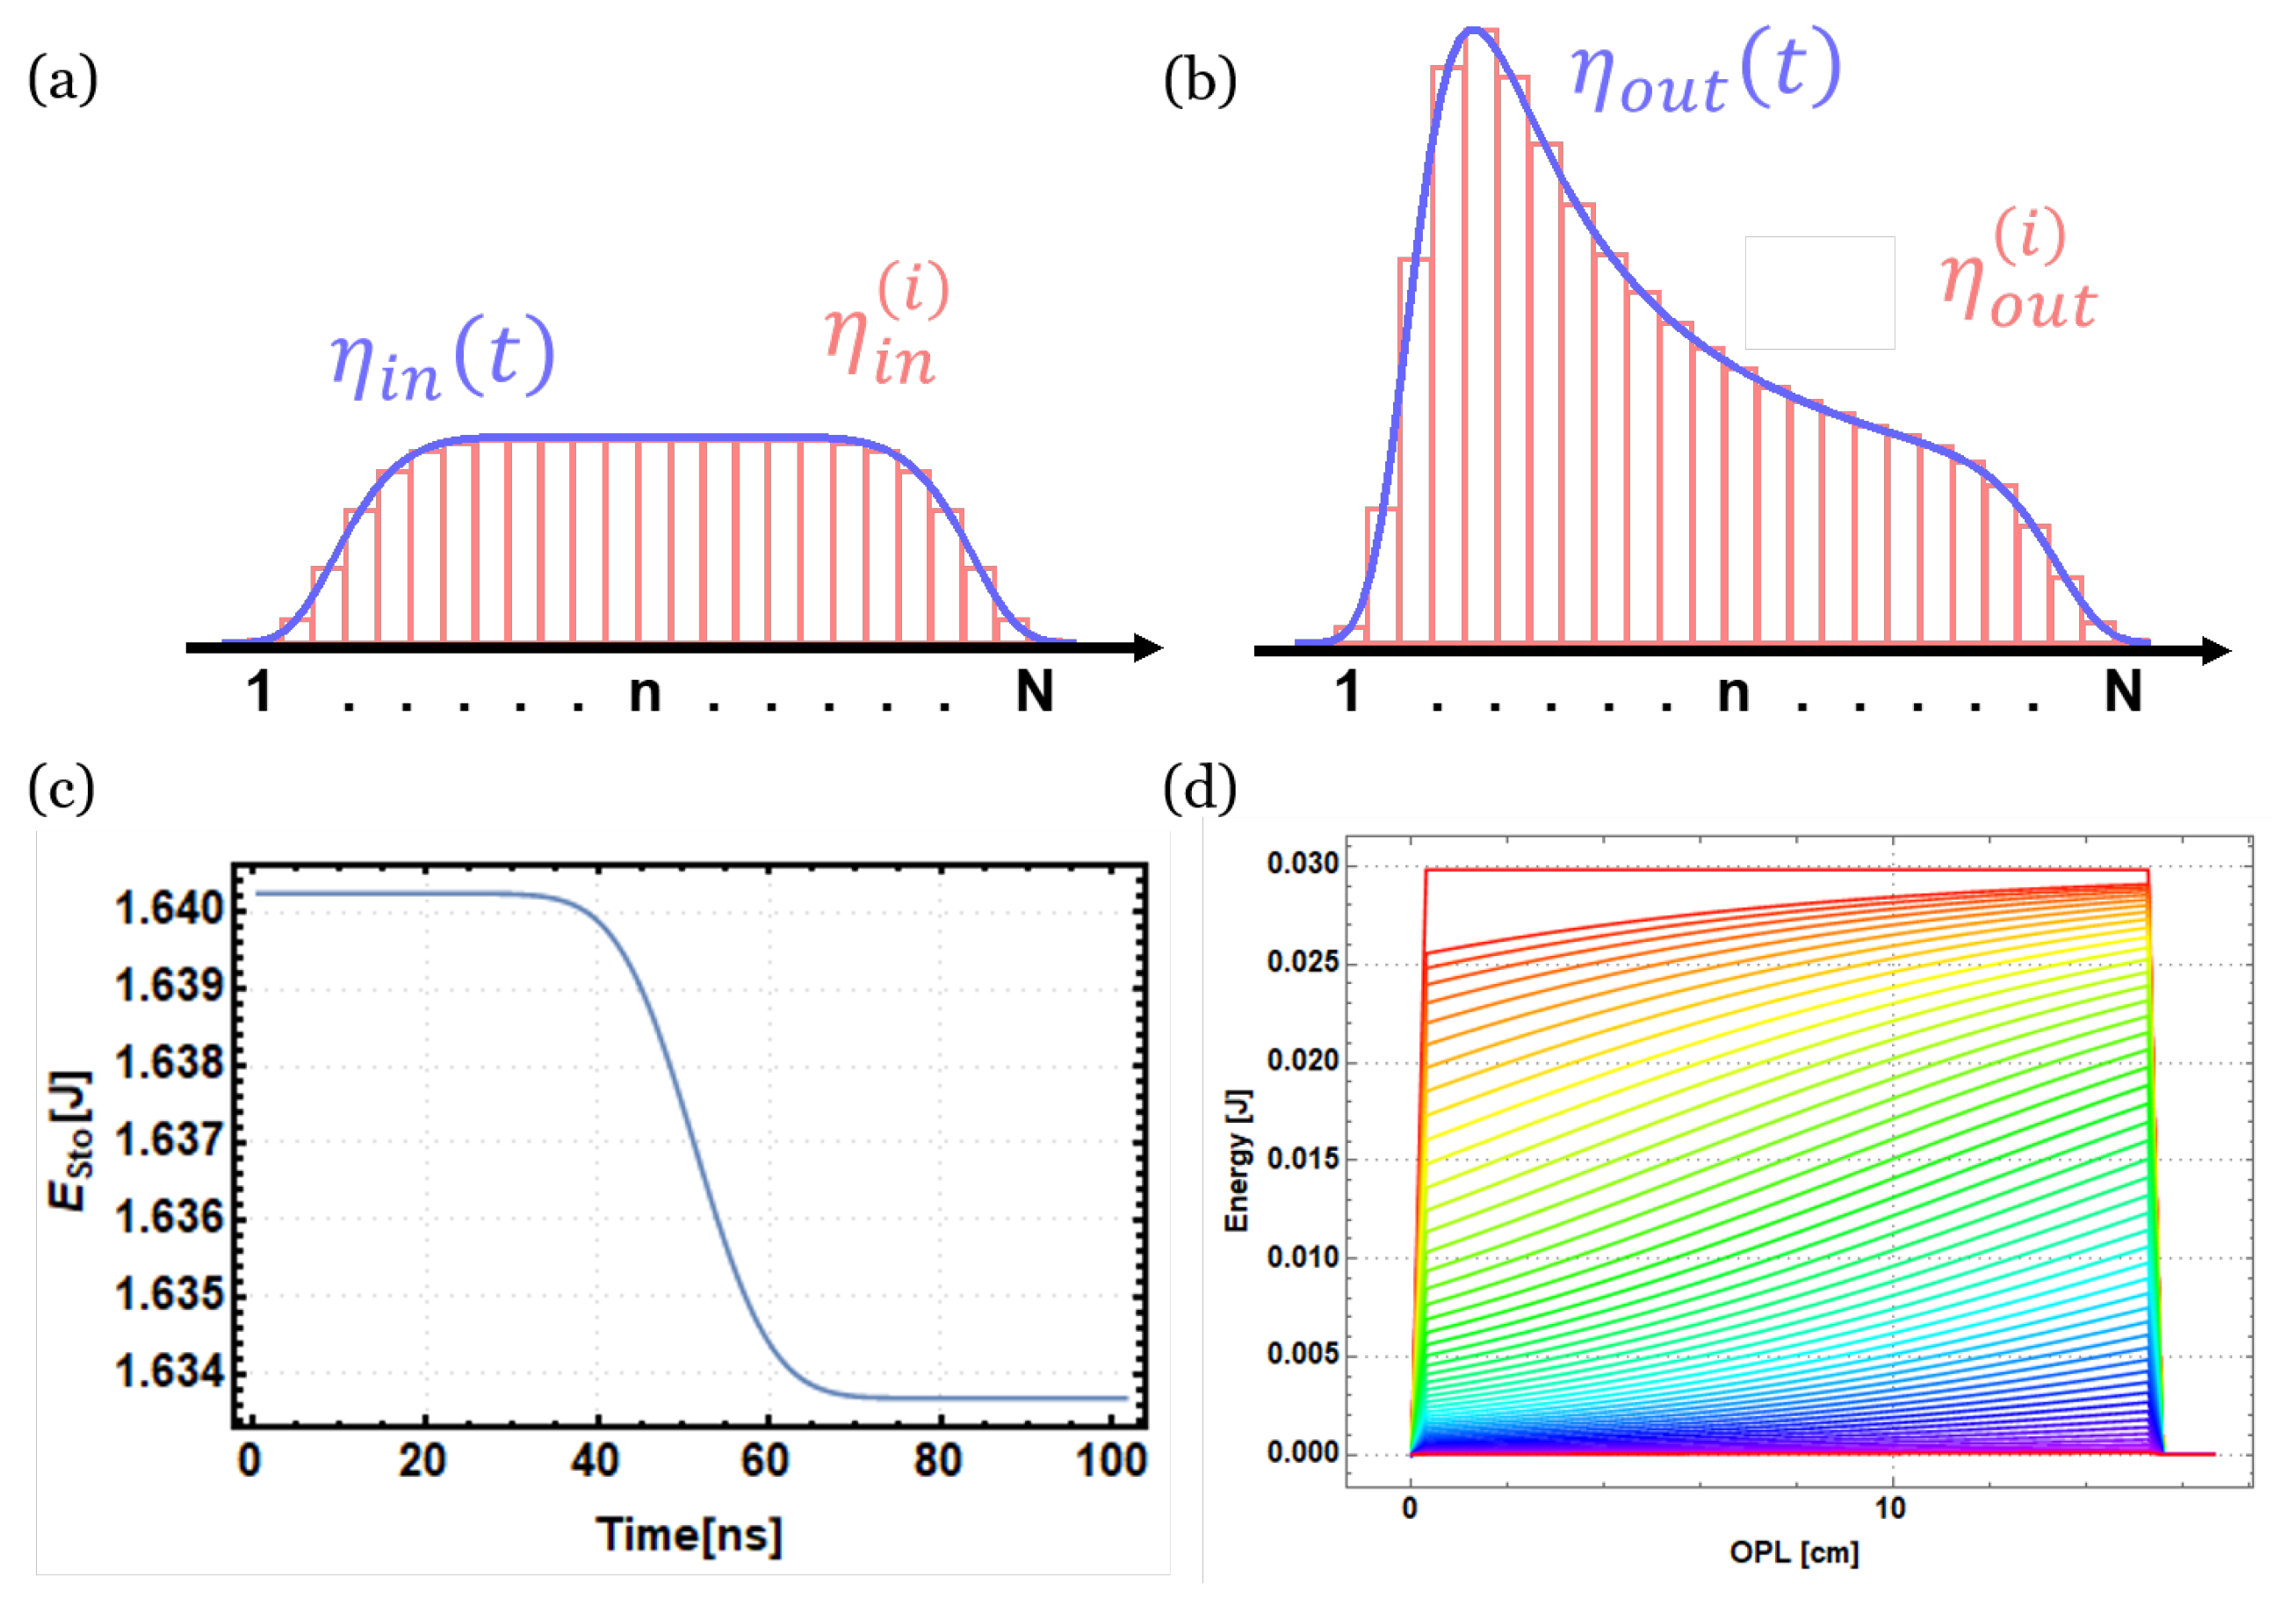
A numerical method that achieves amplification of the pulse shape and energy simultaneously by using the energy gain equation given in Equation (6) is introduced [19]. In this method, as shown in Figure 2a, the input pulse, , is treated as a consecutive train of square-shaped pulses with the same pulse duration but different amplitudes. The amplitude of the i-th square pulse is , where the superscript indicates the sequence of the square pulse, i is an integer larger than one, and is the duration of the small square pulses. In addition, the uniformly distributed inversion density, , is renewed for each square pulse by counting the stimulated emitted photons. The equations for the i-th pulse amplification are
Equation (8) is the energy conservation law in the gain medium.
Example calculation results using Equations (7) and (8) are shown in Figure 2. As shown in Figure 2b, the envelope of the output square pulse train is identical to the calculation result obtained using Equation (3). Although Equation (7) is based on Equation (6), which is derived under the assumption of a square-shaped seed pulse, this numerical method is applicable to an arbitrary input pulse shape as given in Equation (3) because there is no restriction on the envelope shape of the input square pulse train. Furthermore, because the numerical method does not include the integral calculations, which Equation (3) does, the proposed method is more convenient for various complex pulse shapes. Contrastingly, as shown in Figure 2c, the results obtained using Equation (8) exhibit a decrease in the depletion of the inversion density under the assumption of a uniformity in the entire gain medium. To consider an arbitrary inversion density distribution, one can additionally treat the gain medium as a group of consecutive thin mediums. In this case, an additional spatial dimension index, j, can be used for Equations (7) and (8). The initial inversion density of the j-th medium is , where is the thickness of the sliced medium, and . An example of the spatio-temporal depletion calculation result is shown in Figure 2d.
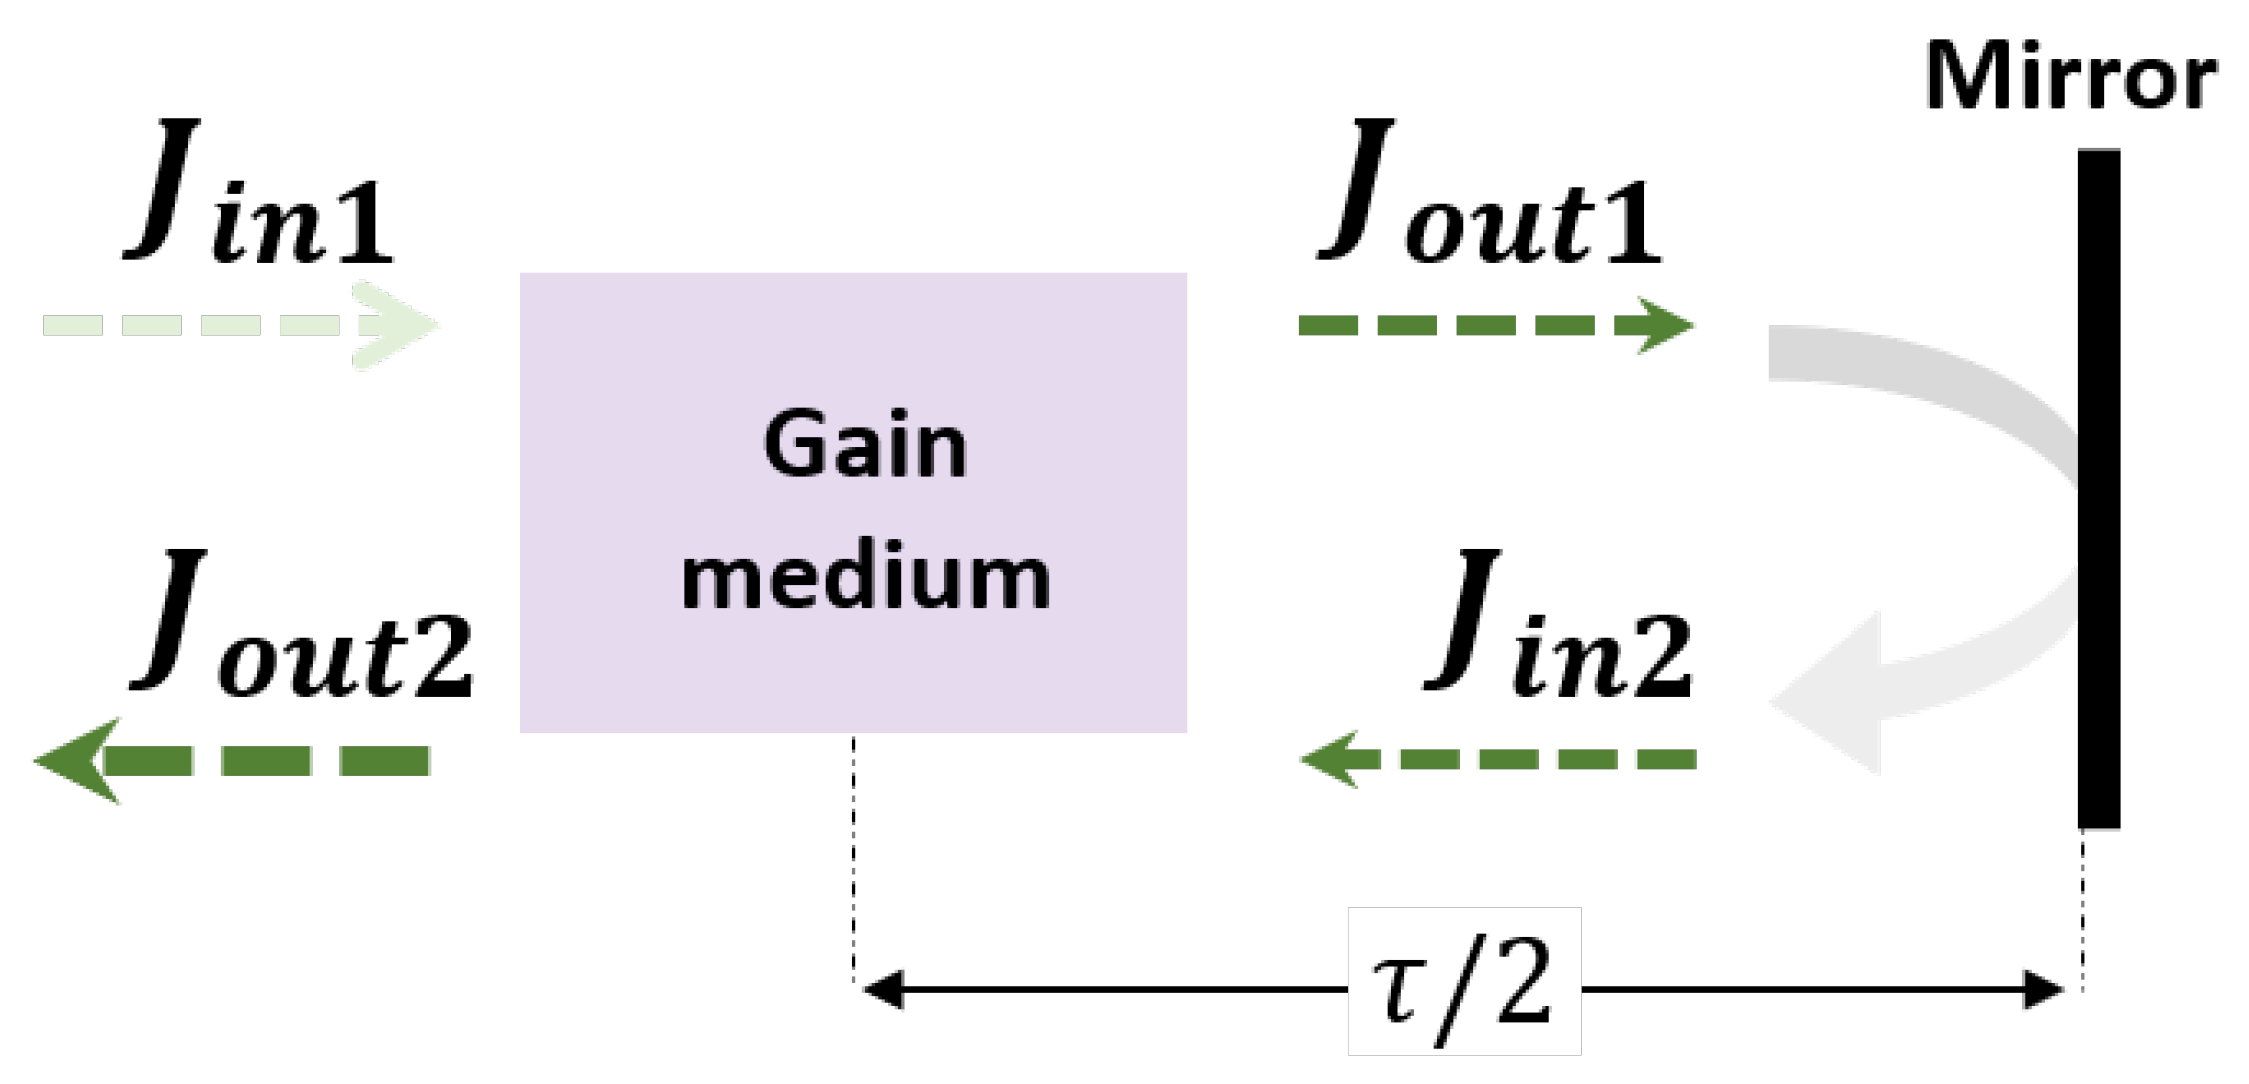
The above-described numerical method is based on the Frantz-Nodvik energy gain equation of Equation (6). There also exist modified Frantz-Nodvik equations for more complex amplifier geometries such as a zig-zag slab [26] and multiple passes in a thin disk [27]. In the case of a double-pass in multiple rod-shaped medium, a modified Frantz-Nodvik equation for two inputs [19] can be used with the above-described numerical method (Figure 3). The modified Equations (7) and (8) for two inputs are
In the next section, we introduce and review the CPA technique and modeling method for the amplification of a chirped seed pulse.
2.2. Amplification of Chirped Pulses
In the previous section, we presented the development of an amplification model under the assumption of a quasi-monochromatic seed pulse. This assumption is valid only when the spectral bandwidth of the seed pulse is much narrower than the gain bandwidth of the medium. The gain bandwidth of Ti:sapphire is 222 nm (FWHM) at room temperature [28,29]. Based on the time-bandwidth product rule [17,25,30], for Gaussian pulses of 100 fs and 10 fs pulse lengths (FWHM), spectral linewidths of at least 9.4 nm and 94 nm are required, respectively. As a femtosecond pulses have a non-negligible spectral bandwidth relative to the gain bandwidth of the Ti:sapphire medium, the amplification model should be improved to avoid using the monochromatic seed pulse assumption.
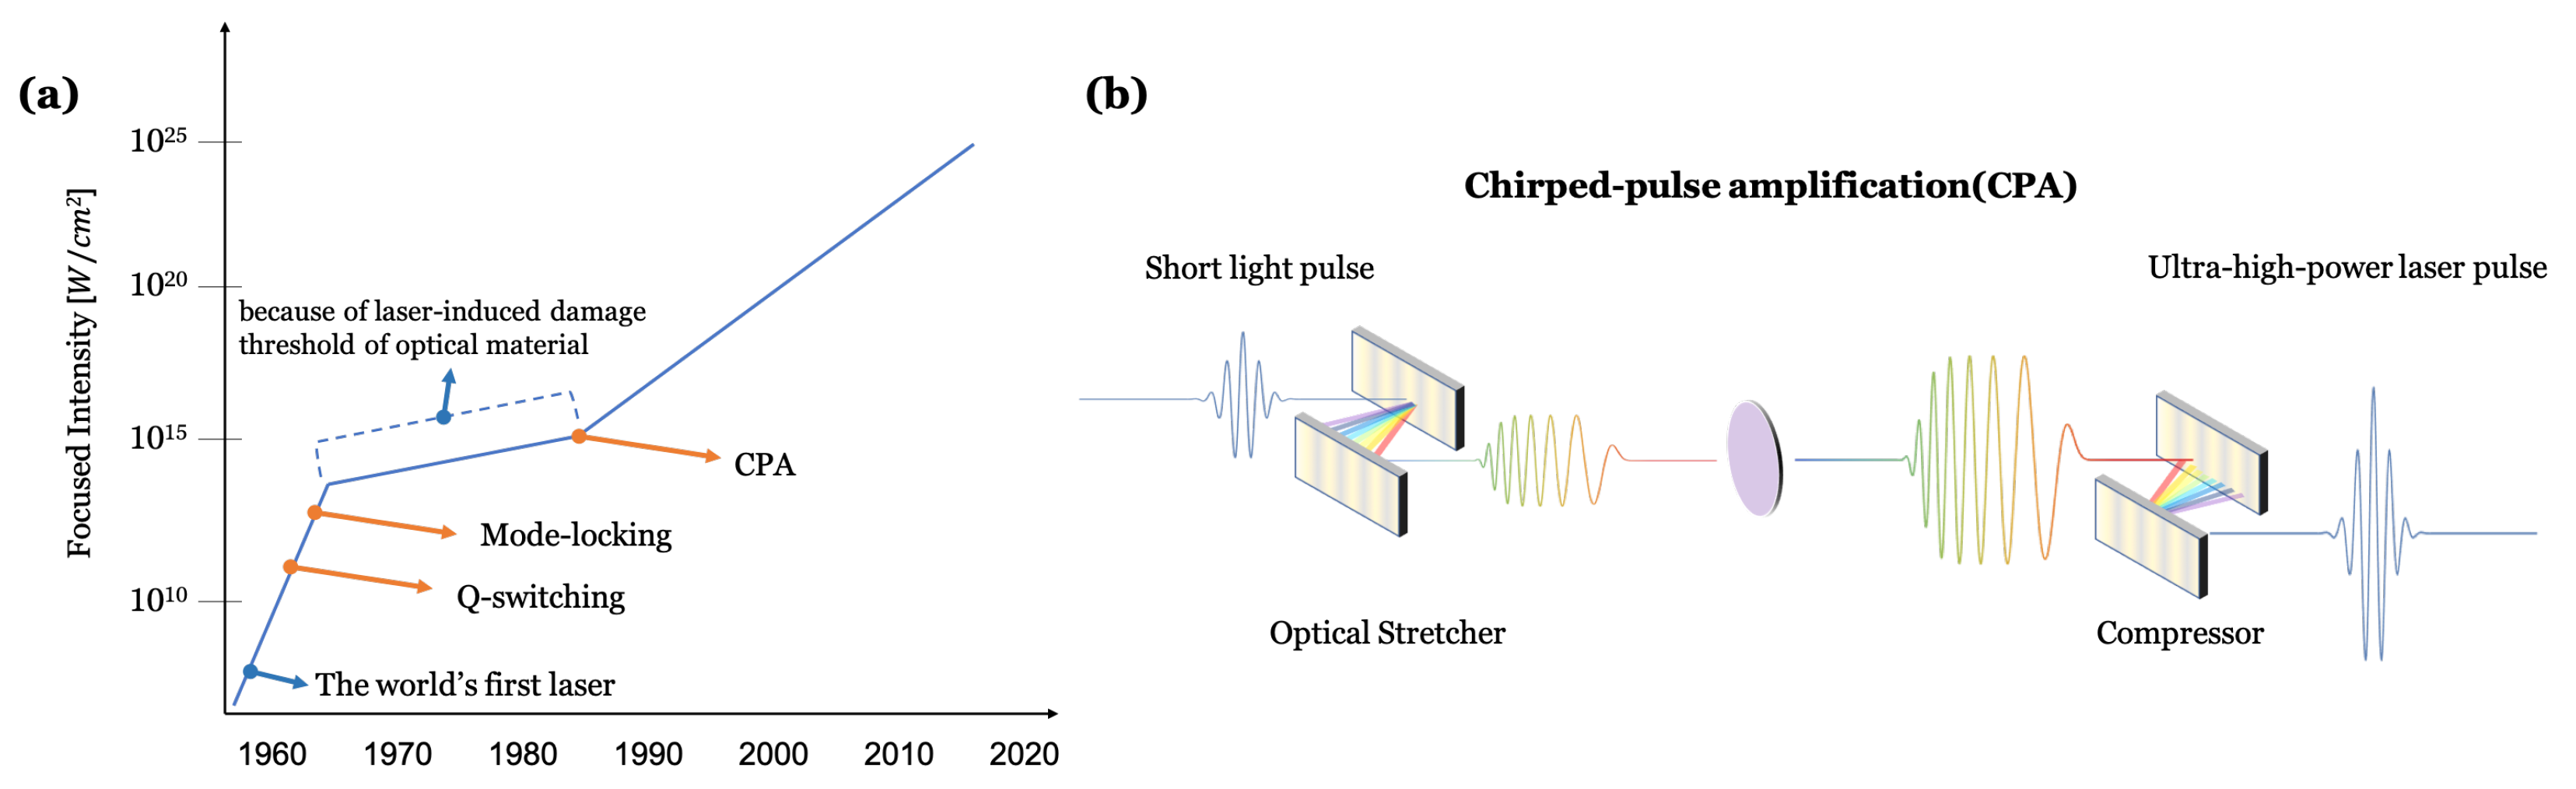
Before describing the amplification model for non-monochromatic pulses, a brief introduction to the ultrashort pulse amplification technique is needed. Because ultrashort pulses have high optical intensity [W/cm], they can easily damage optics residing within the amplifier. Lowering the intensity by expanding the beam size is restrictive because the available sizes of the optical and amplifying media are limited. Therefore, the development of laser intensity was stagnant until a breakthrough was achieved. As can be seen in Figure 4, this breakthrough was the CPA technique [25]. As depicted in Figure 4, in a CPA system, to lower the optical intensity during the amplification process, the pulse duration before the amplification is increased and the amplified pulse is recompressed. In 2018, the first demonstrators of the CPA technique were awarded the Nobel prize [31]. The CPA technique has been used in various spectral phase manipulation devices to control the temporal width of the pulse. In the first demonstration of the CPA technique [25], an optical fiber and Treacy type compressor [32] were used as the stretcher and compressor pair. Subsequently, the fiber stretcher was replaced by Martinez’s stretcher [33] to compensate for the third-order dispersion and by a lens-less Öffner type stretcher to avoid aberrations [34,35]. In addition to the stretcher and compressor pair, various dispersion control methods have been developed [36,37,38,39].
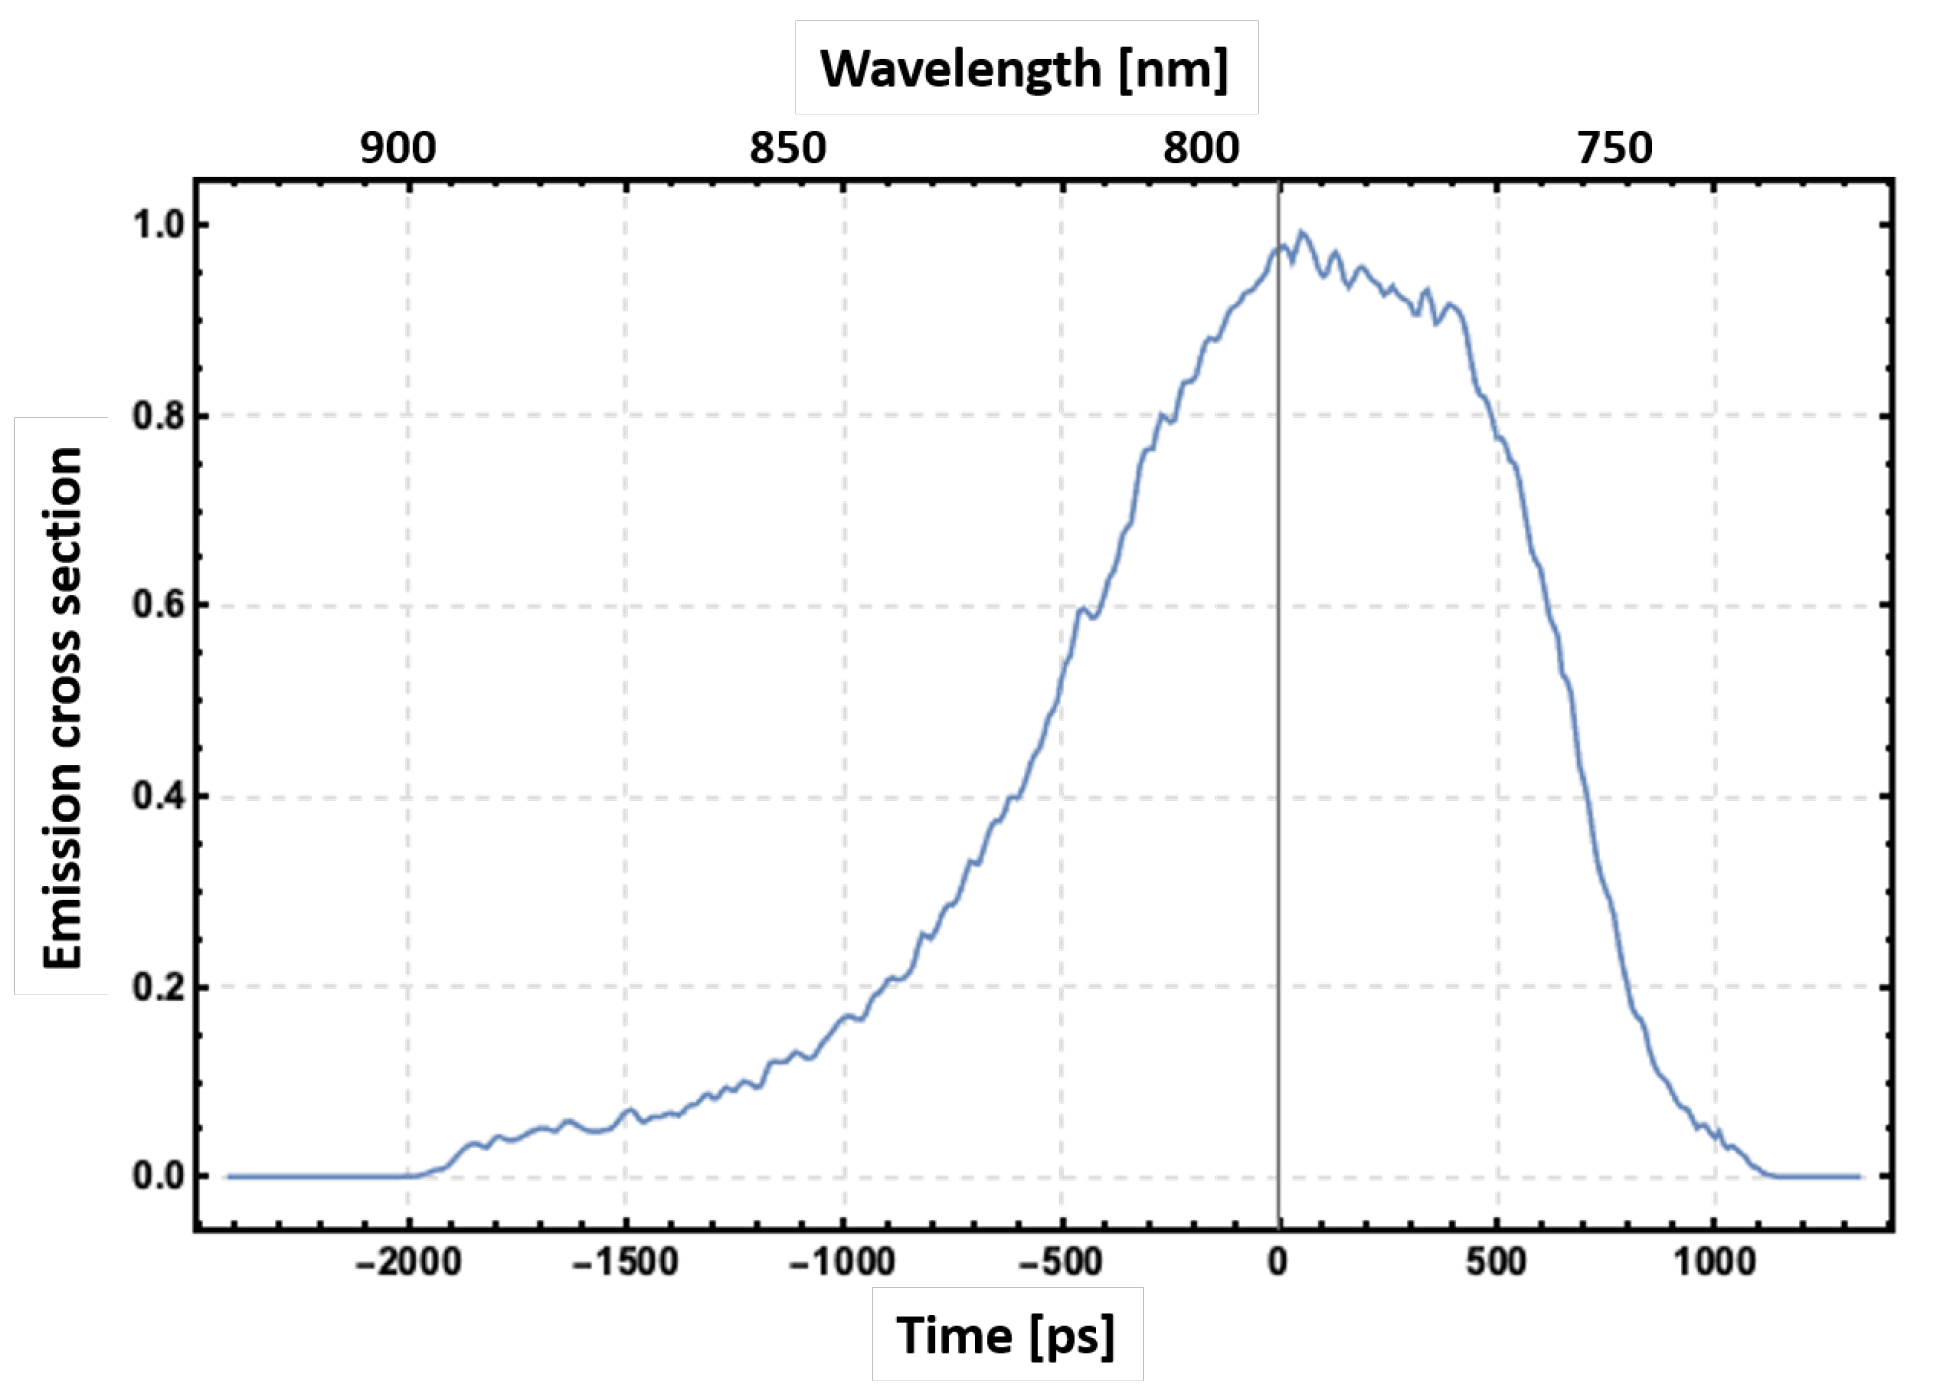
As the CPA technique is commonly used for the amplification of an ultrashort pulse in a Ti:sapphire medium, the wavelength, , of the simulation model should be considered as a function of time. In addition, the emission cross-section, , should be a function of the wavelength, , because an ultrashort pulse has a non-negligible spectral bandwidth. Consequently, the emission cross-section becomes a function of time, as represented in Figure 5 and Equation (12).
The spectral emission cross-section, , can be obtained from a fluorescence spectrum measurement and the McCumber theory [28,41], and an example with Ti:sapphire is shown in Figure 5. The time-dependent wavelength, , depends on the structure and configuration of the stretcher and can be calculated by using a wavelength-dependent group delay function.
where c is the speed of light and is the spectral phase of the stretcher. The amplification calculation for a chirped seed pulse, where the cross-section is a variable of time, can be achieved by adding a discretized time index, , to in Equation (7). By using Equation (12), the time-indexed emission cross-section is defined as , and the modified numerical Frantz-Nodvik equation for the chirped seed pulse becomes
In the previous section, we also introduced a modified numerical Frantz-Nodvik equation that can be used for the amplification of two simultaneous inputs. Another variation of the numerical equation is reported for two inputs with different carrier frequencies [42]. In this case, the effective saturation photon fluence, [cm], is defined as
where are the two inputs with different carrier frequencies and are the emission cross-sections corresponding to the two input frequencies,
In the next section, the effects of an instantaneous pumping and a finite fluorescence lifetime, which were ignored until now, are considered.
2.3. Pumping and Spontaneous Emission
As described in Section 2.1, the Frantz-Nodvik equation is derived under the assumption of an initial population-inverted gain medium [18]. In addition, the stimulated emission is considered as the only process that induces the depopulation of the inversion. Specifically, in the original Frantz-Nodvik calculation, the effects of instantaneous pumping and spontaneous emission during the pulse amplification process are ignored. However, instantaneous pumping or a spontaneous emission is ignorable only when the seed pulse duration is much shorter than the pump pulse duration or the fluorescence lifetime of the gain medium, respectively.
To consider the instantaneous pumping and a spontaneous emission into account in the amplification calculation, one should add the two terms representing pumping and emission in the coupled energy conservation equation, Equation (8). The modified result is Equation (18) [43].
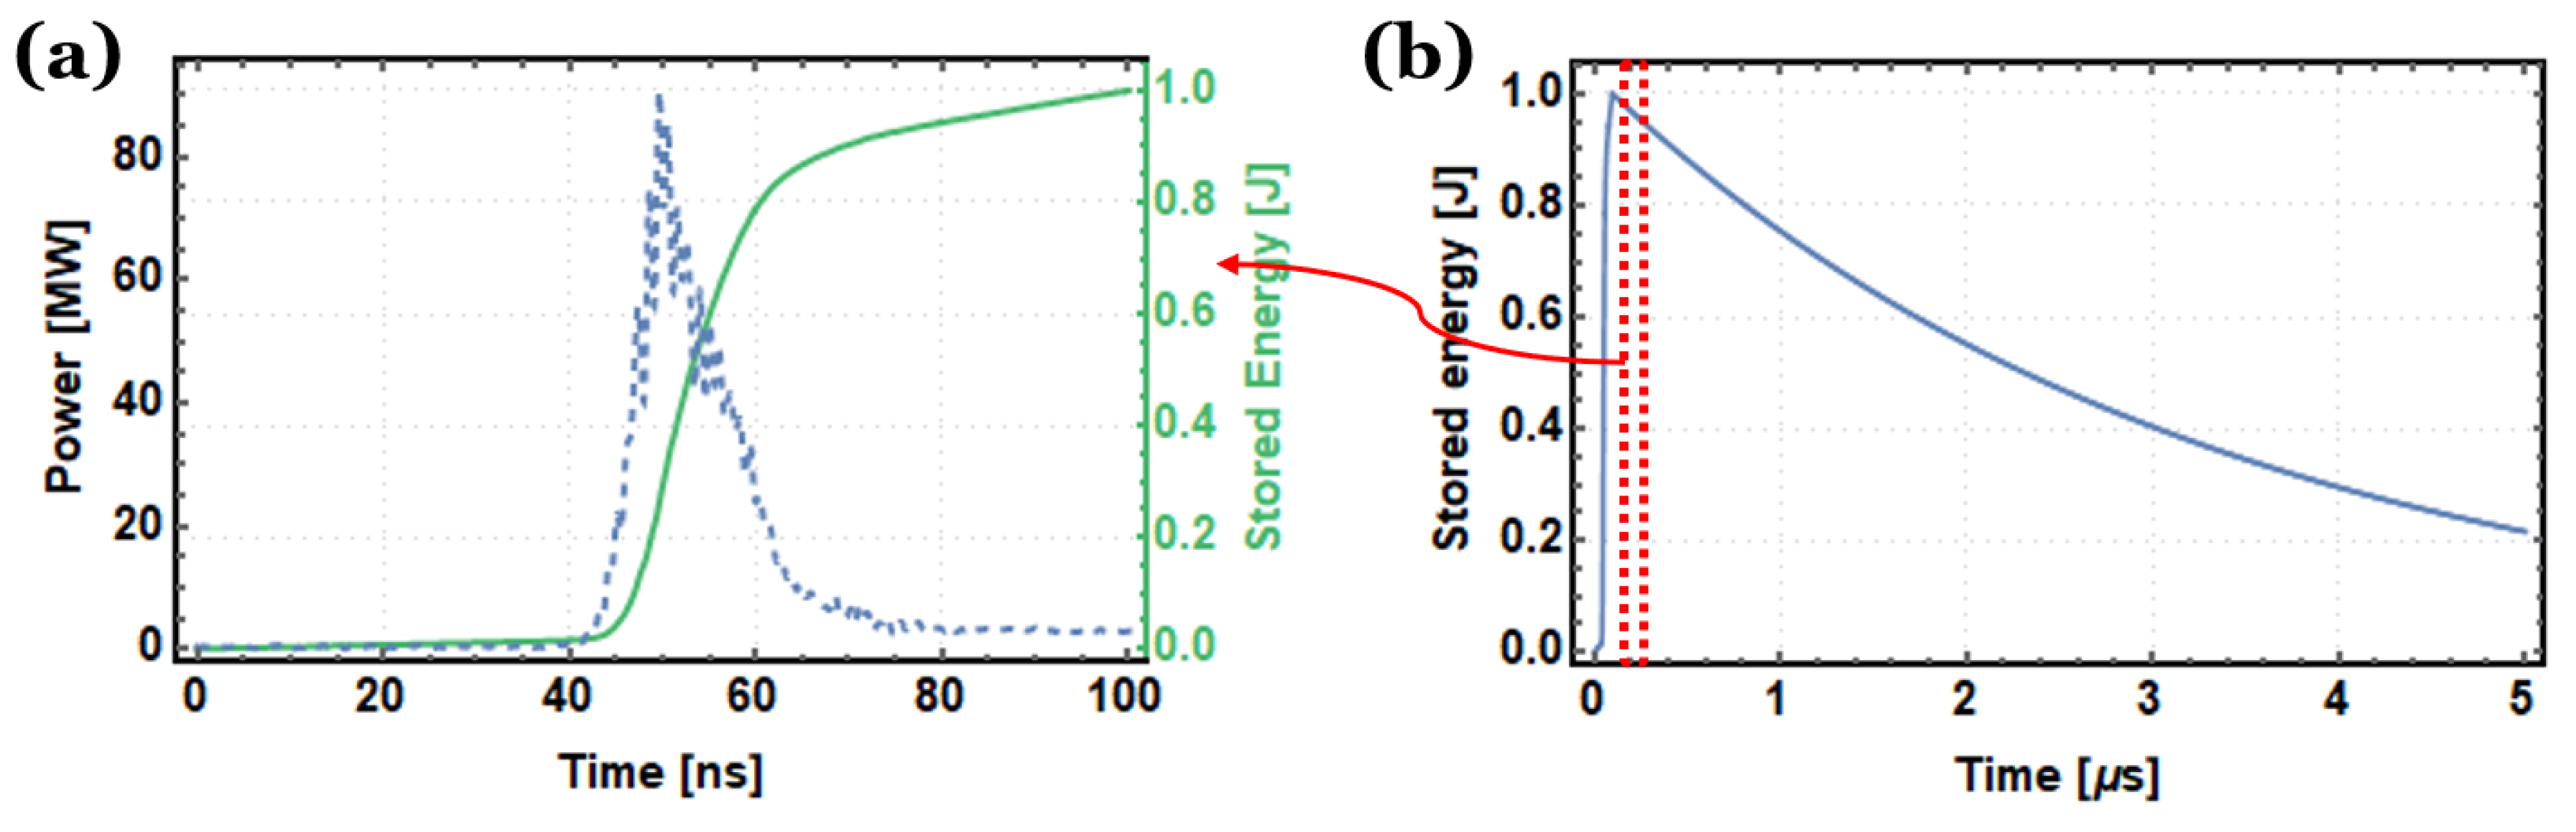
where is the effective pump rate [cm s] and is the fluorescence lifetime [s] of the gain medium. Equation (18) is relevant even when the seed and the amplified pulses do not exist. When there is no seed pulse, in Equation (18), is zero and is also vanishes based on Equation (7) or Equation (14). As shown in Figure 6a, as the pump pulse is absorbed by the gain medium, the number of inversion ions , i.e., the effective stored energy, increases. As shown in Figure 6b, the stored energy decreases with the spontaneous emission even when there is no stimulated emission from the seed pulse. The spontaneous decay time is characterized as the fluorescence lifetime of the medium. By performing a simulation similar to the example shown in Figure 6, one can estimate the maximum stored energy and time required for the stored energy to reach the maximum. The stored energy is typically lower than the effective total pump energy because of the spontaneous emission loss, and the instantaneous moment at which the stored energy is highest is the best seed pulse injection timing in the single-pass amplifier.
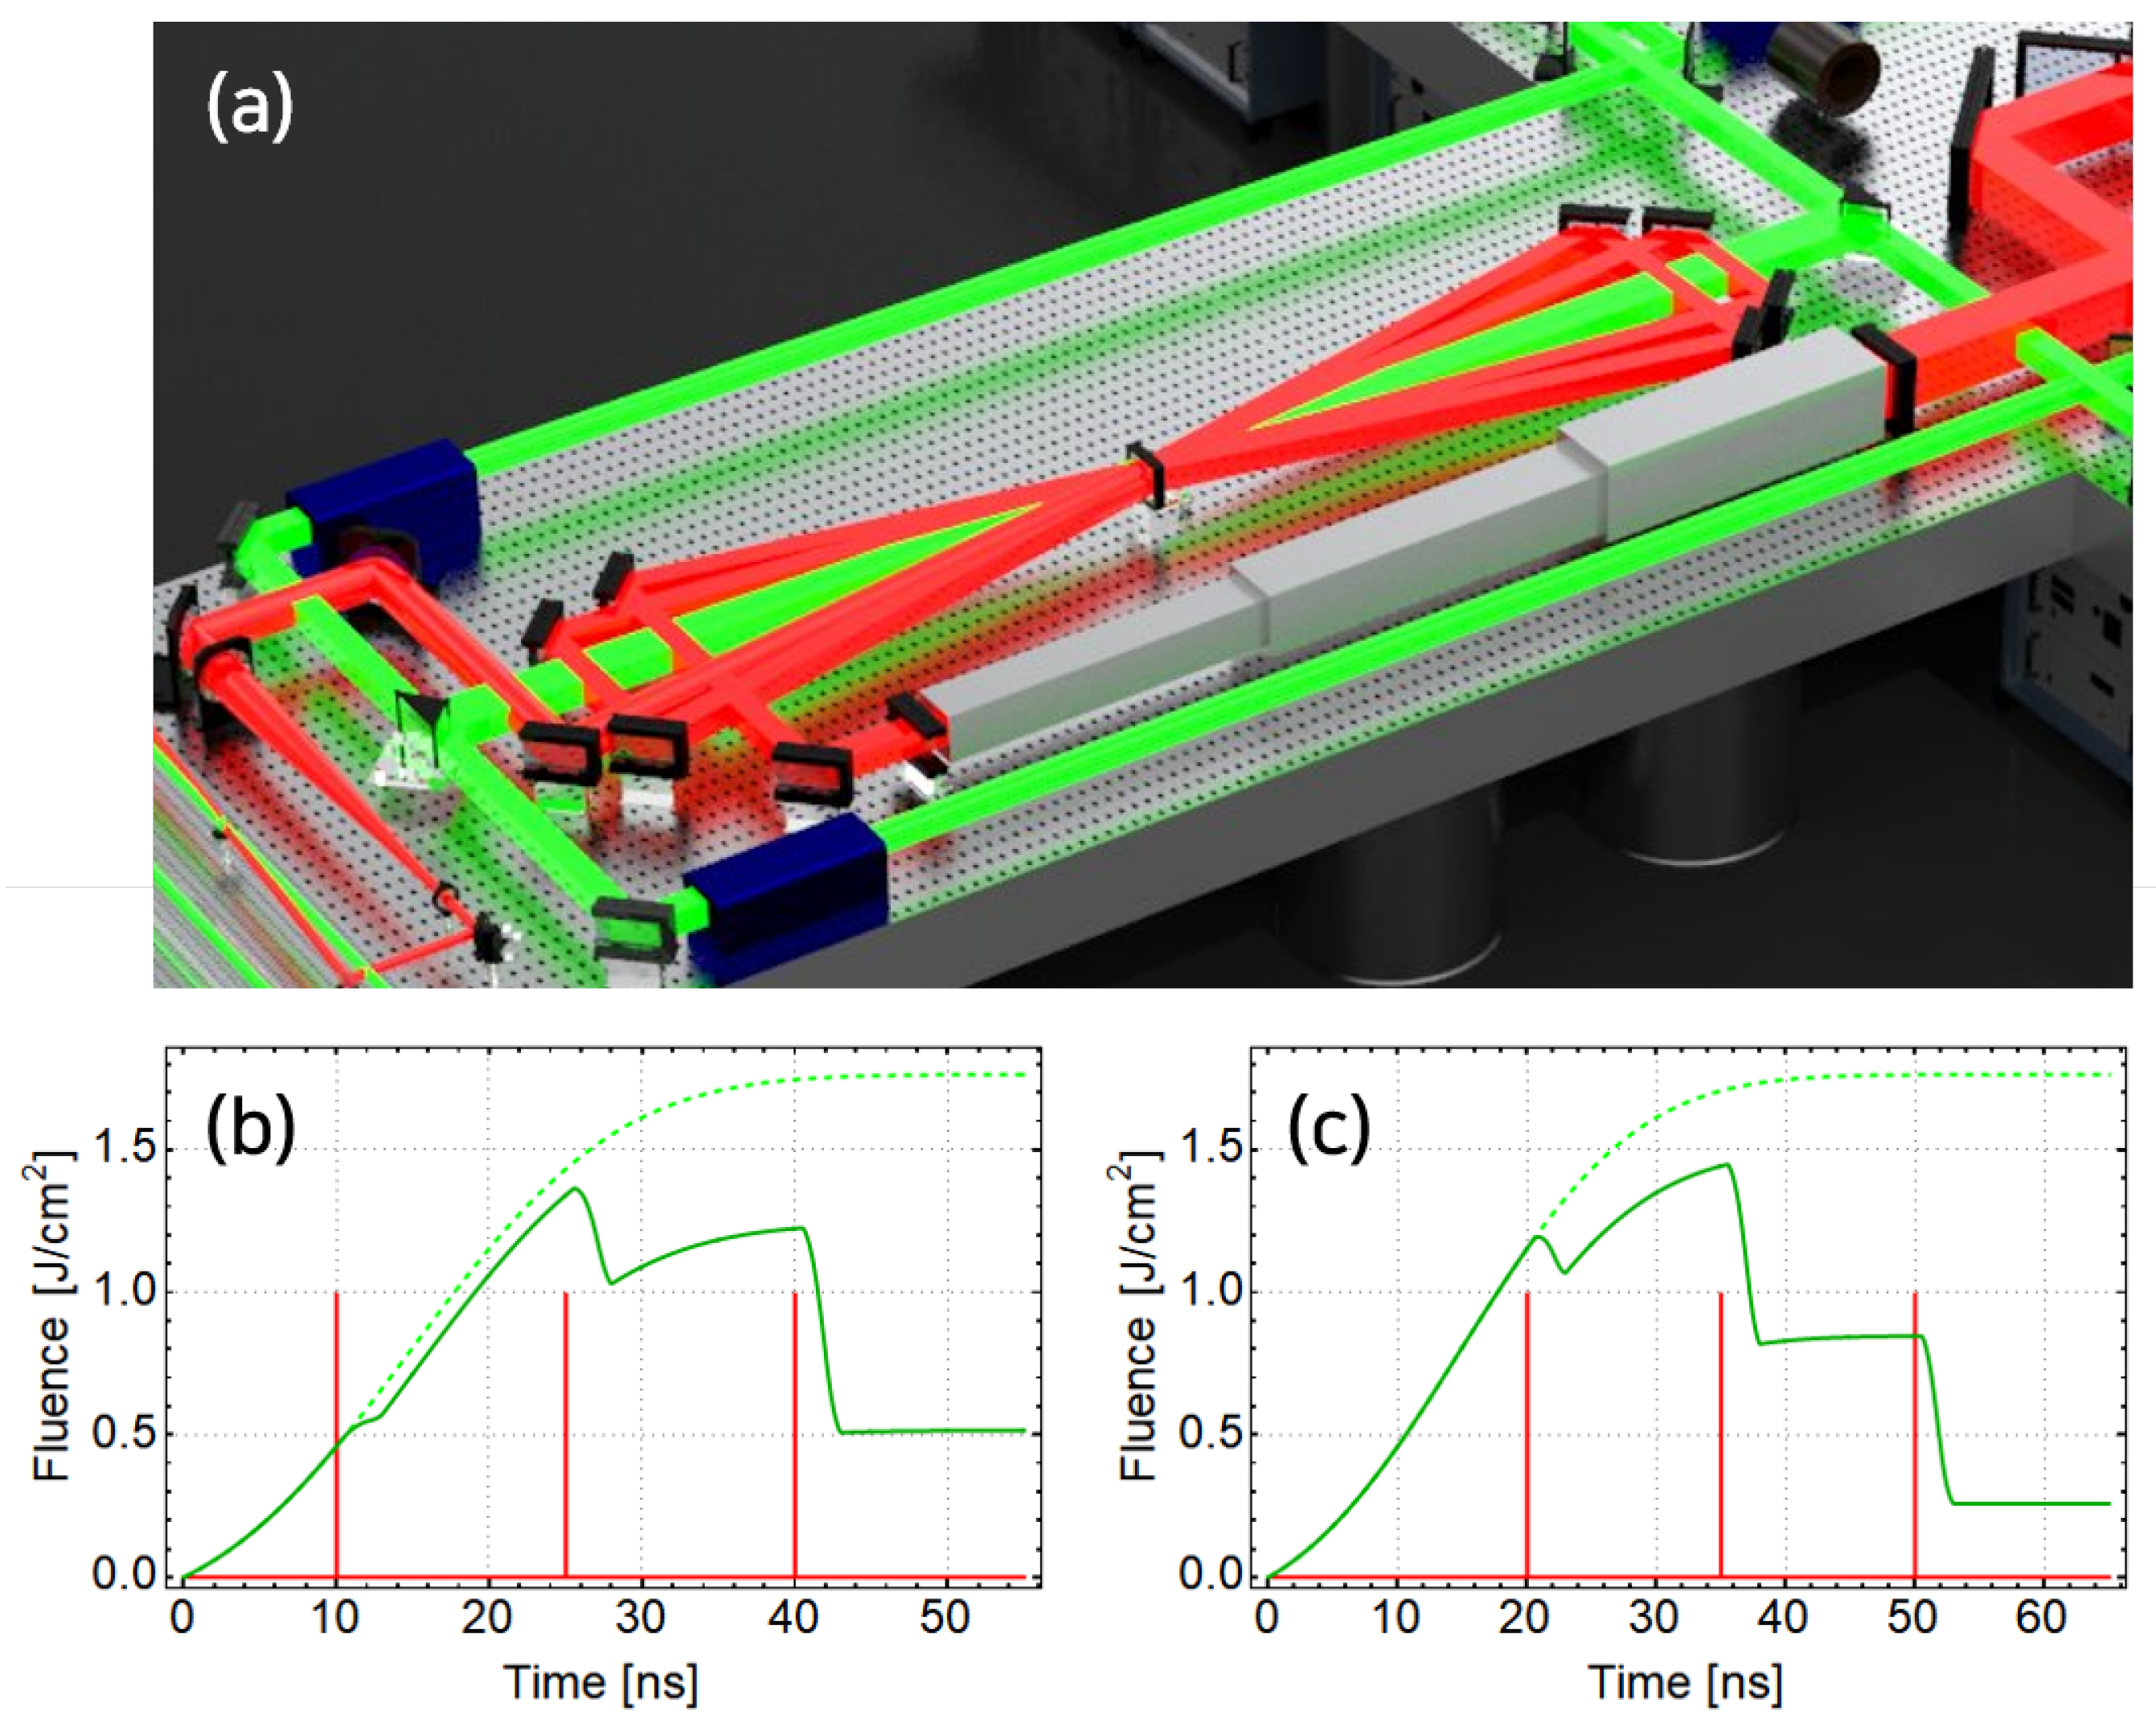
A Ti:sapphire amplifier is widely used in terawatt(TW) or petawatt(PW) CPA laser systems [8]. Figure 7a shows an example of a PW-class, tens of Joule pulse energy, fs pulse width, and multi-pass amplifier. In case of Figure 7, for 2.2 PW of peak power, 120 () J of pump energy, 2-stage of 3-pass amplifiers, 17.7 fs of pulse width, and 67.9 (48.6 after compression) J of pulse energy are assumed. In such a CPA system, the stretched seed pulse duration is a few nanoseconds and it takes tens of nanoseconds to pass through the multi-pass power amplifier [3,17,44]. Spontaneous emission would be negligible because the duration of amplification is much shorter than the fluorescence lifetime of the Ti:sapphire medium (3.2 μs [28]). However, it is important to consider instantaneous pumping in a multi-pass amplification simulation because, as shown in Figure 7b,c, it allows tracing the stored energy changes in the entire amplification process.
Figure 7b,c shows two simulation results for the amplifier with different seed injection times and delays between the passes and pump pulses. Other pump and seed beam conditions, such as the total energy and beam diameter are the same. The results of Figure 7b,c exhibit two relevant differences. First, the residual stored energy is different. This suggests that the extraction efficiency of the amplifier can be optimized by a simulation including the instantaneous pumping. Second, the peak values of the stored energy reached during the amplification processes are different. Large Ti:sapphire crystals, with diameters from 10 to 15 cm, are commonly used in high-power amplifiers to achieve a high pulse energy from tens to hundreds of joules [3,17,44,45,46,47]. In a large-diameter gain medium, a parasitic oscillation in the transverse direction can occur with the stored energy increase [47,48,49,50]. The amplifier shown in Figure 7b has a higher possibility of experiencing a parasitic oscillation than that in Figure 7c. A method of the multiple extraction during pumping [47,48,49], which can control the relative delays between the pump pulses and/or seed and pump pulses, is proposed to reduce the peak value of the stored energy during the amplification process. A simulation including instantaneous pumping would be useful to optimize the delays and each pump pulse energy.
In contrast to Ti:sapphire amplifiers, there are microsecond [51,52] or millisecond [53,54,55] lasers, which are used in medical or industrial applications. For these long-pulse lasers, the spontaneous emission term given in Equation (18) should be included in the calculation, because the duration of the amplification process is similar to or longer than the fluorescence lifetime of the gain medium [43]. In addition to the effects discussed in this review, the consideration of the losses induced by the amplification of a spontaneous emission would be important depending on the applications [56,57]. In the next section, we reviewed the influence of the beam profile on the amplifier efficiency and corresponding modeling method.
2.4. Effects of Transverse Profiles
In this section, we will discuss how the transverse profile of a laser affects the amplification process. A one-dimensional(1D) amplification simulation assumes that the transverse profile of the laser is a flat-top, so that the energy is much higher compared to the actual value. The seed and pump beams used in Ti: sapphire amplifiers do not have a uniform spatial distribution and flat-top steep edges. For a residual pump beam [17], the energy of the edge of the pump beam is unused for amplification, which reduces the energy efficiency of the amplifier. To obtain accurate simulation results, the amplification process should be calculated considering both the transverse profile of the seed beam and pump beam.
By considering the spatial beam distribution of the seed beam and pump beam in a two-dimensional(2D) amplification simulation, we can achieve a better agreement with experimental results. Spatially expanding the Frantz-Nodvik equation for the CPA used in a 1D calculation allows simple 2D amplification calculations to be performed. Assuming that the thickness of the laser medium is ignored, the gain and output fluence of the amplifier can be calculated from Equations (19) and (20). and are the wavelengths of the seed laser and pump laser, respectively, is the gain. , are the input and output fluences of the seed beam along with the wavelength, respectively, and and are the fluence of the pump beam, and saturation fluence, respectively. The length of a chirped pulse is typically about 1 ns, and the optical path difference between the passes in a multi-pass amplifier, which is mainly used as the main amplifier, is longer than this. Therefore the effect of overlapping of the pulses in the medium does not have to be considered.
A 2D amplification simulation can be used for the spatial shaping of the pump beam, which is one of the most important factors in a laser amplifier, as well as for obtaining simulation results similar to the experimental results. The spatial distribution of the output laser beam through the laser amplifier follows that of the pump beam. Therefore, the pump beam should have a high steepness and high uniformity for uniform and efficient amplification. If the steepness is low, it implies a slow rising edge, and the pump beam energy cannot be efficiently transferred to the seed beam owing to the low gain near the edge of the beam, leaving energy in the gain medium. This effect allows the amplifier to have a low energy extraction efficiency. Moreover, the non-uniformity of the pump beam results in an amplified beam with a low spatial beam quality.
One approach to minimize this problem and improve the quality of the output beam is to pump a flat-top laser beam into the gain medium through a beam shaping system, such as a beam homogenizer using a lens array or diffractive optics [58,59]. A beam shaping system increases the edge steepness and spatial uniformity of the pump beam formed in the gain medium and improves the quality of the output beam by making the spatial distribution uniform. By combining beam shaping system design techniques and amplifier simulation, an optimal amplifier condition can be designed to maximize the energy extraction efficiency and spatial uniformity. The edge steepness and beam uniformity criteria described in ISO13694 can be used to optimize the amplifier simply by evaluating the spatial distribution of the beam.
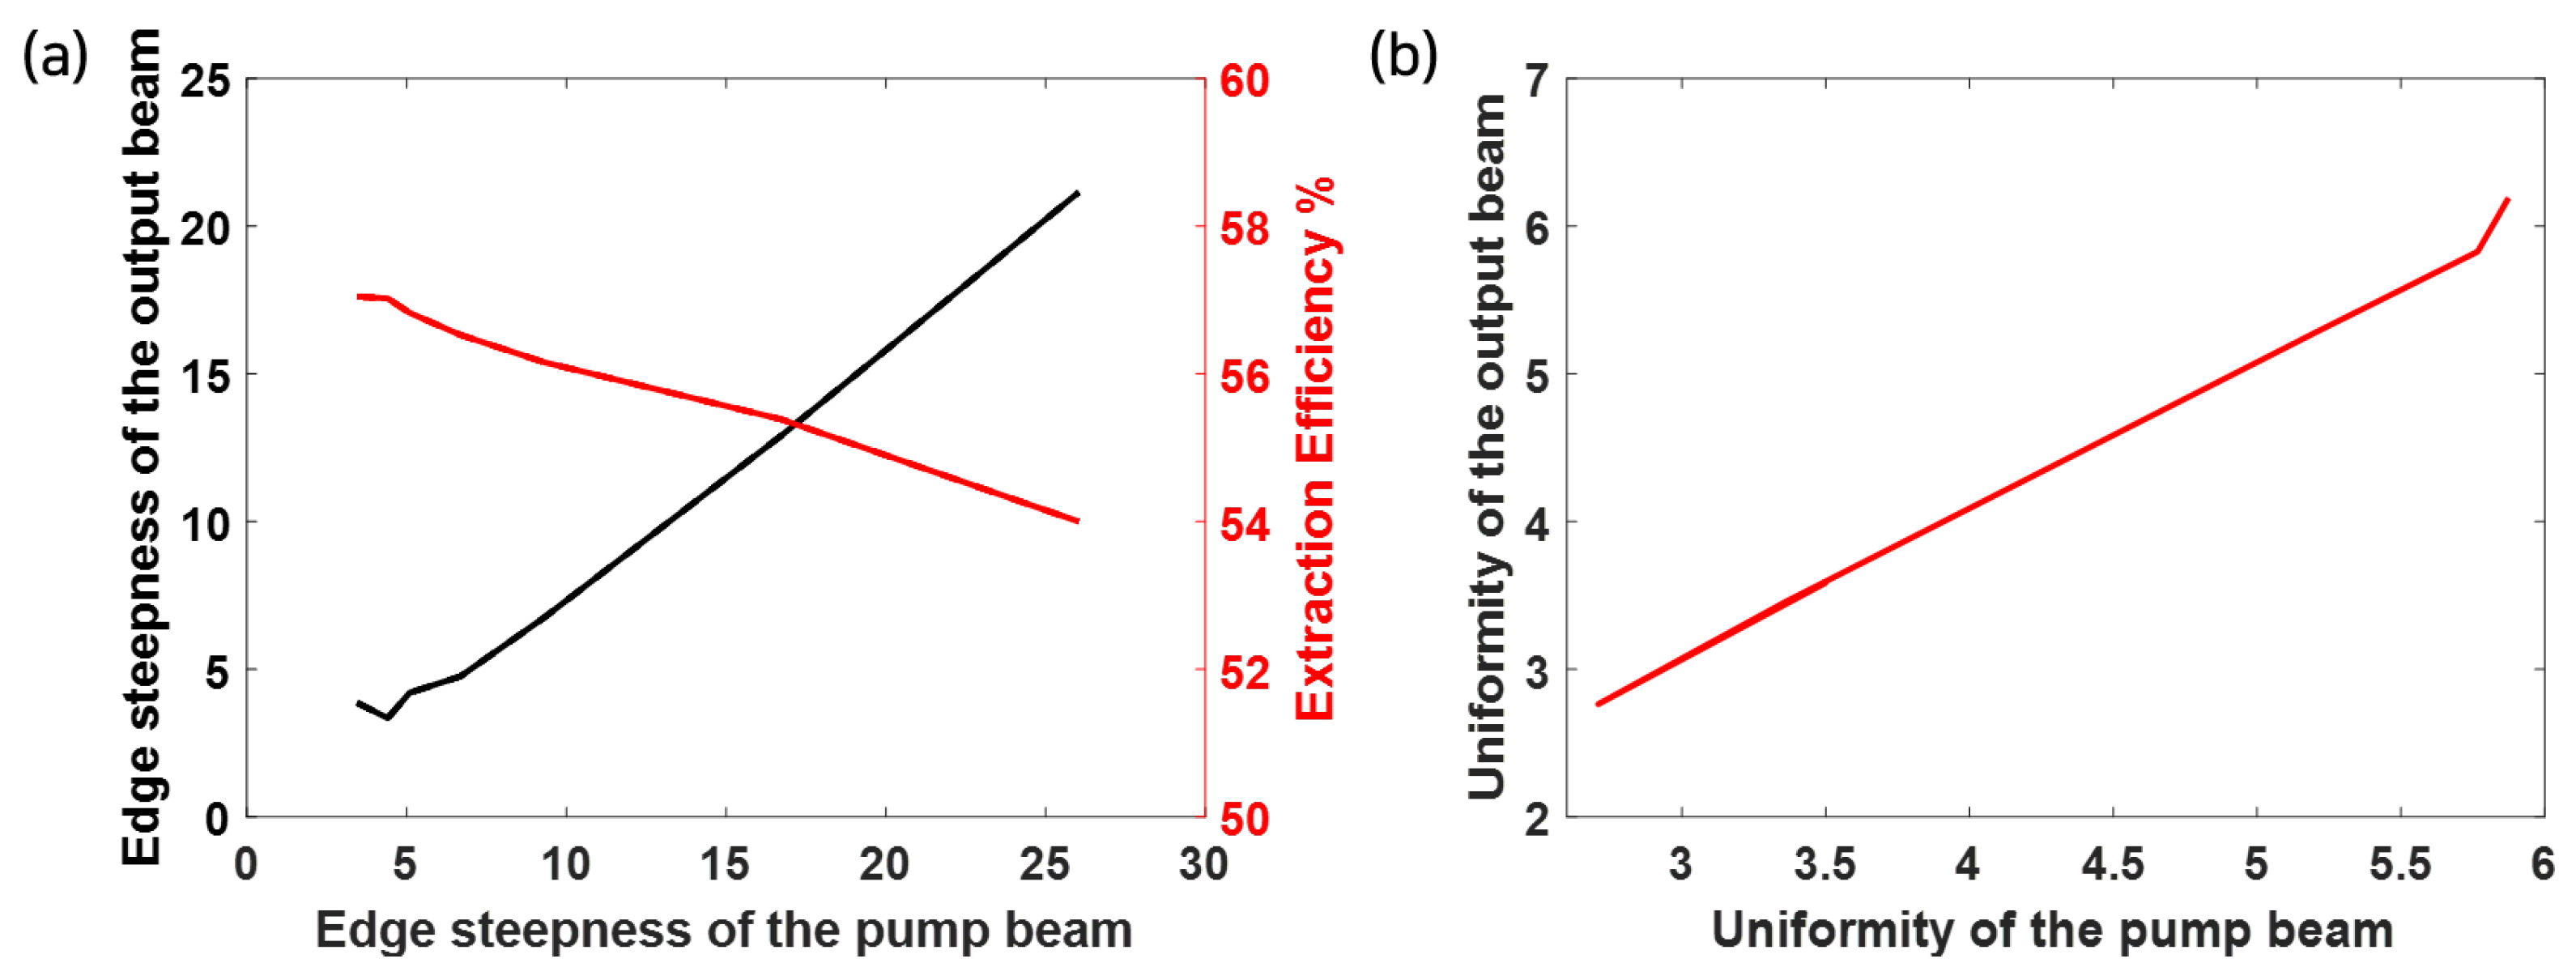
Using Equations (19) and (20), a multi-pass amplifier simulation can be performed to calculate the extraction efficiency based on the edge steepness and the spatial uniformity of the pump beam and the amplified beam as shown in Figure 8. The simulation results exhibit that the energy extraction efficiency increases as the edge steepness of the pump beam decreases and the spatial distribution of the output beam becomes uniform as the spatial distribution of the pump beam becomes uniform. Thus, sharpening the edge of the pump beam and making the spatial distribution uniform are methods to uniformly amplify a seed beam with a high energy.
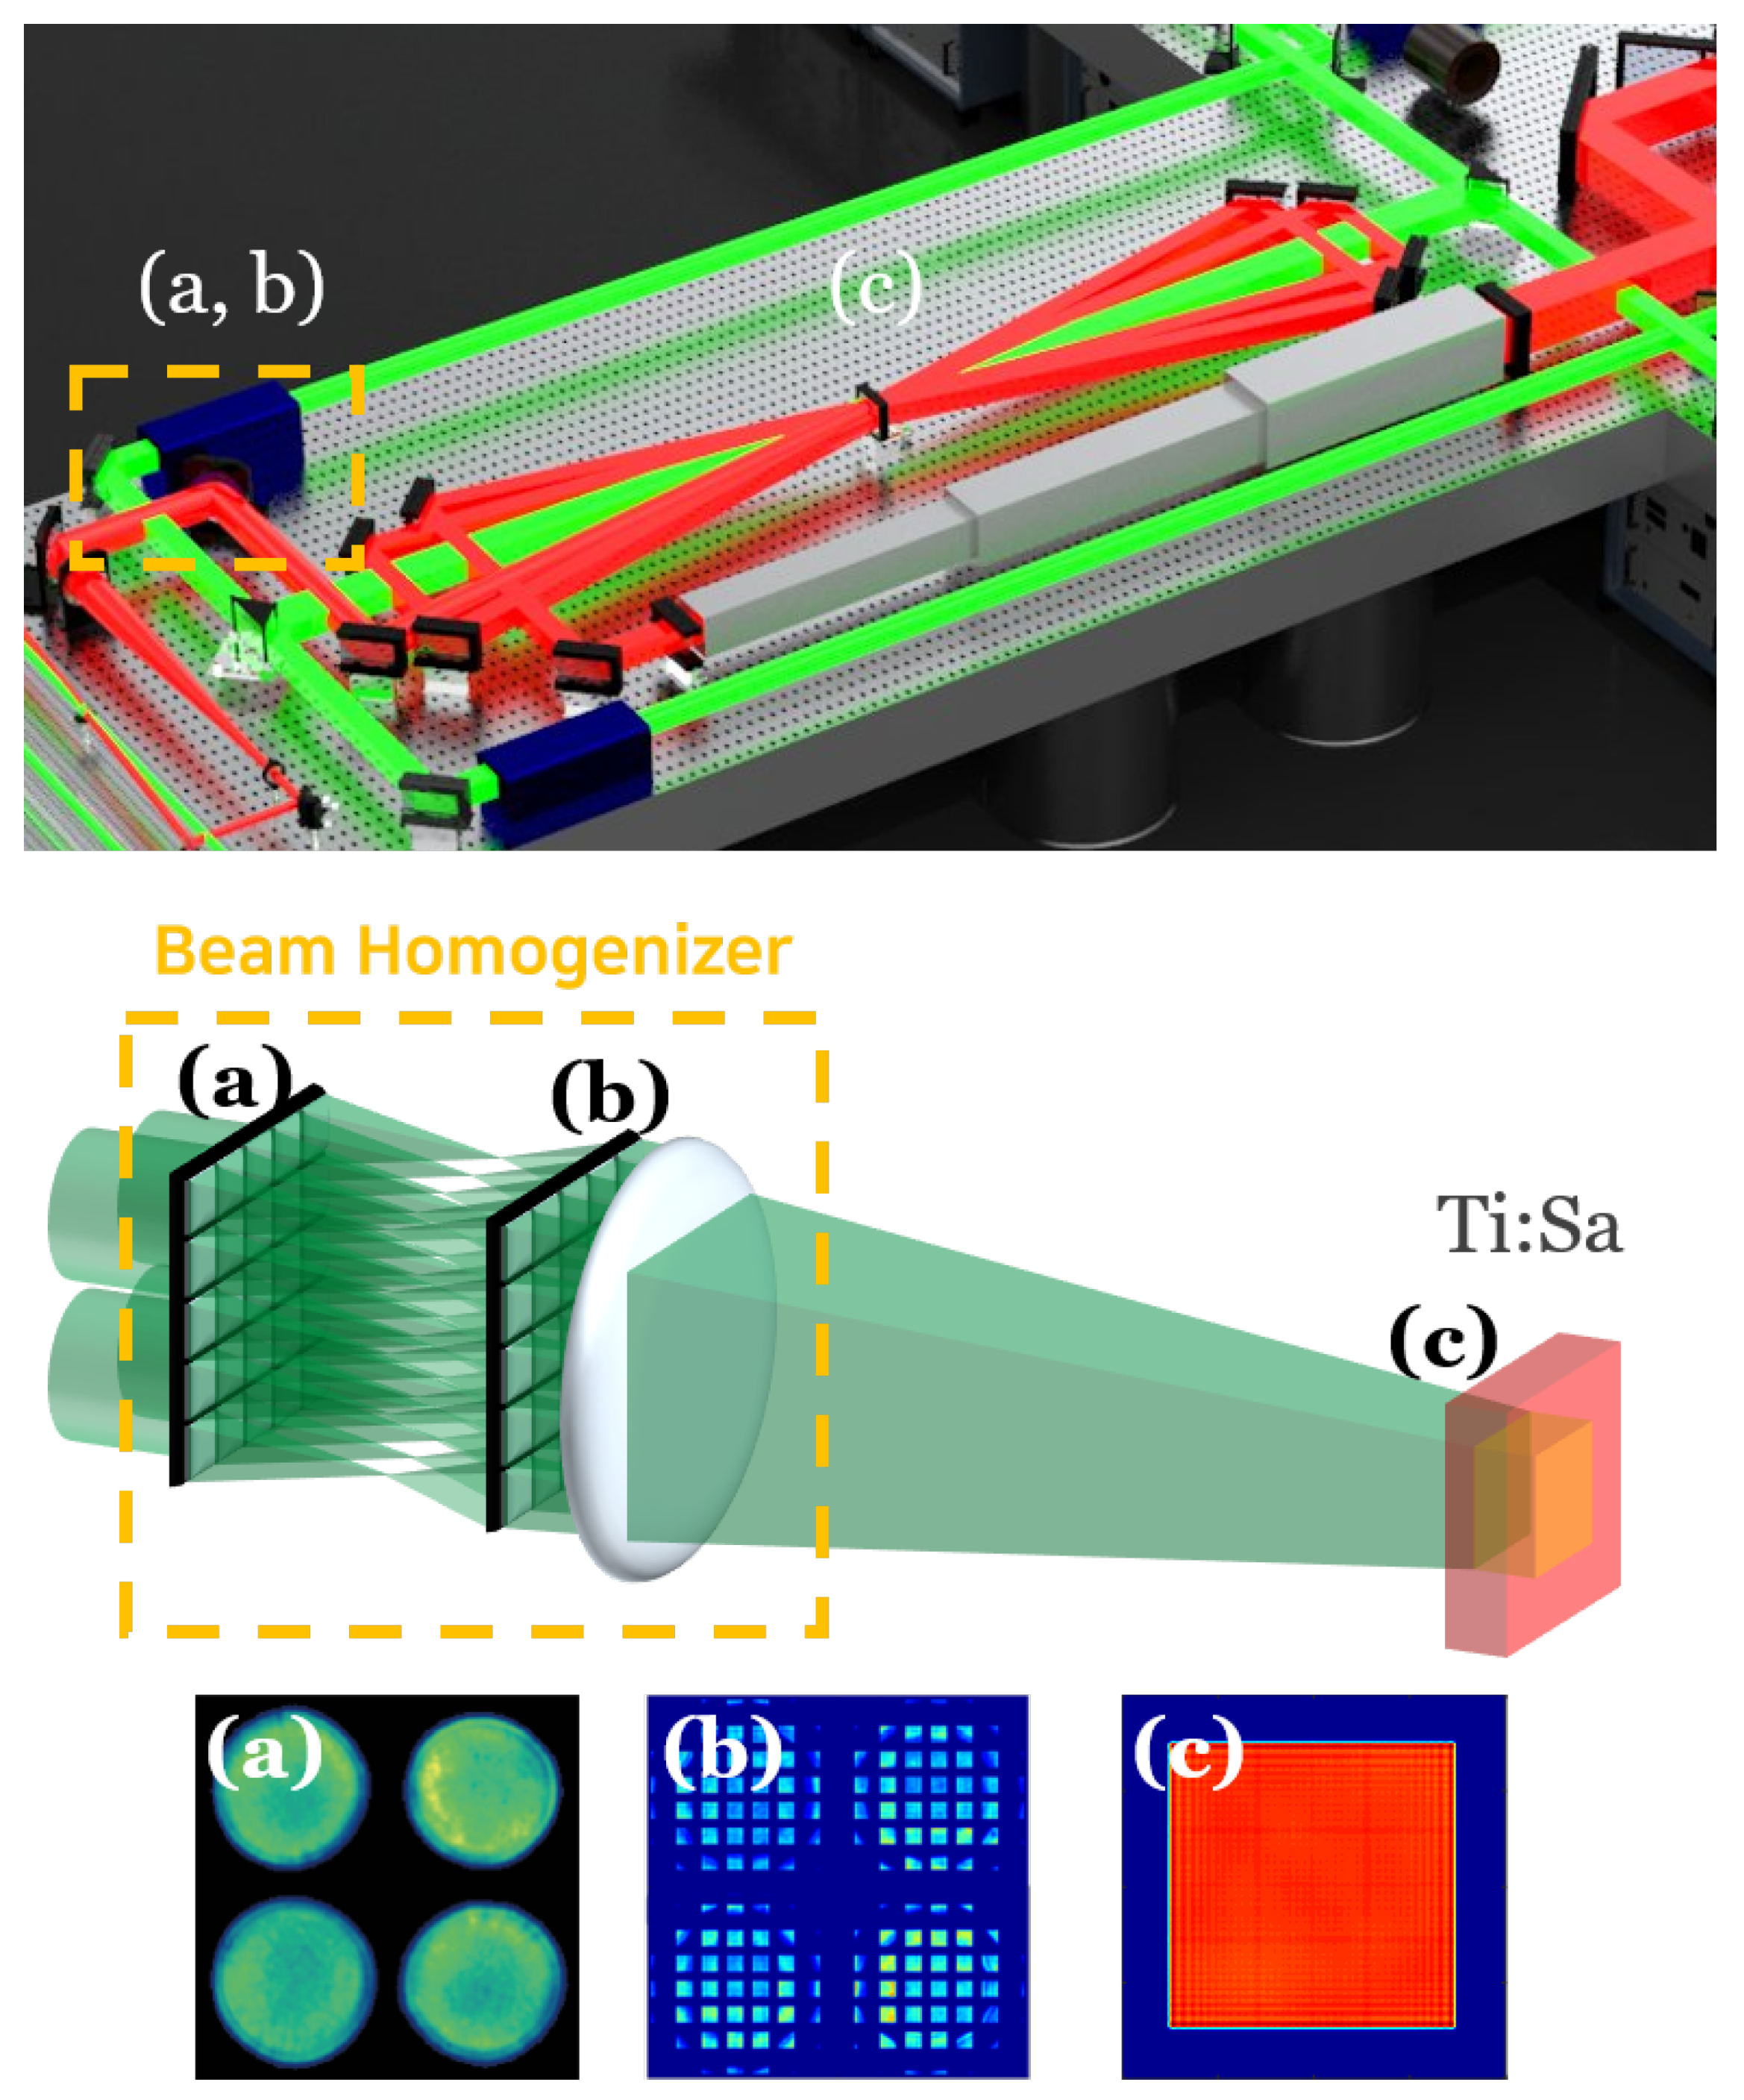
In addition, we can consider using a square pump beam for realizing uniform and efficient amplification in a laser amplifier. Employing a beam homogenizer using lens arrays, a highly steep and uniform square pump beam can be illuminated into the gain medium with a high efficiency. The square shape makes the fill factor of the lens array close to 100% and multiple circular beams can be pumped into the laser medium by shaping them into a square beam using a beam homogenizer as shown in Figure 9. In addition, the use of a square beam can reduce the size of the laser system. A square beam can reduce the size of the optical part by 11% compared to a circular beam and can use an area of 27% at the same size [20]. This reduces the risk of damage to the optical components and helps to miniaturize the pulse compressors or optical components.
3. Phase Distortion Analysis
3.1. Atomic Phase Shift (Population Inversion Induced Phase Shift)
The atomic phase shift, i.e., a population inversion induced phase shift, produces a temporal nonlinear phase distortion in an amplified pulse. In a CPA system, a temporal phase shift causes a spectral phase shift and is combined with gain depletion, resulting in a nonlinear spectral phase distortion. Gain depletion is a phenomenon in which the population inversion is reduced during the amplification process, and the gain is decreased. A reduction in the gain causes a nonlinear effect that redshifts the center of the spectrum, which in combination with the atomic phase shift induces a spectral phase shift in the chirped pulse.
The atomic phase shift is derived from the classical electron model. Equation (21) expresses the wavenumber, , for an excited ion, and the gain and phase shift for the excited ion are obtained from Equations (22) and (23) [23]. In a CPA system, the laser pulse is chirped; specifically, because the frequency is distributed in the time domain, the phase shift and gain, which are functions of time t and frequency , can be expressed solely as a functions of time t. is the population inversion, is the peak emission cross-section, L is the length of the laser medium, and and are the peak angular frequency and bandwidth, respectively. The population inversion over time is considered in Equations (22) and (23); therefore, this model considers the gain depletion effect.
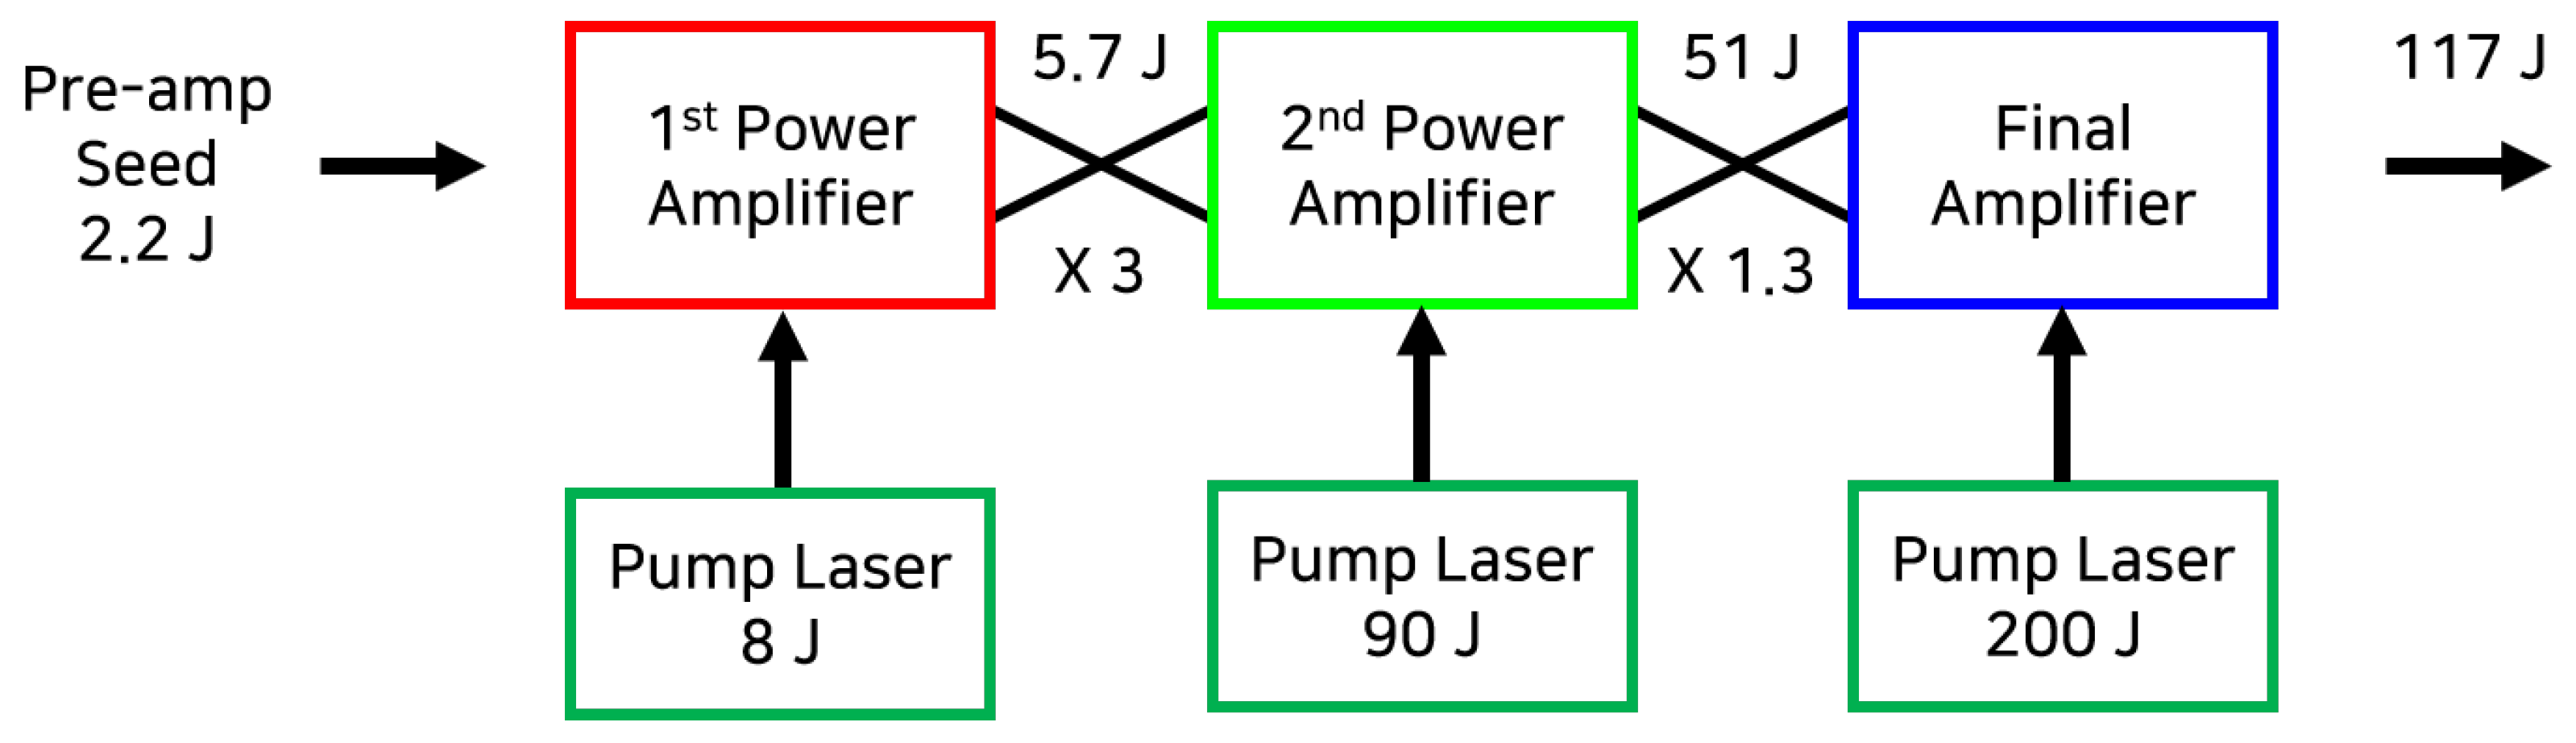
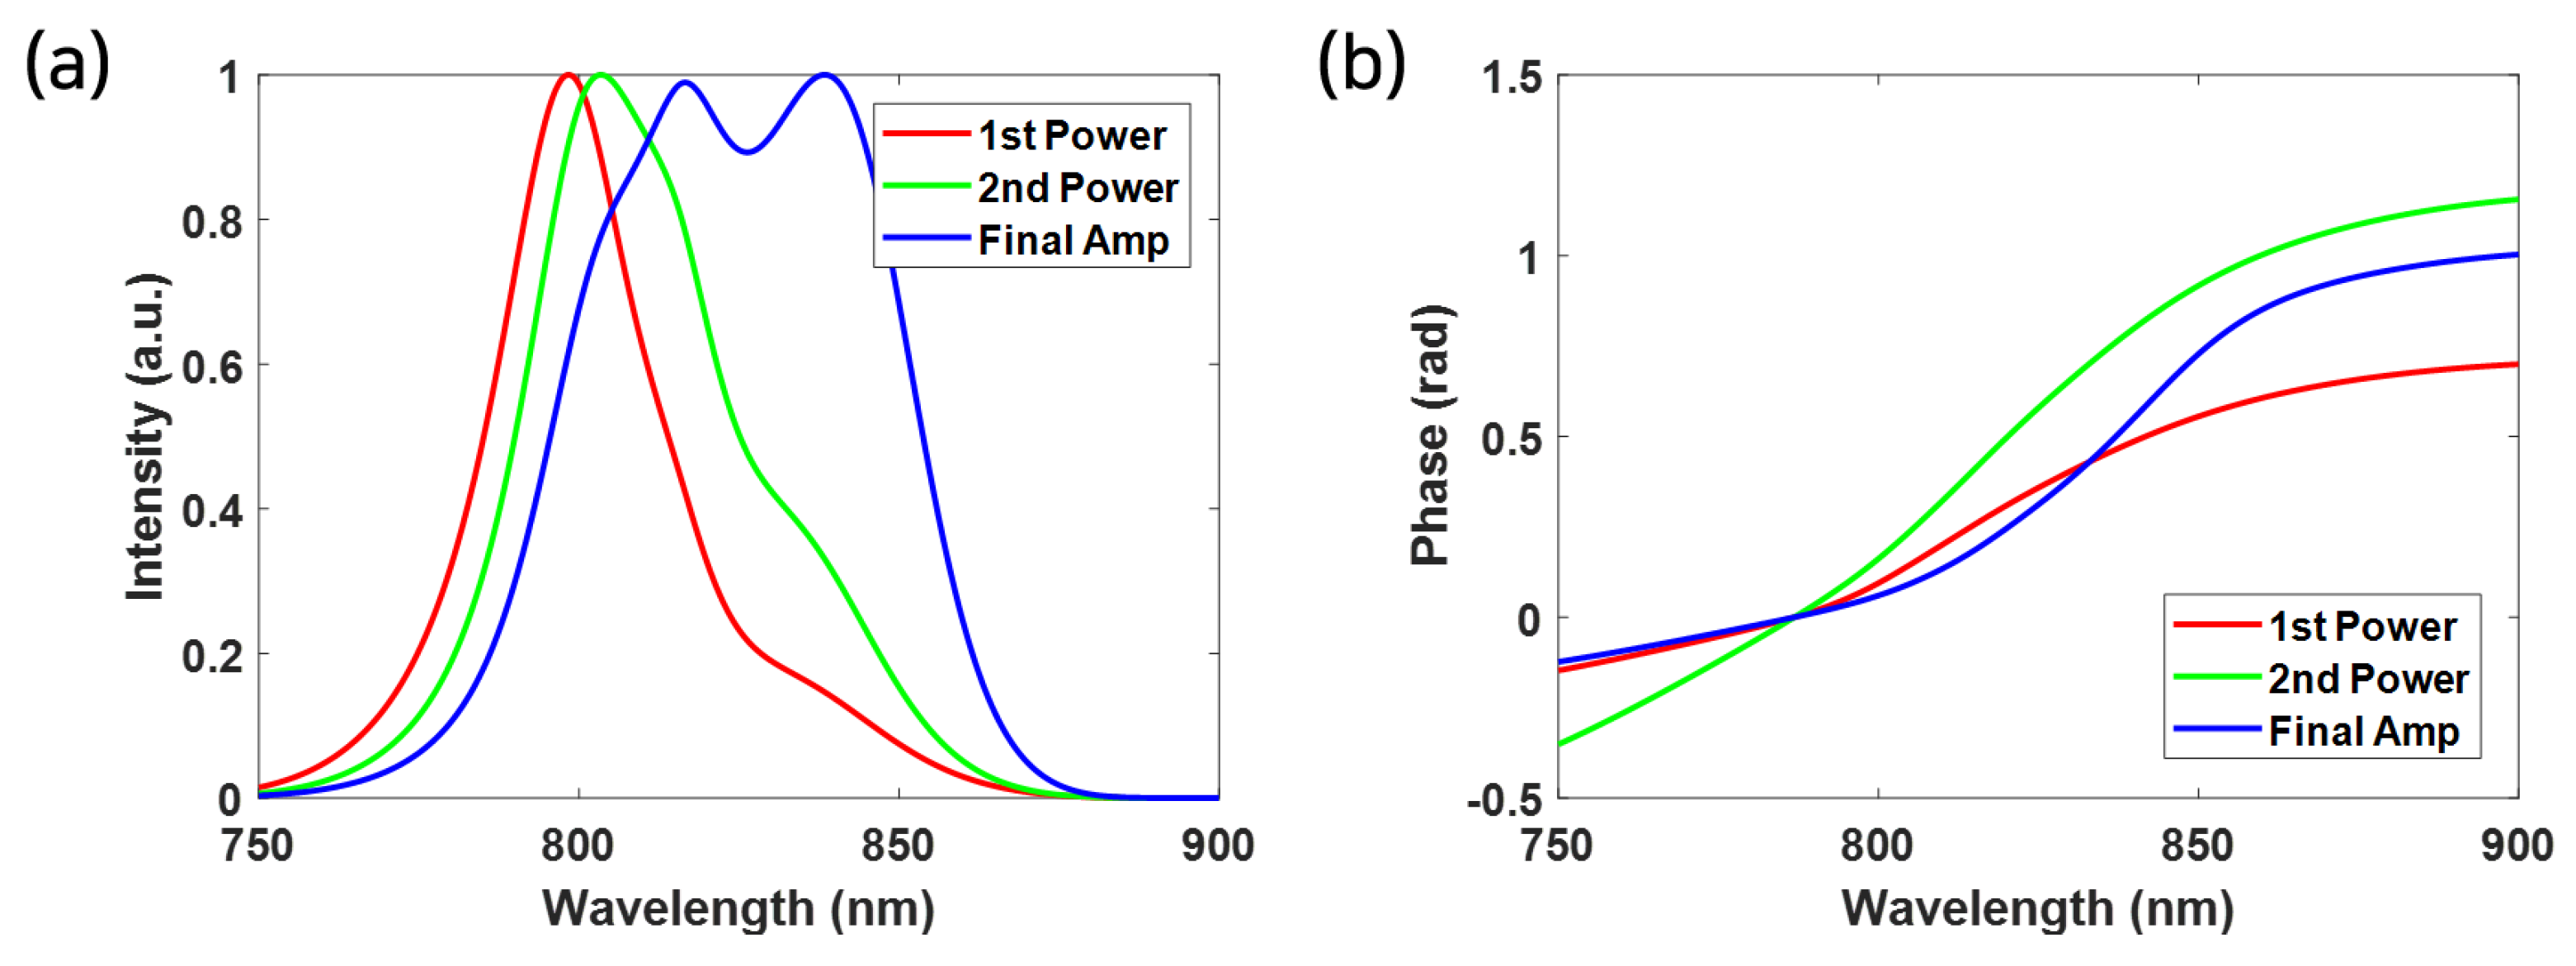
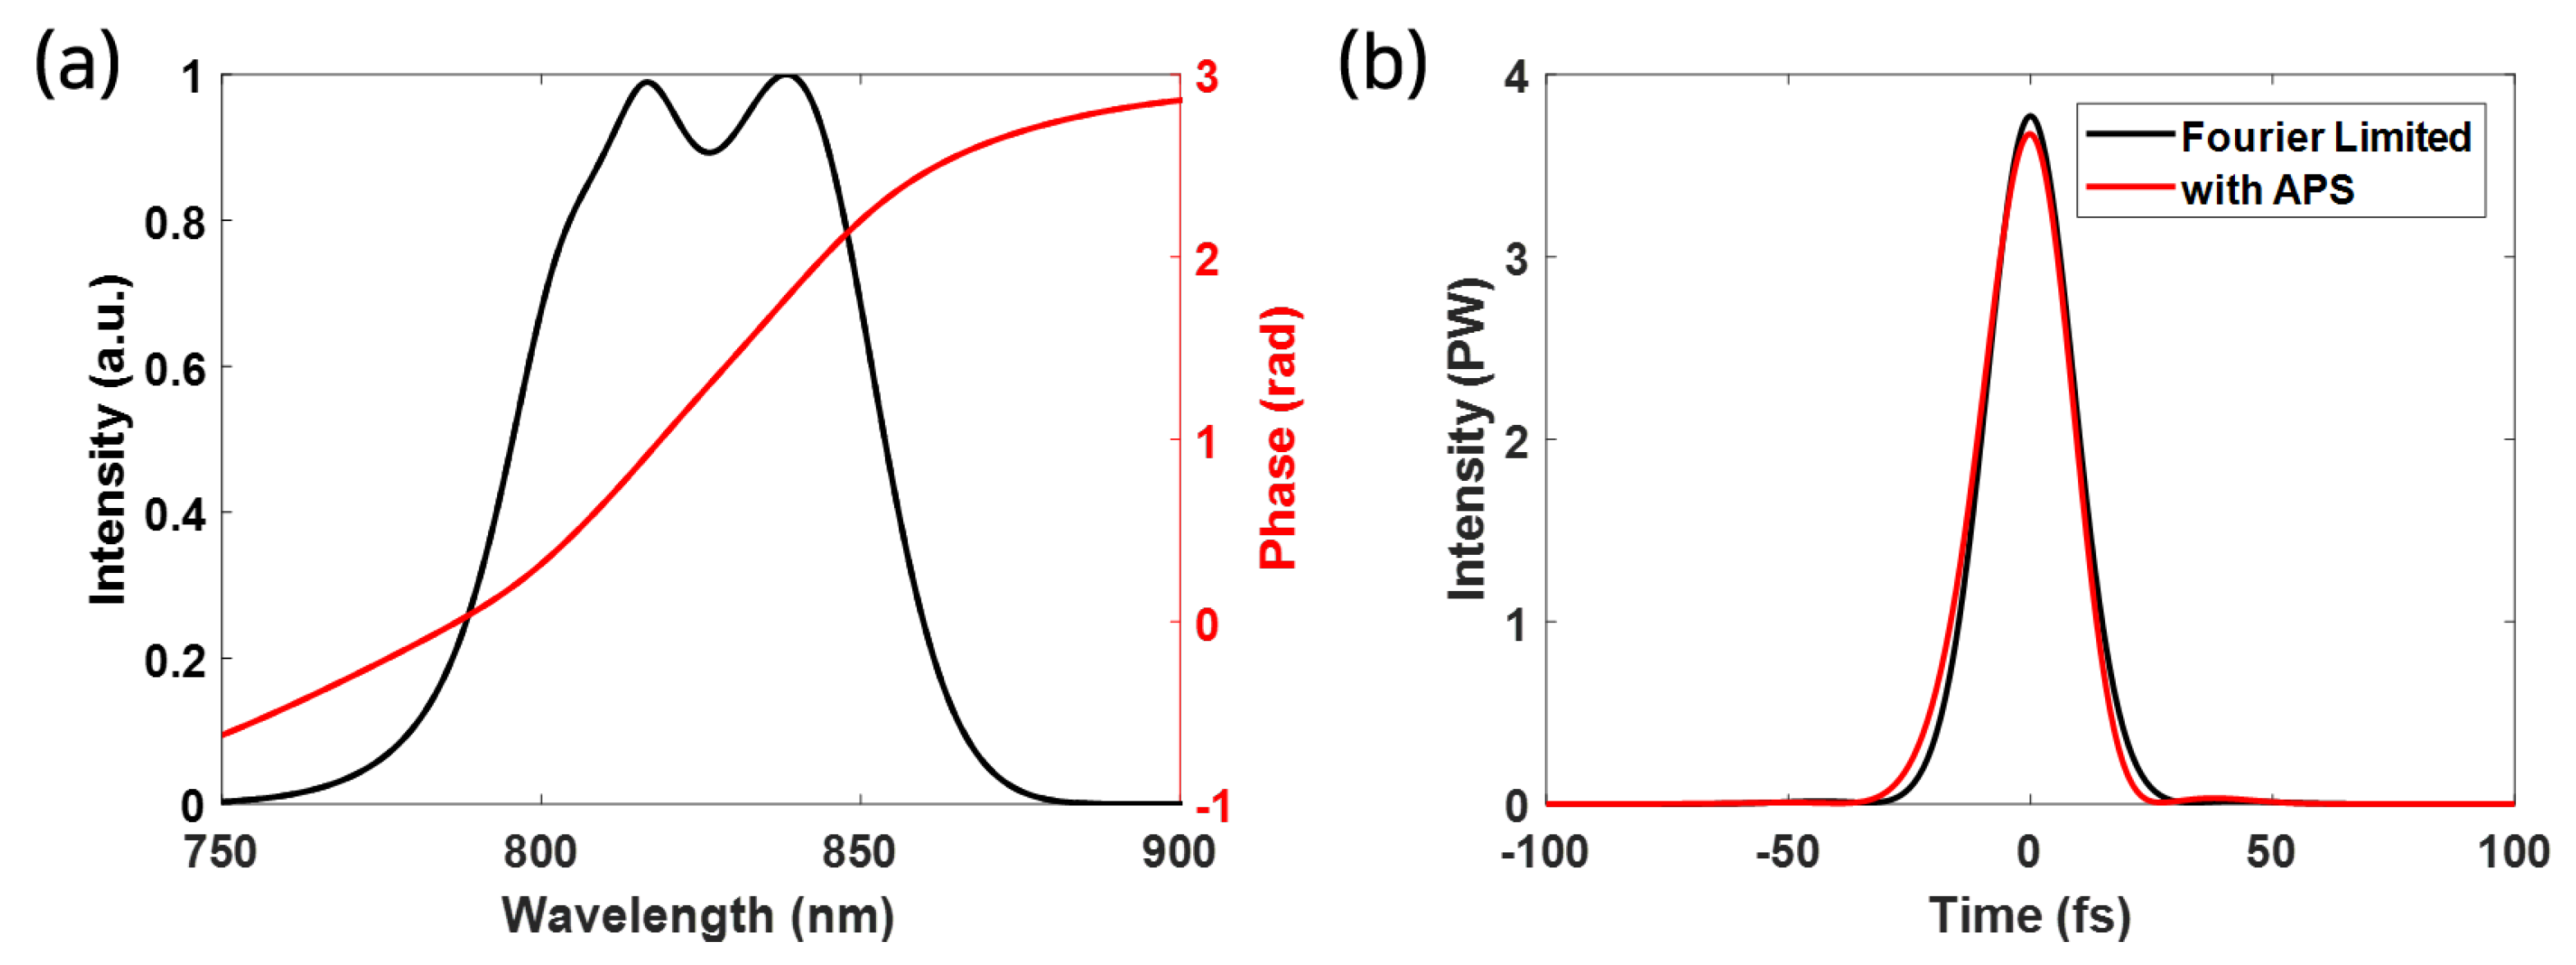
Because the phase shift in amplification is superimposed, the atomic phase shift effect in a laser amplifier chain is obtained by adding all the phase shifts generated in each amplification pass. To investigate the effect of the pulse distortion caused by the atomic phase shift in an amplifier chain structure, as shown in Figure 10, the amplifier simulation introduced in the previous section and the phase shift have to be combined. Figure 11 shows the output spectrum and accumulated atomic phase shift of each amplifier. The distortion in the phase shift due to the gain depletion effect is reflected in the asymmetric phase shift with respect to the center of the spectrum. The phase shift caused at each amplification stage is superimposed and distort the peak power and pulse width of the compressed pulse in the pulse compression as shown in Figure 12.
3.2. Thermal Birefringence
Leading research groups are focused on improving the repetition rate and pulse quality instead of successfully generating PW-class pulses [3,4,5,6,9,10,11]. Applications of ultra-high-power lasers require extraordinarily high quality, and it is necessary to increase the repetition rate to use them practically [8,12]. The thermal distortion that occurs in this process is one of the major issues to overcome. Ultra-high-power laser amplifiers use high-energy lasers as the source of the pump energy, imposing high thermal loads on the medium. This thermal distortion effect is one of the major causes of the degradation of the spatio-temporal quality of ultra-high-power laser pulses [21]. Because the non-involvement of the energy in the amplification process is a reason of the thermal effect, it becomes serious with the repetition rate. If a compact design for improved usability is applied, then the thermal problem becomes even more severe. To be active in an actual industrial field at the laboratory level, a solution to the thermal distortion problem should be developed first.
In this section, we present the results of a study on the thermal effects of ultra-high-power laser systems that our group has conducted [21]. We will introduce the photo-elastic (PE) effect, which is relatively disregarded among the causes of the thermal distortion occurring in a CPA system using Ti:sapphire as the medium. The PE effect is neglected in most cases because the degree of distortion is not significant compared to other thermal distortions. However, the distortion due to the PE effect cannot be ignored under the severe thermal conditions under which ultra-high-power laser pulses reaching PW at a repetition rate of several tens of Hz or more are generated.
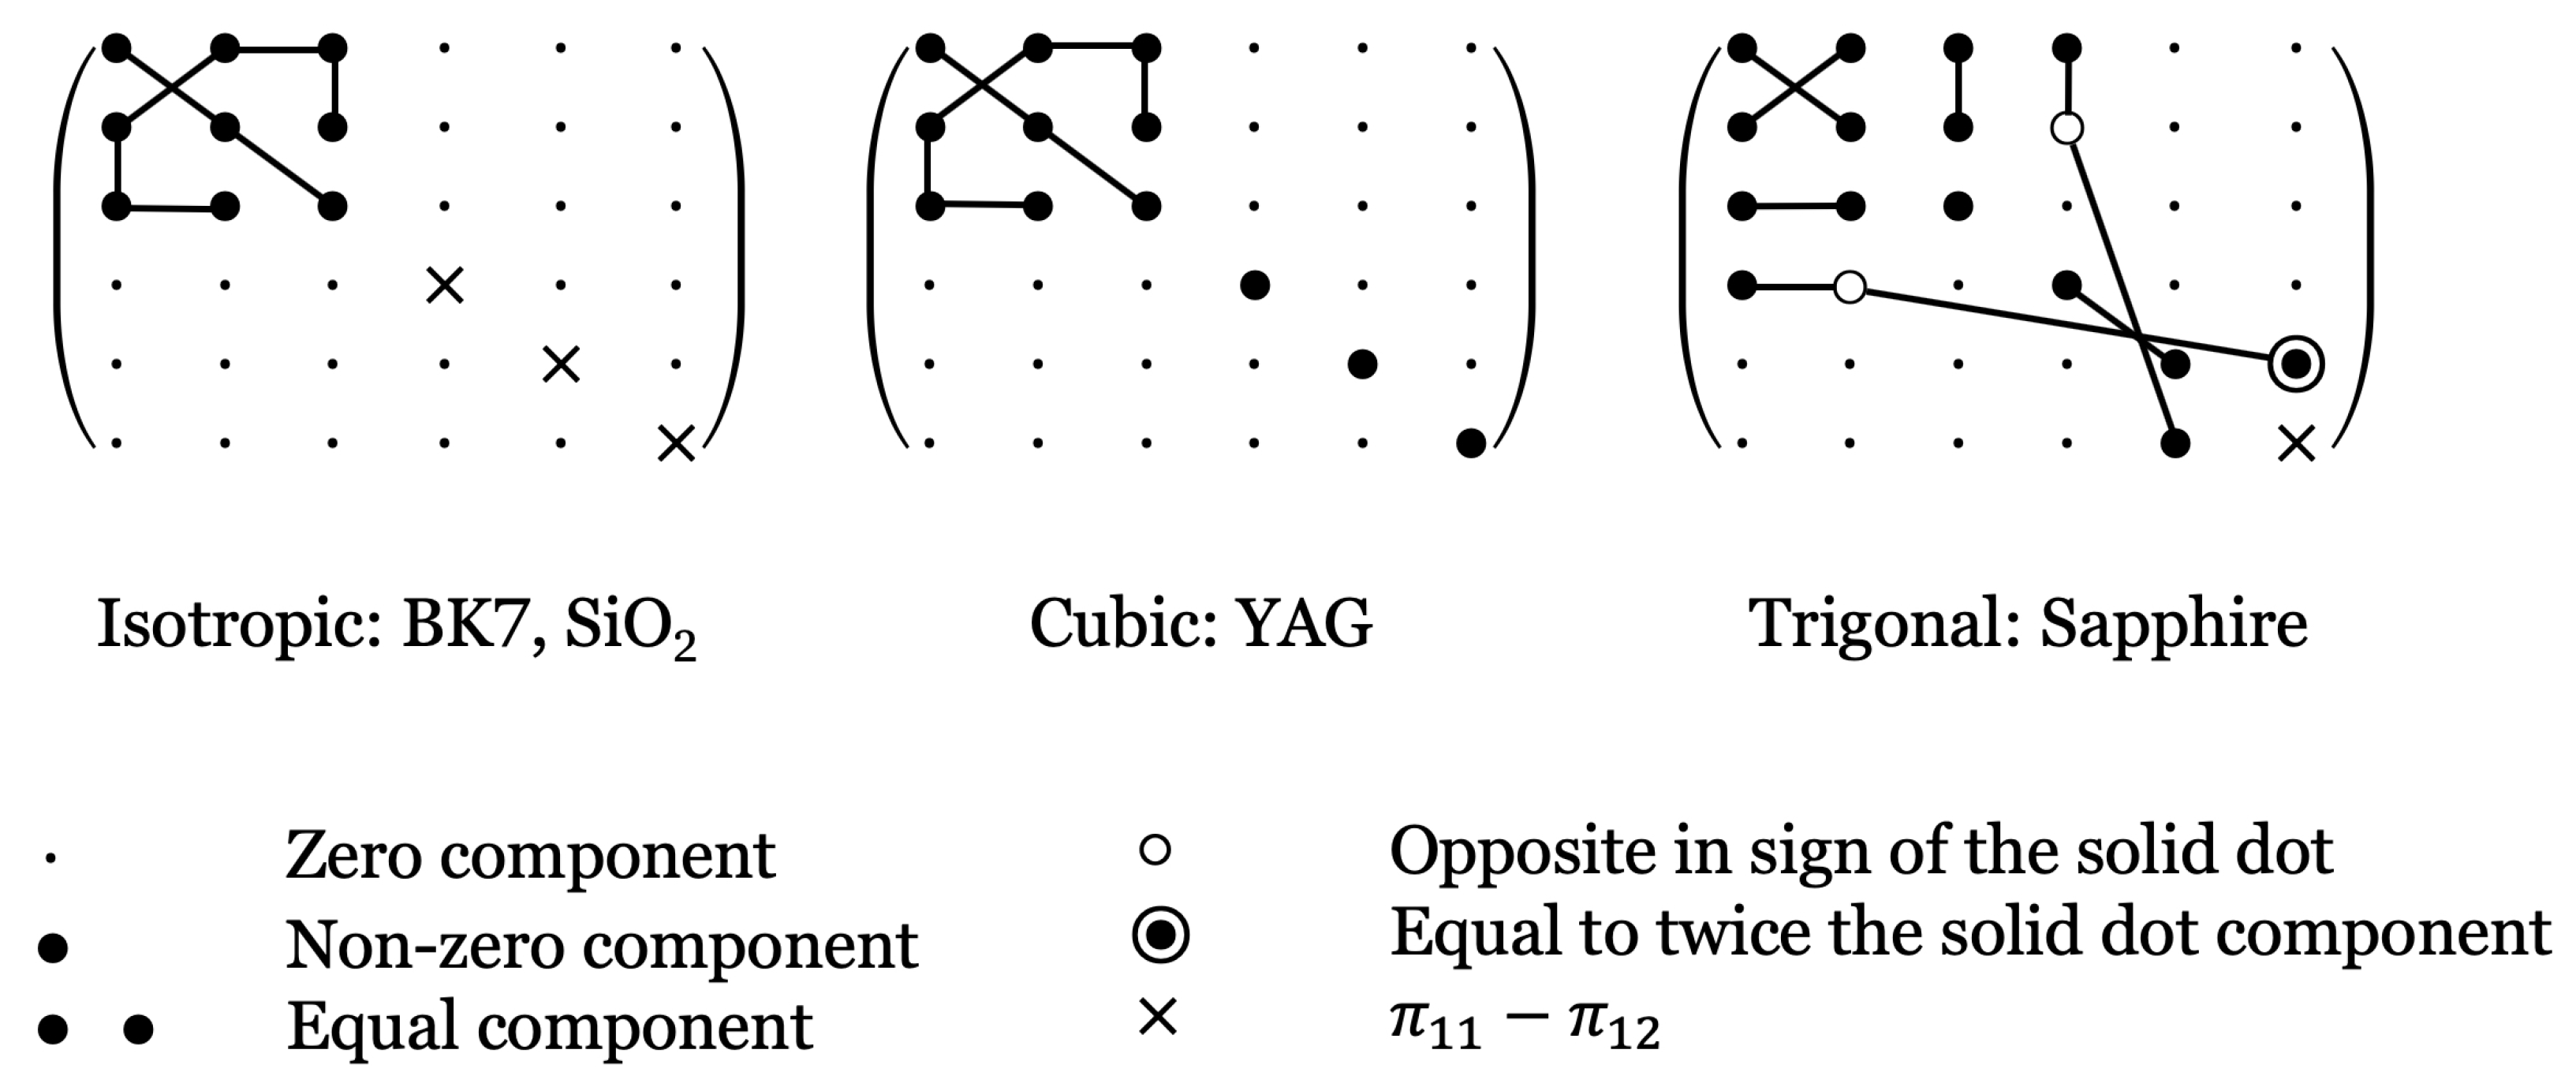
Thermal birefringence is caused by thermal stress [1]. Thermal stress and the relative impermeability (B) are related to the -tensor (piezo-optical tensor, Figure 13) [60,61]. The square root of B is the refractive index. The refractive index change induced by the heat can be expressed by Equations (24)–(26),
where -tensor is a piezo-optical tensor, is the thermally induced stress, is the angle between the principal axis of the thermal stress and Cartesian axis.
However, because the deformation of a beam experiences not only thermal birefringence but also intrinsic birefringence and the amplification effect of the medium, they must be considered simultaneously [21]. To model the complete PE effect, the simultaneous consideration of the amplification of the medium and intrinsic birefringence is required. Therefore, we use the Jones matrix (Equations (28)–(30)) to express the instantaneous change so that the three effects can be considered simultaneously in the medium.
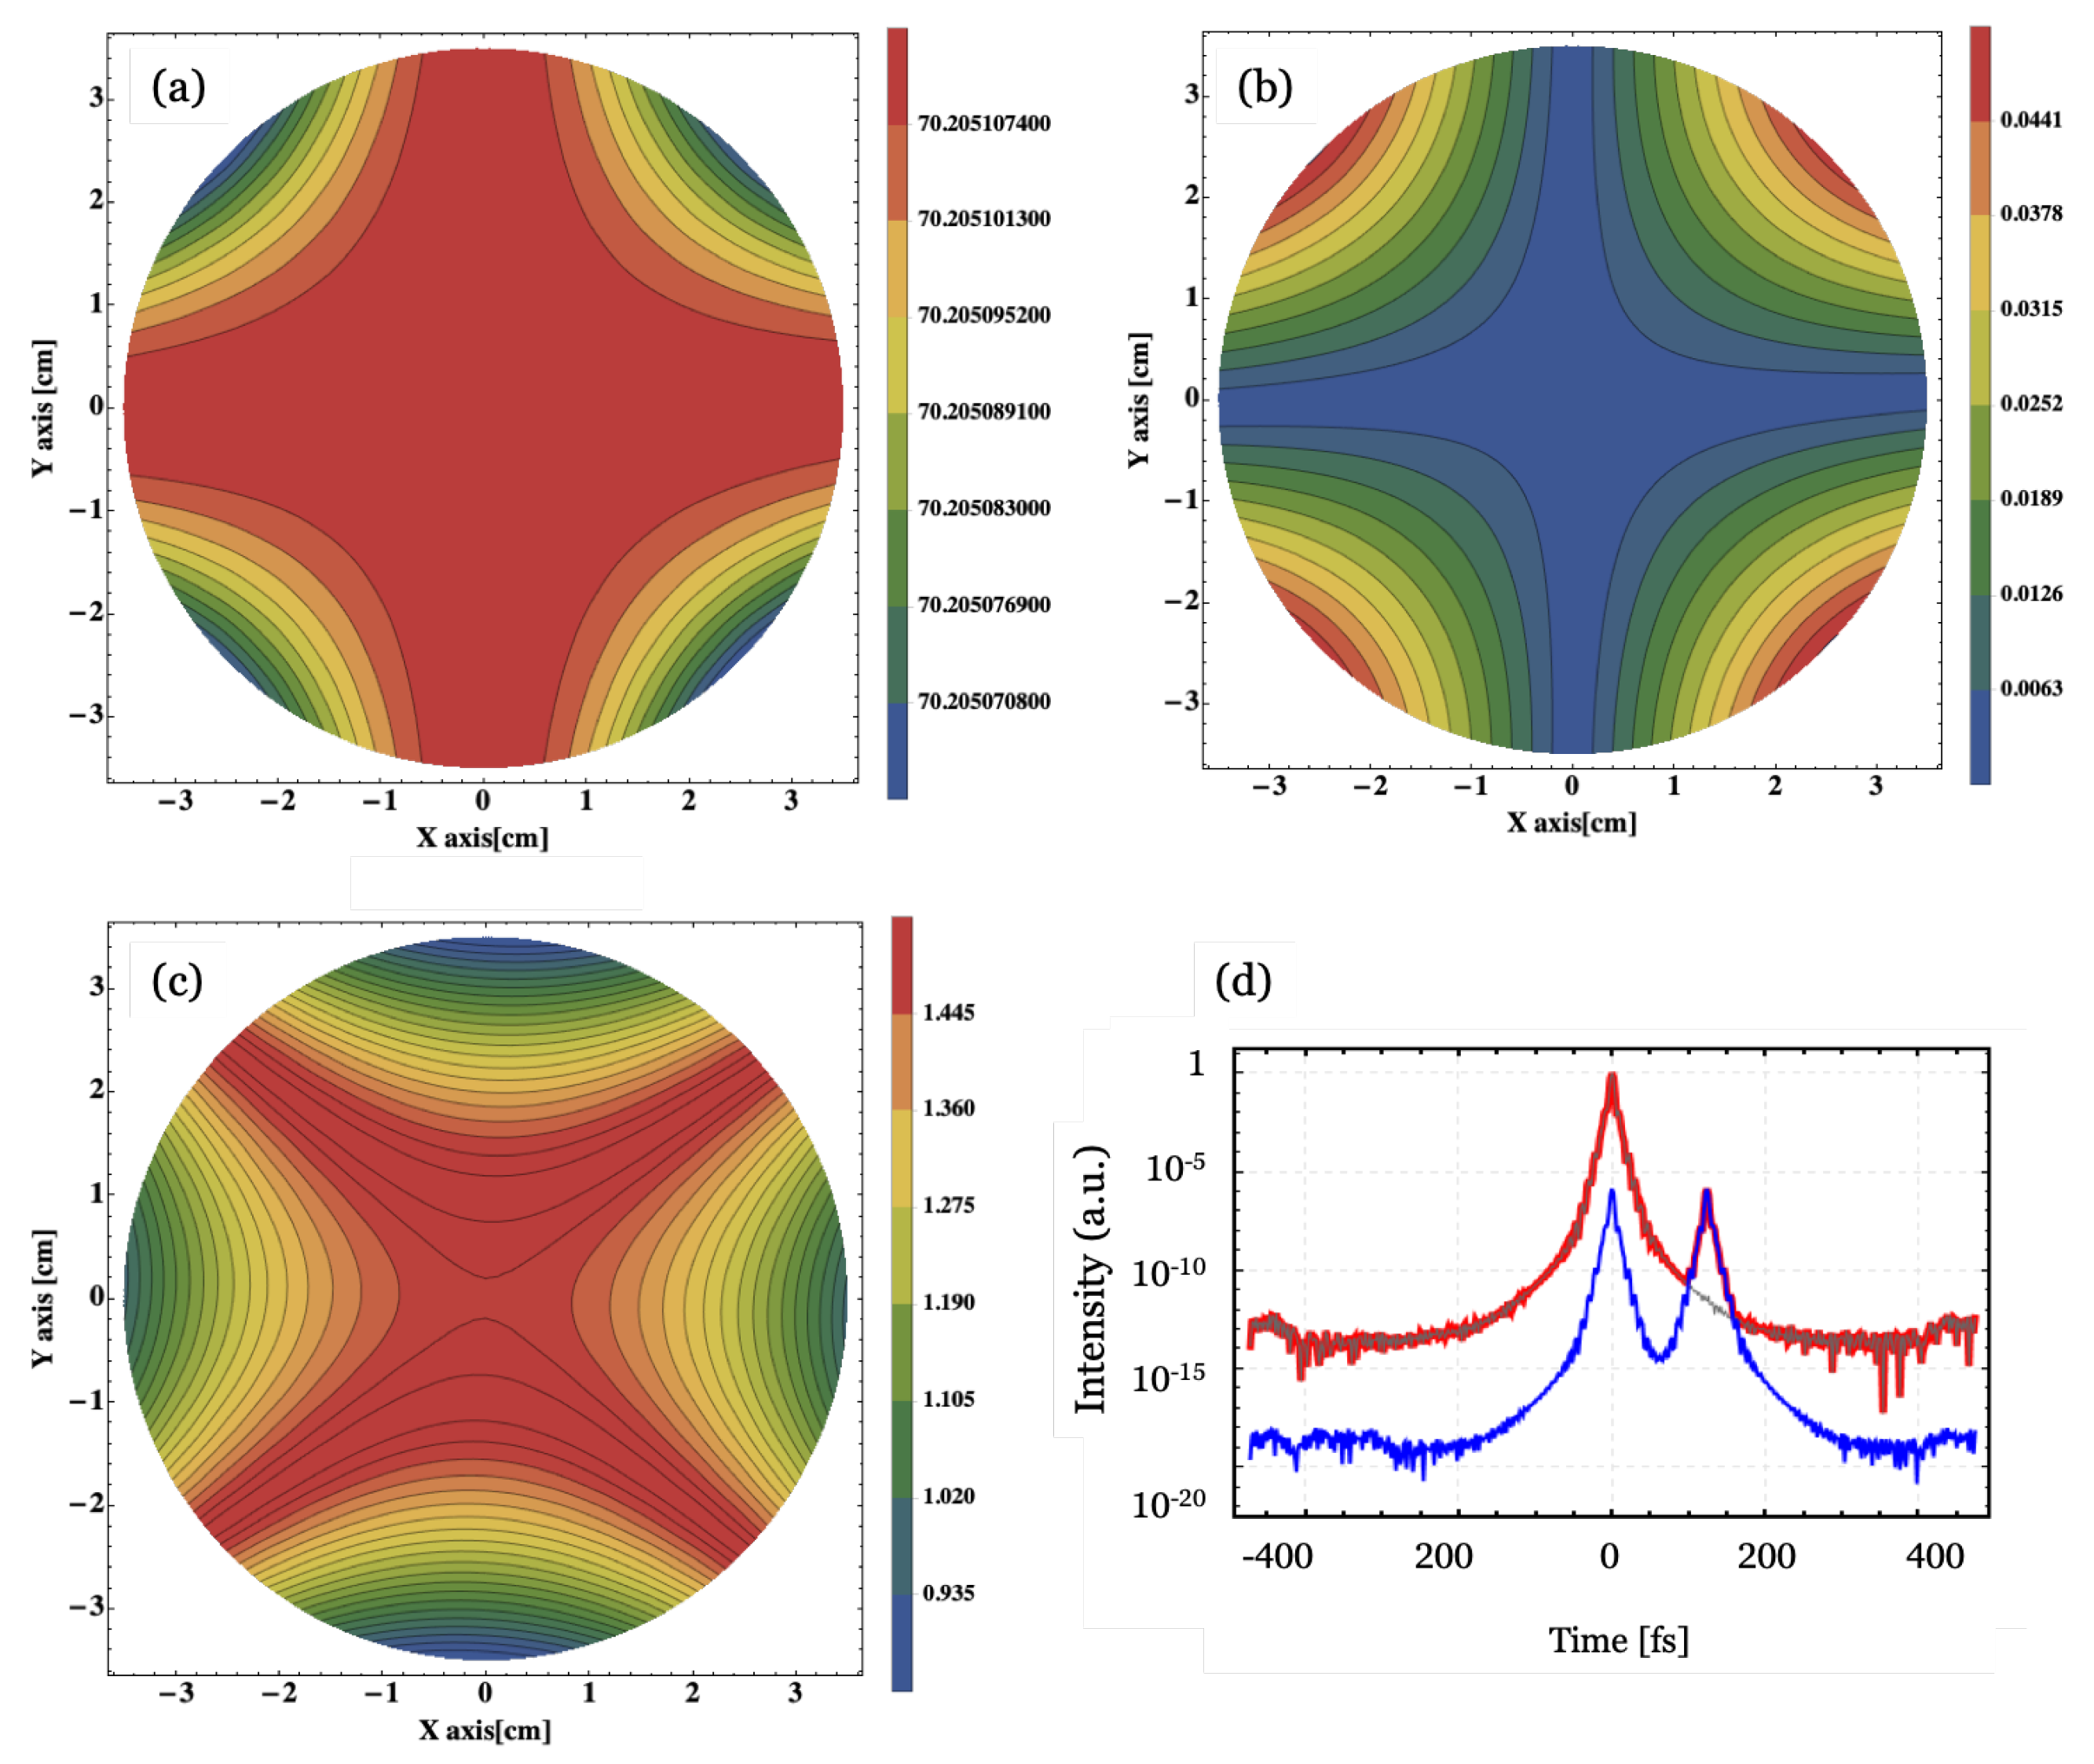
Using the above matrices, a first-order differential equation can be obtained, as expressed in Equation (32). By solving Equation (32), we were able to obtain the shape of the phase distortion due to the thermal birefringence. The distortion due to the thermal birefringence is shown in Figure 14, which differs markedly from that in a non-birefringent medium such as YAG. This is owing to the fact that the previously mentioned linear polarization loss is instantly resolved. The loss of linearly polarized light is small spatially, but the amount of loss is dispersed in time, adversely affecting the temporal contrast ratio.
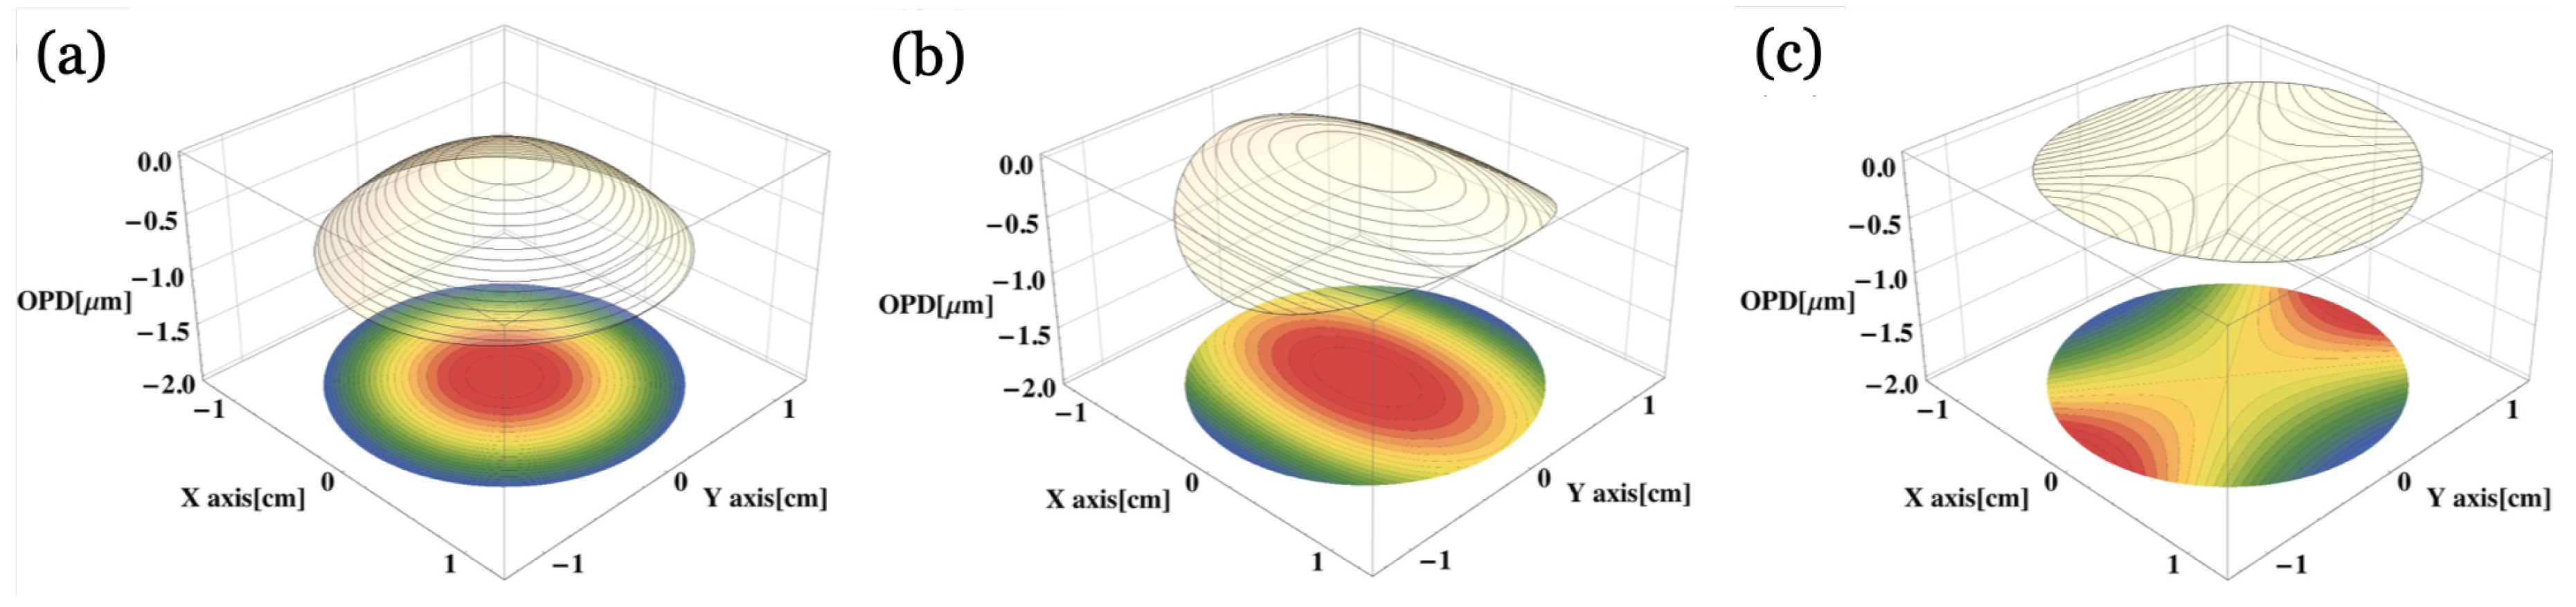
The phase retardation of the medium to be introduced does not form the shape of a single concave lens or a single convex lens [22]. If we express this effect as a Zernike polynomial, we can see that it is convex in the vertical direction and concave in the horizontal direction. Specifically, it is confirmed that the retardation caused by the PE effect induced by the heat birefringence results in an astigmatism aberration of the medium. It is previously known that the thermal distortion induced by Ti:sapphire includes astigmatism [62,63,64]. Until quite recently, the cause of astigmatism is attributed to the anisotropy of the thermal conductivity of the medium. Based on our study, the phase retardation effect due to thermal birefringence can also cause astigmatism.
3.3. Thermal Lens Model
Methods such as optical parametric amplification (OPA) are being attempted to eliminate the cause of the thermal problems. However, the limit of the power is insufficient compared to that in CPA [65,66]. Therefore, even if OPA is used, a hybrid-CPA method using CPA together for generating PW-level pulses is showing its potential. Most CPA laser systems, the medium for generating ultra-high-power pulses is Ti:sapphire, which has excellent mechanical and thermal durability, and so, there is not much demand for research on the thermal distortion effect. In comparison, thermal distortion was a significant issue in the early solid-state laser systems such as Nd:YAG. Related studies have been conducted from the beginning of laser development to the present. In the case of the Ti:sapphire, there was little need to study the thermal effects because of its excellent thermal durability and its thin-disk shape, which is advantageous for reducing thermal-induced distortions [5,17].
The thermal distortion effects that consider both the induced thermal birefringence described in the previous section and the phase delay effect due to the thermal expansion are discussed in this section. The thermal distortion of the medium is generally analyzed by dividing its effect into the temperature dependence of the refractive index, thermal expansion, and thermal birefringence, as shown in Figure 15. Even though this is a general and traditional method, it is suitable for multi PW and tens of hertz high-power laser systems to apply. Also, although not included in our model, a distortion due to the acousto-optical(AO) effect from a vibration caused by Stoke’s conversion should be considered to improve the beam quality [5,17].
The temperature dependence of the refractive index depends on the temperature distribution in the medium. Generally, because ultra-high-power lasers have a pump beam with a uniform distribution, it can be assumed that the heat generation due to the quantum defects in the medium is uniform. In this case, the temperature distribution of the medium appears parabolic in the center. By such a temperature distribution, a lens shape similar to that of a GRIN (Gradient-index) lens is derived and can be expressed by Equation (33). Attempts to homogenize the temperature of the entire medium by controlling the doping rate or junction of undoped YAG, which is often used in high-power solid-state lasers, are intended to prevent changes in the refractive index with temperature.
Temperature dependence of refractive index, , in Equation (33) refers to the amount of change in the refractive index with temperature, and is the temperature difference between the center of the medium and each position. Another effect of temperature rise is thermal expansion. As the temperature of a medium rises, it expands, and this leads to a change in the light path. A rod-shaped medium can be approximated by . However, this formula is not suitable for application to the disc-shaped media employed in high-power laser systems. Related studies are being conducted on a wide variety of materials. Considering both the anisotropy of the material and a disc shape, it is more appropriate that the Ti:sapphire medium used in ultra-high-power lasers is expressed by Equations (34)–(36).
where is the coefficient of thermal expansion, is Poisson’s ratio, is the resistance of thermal expansion, E is Young’s modulus and S is the compliance tensor.
Last, the PE effect can be derived with Equation (32). If we use only the second term for the simplification of the thermal lens expression, the simple lens shape by the PE effect can be expressed as Equation (37). Then finally, we can summarize the thermal lens effect as Equations (38) and (39).
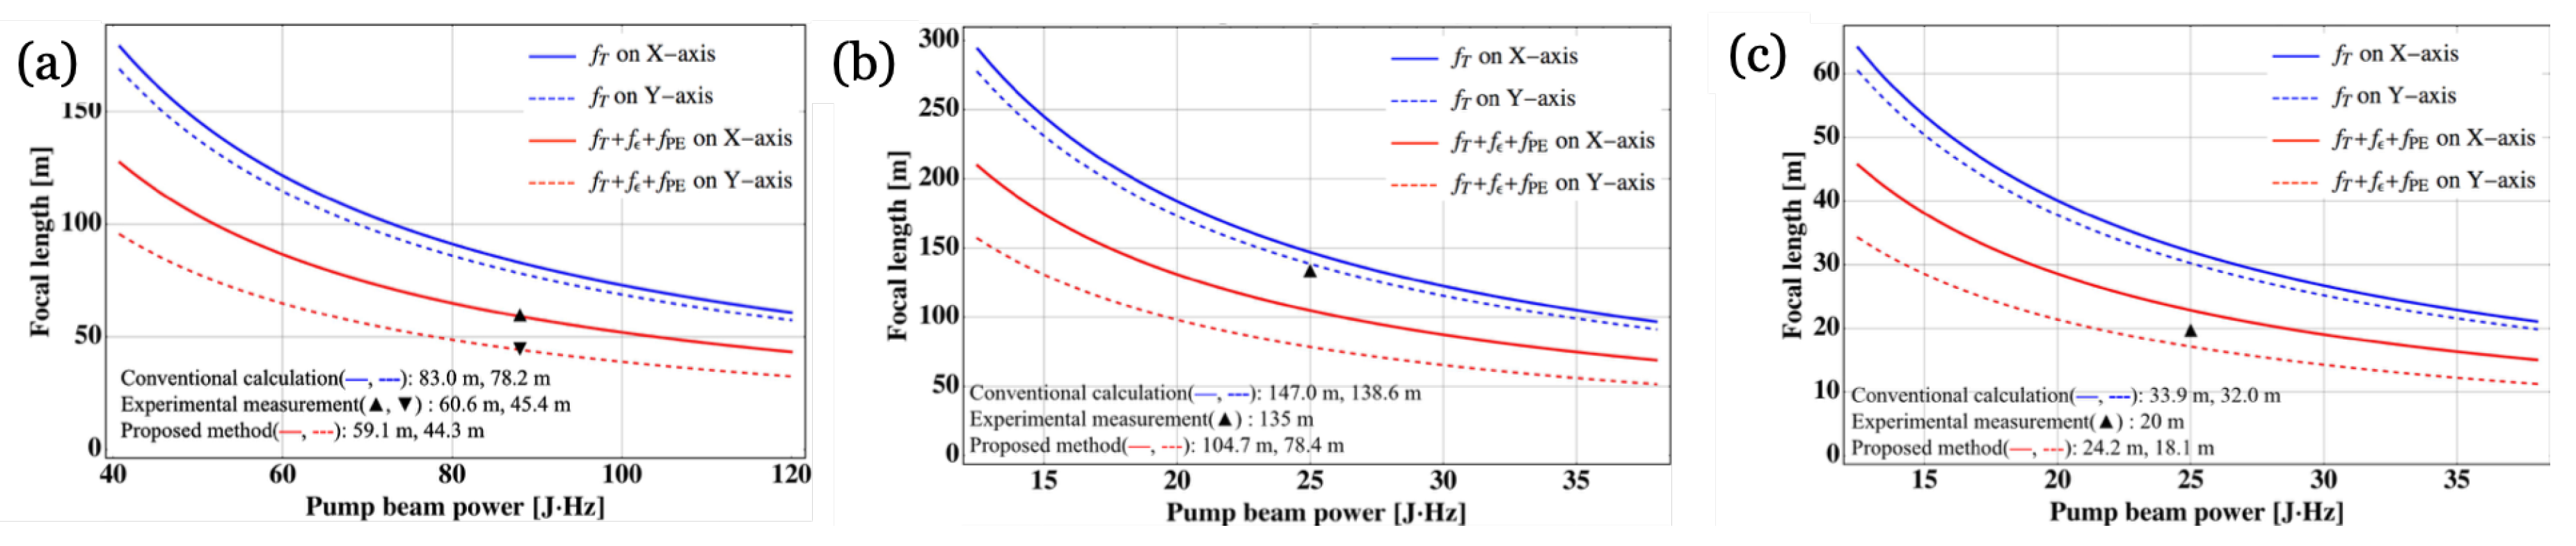
The thermal lens focal length used in the design process of the existing ultra-high-power Ti:sapphire systems only considers the change in the refractive index depending on the temperature. Using the method, we exhibit that more accurate predictions are possible. Figure 16 compares the focal length of another ultra-high-power laser system. The blue and red lines are the estimate that is obtained using a conventional thermal lens focal length equation and using our model, respectively. The triangular markers are the measured thermal focal lengths. The prediction using our model is much more accurate to the measured thermal lens focal length. Knowing the thermal lens focal length easily in the design process of the system is expected to assist in the design of the optical compression system and target chamber behind the amplifier.
4. Summary and Future Outlook
In summary, we have developed a pseudo-analytical method to simulate the amplification of laser pulses accurately and efficiently in the case of an overlap of two polarized orthogonal pulses by modifying the Frantz-Nodvik equation. The developed simulation model can imply a double-pass amplifier with multiple gain media, an overlapped pulse, and arbitrary input pulse shapes. Also, we introduced a square beam homogenizer with high sharpness and uniformity for a PW Ti:sapphire amplifier. The beam homogenizer using lens arrays is effective in improving the efficiency of the amplifier and in making compact high-power laser systems. We also pointed out the thermal effect as another essential consideration for developing high-power lasers. Using the differential Jones matrix, We derive the thermal effect on Ti:sapphire medium. The differential equation models are derived from considering the effects of amplification, intrinsic birefringence, and thermal birefringence. We confirmed the validity of the solution of the differential equation model by comparing it with the measured value of other high-power laser facilities. This review will help to develop high-power laser systems that are actively researched and developed, and the high-power lasers will be profitable in basic science and industrial applications. We are confident we have to focus on effective beam generation, higher repetition rate, and spatio-temporal quality enhancement beyond the generation of high-power pulses. The high-power laser system pursues a compact design for practical applications, so the research need for the high-power laser modeling and analysis will be even higher (Figure 17). Furthermore, the methods presented in this review can be applied to various anisotropic materials and may be useful for studying light modulation effects, and nonlinear effects.
Author Contributions
Investigation, J.J., S.C. and S.H.; writing–original draft preparation, J.J., S.C. and S.H.; writing–review and editing, T.J.Y., B.L.; supervision, T.J.Y., B.L.; project administration, T.J.Y.; funding acquisition, B.L., T.J.Y.
Funding
This work was partially supported by Korea Institute for Advancement of Technology (KIAT), P0008763, “The Competency Development Program for Industrial Specialist” funded by the Ministry of Trade, Industry & Energy (MI, Korea). This work was partially supported by Basic Science Research Program through the National Research Foundation of Korea(NRF) funded by the Ministry of Education (NRF-2018R1D1A3B07050578). This work was partially supported by the Industrial Strategic Technology Development Program, 20000495, “Development of machine learning based alloy powder design and manufacturing platform using plasma high temperature reduction” funded by the Ministry of Trade, Industry & Energy (MI, Korea).
Conflicts of Interest
The authors declare no conflict of interest.
References
- Koechner, W. Solid-State Laser Engineering, 6th ed.; Springer: New York, NY, USA, 2006. [Google Scholar]
- Kiriyama, H.; Mori, M.; Nakai, Y.; Shimomura, T.; Tanoue, M.; Akutsu, A.; Okada, H.; Motomura, T.; Kondo, S.; Kanazawa, S.; et al. Generation of high-contrast and high-intensity laser pulses using an OPCPA preamplifier in a double CPA Ti:sapphire laser system. Opt. Commun. 2009, 282, 625–628. [Google Scholar] [CrossRef]
- Sung, J.H.; Lee, H.W.; Yoo, J.Y.; Yoon, J.W.; Lee, C.W.; Yang, J.M.; Son, Y.J.; Jang, Y.H.; Lee, S.K.; Nam, C.H. 4.2 PW, 20 fs Ti:sapphire laser at 0.1 Hz. Opt. Lett. 2017, 42, 2058–2061. [Google Scholar] [CrossRef] [PubMed]
- Soloviev, A.A.; Burdonov, K.F.; Ginzburg, V.N.; Gonoskov, A.A.; Katin, E.V.; Kim, A.V.; Kirsanov, A.V.; Korzhimanov, A.V.; Kostyukov, I.Y.; Lozhkarev, V.V.; et al. Fast electron generation using PW-class PEARL facility. Nucl. Instrum. Methods Phys. Res. Sect. A Accel. Spectrom. Detect. Assoc. Equip. 2011, 653, 35–41. [Google Scholar] [CrossRef]
- Chu, Y.; Gan, Z.; Liang, X.; Yu, L.; Lu, X.; Wang, C.; Wang, X.; Xu, L.; Lu, H.; Yin, D.; et al. High-energy large-aperture Ti:sapphire amplifier for 5 PW laser pulses. Opt. Lett. 2015, 40, 5011–5014. [Google Scholar] [CrossRef] [PubMed]
- Lureau, F.; Laux, S.; Casagrande, O.; Chalus, O.; Pellegrina, A.; Matras, G.; Radier, C.; Rey, G.; Ricaud, S.; Herriot, S.; et al. Latest results of 10 petawatt laser beamline for ELi nuclear physics infrastructure. SPIE LASE 2016, 9726, 972613–972618. [Google Scholar]
- Divoky, M.; Smrz, M.; Chyla, M.; Sikocinski, P.; Severova, P.; Novak, O.; Huynh, J.; Nagisetty, S.S.; Miura, T.; Pilař, J.; et al. Overview of the HiLASE project: High average power pulsed DPSSL systems for research and industry. High Power Laser Sci. Eng. 2014, 2. [Google Scholar] [CrossRef]
- Danson, C.; Hillier, D.; Hopps, N.; Neely, D. Petawatt class lasers worldwide. High Power Laser Sci. Eng. 2015, 3, 662. [Google Scholar] [CrossRef]
- Papadopoulos, D.N.; Zou, J.P.; Le Blanc, C.; Chériaux, G.; Georges, P.; Druon, F.; Mennerat, G.; Ramirez, P.; Martin, L.; Fréneaux, A.; et al. The Apollon 10 PW laser: Experimental and theoretical investigation of the temporal characteristics. High Power Laser Sci. Eng. 2016, 4. [Google Scholar] [CrossRef]
- Kiriyama, H.; Kando, M.; Pirozhkov, A.; Kishimoto, M.; Kon, A.; Nishiuchi, M.; Sakaki, H.; Ogura, K.; Kanasaki, M.; Tanaka, H.; et al. The Current Status of the J-KAREN Laser Upgrade. In Proceedings of the 2016 Conference on Lasers and Electro-Optics (CLEO), San Jose, CA, USA, 5–10 June 2016. [Google Scholar]
- Hernandez-Gomez, C.; Blake, S.P.; Chek ov, O.; Clarke, R.J.; Dunne, A.M.; Galimberti, M.; Hancock, S.; Heathcote, R.; Holligan, P.; Lyachev, A.; et al. The Vulcan 10 PW project. J. Phys. Conf. Ser. 2010, 244, 032006. [Google Scholar] [CrossRef]
- Kiriyama, H.; Mori, M.; Pirozhkov, A.S.; Ogura, K.; Sagisaka, A.; Kon, A.; Esirkepov, T.Z.; Hayashi, Y.; Kotaki, H.; Kanasaki, M.; et al. High-Contrast, High-Intensity Petawatt-Class Laser and Applications. IEEE J. Select. Top. Quantum Electron. 2015, 21, 232–249. [Google Scholar] [CrossRef]
- Zhu, P.; Xie, X.; Kang, J.; Yang, Q.; Zhu, H.; Guo, A.; Sun, M.; Gao, Q.; Cui, Z.; Liang, X.; et al. Systematic study of spatiotemporal influences on temporal contrast in the focal region in large-aperture broadband ultrashort petawatt lasers. High Power Laser Sci. Eng. 2018, 6, e8. [Google Scholar] [CrossRef]
- Asavei, T.; Tomut, M.; Bobeica, M.; Aogaki, S.; Cernaianu, M.; Ganciu, M.; Kar, S.; Manda, G.; Mocanu, N.; Neagu, L.; et al. Materials in extreme environments for energy, accelerators and space applicaions at ELI-NP. Rom. Rep. Phys. 2016, 68, S275–S347. [Google Scholar]
- Depresseux, A.; Oliva, E.; Gautier, J.; Tissandier, F.; Nejdl, J.; Kozlova, M.; Maynard, G.; Goddet, J.P.; Tafzi, A.; Lifschitz, A.; et al. Table-top femtosecond soft X-ray laser by collisional ionization gating. Nat. Photonics 2015, 9, 817–821. [Google Scholar] [CrossRef]
- Didenko, N.V.; Konyashchenko, A.V.; Lutsenko, A.P. Contrast degradation in a chirped-pulse amplifier due to generation of prepulses by postpulses. Opt. Express 2008, 16, 3178–3190. [Google Scholar] [CrossRef] [PubMed]
- Yu, T.J.; Lee, S.K.; Sung, J.H.; Yoon, J.W.; Jeong, T.M.; Lee, J. Generation of high-contrast, 30 fs, 1.5 PW laser pulses from chirped-pulse amplification Ti:sapphire laser. Opt. Express 2012, 20, 10807–10815. [Google Scholar] [CrossRef]
- Frantz, L.M.; Nodvik, J.S. Theory of pulse propagation in a laser amplifier. J. Appl. Phys. 1963, 34, 2346–2349. [Google Scholar] [CrossRef]
- Jeong, J.; Cho, S.; Yu, T.J. Numerical extension of Frantz–Nodvik equation for double-pass amplifiers with pulse overlap. Opt. Express 2017, 25, 3946–3953. [Google Scholar] [CrossRef]
- Hwang, S.J.; Kim, T.; Lee, J.; Yu, T.J. Design of squared-shaped beam homogenizer for petawatt-class Ti:sapphire amplifer. Opt. Express 2017, 25, 9511–9520. [Google Scholar] [CrossRef] [PubMed]
- Cho, S.; Jeong, J.; Yu, T.J. Jones calculus modeling and analysis of the thermal distortion in a Ti:sapphire laser amplifier. Opt. Express 2016, 24, 14362–14373. [Google Scholar] [CrossRef] [PubMed]
- Cho, S.; Jeong, J.; Hwang, S.; Yu, T.J. Thermal lens effect model of Ti:sapphire for use in high-power laser amplifiers. Appl. Phys. Express 2018, 11, 092701. [Google Scholar] [CrossRef]
- Hwang, S.J.; Jeong, J.; Cho, S.; Lee, J.; Yu, T.J. Femtosecond Laser Pulse Distortion in Ti:Sapphire Multipass Amplifier by Atomic Phase Shifts. J. Korean Phys. Soc. 2017, 71, 652–656. [Google Scholar] [CrossRef]
- Diels, J.-C.; Rudolph, W. Ultrashort Laser Pulse Phenomena: Fundamentals, Techniques, and Applications on a Femtosecond Time Scale, 2nd ed.; Elsevier/Academic Press: Amsterdam, The Netherlands, 2006. [Google Scholar]
- Strickland, D.; Mourou, G. Compression of amplified chirped optical pulses. Opt. Commun. 1985, 55, 447–449. [Google Scholar] [CrossRef]
- Eggleston, J.M.M.; Frantz, L.M.M.; Injeyan, H. Derivation of the Frantz-Nodvik Equation for Zig-Zag Optical Path, Slab Geometry Laser Amplifiers. IEEE J. Quantum Electron. 1989, 25, 1855–1862. [Google Scholar] [CrossRef]
- Pearce, S.; Ireland, C.L.M.L.M.; Dyer, P.E.E. Simplified analysis of double-pass amplification with pulse overlap and application to Nd:YVO4 laser. Opt. Commun. 2005, 255, 297–303. [Google Scholar] [CrossRef]
- Rapoport, W.R.; Khattak, C.P. Titanium sapphire laser characteristics. Appl. Opt. 1988, 27, 2677. [Google Scholar] [CrossRef] [PubMed]
- Burton, H.; Debardelaben, C.; Amir, W.; Planchon, T.A. Temperature dependence of Ti:Sapphire fluorescence spectra for the design of cryogenic cooled Ti:Sapphire CPA laser. Opt. Express 2017, 25, 6954. [Google Scholar] [CrossRef] [PubMed]
- Webster, A. Useful Mathematical Formulas for Transform Limited Pulses. Available online: http://falsecolour.com/aw/pulses/pulses.pdf (accessed on 18 September 2018).
- The Nobel Prize in Physics 2018. Available online: https://www.nobelprize.org/prizes/physics/2018/summary/ (accessed on 23 October 2018).
- Treacy, E.B. Optical Pulse Compression With Diffraction Gratings. IEEE J. Quantum Electron. 1969, 5, 454–458. [Google Scholar] [CrossRef]
- Martinez, O.E. 3000 times grating compressor with positive group velocity dispersion: Application to fiber compensation in 1.3-1.6 μm region. IEEE J. Quantum Electron. 1987, 23, 59–64. [Google Scholar] [CrossRef]
- Offner, A.; Darien, C.U.S. Unit Power Imaging Catoptric Anastigmat. U.S. Patent 3,748,015, 21 June 1971. [Google Scholar]
- Cheriaux, G.; Walker, B.; Dimauro, L.F.; Rousseau, P.; Salin, F.; Chambaret, J.P. Aberration-free stretcher design for ultrashort-pulse amplification. Opt. Lett. 1996, 21, 414. [Google Scholar] [CrossRef]
- Tournois, P. Acousto-optic programmable dispersive filter for adaptive compensation of group delay time dispersion in laser systems. Opt. Commun. 1997, 140, 245–249. [Google Scholar] [CrossRef]
- Ricci, A.; Jullien, A.; Forget, N.; Crozatier, V.; Tournois, P.; Lopez-Martens, R. Grism compressor for carrier-envelope phase-stable millijoule-energy chirped pulse amplifier lasers featuring bulk material stretcher. Opt. Lett. 2012, 37, 1196–1198. [Google Scholar] [CrossRef] [PubMed]
- Forget, N.; Crozatier, V.; Tournois, P. Transmission Bragg-grating grisms for pulse compression. Appl. Phys. B Lasers Opt. 2012, 109, 121–125. [Google Scholar] [CrossRef]
- Blanchot, N.; Bar, E.; Behar, G.; Bellet, C.; Bigourd, D.; Boubault, F.; Chappuis, C.; Coïc, H.; Damiens-Dupont, C.; Flour, O.; et al. Experimental demonstration of a synthetic aperture compression scheme for multi-Petawatt high-energy lasers. Opt. Express 2010, 18, 10088. [Google Scholar] [CrossRef] [PubMed]
- Mourou, G.; Tajima, T. More Intense, Shorter Pulses. Science 2011, 331, 41–42. [Google Scholar] [CrossRef] [PubMed]
- McCumber, D.E. Theory of Phonon-Terminated Optical Masers. Phys. Rev. 1964, 134, A299–A306. [Google Scholar] [CrossRef]
- Jeong, J.; Cho, S.; Hwang, S.; Yu, T.J. Frequency-Modulated Pulse-Amplification Method for Reducing Pulse Shape Distortion. J. Korean Phys. Soc. 2018, 73, 1637–1643. [Google Scholar] [CrossRef]
- Park, D.; Jeong, J.; Yu, T.J. Optimization of the pulse width and injection time in a double-pass laser amplifier. High Power Laser Sci. Eng. 2018, 6, e60. [Google Scholar] [CrossRef]
- Sung, J.H.; Lee, S.K.; Yu, T.J.; Jeong, T.M.; Lee, J. 0.1 Hz 1.0 PW Ti:sapphire laser. Opt. Lett. 2010, 35, 3021–3023. [Google Scholar] [CrossRef] [PubMed]
- Yoon, J.W.; Lee, S.K.; Yu, T.J.; Sung, J.H.; Jeong, T.M.; Lee, J. Improvement of contrast ratio in saturated OPCPA system by using pump pulse shaping and time delay control. Opt. Commun. 2012, 285, 4112–4116. [Google Scholar] [CrossRef]
- Kiriyama, H.; Pirozhkov, A.S.; Nishiuchi, M.; Fukuda, Y.; Ogura, K.; Sagisaka, A.; Miyasaka, Y.; Mori, M.; Sakaki, H.; Dover, N.P.; et al. High-contrast high-intensity repetitive petawatt laser. Opt. Lett. 2018, 43, 2595. [Google Scholar] [CrossRef]
- Gan, Z.; Yu, L.; Li, S.; Wang, C.; Liang, X.; Liu, Y.; Li, W.; Guo, Z.; Fan, Z.; Yuan, X.; et al. 200 J high efficiency Ti:sapphire chirped pulse amplifier pumped by temporal dual-pulse. Opt. Express 2017, 25, 5169. [Google Scholar] [CrossRef] [PubMed]
- Chvykov, V.; Nees, J.; Krushelnick, K. Transverse amplified spontaneous emission: The limiting factor for output energy of ultra-high power lasers. Opt. Commun. 2014, 312, 216–221. [Google Scholar] [CrossRef]
- Chvykov, V.V.; Yanovsky, V.P.; Bahk, S.W.; Kalintchenko, G.; Mourou, G. Suppression of parasitic lasing in multi-pass Ti-sapphire amplifiers. In Conference on Lasers and Electro-Optics; Optical Society of America: Baltimore, MD, USA, 2003; p. CWA34. [Google Scholar]
- Ertel, K.; Hooker, C.; Hawkes, S.J.; Parry, B.T.; Collier, J.L. ASE suppression in a high energy Titanium sapphire amplifier. Opt. Express 2008, 16, 8039. [Google Scholar] [CrossRef] [PubMed]
- Ezra, N.; Arshanapalli, A.; Bednarek, R.; Akaishi, S.; Somani, A.-K. The microsecond 1064 nm Nd:YAG laser as an adjunct to improving surgical scars following Mohs micrographic surgery. J. Cosmet. Laser Ther. 2016, 18, 225–229. [Google Scholar] [CrossRef] [PubMed]
- Siniaeva, M.L.; Siniavsky, M.N.; Pashinin, V.P.; Mamedov, A.A.; Konov, V.I.; Kononenko, V.V. Laser ablation of dental materials using a microsecond Nd:YAG laser. Laser Phys. 2009, 19, 1056–1060. [Google Scholar] [CrossRef]
- Choubey, A.; Jain, R.K.; Ali, S.; Singh, R.; Vishwakarma, S.C.; Agrawal, D.K.; Arya, R.; Kaul, R.; Upadhyaya, B.N.; Oak, S.M. Studies on pulsed Nd:YAG laser cutting of thick stainless steel in dry air and underwater environment for dismantling applications. Opt. Laser Technol. 2015, 71, 6–15. [Google Scholar] [CrossRef]
- Kumar, N.; Mukherjee, M.; Bandyopadhyay, A. Comparative study of pulsed Nd:YAG laser welding of AISI 304 and AISI 316 stainless steels. Opt. Laser Technol. 2017, 88, 24–39. [Google Scholar] [CrossRef]
- Wang, H.; Lin, H.; Wang, C.; Zheng, L.; Hu, X. Laser drilling of structural ceramics—A review. J. Eur. Ceram. Soc. 2017, 37, 1157–1173. [Google Scholar] [CrossRef]
- Keppler, S.; Hornung, M.; Bödefeld, R.; Sävert, A.; Liebetrau, H.; Hein, J.; Kaluza, M.C. Full characterization of the amplified spontaneous emission from a diode-pumped high-power laser system. Opt. Express 2014, 22, 11228. [Google Scholar] [CrossRef]
- Keppler, S.; Sävert, A.; Körner, J.; Hornung, M.; Liebetrau, H.; Hein, J.; Kaluza, M.C. The generation of amplified spontaneous emission in high-power CPA laser systems. Laser Photon. Rev. 2016, 10, 264–277. [Google Scholar] [CrossRef]
- Voelkel, R.; Weible, K.J. Laser beam homogenizing: Limitations and constraints. Proc. SPIE 2010, 7102, 71020J. [Google Scholar] [CrossRef]
- Fuse, K. Flattop beam generation and multibeam processing using aspheric and diffractive optics. J. Laser Micro. Nanoen. 2010, 5, 156–162. [Google Scholar] [CrossRef]
- Nye, J.F. Physical Properties of Crystals; Oxford University Press: Oxford, UK, 1985. [Google Scholar]
- Martienssen, W.; Warlimont, H. Springer Handbook of Condensed Matter and Materials Data; Springer Science & Business Media: Berlin, Germany, 2006. [Google Scholar]
- Sung, J.H.; Jeong, T.M.; Lee, S.K.; Yu, T.J.; Choi, I.W.; Lee, J. Analysis of Thermal Aberrations in the Power Amplifiers of a 10-Hz 100-TW Ti:sapphire Laser. J. Korean Phys. Soc. 2009, 55, 495–500. [Google Scholar] [CrossRef]
- Wu, F.; Yu, L.; Lu, J.; Li, W.; Xu, Y.; Leng, Y. Suppression of thermal lens effect in high-pulse-energy Ti:sapphire amplifiers. Opt. Laser Technol. 2017, 87, 94–98. [Google Scholar] [CrossRef]
- Ito, S.; Nagaoka, H.; Miura, T.; Kobayashi, K.; Endo, A.; Torizuka, K. Measurement of thermal lensing in a power amplifier of a terawatt Ti:sapphire laser. Appl. Phys. B Lasers Opt. 2002, 74, 343–347. [Google Scholar] [CrossRef]
- Khodakovskiy, N.; Kalashnikov, M.; Gontier, E.; Falcoz, F.; Paul, P.-M. Degradation of picosecond temporal contrast of Ti:sapphire lasers with coherent pedestals. Opt. Lett. 2016, 41, 4441–4444. [Google Scholar] [CrossRef] [PubMed]
- Papadopoulos, D.N.; Ramirez, P.; Genevrier, K.; Ranc, L.; Lebas, N.; Pellegrina, A.; Le Blanc, C.; Monot, P.; Martin, L.; Zou, J.P.; et al. High-contrast 10 fs OPCPA-based front end for multi-PW laser chains. Opt. Lett. 2017, 42, 3530. [Google Scholar] [CrossRef]
Figure 1.
(a) A square seed pulse; (b) The solid lines show the amplified output pulse shape for a square seed pulse. They depict the depletion effect during the amplification.
Figure 1.
(a) A square seed pulse; (b) The solid lines show the amplified output pulse shape for a square seed pulse. They depict the depletion effect during the amplification.

Figure 2.
(a) Seed pulse (blue line) and corresponding square pulse train. (b) Amplified pulse shapes calculated by using Equation (3) (blue line) and Equations (7) and (8) (red pulse train). Depletion of stored energy in a gain medium as a function of (c) time and (d) time and position (optical path direction).

Figure 3.
Definitions of inputs and outputs in double-pass geometry.

Figure 4.
(a) History of laser intensity [40] and (b) a schematic of a chirped pulse amplification (CPA) system [25].

Figure 5.
An example of a time-dependent emission cross-section change. Ti:sapphire medium characteristics and an Öffner stretcher with (the central wavelength of 800 nm, focal length of concave mirror of 0.9 m, the gap between the grating(14000 groove per cm) and the concave mirror of 1.5 m, and of 42.6°) are assumed for this calculation.

Figure 6.
Change of stored energy over time when a 10-ns (FWHM) pump pulse is applied to Ti:sapphire. Change in the stored energy in a time domain of the same order (a) as the input pulse and pulse width and (b) as the fluorescence lifetime.
Figure 6.
Change of stored energy over time when a 10-ns (FWHM) pump pulse is applied to Ti:sapphire. Change in the stored energy in a time domain of the same order (a) as the input pulse and pulse width and (b) as the fluorescence lifetime.

Figure 7.
(a) Multi-pass Ti:sapphire amplifier. (b) setting 1 simulation. (c) setting 2 simulation.

Figure 8.
(a) Edge steepness of the pump beam and the energy extraction efficiency, (b) The spatial uniformity of the pump beam and the amplified beam according to the design parameters of the beam shaping system; .
Figure 8.
(a) Edge steepness of the pump beam and the energy extraction efficiency, (b) The spatial uniformity of the pump beam and the amplified beam according to the design parameters of the beam shaping system; .

Figure 9.
Pumping the gain medium using a square beam (a) multiple circular beams (b) beamlets divided by a lens array (c) square-shaped pump beam.
Figure 9.
Pumping the gain medium using a square beam (a) multiple circular beams (b) beamlets divided by a lens array (c) square-shaped pump beam.

Figure 10.
Petawatt laser amplifier chain.

Figure 11.
(a) The output spectra of the amplifier and (b) atomic phase shifts.

Figure 12.
(a) The output spectrum of the amplifier chain and the accumulated atomic phase shift, (b) the compressed pulse distortion due to the atomic phase shifts.
Figure 12.
(a) The output spectrum of the amplifier chain and the accumulated atomic phase shift, (b) the compressed pulse distortion due to the atomic phase shifts.

Figure 13.
Forms of the piezo-optical tensors, , of the isotropic, the cubic and the trigonal structure.
Figure 13.
Forms of the piezo-optical tensors, , of the isotropic, the cubic and the trigonal structure.

Figure 14.
(a) The linear polarized E-field amplitude gain map of Ti:sapphire amplifier, (b) The depolarized component ratio of Ti:sapphire amplifier, (c) The wavefront distortion by the phase retardant of amplified beam, (d) The temporal shape of amplified pulse, the red line is amplified beam and the blue one is depolarized component of the beam (Simulation condition: is 120 J@ 1 Hz, the radius is 3.5 cm and the thickness is 2 cm).

Figure 15.
Wavefront shapes induced by the thermal effect (a) by the temperature-dependent refractive index change, (b) by the thermal expansion, and (c) by the PE effect of the Ti:sapphire crystal, in case of [62].
Figure 15.
Wavefront shapes induced by the thermal effect (a) by the temperature-dependent refractive index change, (b) by the thermal expansion, and (c) by the PE effect of the Ti:sapphire crystal, in case of [62].

Figure 16.
The focal lengths of the thermal lens, where the blue lines indicate the results of the conventional equations and red lines indicate the results obtained using the equations derived in this study, (a–c) is the case of [62,63,64], respectively.

Figure 17.
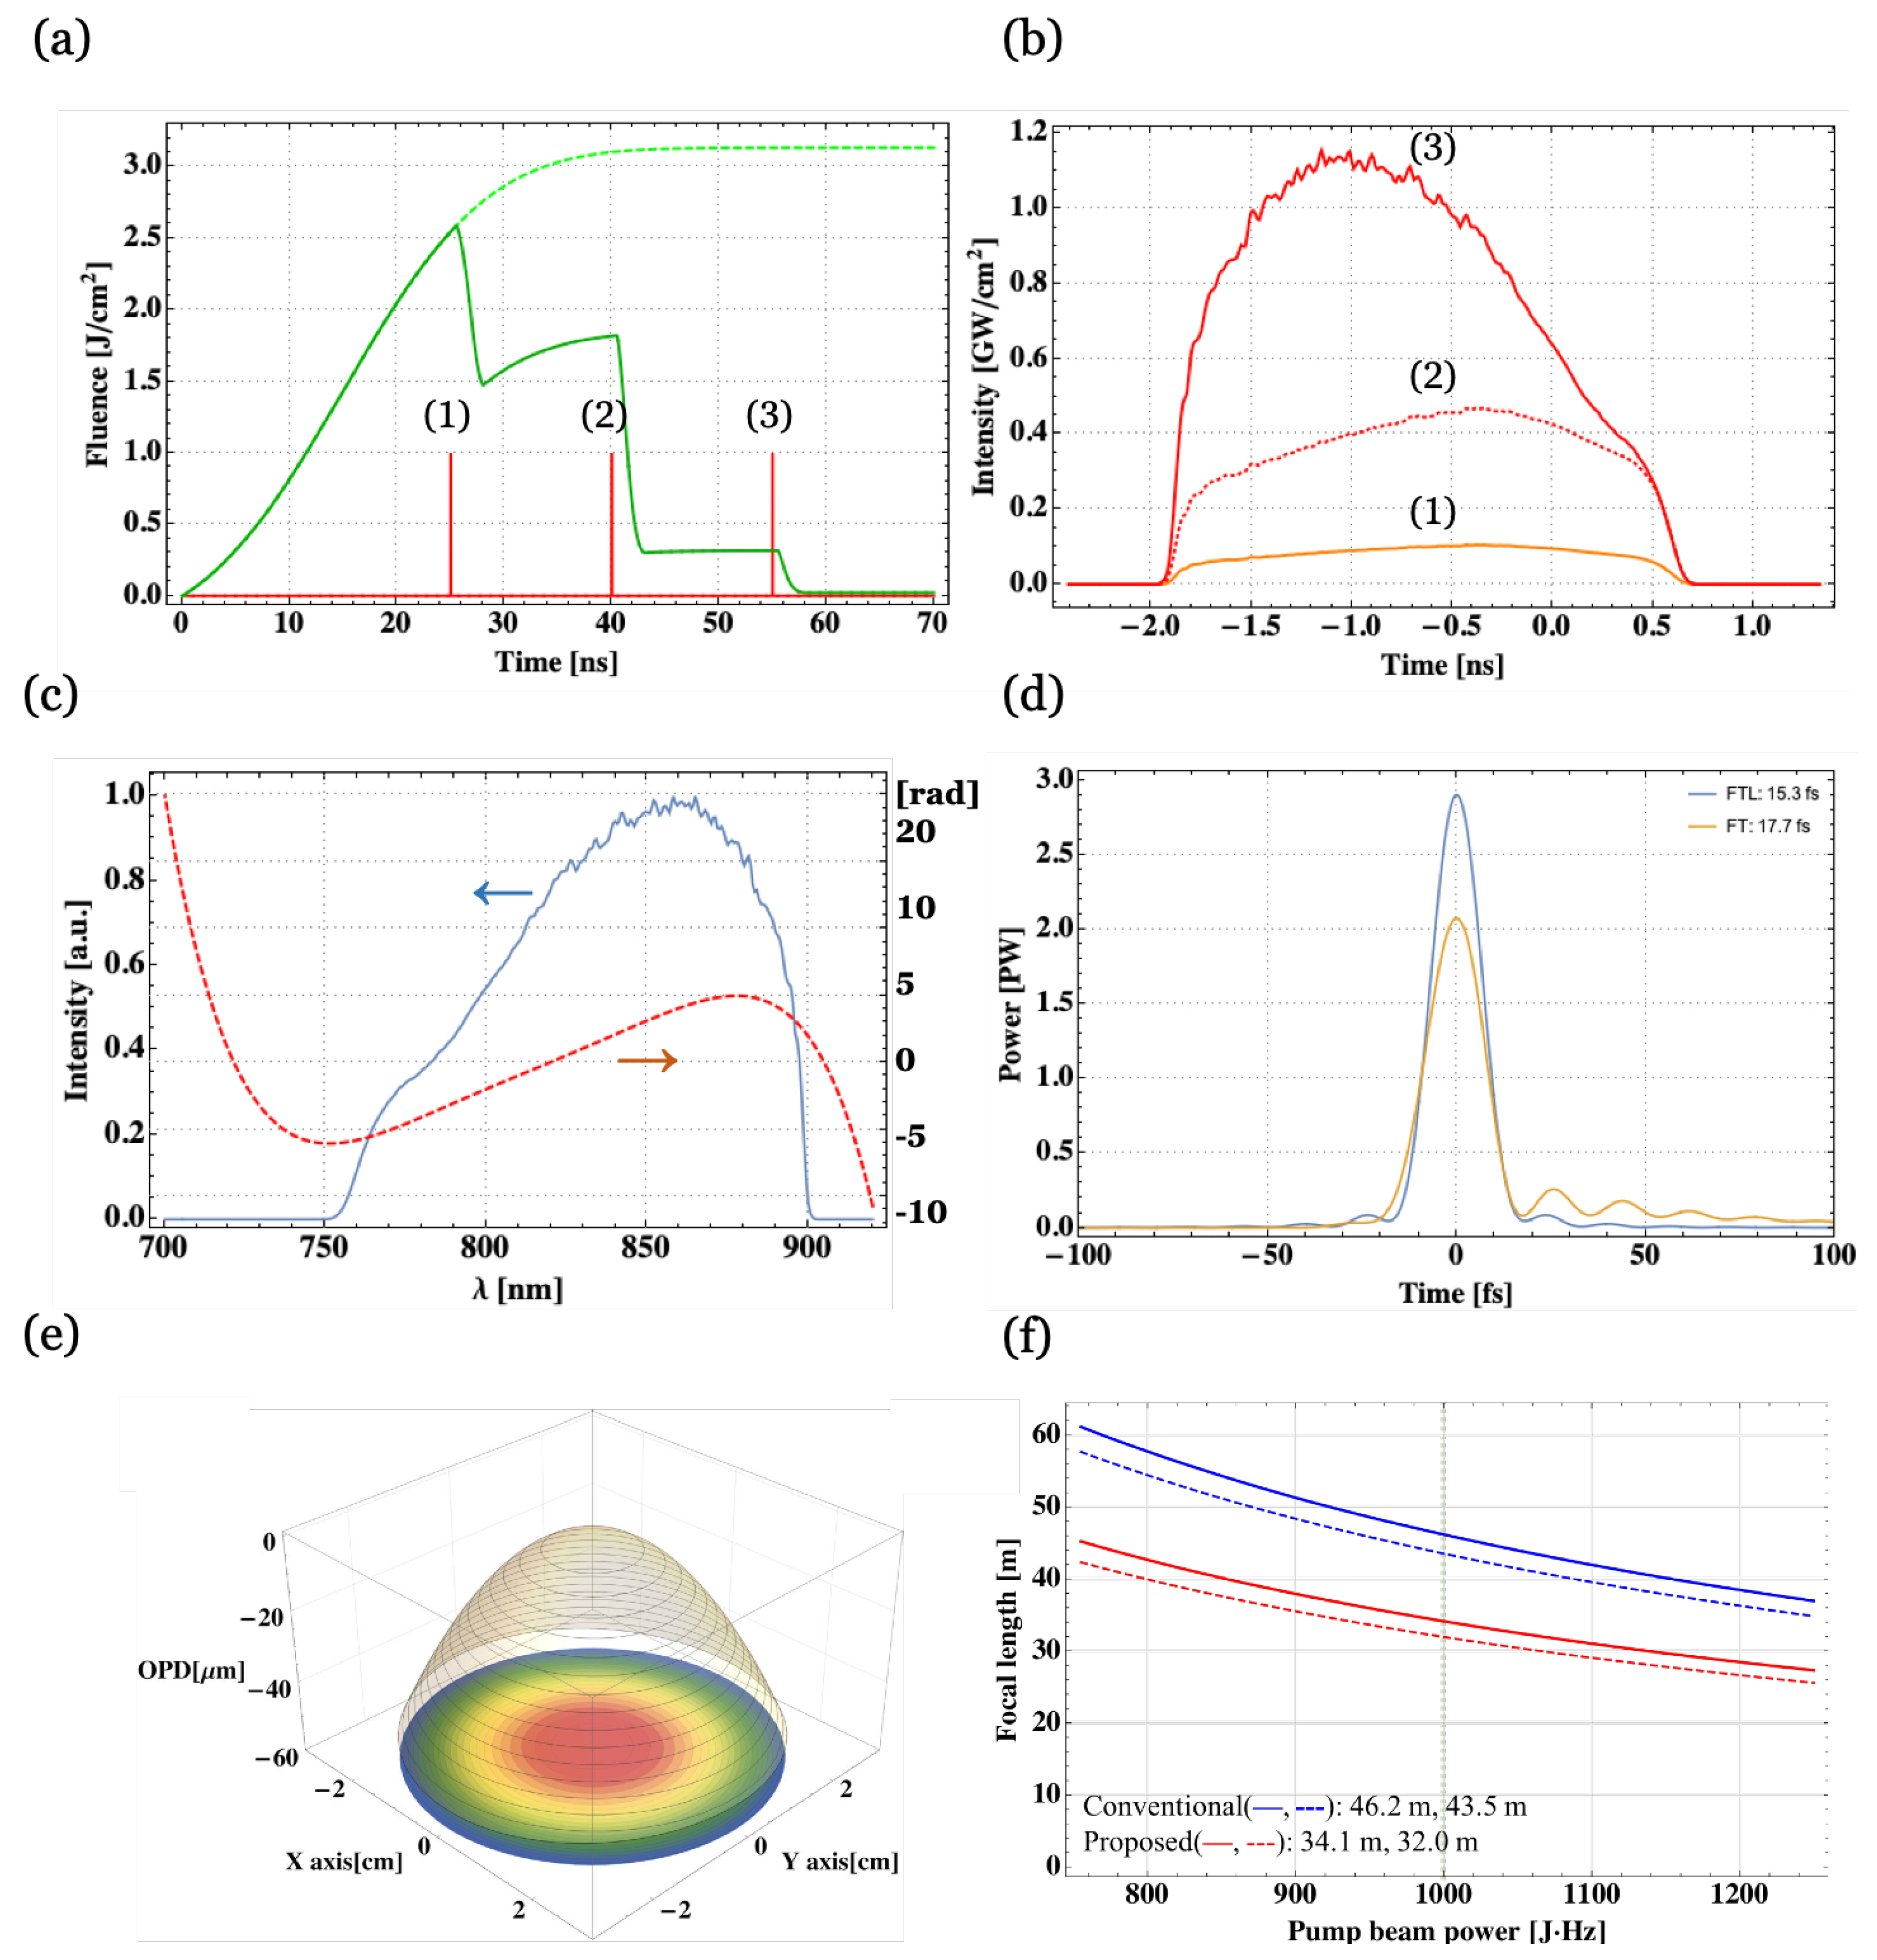
Results of the 2 PW laser system simulation; (a) Rendering image; (b) Residual pump energy changes and injection timing; (c) The intensity of the amplified pulse by time; (d) The spectral intensity of amplified beam and optical-compress condition; (e) The temporal shape of the optically compressed pulse; (f) The thermally induced OPD (Optical Path Difference) profile; (g) The expected focal length of the thermal lens effect; when pump energy of the final amplifier is 120 J, repetition rates is 8 Hz.
Figure 17.
Results of the 2 PW laser system simulation; (a) Rendering image; (b) Residual pump energy changes and injection timing; (c) The intensity of the amplified pulse by time; (d) The spectral intensity of amplified beam and optical-compress condition; (e) The temporal shape of the optically compressed pulse; (f) The thermally induced OPD (Optical Path Difference) profile; (g) The expected focal length of the thermal lens effect; when pump energy of the final amplifier is 120 J, repetition rates is 8 Hz.

© 2019 by the authors. Licensee MDPI, Basel, Switzerland. This article is an open access article distributed under the terms and conditions of the Creative Commons Attribution (CC BY) license (http://creativecommons.org/licenses/by/4.0/).
Share and Cite
MDPI and ACS Style
Jeong, J.; Cho, S.; Hwang, S.; Lee, B.; Yu, T.J. Modeling and Analysis of High-Power Ti:sapphire Laser Amplifiers–A Review. Appl. Sci. 2019, 9, 2396. https://doi.org/10.3390/app9122396
AMA Style
Jeong J, Cho S, Hwang S, Lee B, Yu TJ. Modeling and Analysis of High-Power Ti:sapphire Laser Amplifiers–A Review. Applied Sciences. 2019; 9(12):2396. https://doi.org/10.3390/app9122396
Chicago/Turabian StyleJeong, Jihoon, Seryeyohan Cho, Seungjin Hwang, Bongju Lee, and Tae Jun Yu. 2019. "Modeling and Analysis of High-Power Ti:sapphire Laser Amplifiers–A Review" Applied Sciences 9, no. 12: 2396. https://doi.org/10.3390/app9122396
Note that from the first issue of 2016, this journal uses article numbers instead of page numbers. See further details here.