Article

Femtosecond Beam Transformation Effects in Water, Enabling Increased Throughput Micromachining in Transparent Materials

Laser Research Center, Faculty of Physics, Vilnius University, Saulėtekio Ave. 10, LT-10223 Vilnius, Lithuania
*
Author to whom correspondence should be addressed.
Appl. Sci. 2019, 9(12), 2405; https://doi.org/10.3390/app9122405
Submission received: 16 May 2019 / Revised: 7 June 2019 / Accepted: 9 June 2019 / Published: 13 June 2019
(This article belongs to the Special Issue Ultrafast Laser Pulses)

Abstract

:

Featured Application

Precise cutting, drilling, scribing of deep structures in transparent and non-transparent materials. The technique enables rapid deep (>500 µm) structure formation with relatively low average power (<10 W) femtosecond systems.

Abstract

Femtosecond lasers are widely applied in scientific and industrial fields. Recent trends in the laser market show decreasing prices for femtosecond units, which will ultimately lead to the opening of new markets that were inaccessible in the past due to the high costs of such systems. To this end, new techniques that enable micromachining of materials with increased efficiency are interesting. In this article, we demonstrate a technique that may be used for cutting and drilling various materials. By placing a layer of water on top of the samples and loosely focusing laser light on the surface, it was found that the micromachining throughput is increased by up to 10-fold as compared with micromachining without the water layer (conventional focusing in air), however, the main reasons for the increase in fabrication efficiency have not been fully understood until now. By modelling the propagation of the femtosecond pulses by means of the nonlinear modified Schrodinger equation through the water layer, we show that the increased throughput is attributed to the changing of the Gaussian intensity profile. In addition, we confirm these findings by numerically modelling the ablated crater formation.

1. Introduction

Due to the high precision and low thermal damage offered by ultrashort-pulse micromachining, femtosecond laser systems are widely applied in both industrial and scientific fields [1]. Though the advantages of such systems as compared with longer-pulse micromachining (or nonlaser-based micromachining [2]) are unquestioned, the constantly advancing industry requires higher micromachining throughput, better end-quality, and higher versatility in terms of machining materials [3,4]. In this case, femtosecond pulse micromachining offers a unique advantage since the energy of the pulses is absorbed through a non-linear interaction mechanisms, therefore, enabling the micromachining of virtually any type of material [5]. Recently, there is a growing trend towards high average power (>100 W) femtosecond laser systems, and in addition, the price/Watt is decreasing [6,7]. In general, although higher average power leads to an increase in processing throughput, maintaining process efficiency comparable to lower power systems without introducing additional thermal damage is a great challenge [8]. The main issue is that high pulse energies that lead to fluence values which exceed the ablation threshold by more than two orders of magnitude are not particularly preferred for precise micromachining. This is due to the decrease in ablation efficiency, i.e., the energy absorbed in the material is transferred to the kinetic energy of the ablation debris or/and the shock wave development, in which case the excess power is not used for material removal but rather for heating the ablated mass [9]. A possible workaround would be to use spatial light modulators (SLM) or various diffractive optical elements (DOE) that enable parallel processing of multiple samples at once, however such an approach is not always favourable due to its limited use for specific applications only, and its overall complexity. A different scenario may occur if the high average power laser system is realized by means of high repetition rates (>10 MHz). In this case, the fluence may be chosen closer to its optimum setting [10], however the pulse-to-pulse time becomes small enough for heat accumulation to significantly decrease the end-quality of the micromachined samples [11,12], especially near the tails of the Gaussian beam. This is a typical problem for high average power systems. Outcomes such as these stem from the fundamental properties of light-matter interaction and cannot be easily overcome. Although, for MHz systems, the quality of the micromachined samples is improved by increasing the spatial separation (decreasing pulse overlap), this requires using extremely fast (10–100 m/s) translation systems, which are either specially modified galvo scanner setups or polygon scanners [13]. This presents several disadvantages, for example, the system becomes complex due to the addition of sharp focusing optics and loss of working area cannot be avoided, as well, in the case of polygons, vector scanning is almost impossible, and therefore these systems can only be used for specific patterns, hence for specific applications. Therefore, it is necessary to increase the efficiency (ablated material/unit energy/unit of time) of the micromachining process as much as possible to fulfil the necessary requirements. Several techniques exist for processing materials with femtosecond pulses which include: direct ablation in air [14,15], back side wet etching [16,17,18], spatiotemporally enhanced focusing [19,20], laser-assisted etching (LAE) [21,22,23,24,25,26], and gas-assisted processing [27,28,29]. Although the techniques presented above all have their advantages and disadvantages, when talking about cutting/drilling deep (> 500 µm) structures inside the material, all of the stated techniques fall short (with the exception of LAE), and ultimately fall victim to slow processing and heat-affected zones around the cut. This is due to the fluence decrease when a crater is formed (the walls of a deep crater have a larger surface while the spot is projected onto the walls). As the successive pulses impinge on the same surface area, the surface gradually changes from flat to a V-shape. This is caused by the spatial energy distribution of the beam on top of the sample. Since typical femtosecond lasers have a Gaussian energy distribution, the gradient of the Gaussian beam is the driving factor leading to a V-shape. When more and more pulses hit the surface, the fluence decreases from its initial value and may go below the ablation threshold. In that case, the efficiency of the ablation process is low, and the increasing tails of the Gaussian beam produce a constant temperature input with no ablation. In addition, as the channel becomes deeper, the angle of incidence of the light changes, which also lowers absorption. More information regarding the intricacies of V-shape formation may be found in [30]. A possible workaround for this issue is the use of beam-shaping optics which produce a flat-top beam [31,32], where the area of zero gradient distribution is large and the ablation rate is constant. However, although there are a number of options for beam-shaping optics, in practice the flat-top zone is realized only at a certain position along the propagation direction, after which it breaks apart (takes on a non-flat-top intensity distribution). Furthermore, when a crater is formed on the surface, diffraction from the edges of the walls, and subsequently interference, distorts the flat-top distribution. Therefore, for deep cutting/drilling, beam shapers of this sort are not an option.
There are several reports showing that when a layer of water is applied above the samples, better micromachining quality, as well as increased micromachining throughput, is achieved when cutting/drilling various materials [33,34,35,36]. Explanations for these improvements include better cleaning of the micromachined crater due to a lower pressure zone that appears above the micromachined channel as the material expands after the laser pulse hits the surface [34], poor adhesion of the ablated particles to the surface and the walls of the crater which is caused by the slowing down of the species within a viscous medium [37,38], better cooling of the ablated sample due to the better thermal conductivity of water as compared with air [38,39], and better energy transfer from the created plasma to the sample since it is confined by a layer of water [34]. These effects mostly contribute to better micromachining quality obtained after cutting/drilling, only partly explain the increase in micromachining throughput, and they also do not explain the shape of the ablated crater.
In this study, we present the results of cutting 1-mm thick, soda-lime glass samples submerged in water. By changing the pulse energy (repetition rate), thickness of the water layer, scanning speed, and focal position relative to the surface of the sample, we achieve different results in terms of cutting throughput. The differences in the results and the impact of each experimental factor were also studied numerically by modelling the propagation and energy losses of the beam using the nonlinear modified Schrodinger equation. We show that the main driving factor behind the increase in micromachining throughput is the non-homogenous losses of energy within different portions of the beam resulting in a semi flat-top intensity distribution. When a channel is ablated and the ablated depth increases, the shape of the channel gradually changes from flat to a V-shape for a Gaussian intensity distribution beam, at which point the fluence drops dramatically to near ablation threshold values due to the large surface area which the beam is projected on. If the intensity profile is closer to a flat-top beam, the V-shape formation is suppressed, the fluence does not drop as fast, and deeper channels are ablated faster with higher quality. These findings were confirmed by numerical simulations of crater profile formation for different intensity distributions after a number of successive pulses on the surface of the sample.

2. Materials and Methods

In this study, the main focus was to understand and explain the unique data distributions for the process of cutting 1-mm thick, soda-lime glass samples and varying several laser parameters. More technical investigations regarding cutting throughput for the micromachining technique, the detailed experimental parameter influence on the process, and the micromachining quality, as well as various examples, are found in [40,41,42]. Therefore, this section will be divided into two parts, one explaining the experimental setup for cutting the samples as well as for gathering the data, and the second regarding aspects of numerical modelling of the beam propagation within the water layer and the formation of craters.

2.1. Experimental Setup for Cutting Glass Covered with a Layer of Water

Laser micromachining of 1-mm thick, soda-lime glass samples was carried out using a Yb:KGW Pharos laser (Light Conversion, UAB, Vilnius, Lithuania) emitting IR (wavelength –1026 nm) radiation, with a pulse duration of approximately 260 fs and pulse energy as high as 400 µJ energy at 20 W of average power, however in our experiments the average power was kept constant at 10 W due to optical component limitations. The repetition rate was tunable from 1 Hz to 610 kHz, however in our experiments the repetition rate was changed from 33 kHz to 200 kHz (see text). Figure 1 presents a schematic of the experimental setup. The laser beam was assisted by a two-axis galvanometric scanner (Intelliscan10, ScanLab, Munich, Germany). The beam (diameter of 3.5 mm at 1/e2) was focused on the sample with an F-theta (100 mm, effective NA = 0.018) lens. The sample was covered with a layer of water ranging from 0.3 to 1.5 mm. The diameter of the spot at the focal position was measured with a CCD camera and was 22 µm (FWHM). For comparison, some (see text below) of the tests were performed in the absence of a water layer in order to highlight the unique intricacies when micromachining with the added layer of water. The samples were covered with water in a specially designed reservoir with transparent walls. The micromachining process was observed in real time using an imaging system coupled to a CCD camera (mvBlueFOX, Matrix Vision Gmbh, Oppenweiler, Germany). Since the process was monitored in real time, when the illumination conditions were chosen properly it was possible to realize a scenario where all of the light going through the water and the glass was collected and imaged, while the light going through the air was scattered. In this way, it was possible to accurately measure and control the thickness of the water layer covering the samples. In addition, the changing of the ablated shape of the channel was inspected with the same setup. The imaging system consisted of a ThorLabs cage frame coupled to a 4X magnification Olympus objective (0.2 NA, with 18.4 mm working distance) and an f = 5 cm tube lens. For topographic and visual analysis of the formed grooves an optical microscope (BX51, Olympus, Tokyo, Japan) and optical profilometer (Plµ 2300, Sensofar, Terrassa, Spain) were used. The laser parameters were studied, and their ranges are provided in Table 1.

2.2. Numerical Model of Beam Propagation in a Transparent Medium

In order to reveal the transformation of the high-intensity pulses within a thin water layer, we performed some simplified numerical simulations, considering the paraxial beam propagation along the z-axis of a linearly polarized laser beam. We model the linearly polarized beam with cylindrical symmetry around the propagation axis z by the envelope A of the electric field, written as A = Re[Aexp(–ikLz – iω0t)], where kL = n0ω0/c and ω0 are the wave number and frequency of the carrier wave, and n0 denotes the refraction index of water at ω0. The energy Ein pulse had a Gaussian amplitude profile in the temporal and spatial domains and a temporal half width τP (FWHM) duration τFWHM = tP (2 log 2)1/2 and ρ FWHM = ρ 0 (2 log 2)1/2.
A = A 0 exp ( t 2 τ 0 2 r 2 ρ 0 2 ) .
Under the conditions of the experiments regarding the propagation of the beam within the water layer, the effects related to the pulse group velocity and dispersion were ruled out, since the spectral width of 260 fs is below 10 nm and water having a group velocity dispersion coefficient at 1030 nm of 29.96 fs2/mm does not induce pulse dispersion over the thickness of the water layer. Therefore, the goal of the research was to predict the alterations to the intensity distribution within the water layer which impinged on the surface of the sample, since it is believed that the change in the intensity distribution is the main driving factor for the increase in the micromachining throughput for ablation in water. The energy distributions striking the sample were acquired by solving the modified non-linear Schrodinger equation (NLS) in 2 + 1 dimensions. The equation includes diffraction (first term), self-focusing (second term), and non-linear losses (third term) due to multi-photon absorption. For the scalar envelope A(r, z, t) evolving along the propagation axis z according to the non-linear envelope, the equation is:
A z = ( i 2 k L Δ r + i k L n 2 | A | 2 β ( K ) 2 | A | 2 K 2 ) A ,
where, r and Δr stands for the radial coordinate and Laplace operator, respectively, β(K)[cm2K-3W1-K] is the multi-photon absorption (MPA) coefficient and n2|A|2 responds to the intensity-dependent changes of the refractive index. We evaluate the amplitude of the beam at different distances L along the propagation direction for the incident beam power (at the Gaussian maximum). The input power is computed from the energy and pulse duration Pin = Ein. Accordingly, the initial pump amplitude becomes A 0 =   2 P 0 / π   ρ 0 2 , where ρ 0 stands for the beam waist.

2.3. Numerical Simulations of Crater Formation when Multiple Successive Pulses Impinge on the Surface

In order to establish how multiple successive pulses form the ablation crater, a semi-empirical model was constructed. The model takes the core basis that if a pulse is focused on the surface of the sample, the energy density (fluence, F) is not constant at different places on the surface since the intensity distribution of the pulse is non-uniform. Since the energy density varies at different positions in the impingement zone, the removed mass (volume) must also be different. In order to estimate how much volume is removed from the surface, a simple experiment was performed by firing pulses of different energy at the sample and the shape was registered with an optical profiler (see Section 2.1). Knowing the actual intensity distribution (which was measured previously with a CCD camera), the shape of the formed crater is put side-by-side with the impinging fluence distribution and a graph depicting how much the different portions of the sample have increased in depth in relation to different fluence values. Figure 2 demonstrates this approach. The left side (a) of the figure shows a crater formed by a Gaussian pulse. Only half of the crater and Gaussian distribution is displayed since the other half is symmetrical and does not carry any significant information. This graph represents only experimental data of a crater that was formed after a single pulse (having energy of 160 µJ, fluence = 29 J/cm2) struck the surface of the sample. The red curve shows how the fluence was distributed in infinitesimally small regions inside the impingement zone before the first pulse struck the sample, i.e., the sample was flat before the first pulse arrived and the energy contained in the region dx produced a change in the Z coordinate of the surface Z(x). From this, with rearranging, the left side (b) of Figure 2 is constructed showing how much the depth changes given a specific energy density (or fluence). We observed that the dependency takes on a logarithmic form (for greater values than the ablation threshold) and two parameters are sufficient to fit the curve.
For the second and all consecutive pulses, the energy stored in the area dx was projected onto the area dl (see Figure 2). Note that although in real-world experiments dl is an area, for ease of computational load, a two-dimensional case was considered, and therefore instead of an area, dx and dl are line segments. We did not take into account the defocusing of the beam, since throughout our experiments an f = 100 mm focusing lens was used (the input beam was 3.5 mm at 1/e2) which focused the beam down to 37.4 µm (1/e2). From this, the resulting Rayleigh range ( z R = π ρ 0 2 / λ ) of approximately 1.1 mm was calculated, and therefore defocusing was neglected. By taking into account the above-mentioned considerations, a semi-empirical model (since the coefficients of the logarithmic function are obtained from the experiment) is constructed that predicts the evolution of the craters when multiple pulses hit the surface. The changing area dl is calculated after each pulse and the ratio of energy projected onto this area is taken and plugged into the empirical logarithmic function. This produces a change (dZ) in the surface Z(x) (see Equation (3)). The sum of these changes produces a new function Z(x)n which denotes the shape of the surface after each n-th pulse (see Equation (4)). In the equations, F ( x ) = F 0 exp ( 4 log ( 2 ) ( x / ρ 0 2 ) ) takes the form of a Gaussian shape (F0 is the amplitude of the Gaussian distribution, ρ 0 is the width of the beam), however different distributions are also valid as will be displayed later.
d Z ( x ) = a 1 log ( a 2 d x × F ( x ) S ( x ) ) ,
Z ( x ) n = i = 1 n a 1 log ( a 2 d x × F ( x ) Δ Z ( x ) 2 i 1 + d x 2 ) ,
where, a1 and a2 are the empirical coefficients obtained from the experiment and are 0.1356 and 0.1324, respectively, S(x) is the area onto which the energy is projected at different locations of the surface (in Figure 2 this is described as dl at different X values), and for other symbols see Figure 2. To test the validity of such an approach, the experimental data (from percussion drilling when focusing 160 µJ (fluence = 29 J/cm2) pulses on the surface) was compared to the computed numerical results. Although different energy settings were used, 160 µJ was chosen, since the largest number of crater profiles were measured experimentally in this case, i.e., for low energy pulses (<50 µJ, 9_J/cm2) more profiles were measured than for the 160 µJ case. However, since the ΔZ vs. energy density plot (see Figure 2b) was computed from the data for the first crater, the measurement becomes unreliable since the depth is significantly lower and the measuring equipment has limited resolution. For higher energy pulses (>160 µJ), although the first pulse gives reliable measurements, the crater becomes too deep after several tens of pulses and the measuring setup cannot acquire the profiles accurately. The experimental and numerical results are displayed in Figure 3. We observed that some deviation exists in the numerical and experimental results. First, in the experimental case, the width (at the entrance) of the crater increased, whereas, it remains constant in the numerical case. It is well known that in the case of multiple pulse impingement the ablation threshold drops, since permanent defects are created in the peripheral region [43]. However, for the purpose of this study, the increase in width is not as impactful since it does not drastically change the shape, and ultimately a V-shape groove still manifests. In addition, in the experimental case, the profile becomes asymmetric, especially for the deeper grooves. This is caused by defects present within the glass chipping of the surface. Overall, the numerical case does represent the experimental one with some deviations. It is worth pointing out that effects such as Fresnel reflections, bottom-wall surface roughness (and associated multiple reflections/surface area change), chipping, and defect generation within the glass were not taken into account in this case, as they would lead to a complicated model with multiple parameters. Still, the depth and shape resemble the experimental case even after more than a hundred pulses have hit the surface, and the model shows that the linear increase in crater depth is halted by the increase in the surface area when the crater becomes deeper, explaining the logaritmic dependency (depth wise) when multiple pulses impinge on the surface.

3. Results

The purpose of the experiments was to demonstrate the specific nuances of a micromachining process involving covering the samples with a water layer, and also to highlight the differences when the layer is absent. Since micromachining in air [44,45,46,47] has been studied for a long time, the process is well understood and will therefore not be discussed here; however, references to the semi-empirical model described in Section 2.3 will be made throughout Section 3.

3.1. Micromachining with High-Energy Pulses in Air and with a Water Layer Covering the Sample

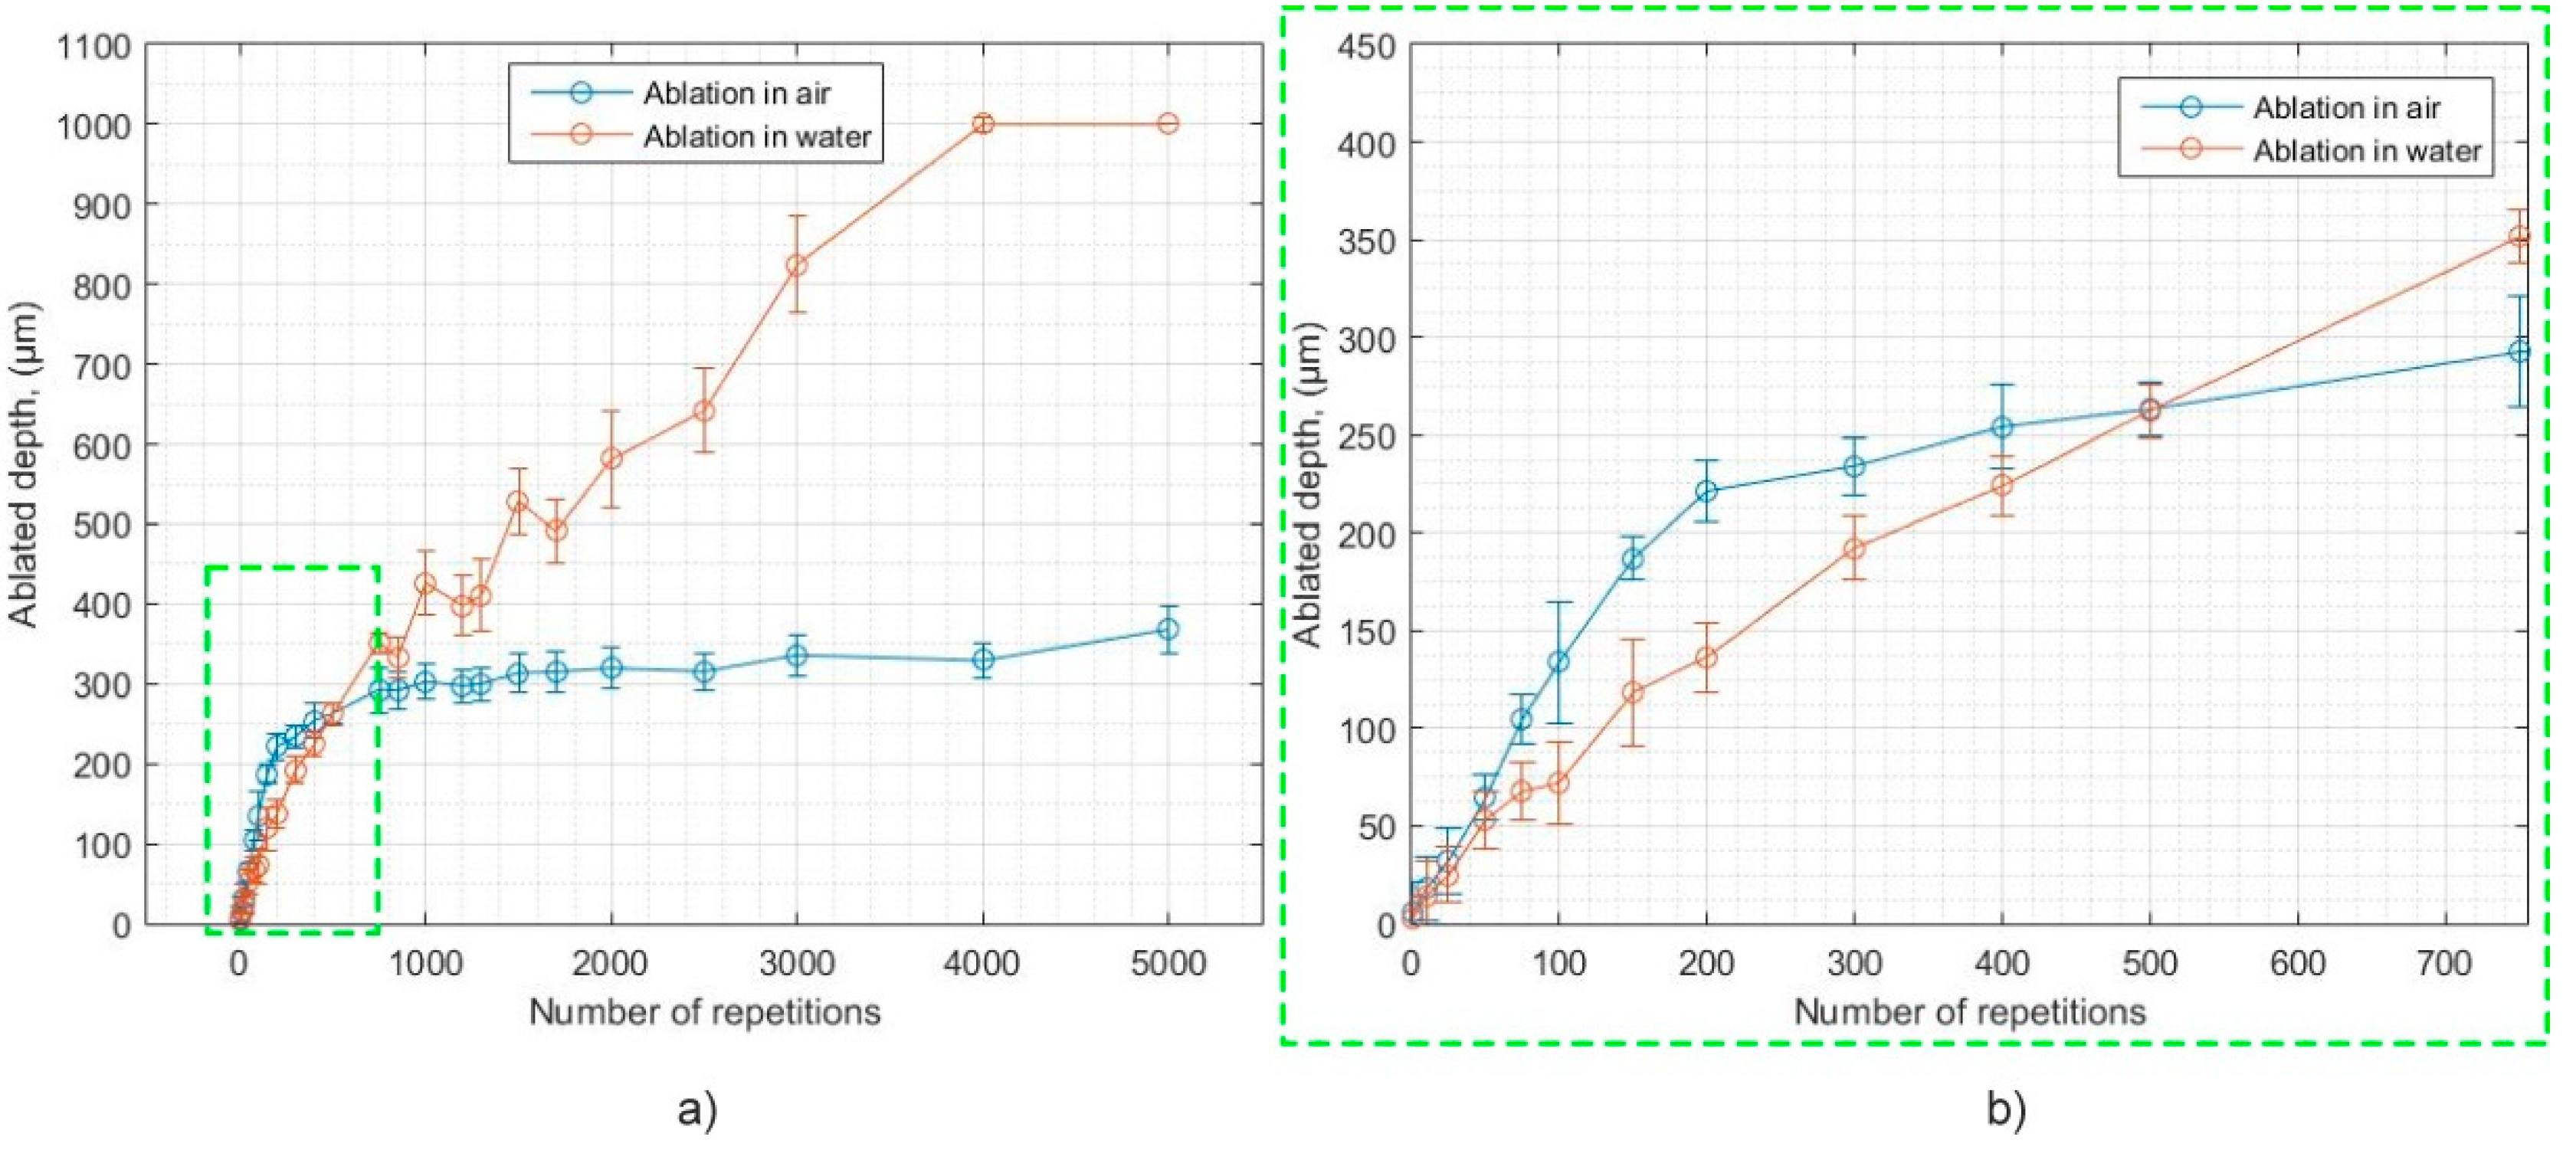
As stated above, the micromachining process is more efficient when cutting the samples if the water layer is present, however, it should be noted that this is true only when cutting thick (>400 µm) samples. In fact, if the thickness is below a certain value, cutting in ambient air is faster as compared with cutting in water. When cutting the samples, a number of passes (repetitions/number of pulses) along the same path are required in order to reach a certain depth. Figure 4 shows how the depth evolves when the samples are cut with a given set of laser parameters. It is worth noting that the data in Figure 4 was acquired with an average power of 2 W, which is a departure from the settings displayed in the other graphs (typically 10 W). This was done because the glass is prone to cracking or shattering at higher average power settings (only when cutting in air) and a direct comparison between the two cases is otherwise not possible, however the same tendencies hold. It is worth mentioning that for an average laser power of 10 W the absolute levels displayed in the graph are different. However, given these specific settings, the depth increases faster for ablation in air for the first ~250 µm, and then slows down from that point, whereas, for the cutting in water the slope of the curve changes at a slower rate. Ablation in air follows a logarithmic dependence and shows a saturating effect after a certain depth has been reached. This saturation is caused by the V-shape formation and a resulting drop in fluence as the area of the surface increases. In fact, cutting through the entire 1-mm thick sample is impossible when cutting in air. Since the impinging pulses do not produce efficient ablation, a portion of the energy is still absorbed and manifests as thermal input into the sample. Transparent materials are brittle, and therefore due to the thermal load and tensile stress emerging around the cut area, the sample cracks or shatters [48].
For cutting in water, a logarithmic dependency is still observed, however the saturation in depth does not occur for the cutting of 1-mm thick samples. Interestingly, from the graph provided in Figure 4, from a depth of 400 µm to 1 mm, the increase is almost linear for cutting in water. Such a dependency suggests that for cutting materials in water, the fluence projected onto the walls and bottom of the groove does not decrease as fast as it does for cutting in air, or is compensated in some way, i.e., the V-shape formation is not as pronounced or is suppressed due to certain phenomena happening while the beam is propagating within the water layer. However, if the depth increases semilinearly it implies that the Gaussian intensity distribution must have been transformed, since the amount of energy does not increase during micromachining. In addition, the transformed distribution must be sustained along the propagation direction for at least 600 µm given the studied case. It must be noted, that such an outcome (depicted in Figure 4) cannot occur if the spatial intensity distribution is Gaussian, regardless of the beam dimensions, due to the nonzero gradient of the Gaussian intensity distribution.
This departure from the conventional case (ablation in air vs. ablation in water) was understood by modelling the propagation of a high-intensity beam within a non-linearly absorbing medium (water) by means of the non-linear modified Schrodinger Equation (2). In this case, the energy of the pulses was taken as 140 µJ (fluence = 25.4 J/cm2) at 260 fs and from this the peak power exceeds the critical power for self-focusing (CPSF) by approximately 100-fold. The incident peak power, Pin, in this case reads 614 MW, the nonlinear index of refraction was taken as 3 × 10¹⁶ from the recently published data in [49]. The CPSF in this case is approximately 4 MW. For the numerical simulations, the intensity A(r, L, t)2 and energy density distributions were evaluated at different locations along the beam’s propagation direction L. Our calculations were performed for Pin = 100 PCR in order to speed up the convergence of the solution with the numerical algorithm used. Accordingly, the input amplitude reads as E 0 = 100 P c r / ( 2 π ρ 0 2 ) . The beam waist at the input plane (on top of the layer of water) was taken as 22 µm.
As will be shown later, the transformation of the beam, the rate of energy losses (dE/dZ), and breakup are largely impacted by the setting of the focal position relative to the surface of the sample (or layer of water).
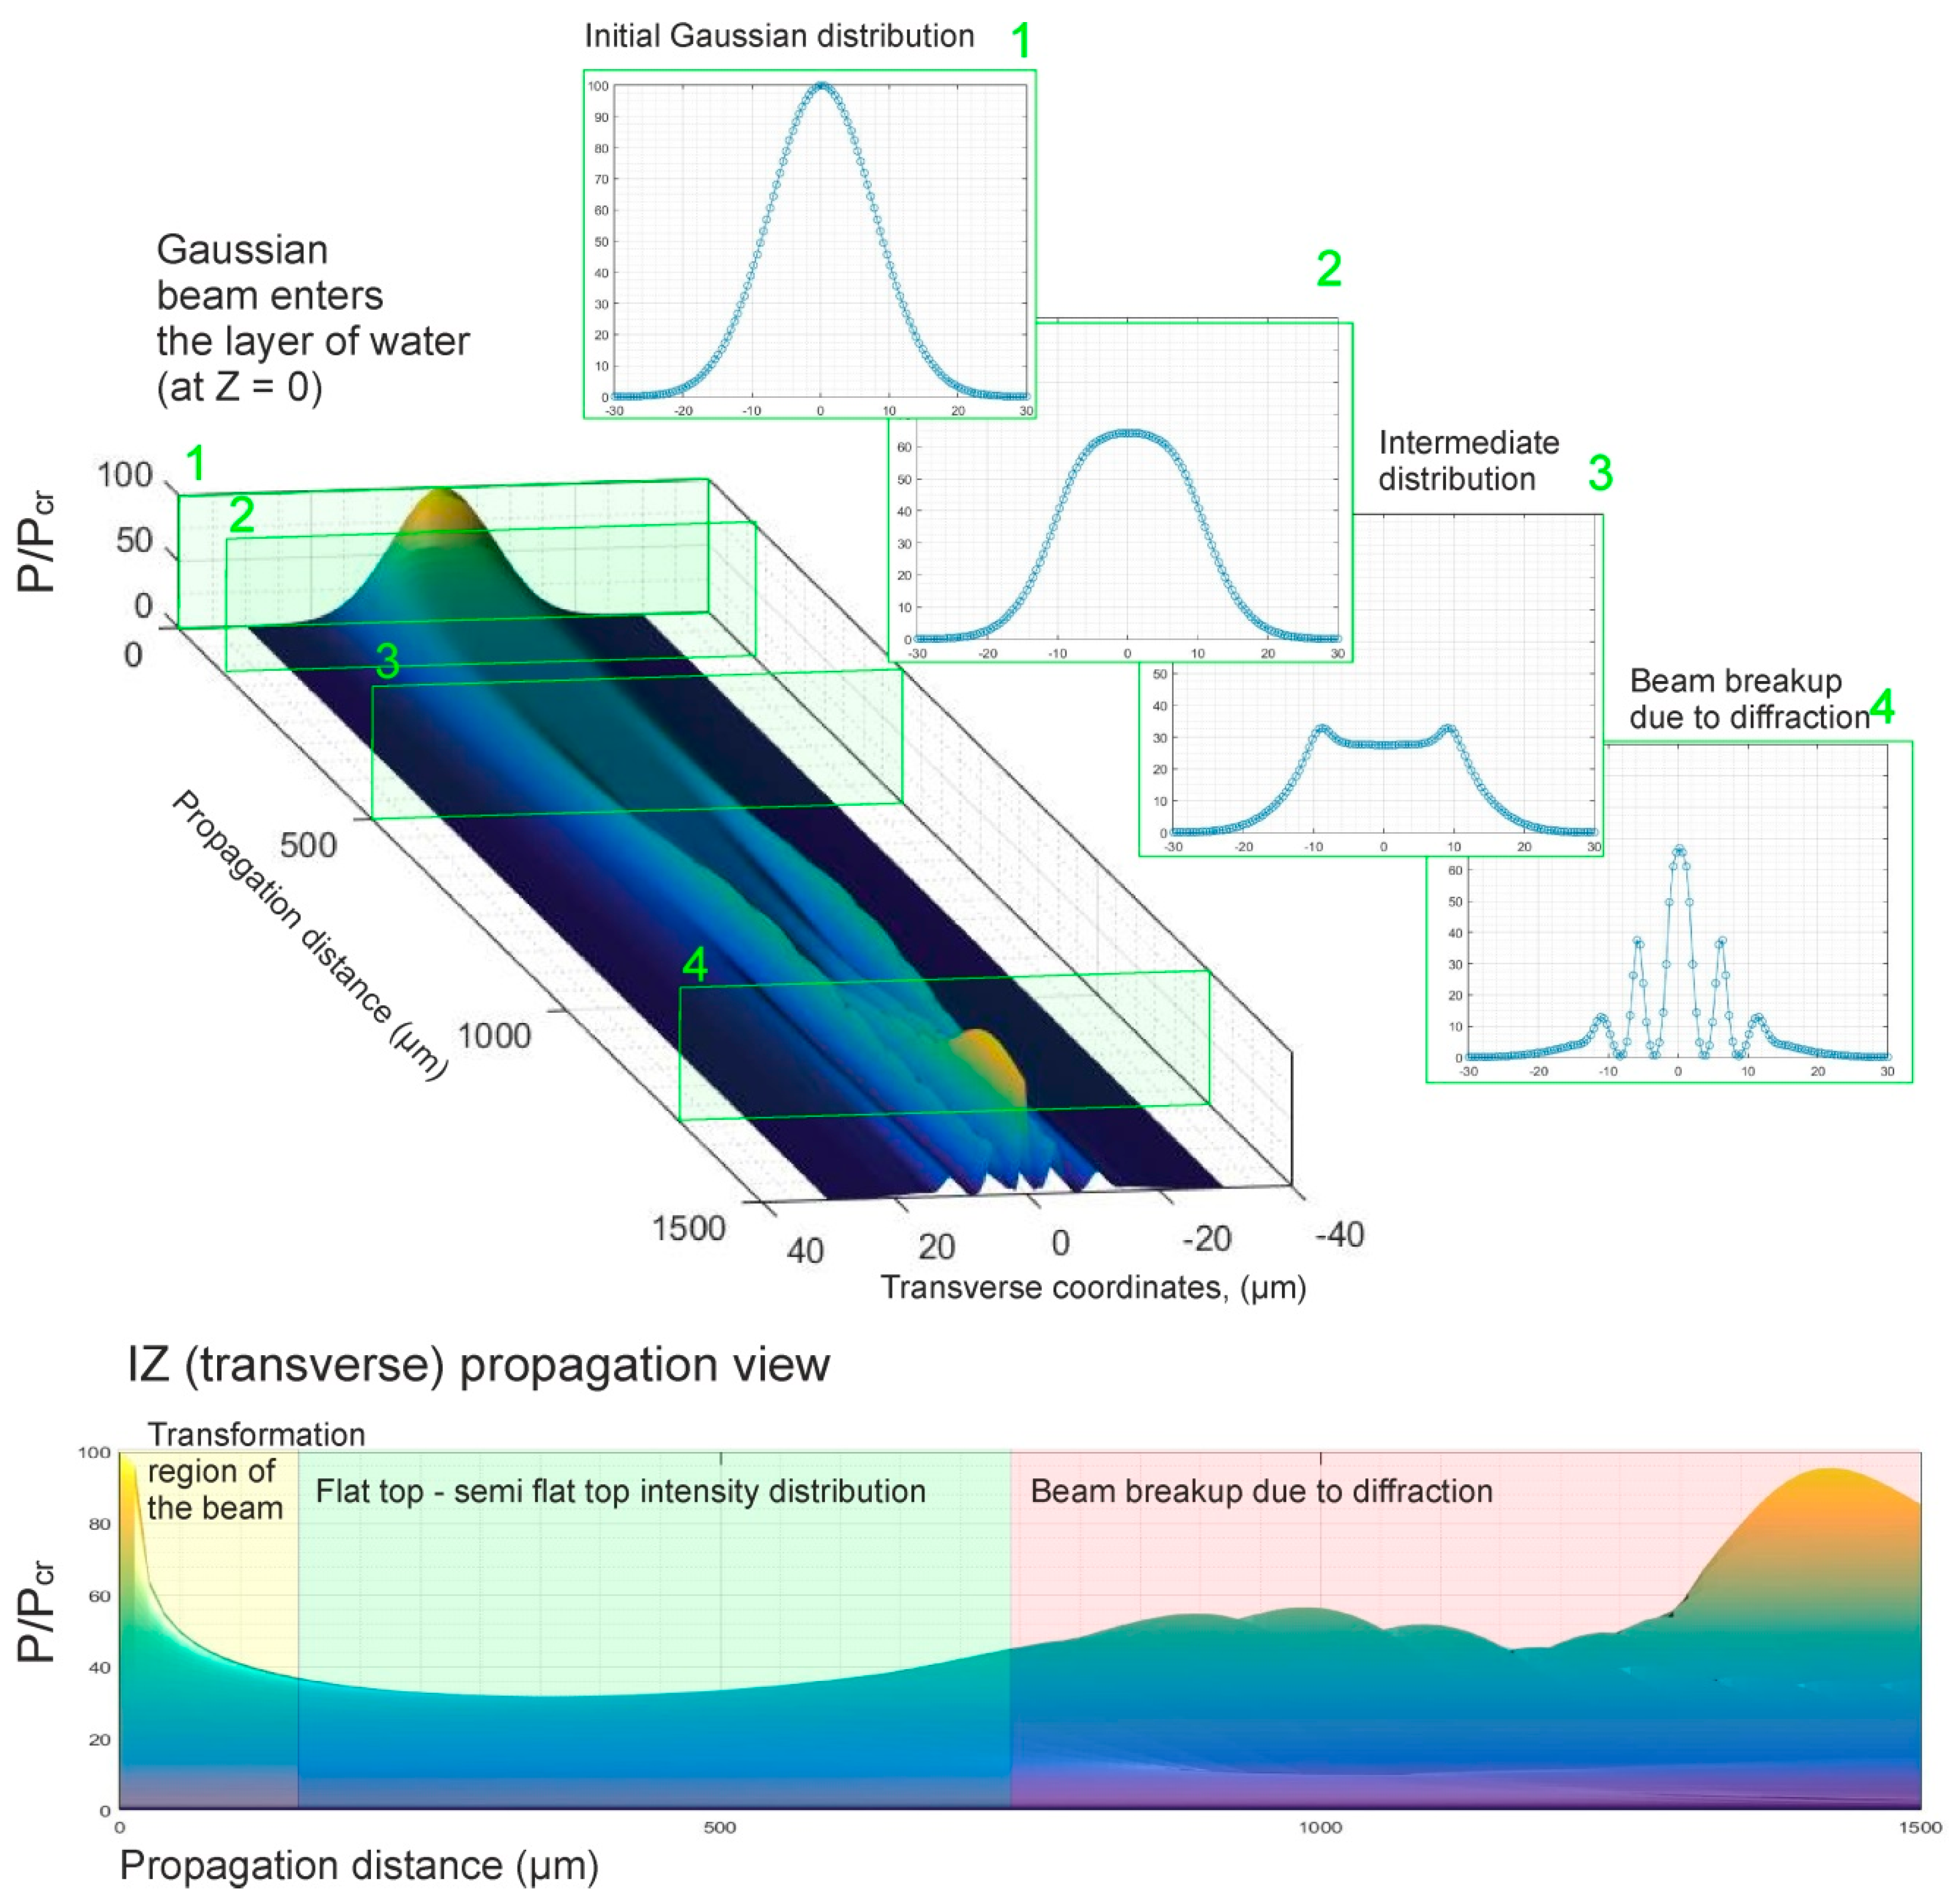
Figure 5 shows how the beam propagates within the water layer given a specific focusing case (on the surface of the sample) and the parameters listed above. However, it is worth pointing out that this case should be regarded as only one of the possible outcomes illustrating the flattening of the Gaussian intensity distribution. For a different set of parameters, the relative lengths of the transformation region of the beam, flat-top/semi flat-top region and beam breakup due to diffraction and self-focusing may be significantly different. In addition, the transformation of the beam is mostly impacted by the initial energy of the pulse as well as the material properties (n2 and non-linear losses). Moreover, the three different regions displayed in Figure 5 are a result of how fast the energy is lost when the beam enters the non-linear medium (water) and how fast the phase accumulates during propagation. This is not intuitive to predict since this is a non-linear process and every case needs a separate simulation, however if the peak power exceeds PCR by less than 10-fold, a multiple filamentation process is likely due to the initial intensity modulation of the beam, in which case the flat-top–semi flat-top intensity distribution does not manifest. This case is not beneficial for the micromachining of deep microchannels. If the peak power is above the stated value, the flattening of the Gaussian distribution may commence and the higher the pulse energy the faster (propagation distance wise) this happens. For the 40 PCR, the flat-top/semi flat-top region starts after approximately 400 µm of propagation and is sustained for another 350–400 µm. For the 200 PCR, we predict that the flat-top–semi flat-top intensity distribution would manifest approximately after 25–50 µm of propagation and would be sustained by another 1000 µm.
In the studied case it is important to note that, within a non-linearly absorbing medium, the Gaussian intensity distribution changes very rapidly and resembles a hyper-Gaussian distribution only after approximately 25 µm within the medium, while the drop in the intensity is approximately 20%. After approximately 100 µm of propagation, the beam flattens even more and resembles a flat-top distribution but with the peripheral tails present. It is surprising that from this point up to 550 µm of propagation this intensity distribution is somewhat sustained, while the losses in intensity are only 50%. After this point, the flat-top intensity distribution breaks up due to diffraction and self-focusing (this is confirmed via the numerical model). It was also noticed that the self-focusing term is mostly responsible for the region where the beam breaks up. In addition, it does not decrease the transverse dimensions of the beam but produces the two peaks near the peripheral region which are visible in Figure 5 (see intermediate distribution 3). However, it manifests only after approximately 400 µm of propagation in the case studied, since the phase difference accumulates slowly in the peripheral region while the beam is propagating. It was noticed, that the diffraction term plays a negligible role in the transformation of the beam, in fact, if the diffraction term is omitted from Equation (2), the results shown in Figure 5 do not change. This is reasonable, taking into account the focusing conditions of the studied case as well as the wavelength. In order for the diffraction term to have an impact on the results, the propagation distance should be longer by at least an order of magnitude and this is confirmed via the numerical model.
As discussed previously, from the micromachining point of view the flat-top/semi flat-top intensity distribution region is the most interesting for micromachining, since the ablation rate should remain constant as the region of the zero gradient would not contribute to the self-steepening of the channel walls, and ultimately would not produce a drop in the fluence on the surface of the sample. From this simulation, it is deduced that the thickness of the water layer should be set to approximately 100 µm, since that is sufficient to transform the beam to a flat-top distribution. However, due to the surface tension of the water, water thickness values below 300 µm are difficult to achieve in practice, though undeniably the lowest values of the water layer should provide the best results in material removal (cutting).
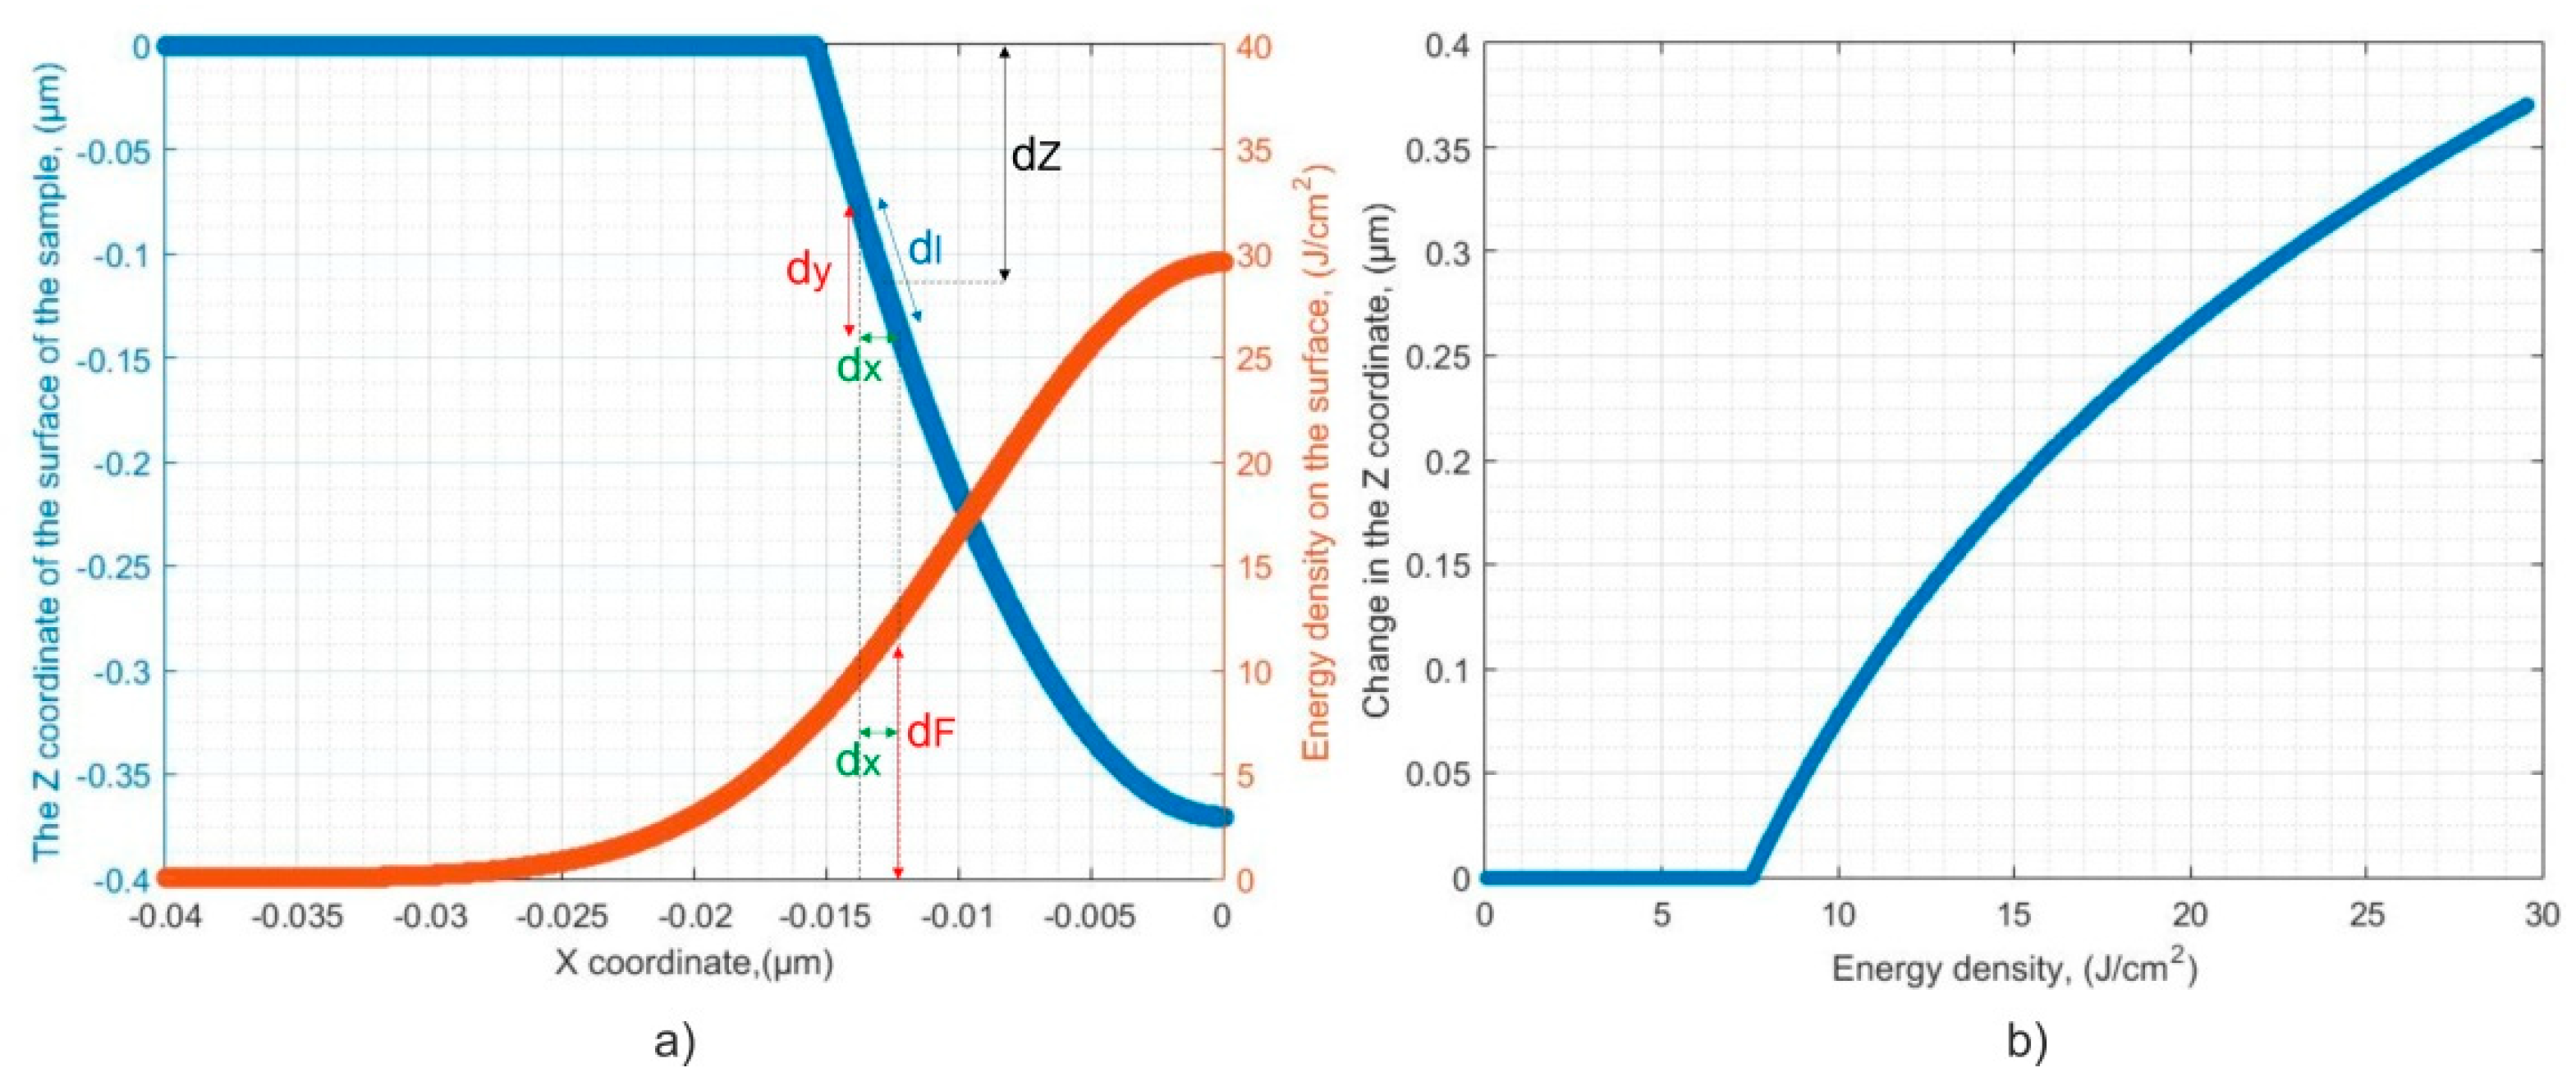
Using the semi-empirical model described in Section 2.3 (using Equation (4)) and the intensity distribution acquired from the results shown in 
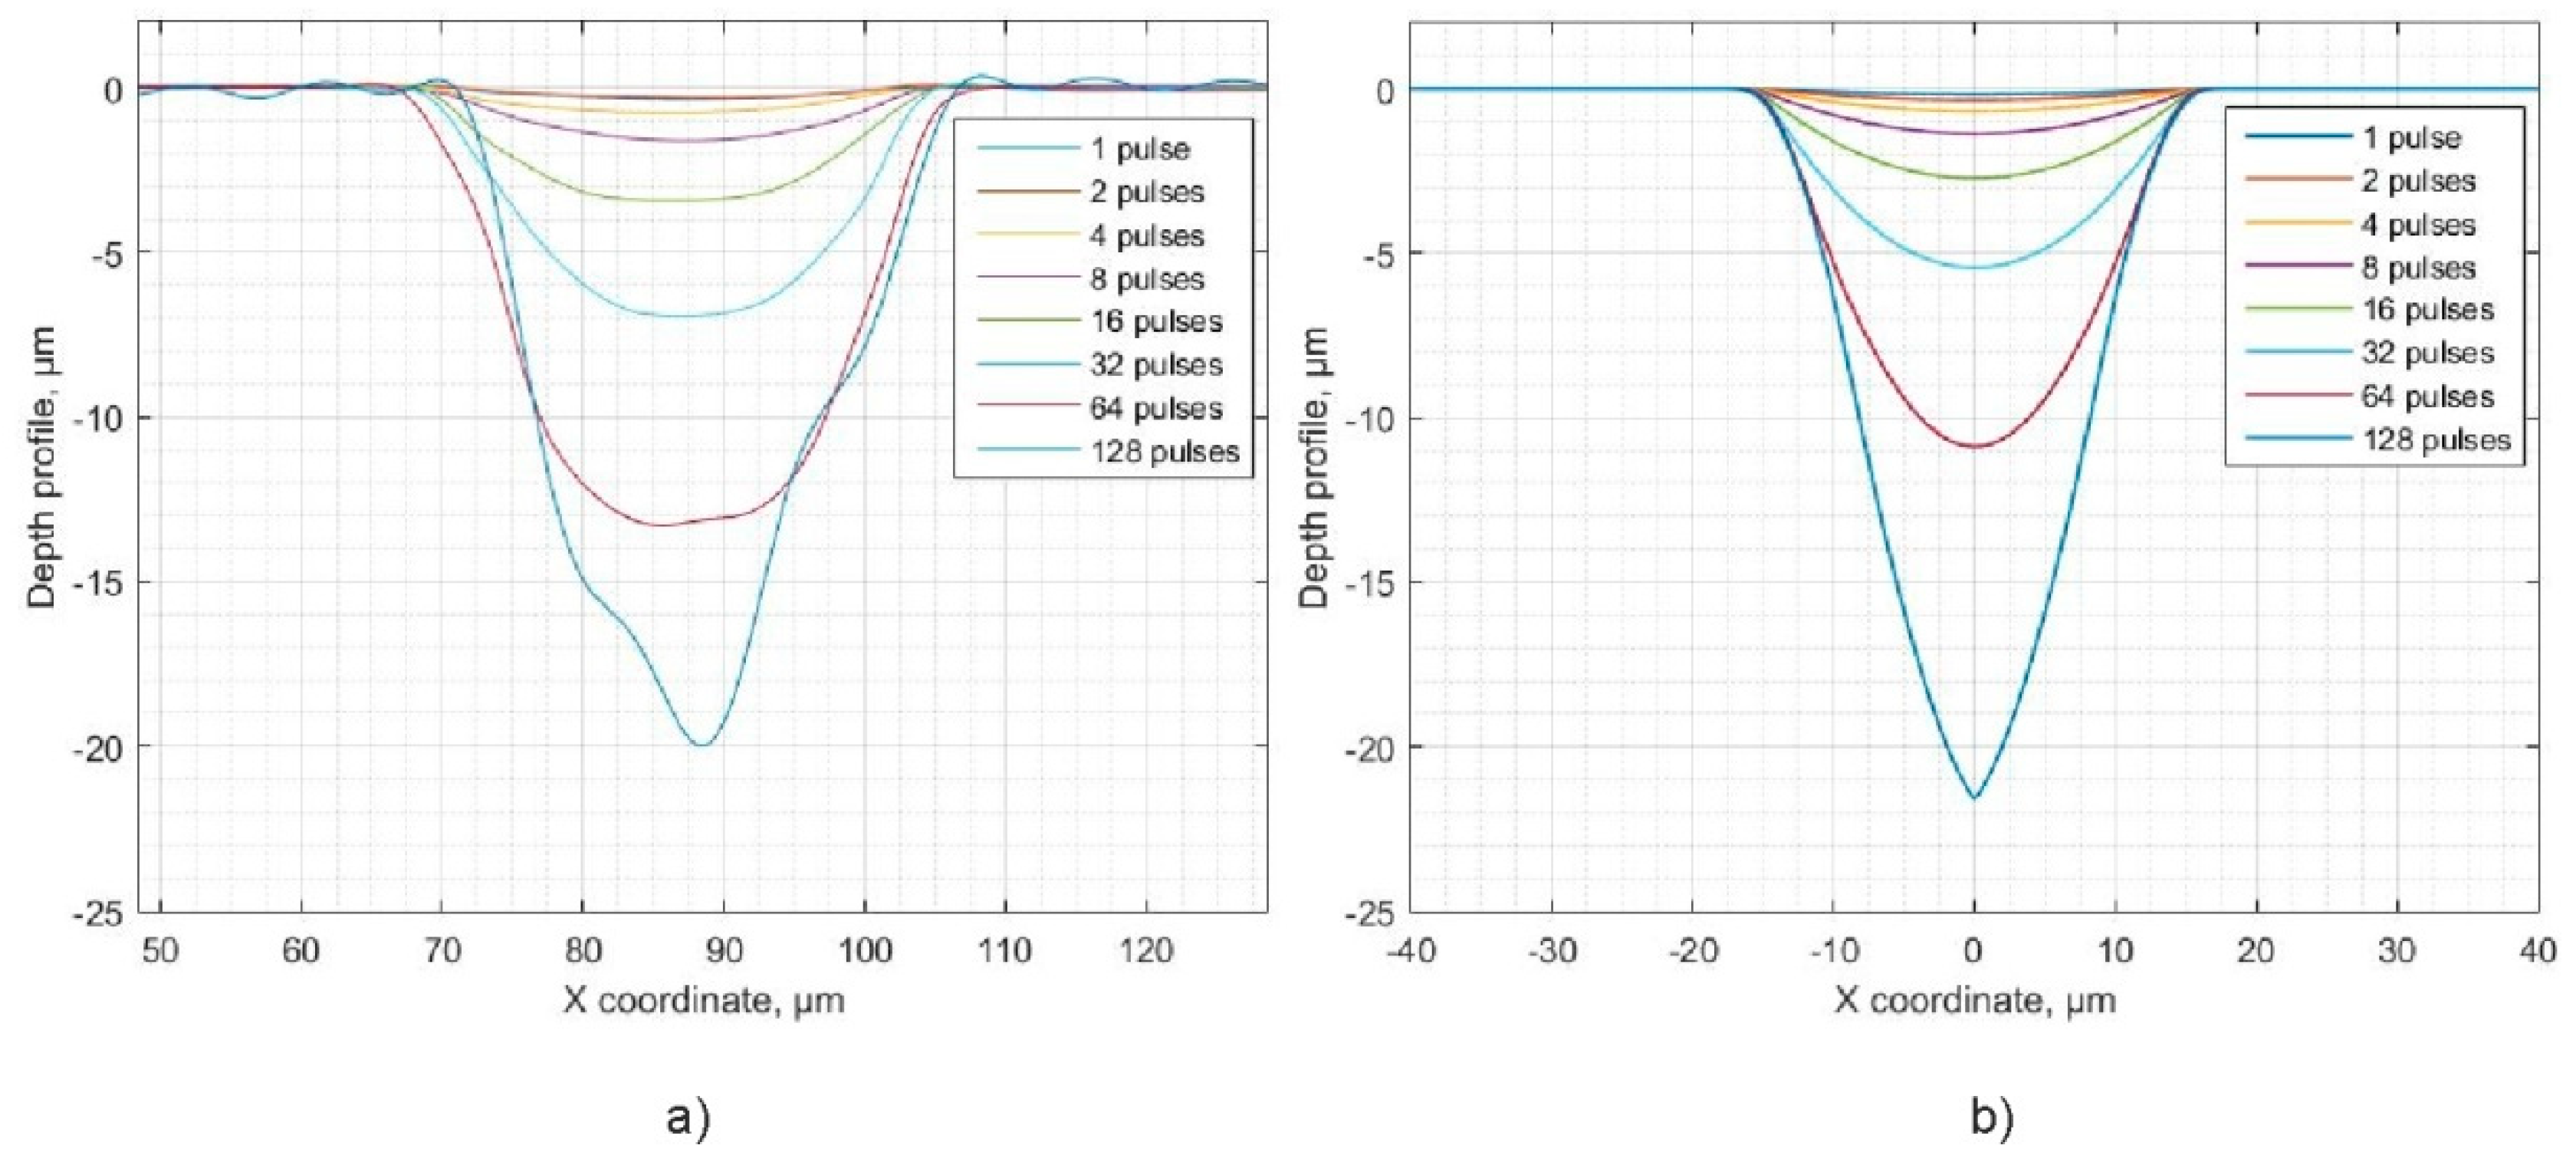
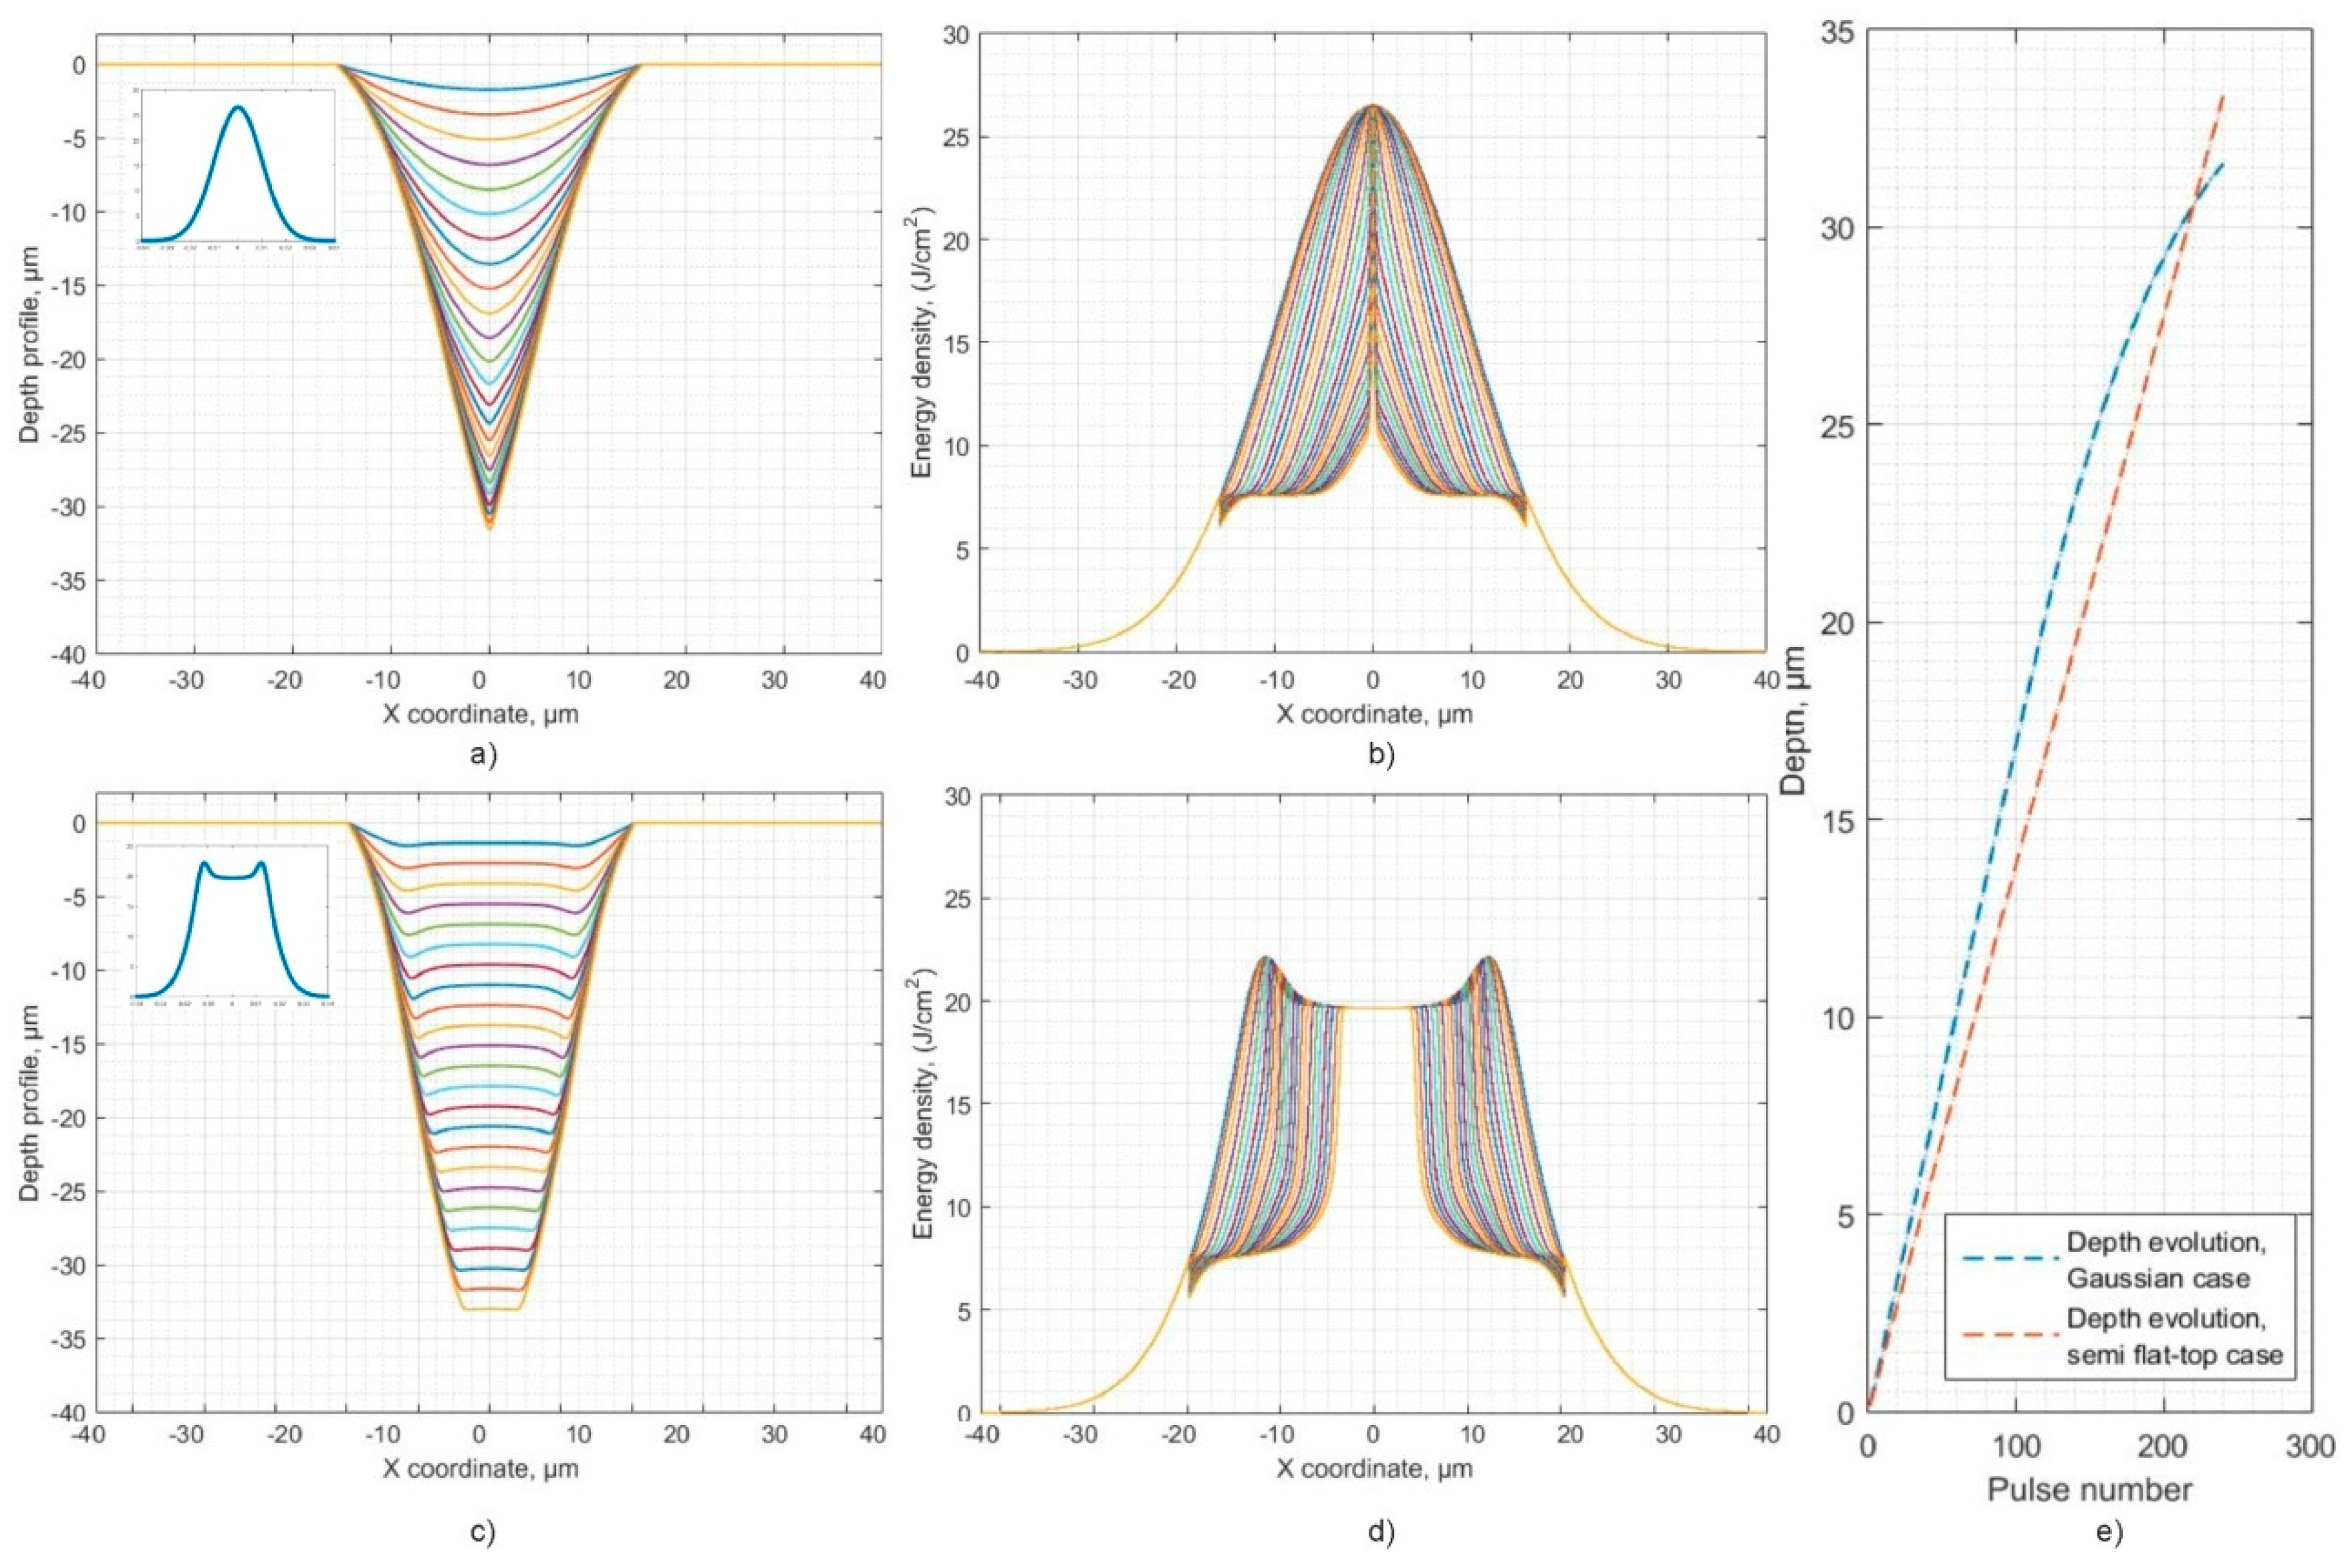
Figure 5, the formation of the craters when a transformed beam produces ablation on the sample was investigated. Two different cases were investigated. First, the beam impinges on the surface of the sample having a Gaussian intensity distribution (the full energy of the pulse is used). Secondly, a transformed semi flat-top beam, which has sustained energy losses due to non-linear absorption in the water, impinges on the surface of the sample. The results are displayed in Figure 6. Here, the case is confirmed that the Gaussian intensity distribution (which has more energy as compared with the semi flat-top intensity distribution) produces deeper craters at first, however due to the changing shape of the crater, the energy density within the impingement zone drops due to the increase of the surface area, and the ablation rate slows down. The change in the energy density (fluence) after consecutive pulses is illustrated in Figure 6. For the semi flat-top intensity distribution, the ablation rate is lower at first as compared with the Gaussian case, since the beam experienced losses of 25% within the water layer. However, due to the differences in the gradient (Gaussian vs. semi flat-top) the semi flat-top intensity distribution does not converge to a V-shape as fast as it does in the Gaussian case. Therefore, from the depth vs. number of pulses plot (see Figure 6e) it is observed that initially the Gaussian pulses produce deeper craters, but ultimately the depth becomes larger in the semi flat-top case, and the two curves cross each other, which agrees well with the experimental data shown in the right side (b) of Figure 4. Note, that the intensity distribution was chosen somewhat arbitrarily between points two and three (see right side of Figure 5), since this is the part that produces the micromachined channels in the real experiments. The authors would like to point out that these numerical simulations should be considered as qualitative and not quantitative representations of the occurring phenomena. From the data provided in Figure 5, it is known that within the water layer the intensity distribution is constantly changing as the beam propagates deeper within the water, and as the crater forms it is also filled with a mixture of water and vapor. In order to portray a real scenario, a change of the intensity distribution should also be considered. In addition, it is known [50] that under similar experimental conditions the cavitation bubbles that emerge due to the absorption of light do not escape the impingement zone for as long as 100 µs, which means that the subsequent pulses hit a modified layer of water resembling a mixture of water and vapor. The mixture of water and vapor has different dielectric and non-linear absorption properties, as well as a different non-linear refractive index (n2), and furthermore, it produces scattering of the light. The stated properties of such a modified layer remain unknown, as they are difficult to probe experimentally due to the transient dynamics of the cavitation zone. Numerical simulations of the formation of the cavitation zone and its evolution within a constrained space requires dealing with complicated fluid dynamics, and such numerical simulations lie far beyond the scope of this study. However, even omitting the previously stated phenomena, similarities between the experimental and numerical curves are present, which suggests that the main driving factor when ablating with femtosecond pulses in water is the non-linear absorption-induced transformation of Gaussian intensity distribution. It is believed that, as the water transforms into vapor, the non-linear losses decrease as it becomes an intermediate state between air and water. Such a process is beneficial since the actual crater is sometimes >1 mm deep in real-world applications. By observing (see 
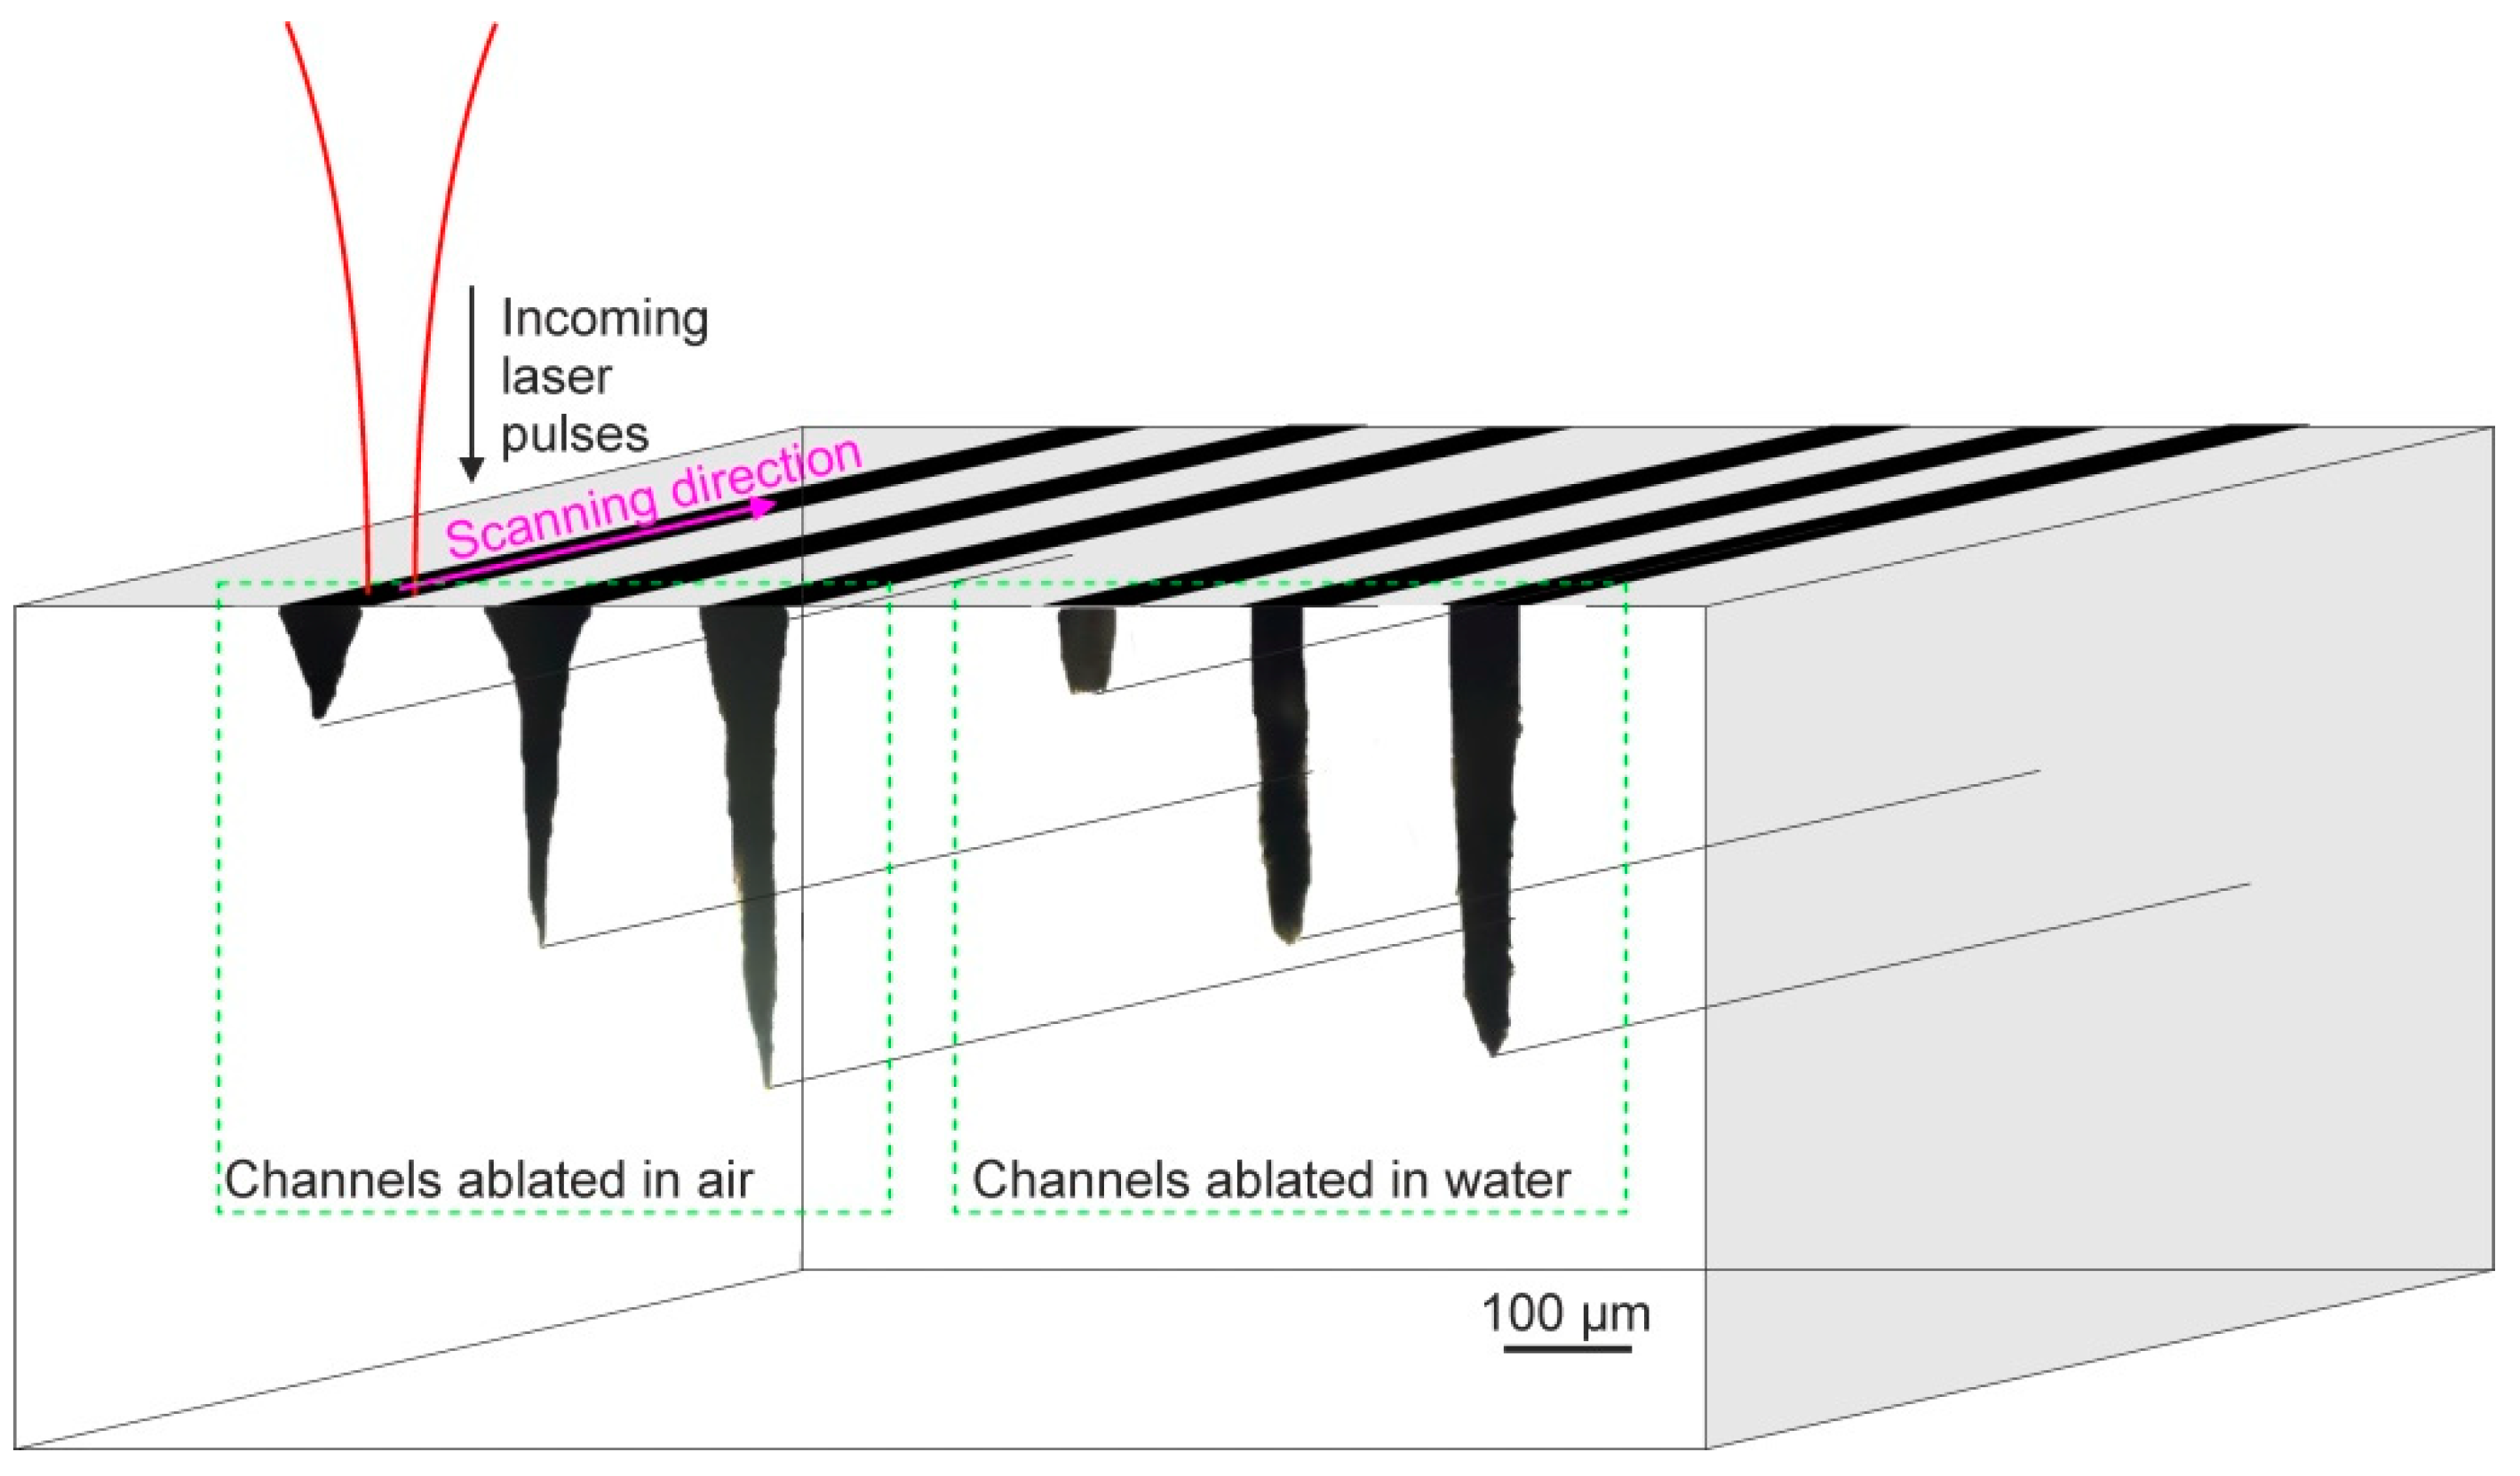
Figure 7) the deep craters produced when ablating in ambient air and with a layer of water present, it is clearly seen that, for ablation in air the craters exhibit a sharp apex at the very bottom, whereas, the bottom looks blunt for ablation in water, axiomatically proving that the surface area is lower in this case, whereas, the depth is similar.

3.2. Impact of Focal Position when Cutting the Samples in Air and While Covered with a Water Layer

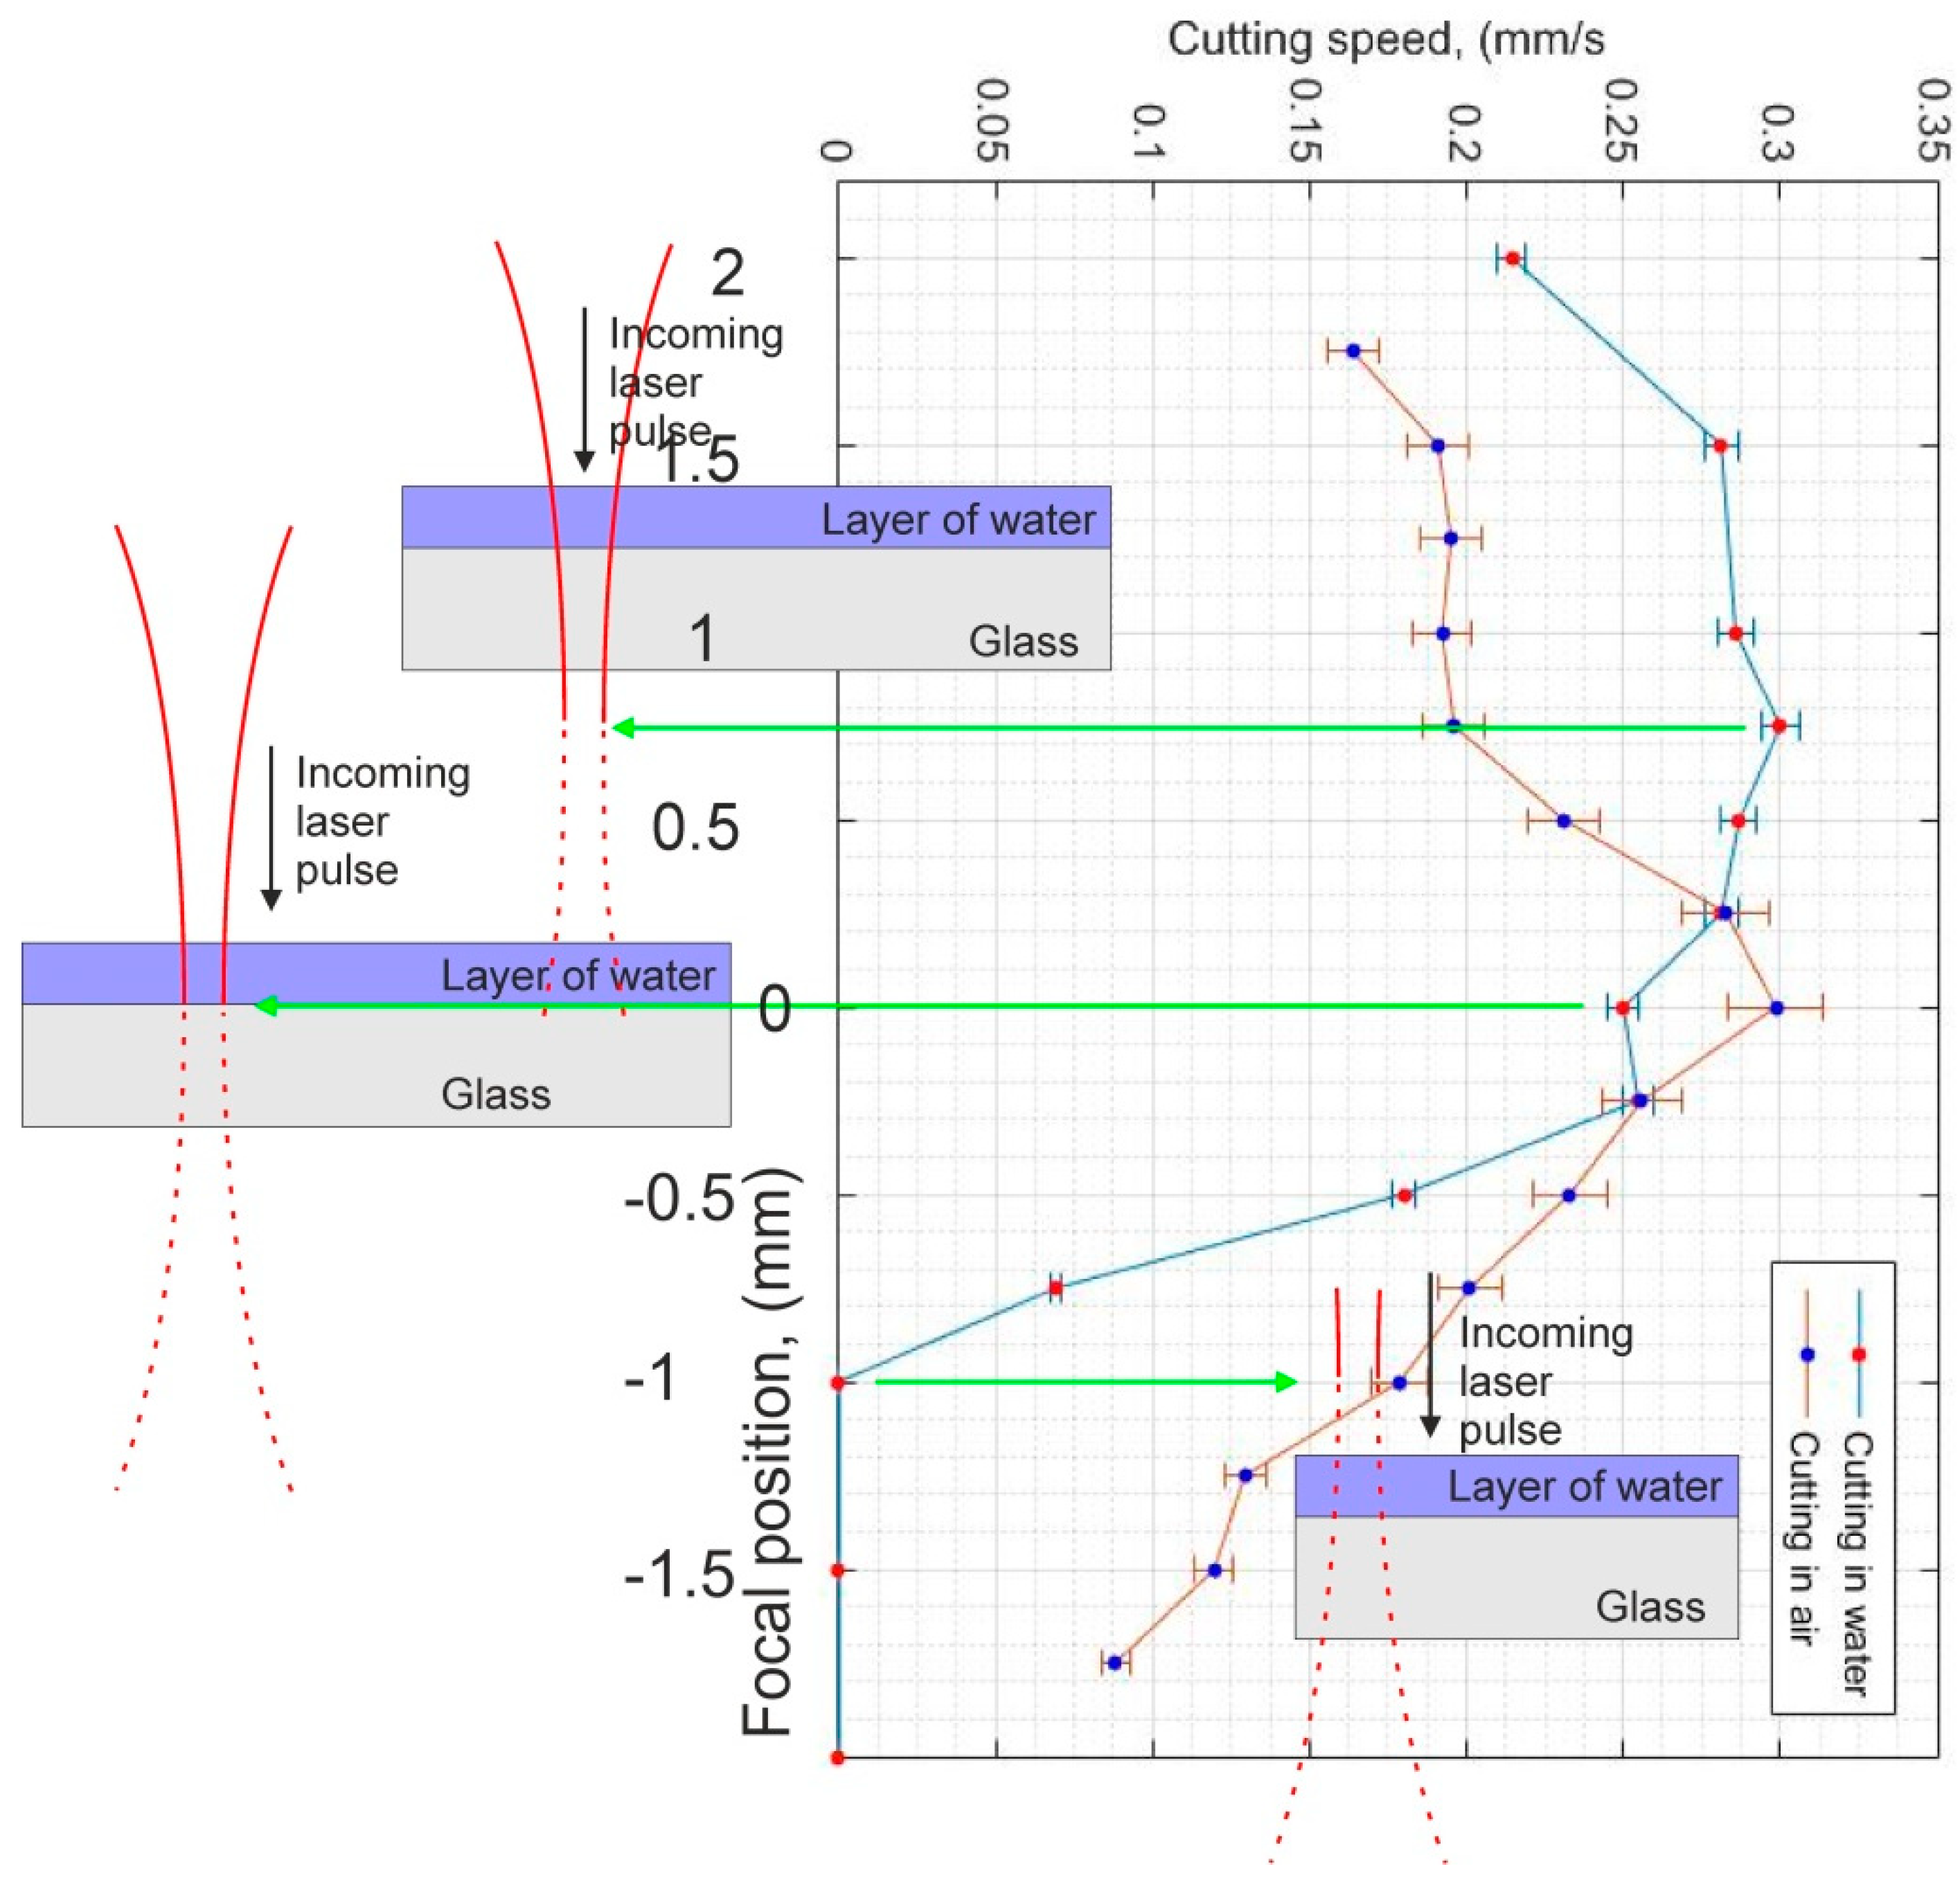
We observed that, for cutting in water, the position of the focal point relative to the surface of the sample exhibits an unusual departure from the conventional case of focusing the pulses in air. Fabrication efficiency is highest when the focal position is shifted below the surface of the sample and remains constant for a specific range of the focal position setting (in our studied range of parameters this was approximately 1 mm). It is worth mentioning that, given our focusing conditions, the Rayleigh range is approximately 1.1 mm which is larger than the thickness of the sample. In the graph presented in Figure 8 two different cases of cutting in air and in water are presented. The cutting rate is defined as an average cutting throughput for 1-mm thick, soda-lime glass samples at different focal position settings. For cutting in air, the cutting throughput is approximately the same within the Rayleigh range regardless of which direction (up or down) the focus is shifted. The graph peaks at the focal position as is expected and drops going in both directions, since the fluence scales as the square of the diameter of the beam and the diameter has the lowest value at this point. It should be mentioned that through-cuts (in 1-mm thick samples) were not produced for the cutting in air and the graph represents a dependency when 400 µm deep trenches were ablated. The cutting speed absolute values are valid only for the cutting in water; therefore, the curve that represents cutting in air should only be taken as a reference for the shape.
For cutting in water, a peak exceeding the error values was not observed. Instead, the cutting rate is somewhat constant, in the range from 1.5 mm to 0.5 mm below the surface of the sample, and afterwards it starts to drop. The ideal point for cutting would be to set the focus at approximately 0.75–1 mm below the surface of the sample. Interestingly, the cutting rate is lower by approximately 20% if the focal position is set at the surface of the sample (the ideal case when focusing in air). Shifting the focal position upwards even further results in a steep drop in cutting rate which ultimately becomes zero (meaning that it is impossible to produce a through-cut regardless of how long the fabrication is carried out) if the focal position is shifted 1 mm above the surface of the sample. It is worth mentioning that the focus positions are understood as the geometrical position relative to the surface plane, and the refraction of the beam passing through two materials having different refractive indices (water and glass) was not taken into consideration since the focusing was carried out with a long focal length (low NA) lens and the angle at which the beam hits the surface is near perpendicular. The asymmetry when translating the focal position in both directions relative to the surface of the sample cannot be explained in the conventional case. It is a result of the non-linear propagation of the beam within the water layer and its transformation from a Gaussian distribution, as described previously.
When the beam is focused precisely at the surface of the sample, the beam undergoes the transformation process from Gaussian to semi flat-top, however this happens at the cost of energy losses at the central part of the beam, as described previously. When modelling this scenario, it was noticed that in this case the beam exhibits the largest losses in the central part of the beam as compared with the other cases, and although this does produce ablation, a more efficient setting can be found.
When the focal position is set above the water, the energy losses are not as great as compared with the previous case, however the beam still expands because of the initial curvature of the wavefront present as a result of focusing with the lens. Therefore, the beam arrives at the surface having a larger radius, and the ablation process is slower as compared with the third case of focusing due to the lower intensity.
When the geometrical focal position is set below the surface of the sample, due to the larger radius of the beam travelling through the water layer, energy losses are not as great as compared with the first case, however the radius of the beam decreases because of the curved wavefront due to the lens focusing. In this case, the energy losses are lower as compared with the first case of focusing, whereas, the diameter of the beam at the surface is lower than the second case of focusing. In addition, the minimal radius is achieved at a certain depth of the sample. This balance between the differences of the radius and non-linear losses produces the flat plateau seen in Figure 8 with no clear maximum.
It is worth mentioning that, even though the best results (in terms of micromachining throughput) are obtained when the focal position is set 0.75 mm below the surface of the sample, since the beam is slightly defocused at the surface a larger crater (~80 µm), by approximately 30%, is produced as compared with a setting at position 0. The formation of the craters (as described in Figure 6) is not impacted by the defocusing and the same V-shape craters are created when focusing in air, whereas, the craters with a blunt apex are created when focusing in water.

3.3. Impact of Repetition Rate (Pulse Energy) for Different Thickness Settings of the Water Layer

The process is significantly impacted by the repetition rate of the laser (pulse energy) while keeping the same average power (10 W), as well as by the thickness of the water layer that is set. 
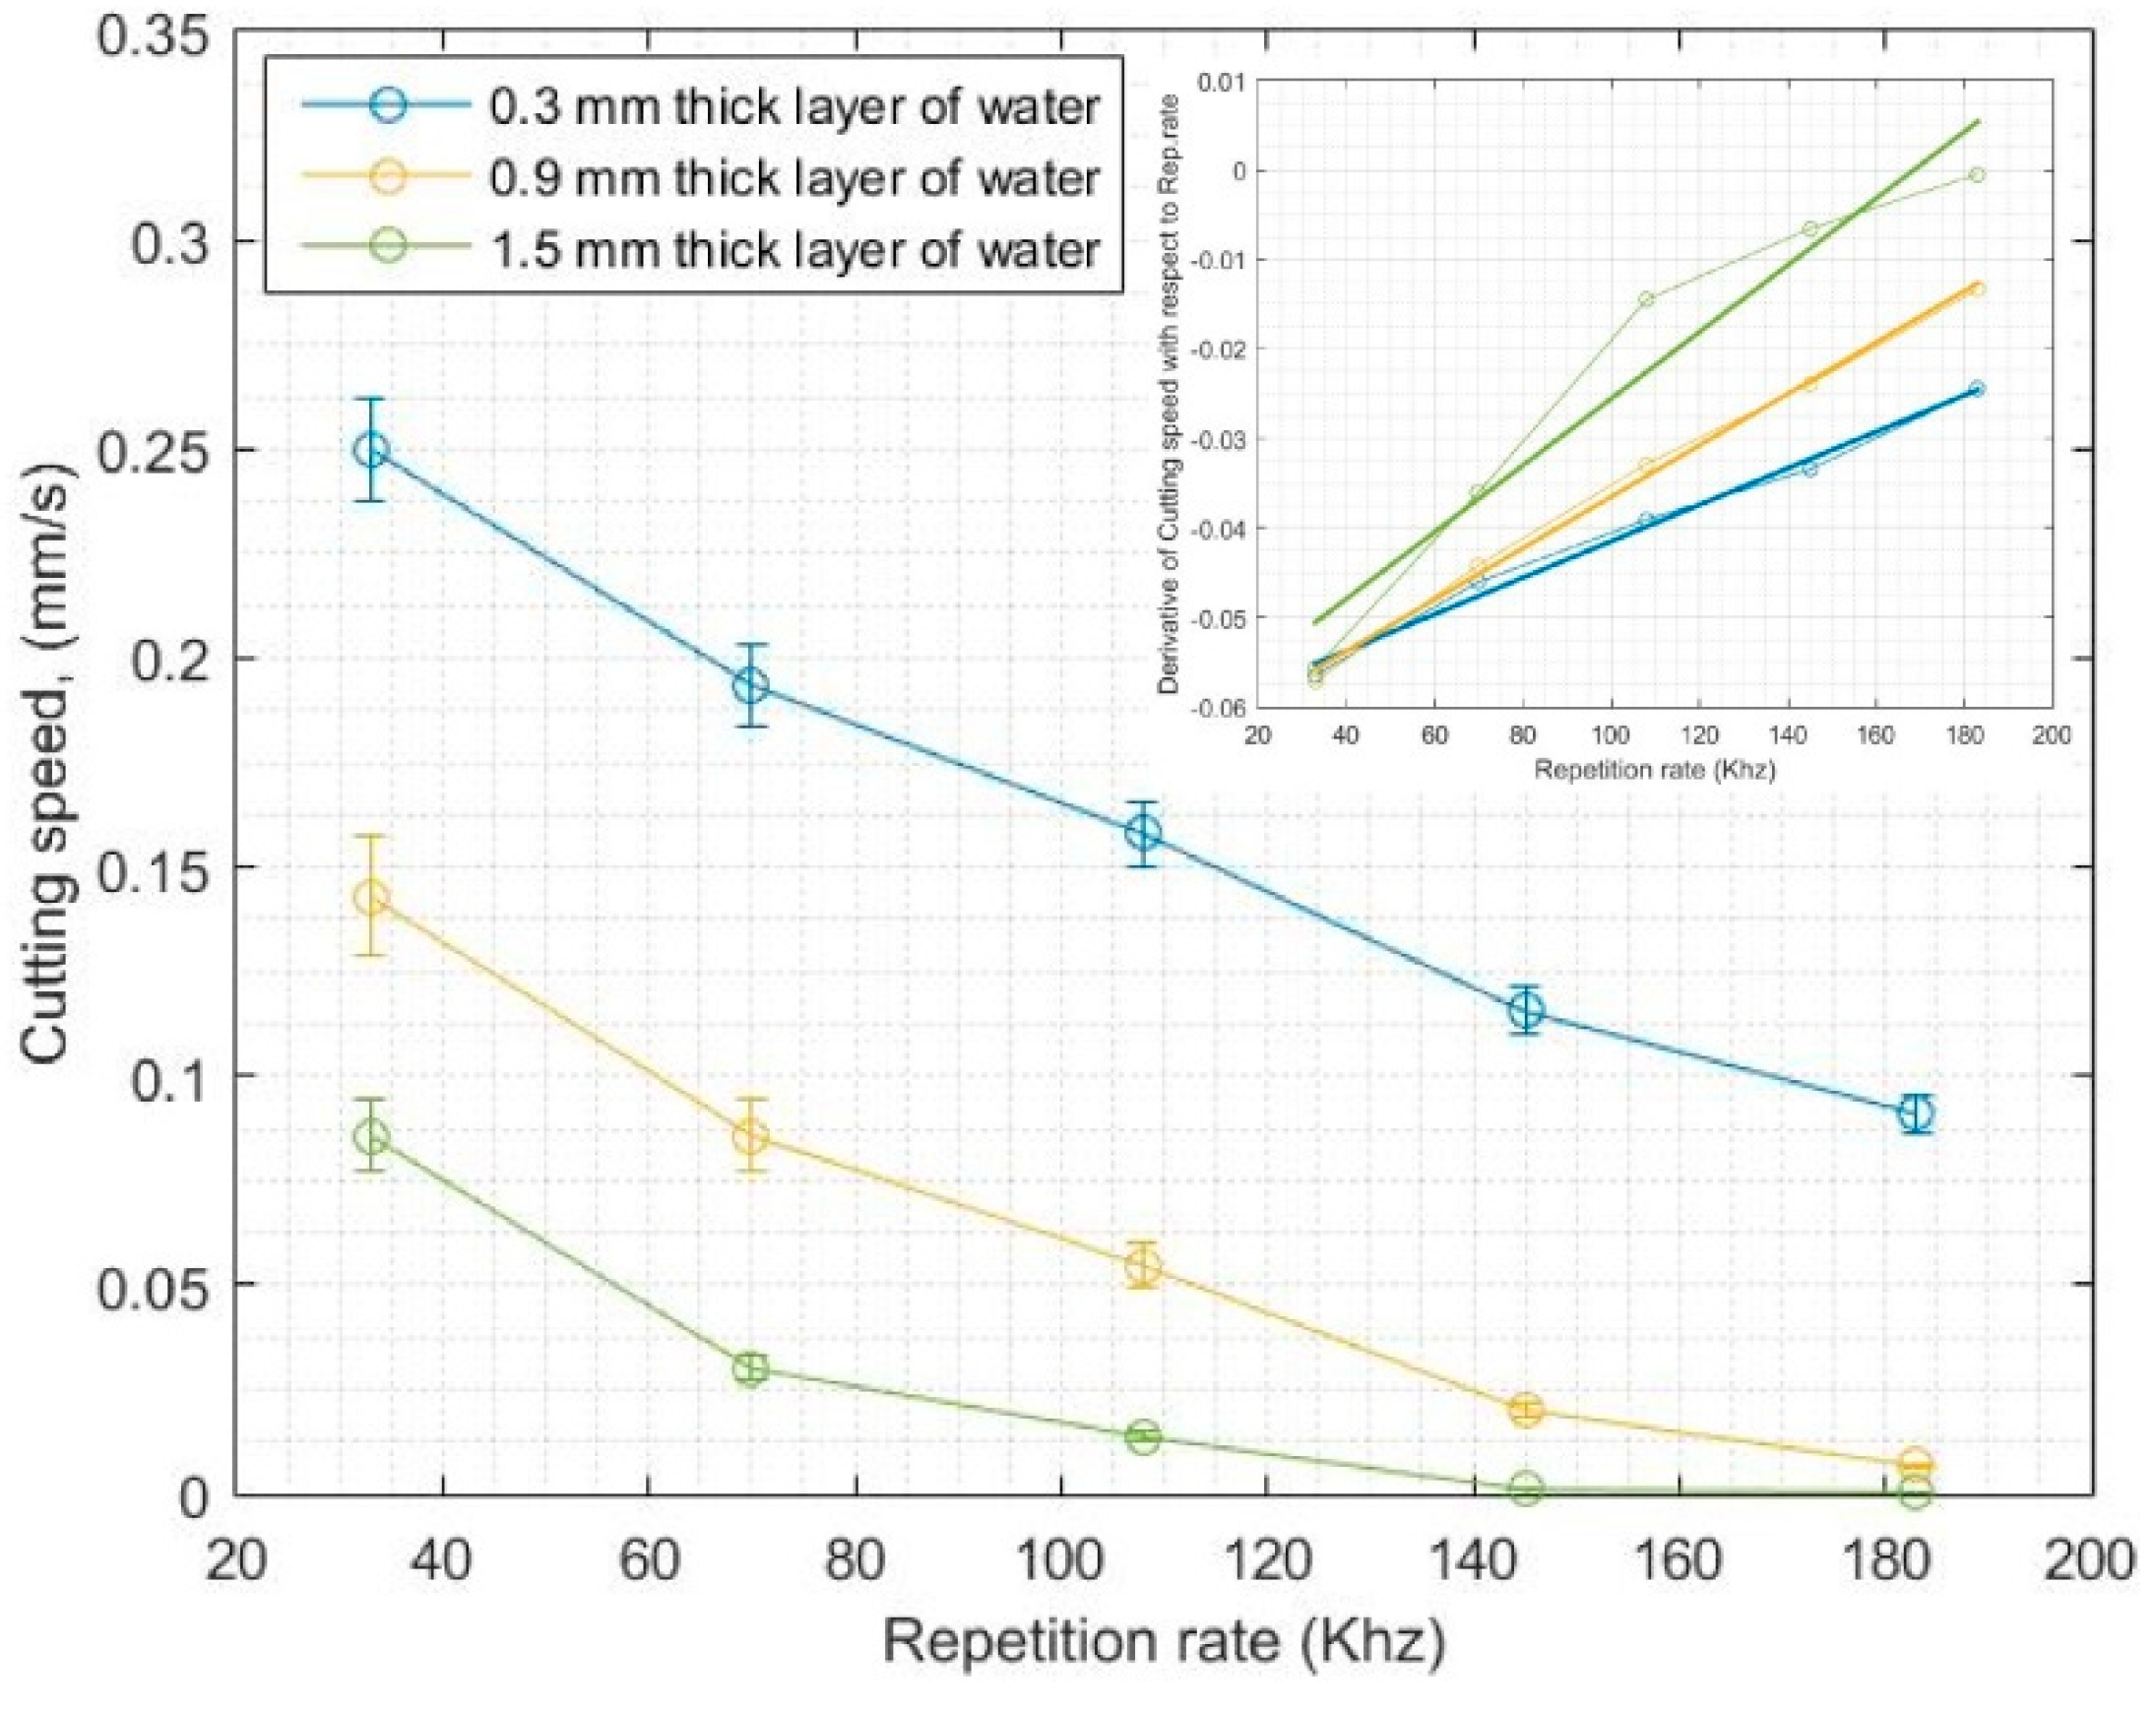
Figure 9 shows how the cutting speed varies when changing the repetition rate of the laser and when the thickness of the water layer is varied. On the basis of the considerations provided above with respect to the propagation of the beam when a layer of water is present above the sample, the outcomes when changing these parameters are not as intuitive as they are for ablation in air. It has already been demonstrated for high-energy pulses (>100 µJ, 18 J/cm2) that efficient cutting of the material is possible due to the transformation of the Gaussian intensity distribution. However, it is also evident that after a certain propagation distance, the beam breaks up and the intensity distribution resembles a complicated function with several peaks. The gradient of such a distribution has large absolute values, and overall this case is not suited for material removal since the energy density drops rapidly near the ablation threshold due to the change in the surface area. As shown in Figure 9, for the lowest repetition rate and thickness of the water-layer settings, the cutting rate is always highest and follows a quadratic drop when the repetition rate is increased. However, when changing from the minimum (0.3 mm) to the maximum (1.5 mm) setting of the water depth, the result changes several fold for the low-repetition rate setting and by a few orders of magnitude for the high-repetition rate setting. It appears that there is a linear interaction [51,52] between these two parameters, i.e., the result (cutting speed) scales as the linear product of the two parameters times a constant. By taking the derivative of the result (cutting speed) over the repetition rate for the three different cases of water, we see that the angle of the derivative increases, confirming that a linear interaction is present (see inset of Figure 9). This shows that the overall process is sensitive to variations in the thickness of the water layer and this sensitivity is dependent on the repetition rate. For the other micromachining parameters listed here, an analogous interaction was not detected. From an engineering point of view, the thickness of the water layer is the most difficult parameter to control since the wettability of the sample plays a part when adjusting the thickness. If the sample exhibits poor wettability due to surface contamination, droplets may form instead of a smooth even surface. Overall it is concluded that the process of micromachining when a water layer is present above the samples is practical only for the high-energy (>100 µJ, 18 J/cm
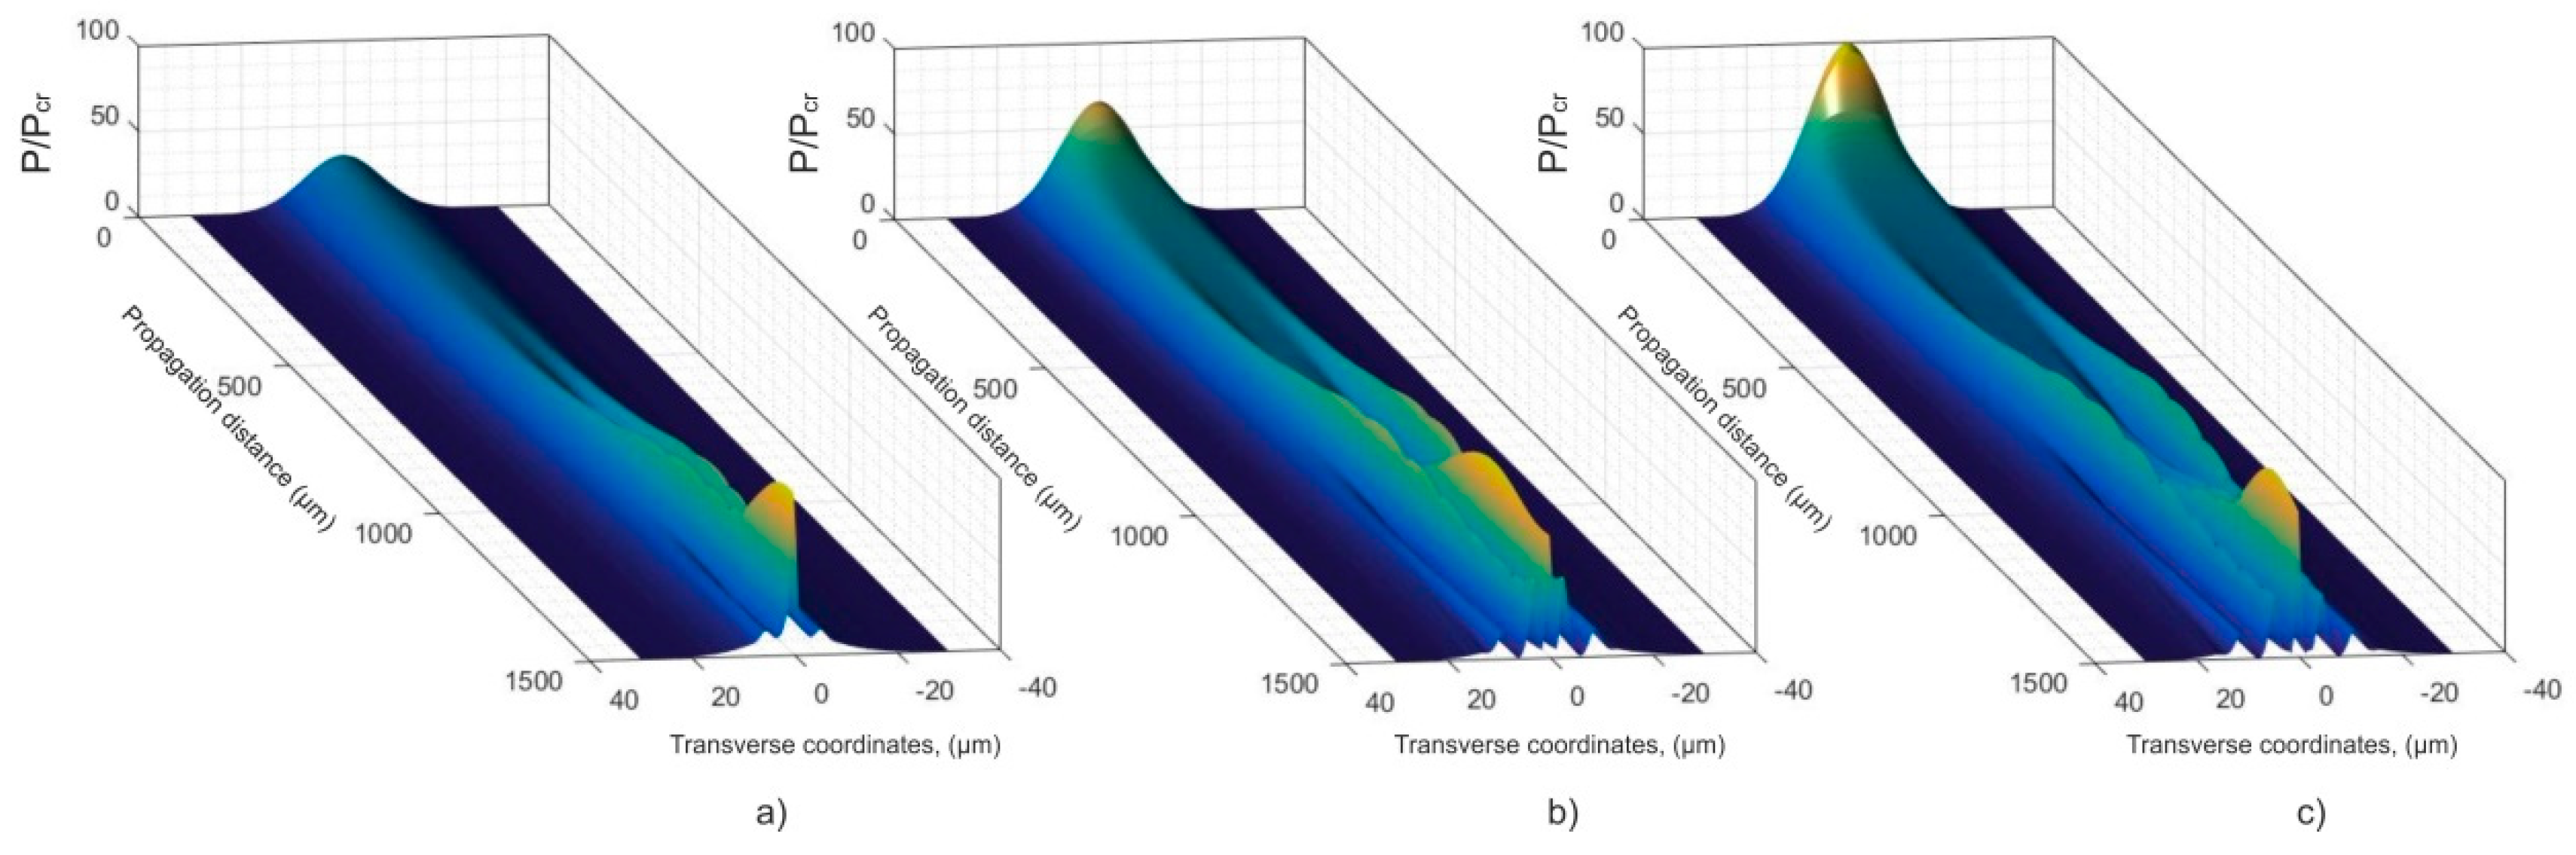
2) pulses (low repetition rate). To explain the interaction between the parameters, the propagation of the beam through 1.5 mm of water was simulated for three different energy settings (for consistency this will be displayed as the ratio P/PCR).
The result is described in Figure 10. For the 100 PCR, the situation is the same as described previously, i.e., the beam transforms to a semi flat-top distribution after less than 100 µm of propagation and retains this shape for another 800 µm of propagation. For the 33 PCR, the energy losses are not as rapid, and therefore the transformation of the Gaussian distribution to a near flat-top distribution occurs after approximately 500 µm of propagation. However, this shape is retained for only another 300 µm of propagation. This occurs because the beam has propagated for a relatively long distance while still having a Gaussian distribution (and non-zero gradient) and the phase accumulation due to the self-focusing term becomes significant enough to break up the beam relatively quickly after the semi flat-top distribution has manifested. For the 66 PCR, it is an intermediate case between the two stated situations.
It is concluded that if the thickness of the water layer is below 0.5 mm, the low-energy case is to some extent usable for cutting, however due to the breakup of the beam the ablation process becomes inefficient, thus explaining the results of Figure 9.

3.4. Impact of Beam Translation Rate along the Surface of the Sample When Cutting in Water

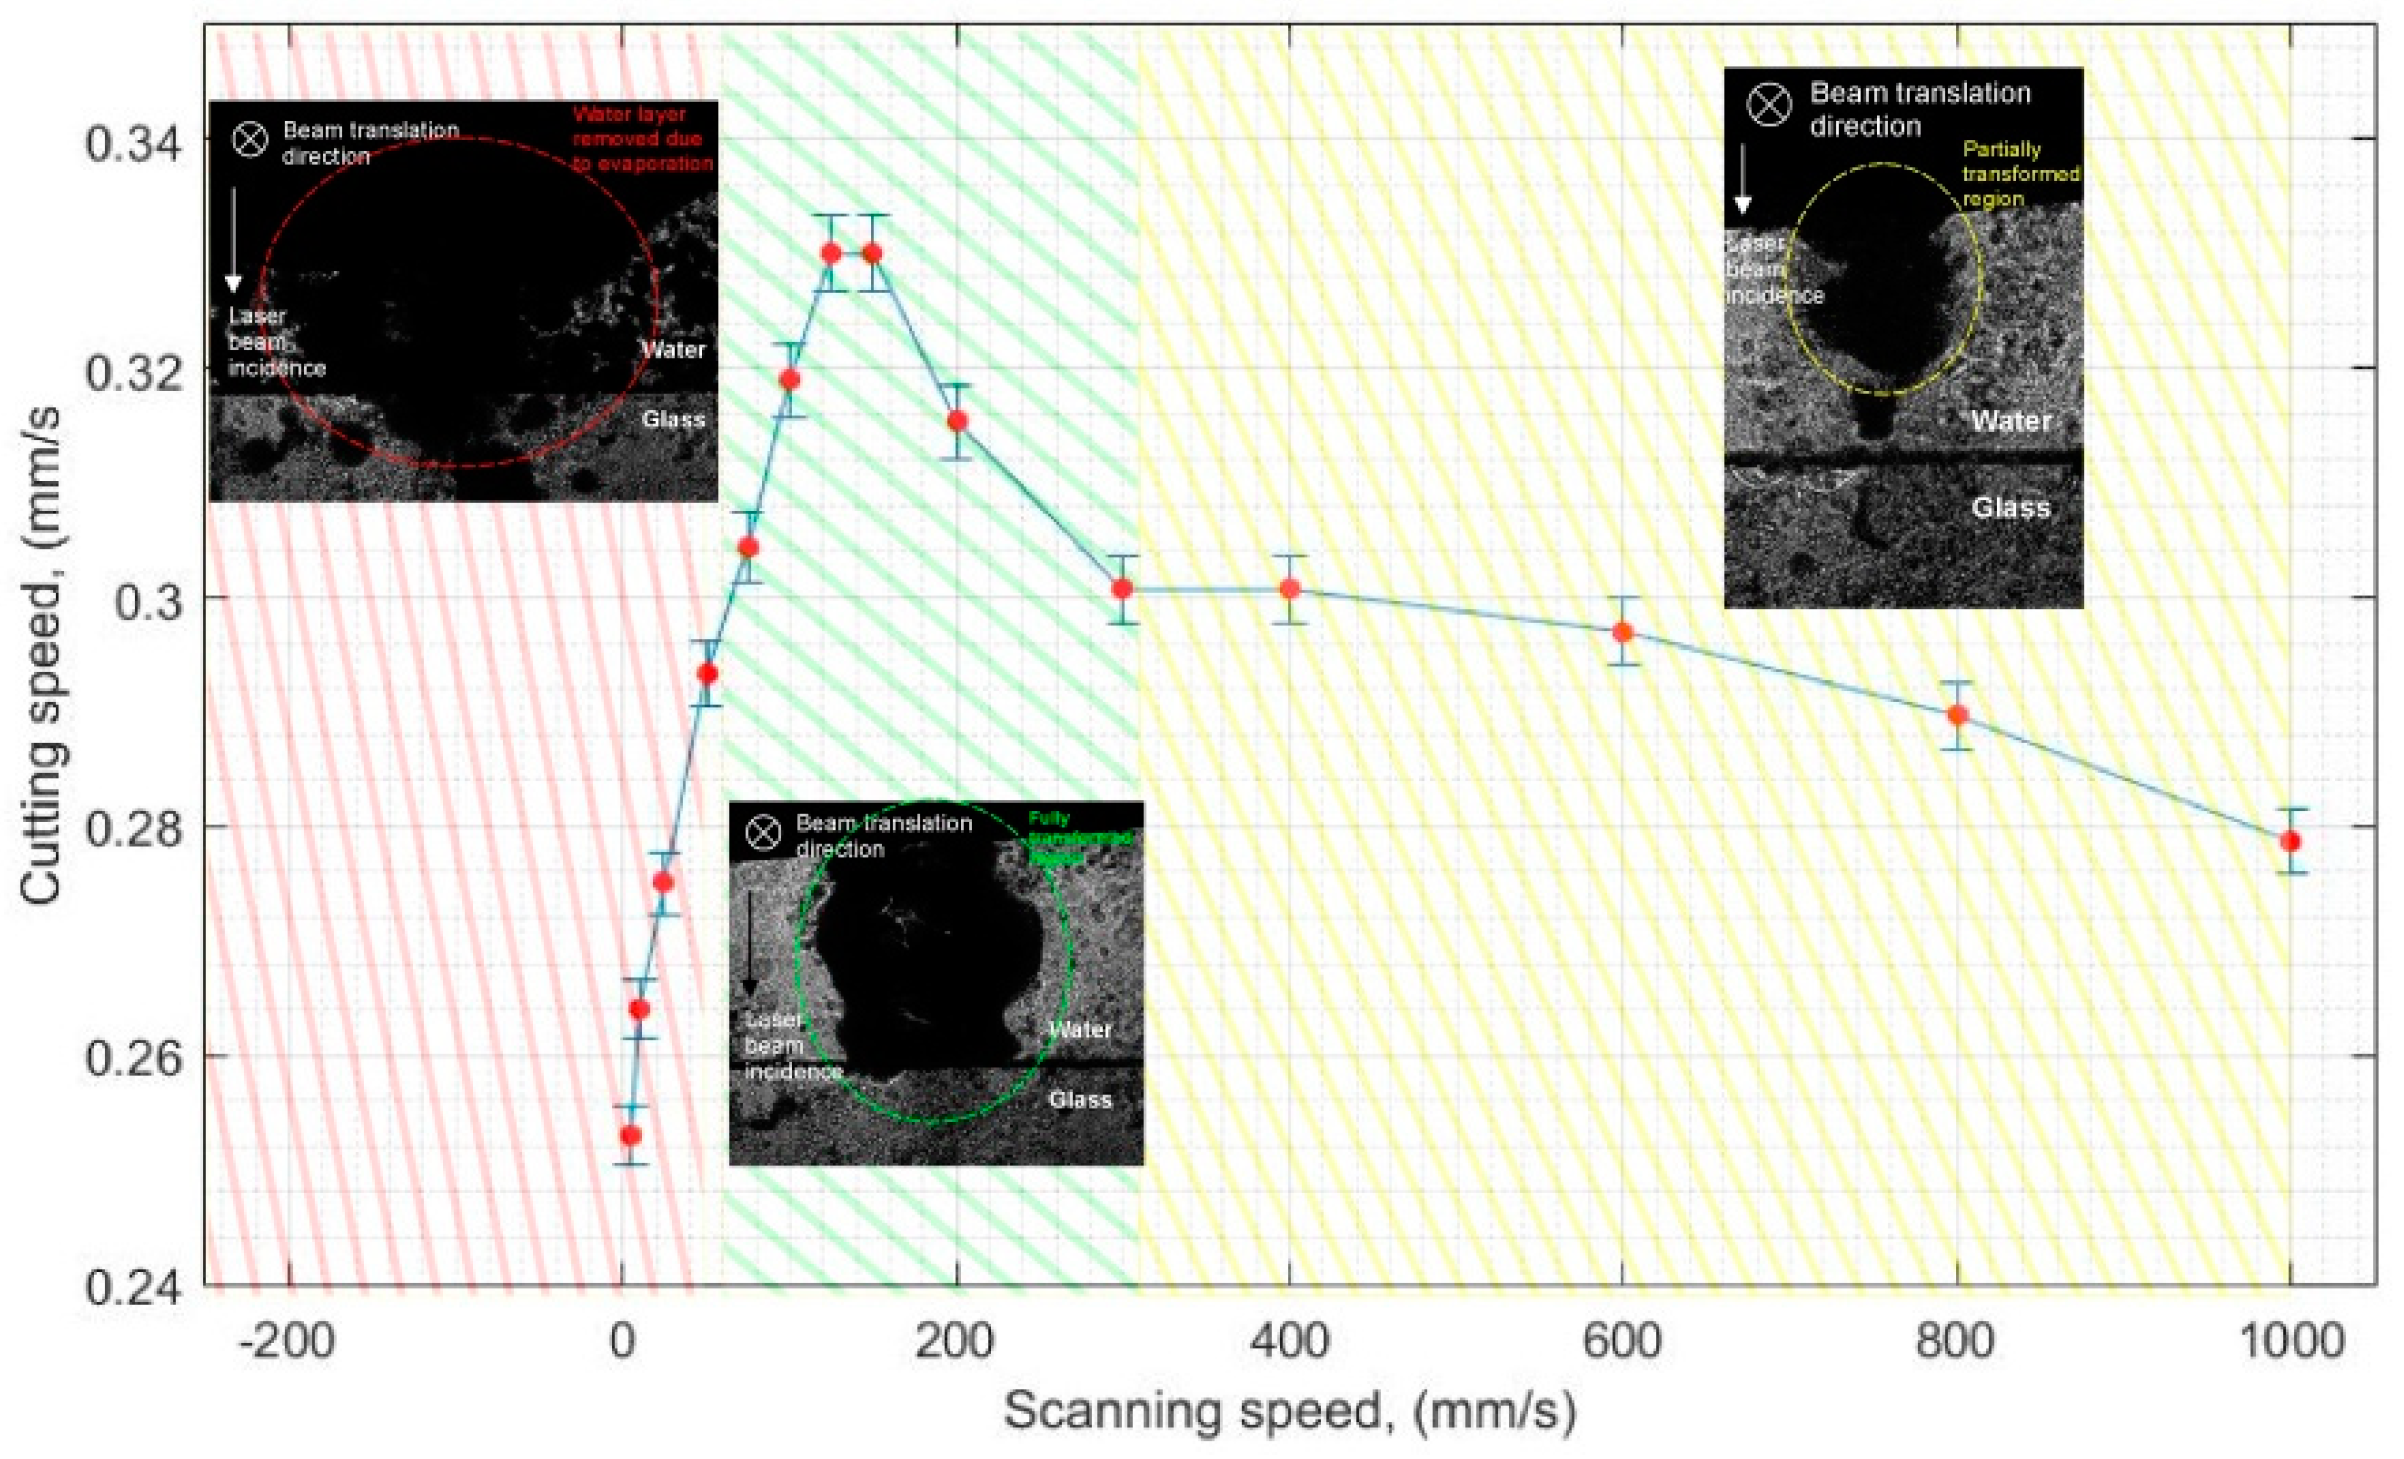
It was noticed that the rate at which the beam is scanned multiple times along the surface impacts the results as well, and a maximum is present at a specific scanning speed setting. This is illustrated in Figure 11. It is observed that the optimal conditions for cutting are from approximately 75 mm/s to 150 mm/s (for the scanning speed setting).
It is our belief that at a specific scanning speed setting a kind of optimal transformation of the water layer to a water-vapor state takes place so that the coefficient of non-linear losses and n2 are lower than in the case of water, although they are still significant enough that the flat-top–semi flat-top beam transformation is still possible. Such a case is to some extent visible when using the shadowgraphic setup and imaging the water and glass interface while the beam is being scanned. When scanning the beam at lower translation speeds (<50 mm/s), the water layer appears almost absent. For low scanning speeds, the pulse-to-pulse overlap is high, and as a portion of the energy is absorbed, the water layer is evaporated faster than it is replenished from the surrounding regions; in this case, the ablation process is similar to ablation in air and the process overall is less efficient as compared with other settings. The profile images of the grooves in this case strongly resemble the conventional V-shapes.
If the scanning speed is high (yellow region in Figure 11), the top portion of the water layer appears transformed, however, since the overlap is low in this case, each subsequent pulse needs to propagate though an unmodified layer of water, in which case it loses a significant portion of its energy until the photons arrive at the water-glass interface. Although this case is more efficient than the conventional case of ablation in air, as described in Section 3.1, apparently an even more efficient case is present when the water layer is fully transformed into a water-vapor state. This is represented by the green region in Figure 11. The volume through which the beam propagates appears dark with some reflections emerging from it. Most likely, this volume is a combination of water and vapor with a lower coefficient of non-linear losses (and different n2). However, experimental confirmation of that being the case is beyond the scope of this study for several reasons. With the use of light-probing techniques, only the integrated projection of the three-dimensional volume region is acquired, since the actual distribution of the water and vapor species are unknown and reconstruction of the object is not possible. The beam is constantly moving and probing is possible only in a narrow time window (since the probing equipment is stationary), which would make the experiments extend over a long period of time, as the samples would need to be relocated in order for ablation to occur at a new location every time. The region of interest produces the large scattering loss, therefore, sheet microscopy probing is not an option. It may be possible to image such a transient object (the transformed water and vapor region) using time-resolved tomography techniques (Optical coherence tomography OCT [53] may be a likely candidate), however this is a topic for future research. Since the ablation rate is highest in this case and the ablated channels also exhibit a blunt apex, as described previously, it is believed that the transformation of the Gaussian shape going through a medium with lower (as compared to water) non-linear losses is the main reason behind the shape of the curve depicted in Figure 11. It is known that the coefficient of nonlinear losses, as well as n2, are lower for water vapor [49,54,55], however that depends on various conditions of the water vapor. By taking a three-times lower coefficient of non-linear losses and a 10-times lower coefficient for n
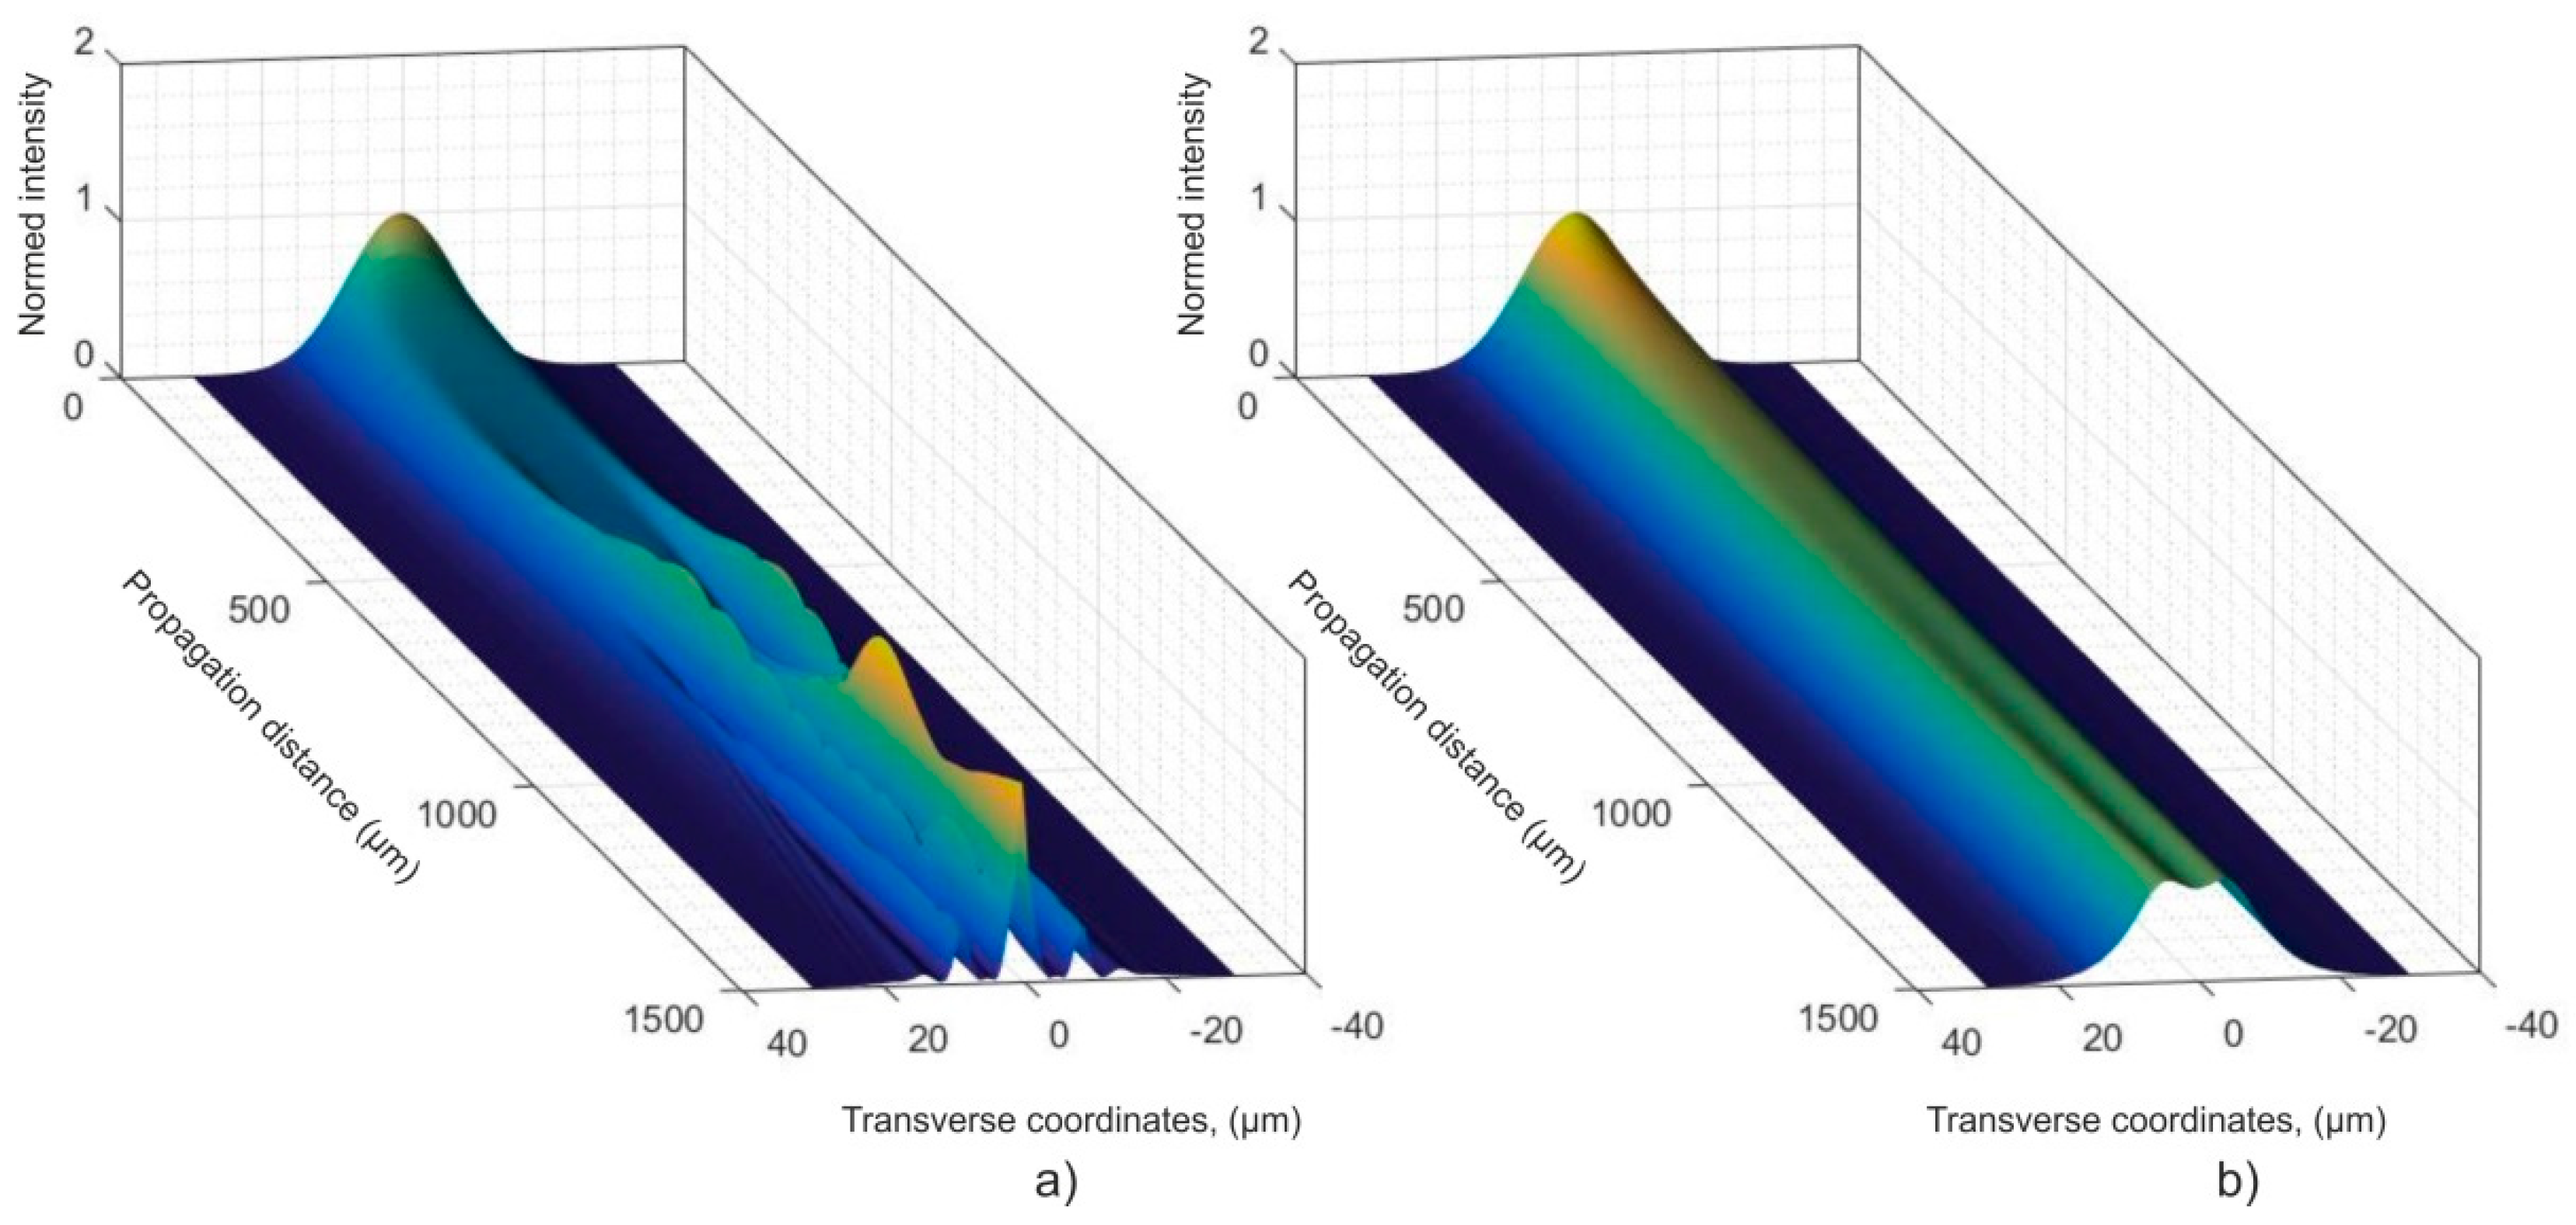
2 (a possible scenario for the transformed water layer), the propagation of the beam through the modified medium was studied numerically. The choice of how much these coefficients were lowered remains somewhat arbitrary, since the concentration, as well as the constituent species within the transformed region remain unknown. It is likely, that much lower values are achieved in the experimental case. In order to qualitatively demonstrate the result of beam propagation, these settings yield an adequate representation. The results are shown in Figure 12. The left side (a) of the image shows the beam as it propagates through water. This was described previously, and will not be discussed in order to avoid redundancy. The right side (b) shows the beam as it propagate through a modified layer. The most important consideration is that a semi flat-top intensity formation still occurs, whereas, the beam loses energy at a slower rate. In addition, when the beam passes through 1.5 mm of the medium, breakup of the beam was not observed. Since self-focusing still occurs, only the two protrusions around the corners of the distribution are present. This demonstrates that, indeed, lower non-linear losses and n2 are favorable for thick material processing, since a similar (as compared to water) semi-flat distribution is achieved and is sustained for a longer distance. It is our belief that this is the main reason for the peak of the cutting speed graph shown in Figure 11. In fact, the deepest crater that we were able to experimentally micromachine in glass reached 8 mm, suggesting that while micromachining is carried out and the crater becomes deeper, the properties of the modified layer also change, which ultimately lead to a severe prolongation of the semi flat-top intensity distribution and enable macroscale micromachining in the Z coordinate while the dimensions in the transverse direction remain in the microscale.

4. Conclusions

In this study, a micromachining process was investigated where soda-lime glass samples are covered with a layer of water and high-energy femtosecond pulses (>100 µJ, 18 J/cm2) are focused on the surface. The acquired data, in terms of micromachining throughput and shape of the provided craters, were compared with the conventional case of focusing the laser pulses in air. In addition, a theoretical basis is provided in order to numerically simulate the propagation of the femtosecond pulses through the non-linear medium, as well as for the formation of ablation craters. By studying the shape of the ablation craters produced, it was noticed in both cases that the craters produced while focusing femtosecond pulses in air exhibit a sharp apex near the bottom, while the craters produced in water appear blunt with steeper sidewalls. By numerically simulating the propagation of the beam and the formation of ablation craters we were able to show that this result is due to the transformation of the beam to a semi flat-top intensity distribution, which is maintained approximately throughout the thickness (1 mm) of the sample. As a consequence of the near flat-top distribution, the micromachining throughput overall is significantly higher when cutting the thick, practically macroscale samples. Since the energy density does not drop as fast due to the increase in the surface area while the depth of the crater increases, efficient ablation occurs at various depths of the sample, whereas, for the conventional case of focusing in air the ablation efficiency drops rapidly once a certain crater depth is reached inside the sample due to the increase in the surface area. In addition, we provide insights as to why there are different results while varying the micromachining parameters such as: focal position, repetition rate (pulse energy), and beam translation speed (when performing vector cutting). Interestingly, we find that that such a process is mostly usable with high energy pulses (>100 µJ, 18 J/cm2) due to the properties of the materials that are responsible for the intensity transformation process of the beam. In addition, due to the diffraction of light, such a process is not likely to perform well when focusing the beam within a water layer using sharper focusing optics (f < 5 cm).

Author Contributions

S.B. prepared the data for the article, assembled the experimental setup and organized the experiments, carried out part of the experiments, conceptualized the semi-empyrical model used for the simulation of ablation craters and peformed the numerical simulations, and wrote the article. E.G. prepared the basis for the theoretical model of beam propagation through non-linear media, performed the numerical simulations aided in various consultations. L.M. carried out part of the experiments and aided in editing the article. V.J. aided with numerical modelling cosultations regarding crater formations and algorithm stability issues. D.P. aided in experiment planning, organizing, and advised on the technical aspects of the micromachining setup. V.S. oversaw the entire study and consulted on various physical and technical aspects.

Funding

This project was partially funded from the European Regional Development Fund (ERDF), Grant No. 1.2.2-LMT-K-718-02-0017.

Conflicts of Interest

The authors declare no conflict of interest.

References

  1. Rizvi, N.H. Femtosecond laser micromachining: Current status and applications. Riken rev. 2003, 50, 107–112. [Google Scholar]
  2. Hwang, D.J.; Choi, T.Y.; Grigoropoulos, C.P. Liquid-assisted femtosecond laser drilling of straight and free-dimensional microchannels in glass. Appl. Phys. A 2004, 79, 605–612. [Google Scholar] [CrossRef]
  3. Jain, P.K.; Huang, X.; El-Sayed, I.H.; El-Sayed, M.A. Noble metals on the nanoscale: Optical and photothermal properties and some applications in imaging, sensing, biology, and medicine. Acc. Chem. Res. 2008, 41, 1578–1586. [Google Scholar] [CrossRef] [PubMed]
  4. Butkus, S.; Alesenkov, A.; Paipulas, D.; Kaškelytė, D.; Barkauskas, M.; Sirutkaitis, V. Micromachining of Transparent, Semiconducting and Metallic Substrates Using Femtosecond Laser Beams. J. Laser Micro/Nanoeng. 2016, 11, 81–86. [Google Scholar] [CrossRef]
  5. Schaffer, C.B.; Brodeur, A.; Mazur, E. Laser-induced breakdown and damage in bulk transparent materials induced by tightly focused femtosecond laser pulses. Meas. Sci. Technol. 2001, 12, 1784–1794. [Google Scholar] [CrossRef]
  6. Russbueldt, P.; Mans, T.; Weitenberg, J.; Hoffmann, H.D.; Poprawe, R. Compact diode-pumped 1.1 kW Yb:YAG Innoslab femtosecond amplifier. Opt. Lett. 2010, 35, 4169–4171. [Google Scholar] [CrossRef] [PubMed]
  7. Russbueldt, P.; Mans, T.; Hoffmann, H.; Poprawe, R. 1100 W Yb:YAG femtosecond Innoslab amplifier. In Proceedings of the SPIE 7912, Solid States Lasers XX: Technology and Devices, SPIE LASE, San Francisco, CA, USA, 1 April 2011; p. 79120R. [Google Scholar]
  8. Račiukaitis, G.; Brikas, M.; Gečys, P.; Voisiat, B.; Gedvilas, M. Use of High Repetition Rate and High Power Lasers in Microfabrication: How to Keep the Efficiency High? J. Laser Micro/Nanoeng. 2009, 4, 186–191. [Google Scholar] [CrossRef]
  9. Nedialkov, N.N.; Atanasov, P.A.; Simamova, S.E.; Ruf, A.; Berger, P.; Dausinger, F. Dynamics of the ejected material in ultra-short laser ablation of metals. Appl. Phys. A 2004, 79, 1121–1125. [Google Scholar] [CrossRef]
  10. Neuenschwander, B.; Jaeggi, B.; Schmid, M.; Hennig, G. Surface Structuring with Ultra-short Laser Pulses: Basics, Limitations and Needs for High Throughput. Phys. Procedia 2014, 56, 1047–1058. [Google Scholar] [CrossRef] [Green Version]
  11. Chung, S.H.; Mazur, E. Surgical applications of femtosecond laser. J. Biophotonics 2009, 2, 557–572. [Google Scholar] [CrossRef]
  12. Bauer, F.; Michalowski, A.; Kiedrowski, T.; Nolte, S. Heat accumulation in ultra-short pulsed scanning laser ablation of metals. Opt. Express 2015, 23, 1035–1043. [Google Scholar] [CrossRef] [PubMed]
  13. Romer, G.R.B.E.; Bechtoldb, P. Electro-optic and Acusto-optic Laser Beam Scanners. Phys. Procedia 2014, 56, 29–39. [Google Scholar] [CrossRef]
  14. Ran, A.; Li, Y.; Dou, Y.-P.; Fang, Y.; Yang, H.; Gong, Q.-H. Laser Micro-Hole Drilling of Soda-Lime Glass with Femtosecond Pulses. Chin. Phys. Lett. 2004, 21, 2465–2468. [Google Scholar] [CrossRef]
  15. Xu, S.; Yao, C.; Dou, H.; Liao, W.; Li, X.; Ding, R.; Zhang, L.; Liu, H.; Yuan, X.; Zu, X. An investigation on 800 nm femtosecond laser ablation of K9 glass in air and vacuum. Appl. Surf. Sci. 2017, 406, 91–98. [Google Scholar] [CrossRef]
  16. Zimmer, K.; Böhme, R. Laser-Induced Backside Wet Etching of Transparent Materials with Organic and Metallic Absorbers. Laser Chem. 2008, 2008, 170632. [Google Scholar] [CrossRef]
  17. Yu, J.; Sun, X.; Hu, Y.; Cui, D.; Chen, G. Study on ablation threshold of fused silica glass by femtosecond laser induced backside wet etching. In Proceedings of the SPIE 10964, Tenth International Conference on Information Optics and Photonics, Beijing, China, 11 July 2018. [Google Scholar]
  18. Loung, K.P.; Tanable, R.; Ito, Y. Machining on Rear Surface of a Silicon Substrate by an Infrared Femtosecond Laser via Non-linear Absorption Processes. Procedia CIRP 2016, 42, 73–76. [Google Scholar] [CrossRef]
  19. Vitek, D.N.; Block, E.; Bellouard, Y.; Adams, D.E.; Backus, S.; Kleinfeld, D.; Durfee, C.G.; Squier, J.A. Spatio-temporally focused femtosecond laser pulses for nonreciprocal writing in optically transparent materials. Opt. Express 2010, 18, 24673–24678. [Google Scholar] [CrossRef]
  20. Block, E.; Greco, M.; Vitek, D.; Masihzadeh, O.; Ammar, D.A.; Kahook, M.Y.; Mandava, N.; Durfee, C.; Squier, J. Stimultaneous spatial and temporal focusing for tissue ablation. Opt. Express 2013, 4, 832–841. [Google Scholar]
  21. Gottmann, J.; Hermans, M.; Repiev, N.; Ortmann, J. Selective Laser-Induced Etching of 3D Precision Quartz Glass Components for Microfluidic Applications—Up-Scaling of Complexity and Speed. Micromachines 2017, 8, 110. [Google Scholar] [CrossRef]
  22. Butkus, S.; Rickus, M.; Sirutkaitis, R.; Paipulas, D.; Sirutkaitis, V. Fabrication of High Aspect Ratio Channels in Fused Silica Using Femtosecond Pulses and Chemical Etching at Different Conditions. J. Laser Micro/Nanoeng. 2019, 14, 19–24. [Google Scholar]
  23. Stankevič, V.; Račiukaitis, G. Formation of rectangular channels in fused silica by laser-induced chemical etching. Lith. J. Phys. 2014, 54, 136–141. [Google Scholar] [CrossRef]
  24. Kudriasov, V.; Gaizauskas, E.; Sirutkaitis, V. Birefringent modifications induced by femtosecond filaments in optical glass. Appl. Phys. A 2008, 93, 571–576. [Google Scholar] [CrossRef]
  25. Yonemura, M.; Kato, S.; Hasegawa, K.; Takahashi, H. Formation of Through Holes in Glass Substrates by Laser-Assisted Etching. J. Laser Micro/Nanoeng. 2016, 11, 143–146. [Google Scholar] [CrossRef] [Green Version]
  26. Ross, C.A.; Maclachlan, D.G.; Choudhury, D.; Thomson, R. Optimisation of ultrafast laser assisted etching in fused silica. Opt. Express 2018, 26, 24343–24356. [Google Scholar] [CrossRef] [PubMed]
  27. Muhammad, N.; Whitehead, D.; Boor, A.; Oppenlander, W.; Liu, Z.; Li, L. Picosecond laser micromachining of nitinol and platinum–iridium alloy for coronary stent applications. Appl. Phys. A 2012, 106, 607–617. [Google Scholar] [CrossRef]
  28. Hendricksa, F.; Patelb, R.; Matylitsky, V.V. Micromachining of bio-absorbable stents with ultra-short pulse lasers. In Proceedings of the SPIE 9355, Frontiers in Ultrafast Optics: Biomedical, Scientific, and Industrial Applications XV, SPIE LASE, San Francisco, CA, USA, 9 March 2015; p. 935502. [Google Scholar]
  29. Robinson, G.M.; Jackson, M.J. Femtosecond laser micromachining of aluminium surfaces under controlled gas atmospheres. J. Mater. Eng. Perform. 2006, 15, 155–160. [Google Scholar] [CrossRef]
  30. An, R.; Hoffman, M.D.; Donoghue, M.A.; Hunt, A.J.; Jacobson, S.C. Water-assisted femtosecond laser micromachining of electrospray nozzles on glass microfluidic devices. Opt. Express 2018, 16, 15206–15211. [Google Scholar] [CrossRef]
  31. Rung, S.; Barth, J.; Hellmann, R. Characterization of Laser Beam Shaping Optics Based on Their Ablation Geometry of Thin Films. Micromachines 2014, 5, 943–953. [Google Scholar] [CrossRef]
  32. Laskin, A.; Šiaulys, N.; Šlekys, G.; Laskin, V. Beam shaping unit for micromachining. In Proceedings of the SPIE 8843, Laser Beam Shaping XIV, SPIE Optical Engineering + Applications, San Diego, CA, USA, 25–29 August 2013; p. 88430G. [Google Scholar]
  33. Garcia-Giron, A.; Sola, D.; Peňa, J.I. Liquid-assisted laser ablation of advanced ceramics and glass-ceramic materials. Appl. Surf. Sci. 2016, 363, 548–554. [Google Scholar] [CrossRef]
  34. Zhu, S.; Lu, Y.F.; Hong, M.H.; Chen, X.Y. Laser ablation of solid substrates in water and ambient air. J. Appl. Phys. 2001, 89, 2400–2404. [Google Scholar] [CrossRef]
  35. Kaakkunen, J.J.J.; Silvennoinen, M.; Paivasaari, K.; Vahimaa, P. Water-assisted Femtosecond Laser Pulse Ablation of High Aspect Ratio Holes. Phys. Procedia 2011, 12, 89–93. [Google Scholar] [CrossRef]
  36. Darwish, S.; Ahmed, N.; Alahmari, A.M.; Mufi, N.A. A comparison of laser beam machining of micro-channels under dry and wet mediums. Int. J. Adv. Manuf. Technol. 2015, 83, 1539–1555. [Google Scholar] [CrossRef]
  37. Muhammad, N.; Li, L. Underwater femtosecond laser micromachining of thin nitinol tubes for medical coronary stent manufacture. Appl. Phys. A 2012, 107, 849–861. [Google Scholar] [CrossRef]
  38. Kruusing, A. Subtractive Processing. In Handbook of Liquids—Assisted Laser Processing, 1st ed.; Elsevier Ltd.: Oxford, UK, 2008; pp. 143–207. [Google Scholar]
  39. Daminelli, G.; Krüger, J.; Kautek, W. Femtosecond laser interaction with silicon under water confinement. Thin Solid Films 2004, 467, 334–341. [Google Scholar] [CrossRef]
  40. Butkus, S.; Gaižauskas, E.; Paipulas, D.; Viburys, Ž.; Kaškelyė, D.; Barkauskas, M.; Alesenkov, A.; Sirutkaitis, V. Rapid microfabrication of transparent materials using filamented femtosecond laser pulses. Appl. Phys. 2014, 114, 81–90. [Google Scholar] [CrossRef]
  41. Butkus, S.; Alesenkov, A.; Paipulas, D.; Gaižauskas, E.; Melninkaitis, A.; Kaškelytė, D.; Barkauskas, M.; Sirutkaitis, V. Analysis of the Micromachining Process of Dielectric and Metallic Substrates Immersed in Water with Femtosecond Pulses. Micromachines 2015, 6, 2010–2022. [Google Scholar] [CrossRef] [Green Version]
  42. Butkus, S.; Paipulas, D.; Kaškelytė, D.; Gaižauskas, E.; Sirutkaitis, V. Improvement of Cut Quality in Rapid-Cutting of Glass Method via Femtosecond Laser Filamentation. J. Laser Micro/Nanoeng. 2015, 10, 59–63. [Google Scholar] [CrossRef]
  43. Abromavičius, G.; Buzelis, R.; Drazdys, R.; Juškevičius, K.; Kičas, S.; Tolenis, T.; Mirauskas, J.; Ščiuka, M.; Sirutkaitis, V.; Melninkaitis, A. Optical resistance and spectral properties of antireflective coatings deposited on LBO crystals by ion beam sputtering. Lith. J. Phys. 2011, 51, 303–308. [Google Scholar] [CrossRef]
  44. Shah, L.; Tawneym, J.; Richardson, M.; Richardson, K. Self-Focusing During Femtosecond Micromachining of Silicate Glasses. IEEE J. Quantum Electron. 2004, 40, 57–68. [Google Scholar] [CrossRef]
  45. Wu, Z.; Jiang, H.; Sun, Q.; Guo, H.; Yang, H.; Gong, Q. Micro-ablation at the front and rear surfaces of a fused silica window by using a femtosecond laser pulse in air. J. Appl. Opt. 2004, 6, 671–674. [Google Scholar] [CrossRef]
  46. Byer, R.L.; Harkin, A.; Ashmore, J.; Stone, H.W.; Shen, M.; Mazur, E. Morphology of femtosecond-laser-ablated borosilicate glass surfaces. Appl. Phys. Lett. 2003, 83, 3030–3032. [Google Scholar] [Green Version]
  47. Lawrence, L.; Tawney, J.; Richardson, M.; Richardson, K. Femtosecond laser deep hole drilling of silicate glasses in air. Appl. Surf. Sci. 2001, 183, 151–164. [Google Scholar]
  48. Butkus, S.; Paipulas, D.; Sirutkaitis, R.; Gaižauskas, E.; Sirutkaitis, V. Rapid Cutting and Drilling of Transparent Materials via Femtosecond Laser Filamentation. J. Laser Micro/Nanoeng. 2014, 9, 213–220. [Google Scholar] [CrossRef] [Green Version]
  49. Marble, C.B.; Clary, J.E.; Noojin, G.D.; O’Connor, S.P.; Nodurft, D.T.; Wharmby, A.W.; Rockwell, B.A.; Scully, M.O.; Yakovlev, V.V. Z-scan measurements of water from 1150 to 1400 nm. Opt. Lett. 2018, 43, 4196–4199. [Google Scholar] [CrossRef] [PubMed]
  50. Potemkin, F.V.; Mareev, E.I. Dynamics of multiple bubbles, excited by femtosecond filament in water: Role of aberrations. Laser Phys. Lett. 2015, 12, 015405. [Google Scholar] [CrossRef]
  51. Montgomery, D.C. Design and Analysis of Experiments, 1st ed.; John Wiley & Sons: New York, NY, USA, 2002. [Google Scholar]
  52. Jeffwu, C.F.; Hamada, M.S. Planning, Analysis, and Optimization, 1st ed.; John Wiley & Sons: New York, NY, USA, 2009. [Google Scholar]
  53. Huang, D.; Swanson, E.A.; Lin, C.P.; Schuman, J.S.; Stinson, W.G.; Chang, W.; Hee, M.R.; Flotte, T.; Gregory, K.; Puliafito, C.A.; et al. Optical coherence tomography. Science 1991, 254, 1178–1181. [Google Scholar] [CrossRef] [PubMed]
  54. Wilkes, Z.W.; Varma, S.; Chen, Y.-H.; Milchberg, H.M.; Jones, T.G.; Ting, A. Direct measurements of the nonlinear index of refraction of water at 815 and 407 nm using single-shot supercontinuum spectral interferometry. Appl. Phys. Lett. 2009, 94, 211102. [Google Scholar] [CrossRef] [Green Version]
  55. Zahedpour, S.; Wahlstrand, J.K.; Milchberg, H.M. Measurement of the nonlinear refractive index of air constituents at mid-infrared wavelengths. Opt. Lett. 2015, 40, 5794–5797. [Google Scholar] [CrossRef]
Figure 1. Micromachining setup. The laser beam is directed by a scanner and is focused using an f-theta lens (f = 100 mm) onto the sample that is covered with a thin layer of water.
Applsci 09 02405 g001
Figure 2. Change in the shape of the surface after a pulse impinges on the sample. (a), Coordinates of the surface (blue curve) after a Gaussian pulse (red curve) hits the surface of the sample. (b), derived depth vs. energy density (fluence) plot.
Applsci 09 02405 g002
Figure 3. Experimentally acquired ablation crater profiles (a) and numerically simulated crater profiles using Equation 4 (b). The pulse energy is 160 µJ (fluence = 29 J/cm2) in this case.
Applsci 09 02405 g003
Figure 4. Ablated depth vs. number of repetitions (a), for ablation in water and in ambient air. A magnified view from 1 to 700 repetitions is displayed in (b).
Applsci 09 02405 g004
Figure 5. Beam intensity distribution dynamics vs. propagation distance in water. The point 0 µm corresponds to the air-water interface, whereas, the point 1500 µm would correspond to the water-glass interface.
Applsci 09 02405 g005
Figure 6. The numerical evolution of the crater profiles while multiple pulses impinge on the surface. (a), 240 pulses impinge on the surface (Gaussian (top left inset) intensity distribution), (b) the evolution of the energy density due to the change in the surface area. (c), 240 pulses impinge on the surface (semi flat-top shape intensity distribution) and the total energy is 25% lower as compared with the Gaussian case, (d), the evolution of the energy density. (e) The depth is plotted against the number of pulses for the two cases. The individual lines show the shape after multiples of 10 pulses.
Applsci 09 02405 g006
Figure 7. Craters produced when ablating in air and when the samples are covered with a water layer. A different number of scans is required to reach a specific depth, one can estimate this number for both cases of cutting in air and in water in Figure 4. The images were acquired with an optical microscope in transmission mode.
Applsci 09 02405 g007
Figure 8. Cutting speed plotted against the focal position relative to the surface of the sample for cutting in air and in water. The scanning speed is 150 mm/s, pulse energy is 200 µJ.
Applsci 09 02405 g008
Figure 9. Cutting speed (for 1-mm thick, soda-lime glass samples) vs. repetition rate (pulse energy) when a layer of water of different thickness is placed above the samples. The average power is constant at 10 W for all cases.
Applsci 09 02405 g009
Figure 10. Beam intensity distribution dynamics vs. propagation distance in water when the initial energy of the beam is expressed as the ratio P/PCR. (a): 33 P/PCR, (b): 66 P/PCR, (c): 100 P/PCR. The point 0 µm corresponds to the air-water interface.
Applsci 09 02405 g010
Figure 11. Sample cutting speed vs. beam scanning speed along the surface of the sample.
Applsci 09 02405 g011
Figure 12. Beam propagation in water (a) and in a medium having lower non-linear losses and n2. (b).
Applsci 09 02405 g012
Table 1. Parameters varied during femtosecond laser micromachining experiments. The average power was kept constant at 10 W.
ParametersValue Range
Position of focus relative to the upper glass interface with water−1.5–1.5 (mm)
Scanning speed along the surface 20–1500 (mm/s)
Repetition rate of the laser33–200 kHz
Thickness of the water layer0.3–1.5 mm

