Article

Relationship of Total Hemoglobin in Subcutaneous Adipose Tissue with Whole-Body and Visceral Adiposity in Humans

1
Department of Sports Medicine for Health Promotion Tokyo Medical University, 6-1-1 Shinjuku, Shinjuku ku, Tokyo 160-8402, Japan
2
Department of Preventive Medicine and Public Health Tokyo Medical University, 6-1-1 Shinjuku, Shinjuku ku, Tokyo 160-8402, Japan
*
Author to whom correspondence should be addressed.
The authors contributed equally to this work.
Appl. Sci. 2019, 9(12), 2442; https://doi.org/10.3390/app9122442
Submission received: 6 April 2019 / Revised: 10 June 2019 / Accepted: 11 June 2019 / Published: 14 June 2019
(This article belongs to the Special Issue New Horizons in Time-Domain Diffuse Optical Spectroscopy and Imaging)

Abstract

:
High whole-body and visceral adiposity are risk factors that can cause metabolic diseases. We hypothesized that the total hemoglobin concentration (total-Hb) in abdominal subcutaneous adipose tissue (SATab), an indicator of white adipose tissue (WAT) vascularity, correlates negatively with risk factors for developing metabolic diseases, such as whole-body and visceral adiposity. We tested the optical characteristics of abdominal tissue in 140 participants (45 men and 95 women) who were apparently healthy individuals with a median age of 39 years. They also had a median body fat percentage of 25.4%, a visceral fat area of 50.4 cm2, and a SATab thickness of 1.05 cm. These tests were conducted using near-infrared time-resolved spectroscopy (NIRTRS) with a 2-cm optode separation. To distinguish the segments of SATab (SegSAT) and the mixture of muscle and SATab (SegSAT+Mus), the threshold was analyzed using the slopes of (total-Hb) against the thickness of SATab using the least-squares mean method. According to the results from the logistic regression analysis, the percentage of body fat and visceral fat area remained significant predictors of the (total-Hb) (p = 0.005 and p = 0.043, respectively) in the data for SegSAT (no influence from the SATab thickness). We conclude that simple, rapid, and noninvasive NIRTRS-determined (total-Hb) in WAT could be a useful parameter for evaluating risk factors for metabolic diseases.

1. Introduction

White adipose tissue (WAT), which is constantly remodeled by metabolic challenges, is one of the most plastic tissues in multicellular beings. The capillary density of WAT varies for individual organs depending on their metabolic rate, e.g., the capillary density of the prenatal depot is much higher than in the subcutaneous one [1]. The vascular network in the subcutaneous adipose tissue in the abdomen (SATab) of a non-obese group is greater than that for an obese group. Along with the increase in vascularity owing to the increase in energy demand due to exercise, mitochondrial gene expression in WAT can also shift to a metabolically active brown and/or beige type [2,3]. Thus, long-term adaptation or remodeling of the vascular network in adipocytes is needed for maintaining energy homeostasis in WAT [4].
To evaluate vascularity, an invasive sampling of WAT is needed. Invasive sampling prohibits widespread research on humans. Compared with visible light wavelengths, near-infrared (NIR) wavelengths in the range 700–3000 nm show less scattering and as a result they show better penetration into biological tissue. However, light absorption by water limits tissue penetration above the 900 nm wavelength, thus, the 650–850 nm range is suitable for measurements [5]. Several types of near-infrared spectroscopy (NIRS) allow for noninvasive monitoring of tissue oxygenation and hemodynamics in vivo [6,7,8,9,10]. Among them, NIR time-resolved spectroscopy (NIRTRS) is a method employing picosecond light pulse emissions from the skin surface for measuring the time distribution of the photons scattered and/or absorbed in tissue several centimeters away from the point of light emission. It noninvasively quantifies a range of tissue optical properties, including the absorption coefficient (µa), reduced scattering coefficient (µs′), and light path length, and allows for the calculation of tissue oxygenated hemoglobin concentration (oxy-Hb), deoxygenated hemoglobin concentration (deoxy-Hb), total hemoglobin concentration (total-Hb), and oxygen saturation (StO2) [5,10,11]. It was reported that (total-Hb) is an indicator of tissue vascularity and µs’ is a mitochondria parameter in the brown adipose and muscle tissues [12,13]. Although there is a difference in µs′ between muscle and WAT, the µs′ of WAT is unrelated to its mitochondrial content [13]. Thus, among the NIRTRS parameters, we have only chosen and used total-Hb as an indicator of tissue vascularity.
We hypothesize that total-Hb in the SATab is an indicator of WAT vascularity. These indicators correlate negatively with risk factors for developing metabolic diseases, such as whole-body and visceral adiposity. Thus, the purpose of this study was to confirm the relationship between the vascularity of a localized WAT and the risk factors for metabolic diseases.

2. Materials and Methods

2.1. Subjects and Study Design

For this study, 140 participants over 20 years of age were recruited (Table 1). Volunteers were recruited via poster advertisements in the Kanto region in Japan. The participants arrived at the laboratory and the following parameters were measured: (Total-Hb), (oxy-Hb), (deoxy-Hb), µa, µs′, SATab, percentage of whole-body fat (%BF), and visceral fat area (VFA). In this study, participants with different SATab thicknesses were chosen for obtaining the physiological and optical properties of SATab. The room temperature in the laboratory was regulated from 23 °C to 27 °C using an air-conditioner. The study design and protocols were approved by the institutional review boards of Tokyo Medical University (IRB 2017-199), in accordance with the ethical principles contained in the Declaration of Helsinki. Written informed consent was obtained from all the participants. This study was conducted in the summer season, July to August, in 2017 and 2018.

2.2. Measurements of Anthropometric Parameters

The SATab thickness was monitored using B-mode ultrasonography (Vscan Dual Probe; GE Vingmed Ultrasound AS, Horten, Norway). The measurement points were fixed 1.0 cm dorsally and ventrally from the center of the NIRTRS probe (the anterior axillary line across the umbilical height), which generally contains the thickest fat layer. The SATab thickness was measured by the investigator using the attached distance measuring system and calculated as the mean value of two measurements.
The %BF was estimated using the multi-frequency bioelectric impedance method (InBody 720, InBody Japan, Tokyo, Japan). The InBody 720 measured impedance at various frequencies (1, 5, 250, 500, and 1000 kHz) across the legs, arms, and trunk. All four extremities were in contact with the electrodes, and the participant stood barefoot on the device until the completion of the test. Measurements of total body water, %BF, fat mass, fat-free mass, and lean body mass were obtained. The electrical resistance of fat is greater than that of other tissues, such as muscle; therefore, the fat value is estimated by the alternating current resistance value [14]. The InBody 720 is an excellent body component analyzer that can measure 30 impedance values and 15 reactance values. The %BF measured by the InBody 720 and dual energy X-ray absorptiometry (DXA) showed a significant correlation (r2 = 0.858) [15]. The %BF measured by the InBody 720 and underwater weighing (a four-component model) showed a significant correlation (r = 0.85) [16].
The VFA, at the abdominal level of L4–L5, was estimated using a bioelectrical impedance analysis (EW-FA90; Panasonic, Osaka, Japan). The VFA can be calculated by applying the abdominal bioimpedance method and directly measuring the abdominal resistance due to VFA using impedance technology [17,18]. The VFA, as measured by bioimpedance and a CT examination, showed a significant correlation (r = 0.87) [17].

2.3. Measurements of (total-Hb), (oxy-Hb), (deoxy-Hb), µa, and µs

As the center of the NIRTRS probe was placed at the anterior axillary line across the umbilical height. The location of the light input and output was deviated 1.0 cm dorsally and ventrally from the center.
NIRTRS can evaluate optical properties, such as the absorption coefficient (µa) and reduced scattering coefficient (µs’), and therefore it can be used to noninvasively quantify tissue oxygenated hemoglobin (oxy-Hb), deoxygenated Hb (deoxy-Hb), and total Hb (total-Hb) concentrations. The µa, µs′, (total-Hb), (oxy-Hb), and (deoxy-Hb) in the abdominal region were measured for one minute using NIRTRS (TRS-20; Hamamatsu Photonics K.K., Hamamatsu, Japan). After a five minute rest, the probes were placed on the skin of the abdomen and participants were required to remain in a sitting position during the measurements. The optode separation for NIRTRS was 2 cm in this study.
The methods for calculating the µa, µs′, (total-Hb), (oxy-Hb), and (deoxy-Hb) were as follows: The target tissue in the abdominal region was repeatedly irradiated using semiconductor pulse laser lights of three different wavelengths (760, 800, and 830 nm). This was done under the conditions of a full width at half maximum of 100 ps, a pulse rate of 5 MHz, and an average output power at the optical irradiation fiber’s end of approximately 100 µW at each wavelength (the total average power level was 250–300 µW). The pulsed light that was scattered and absorbed inside the tissue was detected by a photomultiplier tube capable of single-photon detection. Time-resolved measurements were performed using the time-correlated single photon counting method. The values of µa and µs′ for the obtained tissue were estimated by fitting the temporal profile of the flux (reflectance) derived from the analytical solution of the photon diffusion equation R (ρ,t) (Equation (1)) that convolved the instrument response function to the time-response properties of the samples.
Where (t) is the response time, (ρ) is the distance between the light source and detector, µa and µs′ are the absorption coefficient and equivalent scattering coefficient, respectively, D = 1/3 µs is the photon diffusion coefficient, c is the velocity of light inside the light scattering medium (20 cm ns−1), Z0 (= 1/µs’) is the transport mean free path, and the average path length (L) (= ∫[R(ρ, t) t dt] c/∫ [R (ρ, t) dt]). (deoxy-Hb) and (oxy-Hb) were obtained using simultaneous equations with µa obtained from Equation (1) using the least-squares fitting method [19]. Then, the absolute (total-Hb) was calculated as the sum of (oxy-Hb) and (deoxy-Hb) [5,12] from the following calculation formula.
R (ρ, t) = (4πDc)−3/2∙Z0t−5/2 exp(−µa ct) exp[−(ρ2 + Z02)/4Dct]
[total-Hb] = [deoxy-Hb] + [oxy-Hb]
The data were collected every 10 seconds by the NIRTRS. The coefficient of variation (SD/mean) for repeated measurements of (total-Hb) was 4.9% [12].
Maximum permissible exposure (MPE) is the highest power or energy density (in W/cm2 or J/cm2) of the light source that is considered safe. Based on this MPE value, five classes (1, 2, 3A, and 4) for indicating the hazard that a laser product represents were defined as per the accessible emission limit (AEL); Class 1 is the most secure. NIRTRS was classified as Class 1 by both the Japanese Industrial Standards Committee (JIS) C 6802 and the International Electrotechnical Commission (IEC) 60825-1. Thus, the safety of using NIRTRS has been established.

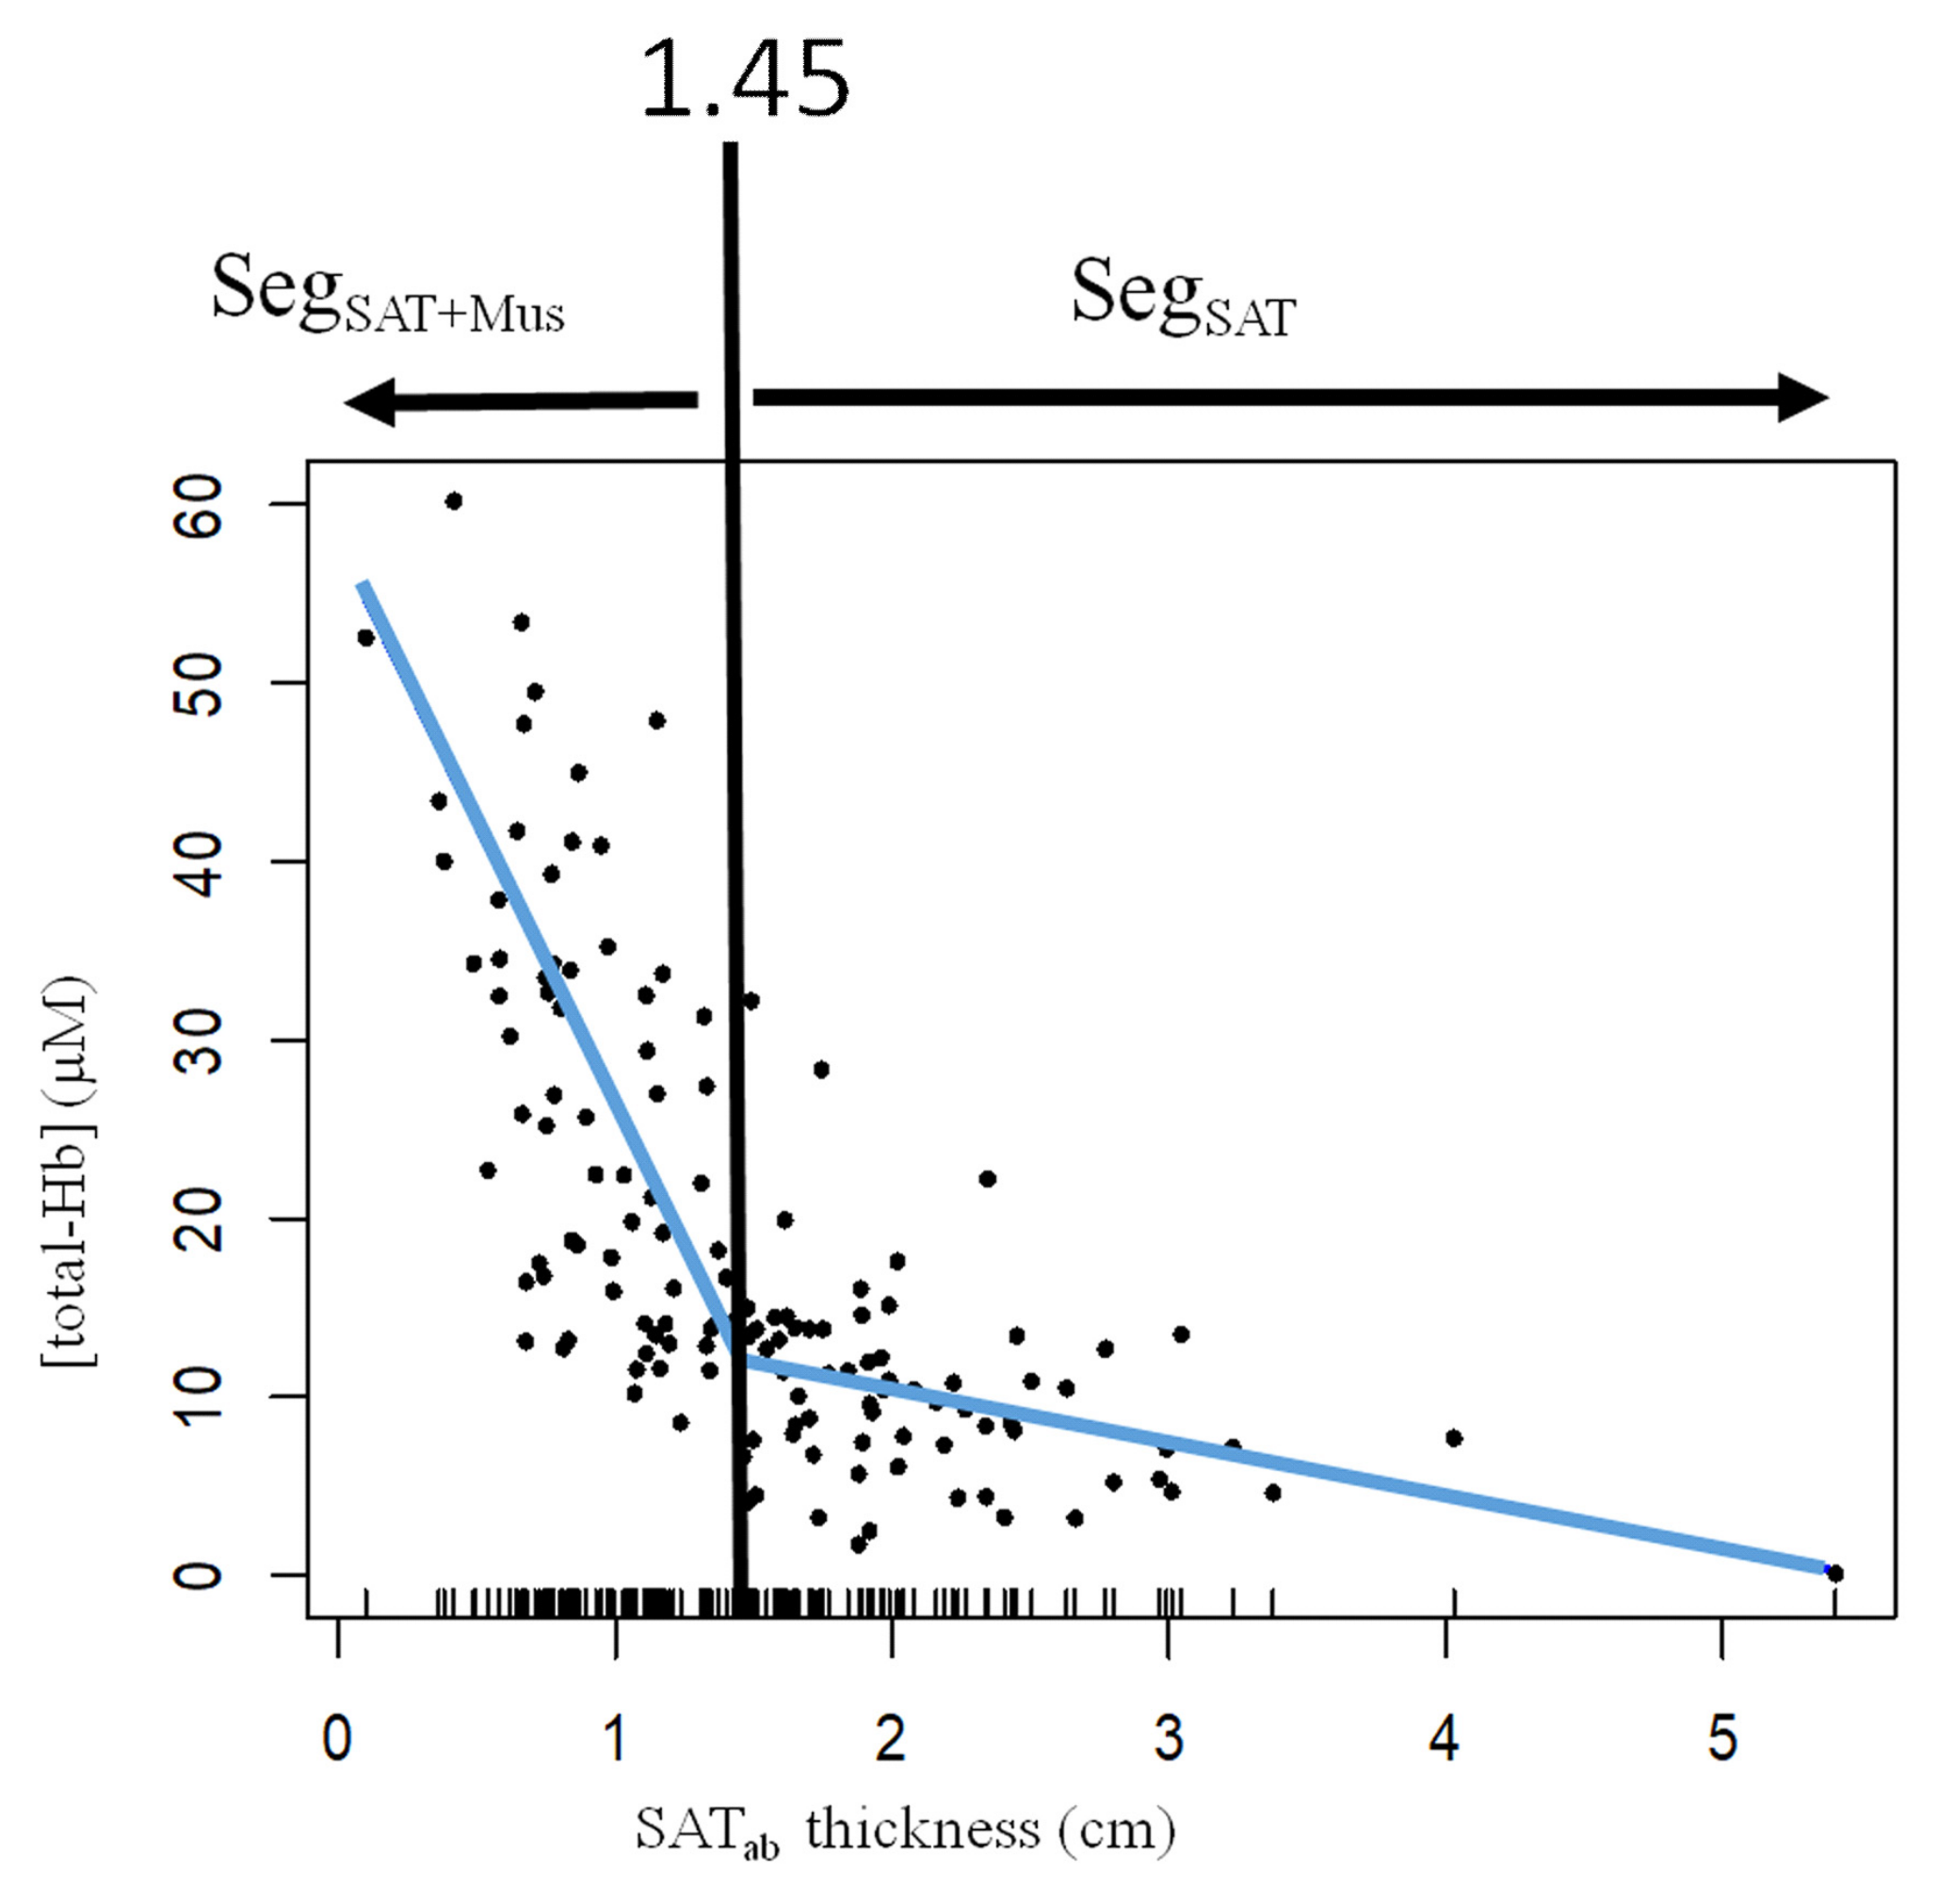
2.4. Data Analysis for the Threshold by Analyzing the Slopes of (total-Hb) against the Thickness of the Subcutaneous Adipose Tissue in the Abdomen (SATab)

To identify the thickness threshold of SATab for evaluating the SATab without the influence of the underlying muscle layer, the threshold was analyzed using the slopes of (total-Hb) against the thickness of SATab by the least-square mean method using the R software (v.3.5.2, R Foundation for Statistical Computing, Vienna, Austria, 2018). In this study, we attempted to identify the break-point location where the linear relation changes and in the relevant regression parameters (slopes of straight lines). The break-points were appropriately calculated using the ‘segmented’ Package. The two different slopes of (total-Hb) against the SATab thickness in the two segments primarily resulted from different (total-Hb) values between muscle and SATab. One has a steeper slope for a segment with lower values of SATab thickness; the other has a lower slope for a segment with higher SATab thicknesses (Figure 1). The former segment comprises data derived from the mixture of muscle and SATab (SegSAT+Mus) and the latter, the specific SATab (SegSAT). Thus, the threshold of the SATab thickness, or the x-value at the intersection of the two slopes, indicates the need to evaluate SATab without the influence of the underlying muscle layer.

2.5. Statistical Analyses

Data are expressed as a median (first and third quartile) ± standard deviation (SD). The Pearson’s product moment correlation coefficient was used to analyze the relationship between each parameter. Logistic regression analysis was conducted to assess the factors influencing (total-Hb). The predictor variables were median SATab thickness, %BF, and visceral fat area. To compare the participants’ profiles between SegSAT+Mus and SegSAT, we used the independent t-test or the Mann–Whitney test, as required. The analyses were performed using SPSS (IBM SPSS Statistics 25, IBM Japan, Tokyo, Japan, 2017), and P < 0.05 was considered statistically significant.

3. Results

3.1. Participant Profiles

As shown in Table 1, there were 140 participants. The median age was 39 years old (the age range being 22–67), the median %BF was 25.4 ± 7.12%, and the visceral fat area was 50.4 ± 37.6 cm2. In the abdominal region, the median (total-Hb) was 19.9 ± 15.8 µM, (oxy-Hb) was 13.4 ± 11.7 µM, (deoxy-Hb) was 6.88 ± 6.31 µM, µa was 0.054 ± 0.032 cm−1, and µs’ was 9.09 ± 1.45 cm−1. The minimum value of SATab thickness was 0.100 cm and the maximum value was 5.41 cm. The median SATab thickness was 1.50 ± 0.795 cm.
The SATab in the abdomen was measured using B-mode ultrasonography (Vscan Dual Probe; GE Vingmed Ultrasound AS, Hort e, Norway), whereas the thickness was measured using the attached distance measuring system by an investigator and calculated as the mean value of two measurements. Part A of Figure 1 is the ultrasonic image of the abdominal region in a 31-year-old woman. The mean layer thickness of the SATab was 0.638 cm. B is the ultrasonic image of the abdominal region in a 40-year-old woman. The mean layer thickness of the SATab was 1.91 cm.

3.2. The Thickness Threshold of the Subcutaneous Adipose Tissue in the Abdomen (SATab)

From the threshold analysis of the slope of (total-Hb) against the SATab thickness, the respective thresholds of the SATab thickness was 1.45 cm (Figure 2).
To identify the threshold of the thickness of SATab, a segment regression analysis was conducted using the R software. The regression equations were y = −31.5x + 57.8 and y = −3.0x + 16.6. The inflection point between the (total-Hb) and the SATab thickness. The left segment from the threshold line was defined as SegSAT+Mus, while the right, SegSAT.

3.3. Participant Profiles: SegSAT+Mus and SegSAT

Using the value of 1.45 cm from the threshold (Section 3.2), the participants were divided into two groups: SegSAT+Mus, with SATab less than 1.45 cm and the data derived from the SATab and muscle, and SegSAT., with SATab greater than 1.45 cm and the data derived from the SATab. Participant profiles for SegSAT+Mus and SegSAT are presented in Table 2. A significant difference was found in all items, when SegSAT+Mus and SegSAT were compared.

3.4. Predictor Analysis for (total-Hb) Using Body Indicators (SATab thickness, %BF, and Visceral Fat Area)

According to the results of the logistic regression analysis, the SATab thickness (p = 0.001) and %BF (p < 0.001) remained as significant predictors of the (total-Hb) in the data for SegSAT+Mus (Table 3A). The %BF and visceral fat area remained as significant predictors of the (total-Hb) (p = 0.005 and p = 0.043, respectively) in the data for SegSAT (no influence by the SATab thickness) (Table 3B).

4. Discussion

We found from the SATab (SegSAT) measurements that a significant correlation exists between microvascular density evaluated by (total-Hb) and whole body and visceral adiposity without influenced by the thickness of SATab.
We successfully discriminated data obtained from SegSAT (thickness of SATab ≧ approximately 1.5 cm) from those of SegSAT+Mus (thickness of SATab < approximately 1.5 cm) by analyzing the different slopes of (total-Hb) against the thickness of SATab. However, for both inhomogeneous SegSAT+Mus and homogeneous SegSAT, (total-Hb) decreases as SATab thickness increases. The correlation between the (total-Hb) and risk factors for metabolic diseases is specific to data obtained from SegSAT without being influenced by the thickness of SATab. The question arises as to why microvascular density in the SegSAT tends to vary in each individual [4]. It may be attributed to the findings that, due to changes in metabolic rates in adipocytes, adaptation or remodeling of the vascular network and mitochondrial phenotype or density are needed for maintaining energy homeostasis in WAT [4]. Previous studies also demonstrated that remodeling of the vascular bed occurs through close interaction of adipocytes with metabolic changes via angiogenic factors released by the adipocytes themselves (paracrinologic action) or by other organs (endocrinologic action) [20].
In a previous study, optical and physiological properties were measured using diffuse optical spectroscopic imaging for three months in overweight or obese individuals under calorie-restricted diets. This study found alterations in tissue structure, determined by optical scattering signals, that possibly correlate with reductions in adipose cell volume, improved SATab perfusion, and oxygen extraction determined by water and hemoglobin dynamics [21]. Our result is in accordance with the data, in that microvascular density is high in individuals with lower visceral and whole-body adiposity.
The most common, commercially available continuous wave NIRS (NIRCWS) provides only relative values of tissue oxygenation. The main reason for this method’s inability to provide quantitative data is the unknown path of NIR light through biological tissues [8,9,10]. It is suggested that the depth of light penetration is approximately 15 mm with a 30 mm optode separation for NIRCWS [9]. In contrast, NIRTRS measures the time distribution of the photons scattered and/or absorbed in tissue several centimeters from the point of light emission. It can also provide absolute values for tissue hemodynamics. Furthermore, according to a recent study [22], the mean depth of light penetration would be greater (approximately two-thirds of optode separation) and more homogeneous when NIRTRS is used. The difference between this model and the previous model is the following: µa and µs′ were 0.023 cm−1 and 10 cm−1, respectively, with the 3.0 cm separation optode at the 807 nm wavelength on the intralipid phantom in the previous study [22] and were 0.035 cm−1 and 8.404 cm−1, respectively, with the 2 cm optode separation at 800 nm in this study. The greater µa observed in the current study might allow for shallower penetration of photons.
The limitations of this study are the following: As this is a cross-sectional study, we could not draw a conclusive remark on whether the findings are true for a single individual encountering changes in weight. A longitudinal study is needed. In addition, only a part of the body, SATab, was measured, and the other parts of the body have not been considered. It is difficult to make explicit connections between the observed data and microscopic tissue properties (microvascular and mitochondrial densities) without accompanying histopathology evidence. We realize that obtaining this in a human subject study is challenging. Despite this, data can be obtained from an animal model to test these hypotheses. Furthermore, as the participants of this study were healthy people, it is necessary to examine whether the current results hold true for people with various risk factors. Moreover, as this study was conducted in the summer, seasonal differences might have an influence on the results. As the data determined by NIRTRS are derived based on a single-layered model, we should be careful to interpret current data with the multiple-layered (skin/fat/muscle) models. As the skin thickness is less than 0.2 cm and the inter-individual variation is small, we do not usually consider the effect of skin thickness. However, we should consider the effect of the overlying skin layer on the SATab measurement in the future. The distance between the transmitter and receiver was 2 cm with NIRTRS in this study; however, for measuring people with less adiposity, it would be more appropriate to use a 1 cm optode separation to specifically observe the optical and physiological characteristics of WAT.

5. Conclusions

We conclude that simple, rapid, and noninvasive NIRTRS-determined (total-Hb) in SATab could be a useful parameter for evaluating risk factors for metabolic diseases.

Author Contributions

Conceptualization, T.H.; formal analysis, M.K. and S.F.; investigation, M.K., S.F., S.A., T.H., R.K., T.E., and Y.K.; data curation, M.K. and S.F.; writing—original draft preparation, M.K.; writing—review and editing, Y.K., and T.H.; funding acquisition, T.H.

Funding

This work was supported by a Grant-in-Aid for Scientific Research from the Ministry of Education, Culture, Sports, Science, and Technology of Japan (15H03100).

Acknowledgments

This work was supported by a Grant-in-Aid for Scientific Research from the Ministry of Education, Culture, Sports, Science, and Technology of Japan (15H03100).

Conflicts of Interest

The authors declare that there are no conflicts of interest.

References

  1. Crandall, D.L.; Hausman, G.J.; Kral, J.G. A review of the microcirculation of adipose tissue: Anatomic, metabolic, and angiogenic perspectives. Microcirculation 1997, 4, 211–232. [Google Scholar] [CrossRef] [PubMed]
  2. Otero-Diaz, B.; Rodriguez-Flores, M.; Sanchez-Munoz, V.; Monraz-Preciado, F.; Ordonez-Ortega, S.; Becerril-Elias, V.; Baay-Guzman, G.; Obando-Monge, R.; Garcia-Garcia, E.; Palacios-Gonzalez, B.; et al. Exercise Induces White Adipose Tissue Browning Across the Weight Spectrum in Humans. Front. Physiol. 2018, 9, 1781. [Google Scholar] [CrossRef] [PubMed]
  3. Wang, H.; Lee, J.H.; Tian, Y. Critical Genes in White Adipose Tissue Based on Gene Expression Profile Following Exercise. Int. J. Sports Med. 2019, 40, 57–61. [Google Scholar] [CrossRef] [PubMed]
  4. Kadomatsu, T.; Oike, Y. Angiogenesis in adipose tissue and obesity. J. Clin. Exp. Med. (IGAKU NO AYUMI) 2014, 250, 761–765. [Google Scholar]
  5. Hamaoka, T.; McCully, K.K.; Quaresima, V.; Yamamoto, K.; Chance, B. Near-infrared spectroscopy/imaging for monitoring muscle oxygenation and oxidative metabolism in healthy and diseased humans. J. Biomed. Opt. 2007, 12, 062105. [Google Scholar] [CrossRef] [PubMed]
  6. Jobsis, F.F. Noninvasive, infrared monitoring of cerebral and myocardial oxygen sufficiency and circulatory parameters. Science 1977, 198, 1264–1267. [Google Scholar] [CrossRef]
  7. Delpy, D.T.; Cope, M. Quantification in tissue near-infrared spectroscopy. Philos. Trans. R. Soc. B Biol. Sci. 1997, 352, 649–659. [Google Scholar] [CrossRef]
  8. Ferrari, M.; Mottola, L.; Quaresima, V. Principles, techniques, and limitations of near infrared spectroscopy. Can. J. Appl. Physiol. 2004, 29, 463–487. [Google Scholar] [CrossRef]
  9. Chance, B.; Dait, M.T.; Zhang, C.; Hamaoka, T.; Hagerman, F. Recovery from exercise-induced desaturation in the quadriceps muscles of elite competitive rowers. Am. J. Physiol. 1992, 262, C766–C775. [Google Scholar] [CrossRef]
  10. Chance, B.; Nioka, S.; Kent, J.; McCully, K.; Fountain, M.; Greenfeld, R.; Holtom, G. Time-resolved spectroscopy of hemoglobin and myoglobin in resting and ischemic muscle. Anal. Biochem. 1988, 174, 698–707. [Google Scholar] [CrossRef]
  11. Hamaoka, T.; Katsumura, T.; Murase, N.; Nishio, S.; Osada, T.; Sako, T.; Higuchi, H.; Kurosawa, Y.; Shimomitsu, T.; Miwa, M.; et al. Quantification of ischemic muscle deoxygenation by near infrared time-resolved spectroscopy. J. Biomed. Opt. 2000, 5, 102–105. [Google Scholar] [CrossRef] [PubMed]
  12. Nirengi, S.; Yoneshiro, T.; Sugie, H.; Saito, M.; Hamaoka, T. Human brown adipose tissue assessed by simple, noninvasive near-infrared time-resolved spectroscopy. Obesity (Silver Spring) 2015, 23, 973–980. [Google Scholar] [CrossRef] [PubMed]
  13. Beauvoit, B.; Chance, B. Time-resolved spectroscopy of mitochondria, cells and tissues under normal and pathological conditions. Mol. Cell Biochem. 1998, 184, 445–455. [Google Scholar] [CrossRef] [PubMed]
  14. Lukaski, H.C.; Johnson, P.E.; Bolonchuk, W.W.; Lykken, G.I. Assessment of fat-free mass using bioelectrical impedance measurements of the human body. Am. J. Clin. Nutr. 1985, 41, 810–817. [Google Scholar] [CrossRef] [PubMed]
  15. Lim, J.S.; Hwang, J.S.; Lee, J.A.; Kim, D.H.; Park, K.D.; Jeong, J.S.; Cheon, G.J. Cross-calibration of multi-frequency bioelectrical impedance analysis with eight-point tactile electrodes and dual-energy X-ray absorptiometry for assessment of body composition in healthy children aged 6-18 years. Pediatr. Int. 2009, 51, 263–268. [Google Scholar] [CrossRef] [PubMed]
  16. Gibson, A.L.; Holmes, J.C.; Desautels, R.L.; Edmonds, L.B.; Nuudi, L. Ability of new octapolar bioimpedance spectroscopy analyzers to predict 4-component-model percentage body fat in Hispanic, black, and white adults. Am. J. Clin. Nutr 2008, 87, 332–338. [Google Scholar] [CrossRef] [PubMed]
  17. Ryo, M.; Nakamura, T.; Nishida, M.; Takahashi, M.; Hotta, K.; Matsuzawa, Y. Development of Visceral-fat Measuring Apparatus Using Abdominal Bioelectrical Impedance. J. Japan Soc. Stud. Obes. 2003, 136–142. [Google Scholar]
  18. Ryo, M.; Maeda, K.; Onda, T.; Katashima, M.; Okumiya, A.; Nishida, M.; Yamaguchi, T.; Funahashi, T.; Matsuzawa, Y.; Nakamura, T.; et al. A new simple method for the measurement of visceral fat accumulation by bioelectrical impedance. Diabetes Care 2005, 28, 451–453. [Google Scholar] [CrossRef] [PubMed]
  19. Ohmae, E.; Oda, M.; Suzuki, T.; Yamashita, Y.; Kakihana, Y.; Matsunaga, A.; Kanmura, Y.; Tamura, M. Clinical evaluation of time-resolved spectroscopy by measuring cerebral hemodynamics during cardiopulmonary bypass surgery. J. Biomed. Opt. 2007, 12, 062112. [Google Scholar] [CrossRef]
  20. Lemoine, A.Y.; Ledoux, S.; Queguiner, I.; Calderari, S.; Mechler, C.; Msika, S.; Corvol, P.; Larger, E. Link between adipose tissue angiogenesis and fat accumulation in severely obese subjects. J. Clin. Endocrinol. Metab. 2012, 97, E775–E780. [Google Scholar] [CrossRef]
  21. Ganesan, G.; Warren, R.V.; Leproux, A.; Compton, M.; Cutler, K.; Wittkopp, S.; Tran, G.; O’Sullivan, T.; Malik, S.; Galassetti, P.R.; et al. Diffuse optical spectroscopic imaging of subcutaneous adipose tissue metabolic changes during weight loss. Int. J. Obes. (Lond) 2016, 40, 1292–1300. [Google Scholar] [CrossRef] [PubMed] [Green Version]
  22. Gunadi, S.; Leung, T.S.; Elwell, C.E.; Tachtsidis, I. Spatial sensitivity and penetration depth of three cerebral oxygenation monitors. Biomed. Opt. Express 2014, 5, 2896–2912. [Google Scholar] [CrossRef] [PubMed] [Green Version]
Figure 1. Typical ultrasonic images of the subcutaneous adipose tissue in the abdominal region (SATab).
Applsci 09 02442 g001
Figure 2. The relationship between total hemoglobin concentration (total-Hb) and the thickness of the subcutaneous adipose tissue (SATab).
Applsci 09 02442 g002
Table 1. Participant profiles.
n = 140 (45 Men/95 Women)
Mean SD
Age (Year)39.3 ± 7.59
SATab thickness (cm)1.50 ± 0.80
%BF (%)25.4 ± 7.12
visceral fat area (cm2)50.4 ± 37.6
in the abdomen
(total-Hb) (µM)19.9 ± 15.8
(oxy-Hb) (µM)13.4 ± 11.7
(deoxy-Hb) (µM)6.88 ± 6.31
µa (cm−1)0.054 ± 0.032
µs’ (cm−1)9.09 ± 1.45
Values are expressed as median ± standard deviation (SD). %BF, percentage of whole-body fat; (total-Hb), total hemoglobin; (oxy-Hb), oxy hemoglobin; (deoxy-Hb), deoxy hemoglobin; µa, absorption coefficient; and µs’, reduced scattering coefficient of the subcutaneous adipose tissue in the abdomen (SATab) were measured. The distance between transmission and detection with near-infrared time-resolved spectroscopy (NIRTRS) in the abdomen was 2 cm.
Table 2. Participant profiles.
A SegSAT+Mus B SegSAT p-Value
n = 72 (26 men/46 women)n = 68 (19 men/49 women)
Mean SD Mean SD
age (year)37.5 ± 7.14 age (year)41.2 ± 7.63= 0.004 b
SATab thickness (cm)0.911 ± 0.312 SATab thickness (cm)2.12 ± 0.67 <0.001 a
%BF (%)21.4 ± 6.04 %BF (%)29.6 ± 5.63 <0.001 a
visceral fat area (cm2)39.1 ± 28.8 visceral fat area (cm2)62.3± 41.8<0.001 b
in the abdomen in the abdomen
(total-Hb) (µM)29.1±16.8(total-Hb) (µM)10.2 ± 5.63 <0.001 b
(oxy-Hb) (µM)20.2 ±12.4(oxy-Hb) (µM)6.14 ±3.99 <0.001 b
(deoxy-Hb) (µM)9.47 ±7.46(deoxy-Hb) (µM)4.15 ±2.96 <0.001 b
µa (cm−1)0.073 ± 0.0337 µa (cm−1)0.035 ± 0.0119 <0.001 b
µs’ (cm−1)9.75 ± 1.30 µs’ (cm−1)8.40 ± 1.27 <0.001 a
Values are expressed as median ± standard deviation (SD). SegSAT+Mus, participants whose SATab was less than 1.45 cm with the data derived from the SATab and muscle; SegSAT, participants whose SATab was greater than 1.45 cm with the data derived from the SATab; %BF, percentage of whole-body fat; (total-Hb), total hemoglobin; (oxy-Hb), oxy hemoglobin; (deoxy-Hb), deoxy hemoglobin; µa, absorption coefficient; µs’, reduced scattering coefficient; and SATab, subcutaneous adipose tissue in the abdomen are shown. The distance between transmission and detection with NIRTRS in the abdomen was 2 cm. SegSAT+Mus is data derived from the mixture of SATab and muscle; SegSAT is data derived from the SATab. To compare the participants’ profiles between SegSAT+Mus and SegSAT, we used independent t-test or the Mann–Whitney test, as appropriate. A: Independent t-test and b: Mann–Whitney test.
Table 3. Logistic regression analysis.
ASegSAT+Mus n = 75
95% C.I. for EXP (B)
pExp(B)LowerUpper
(total-Hb)
SATab thickness0.009 **0.022 0.001 0.384
%BF0.001 **0.739 0.622 0.878
visceral fat area0.030 *0.9560.9170.996
BSegSAT n = 65
95% C.I. for EXP (B)
pExp(B)LowerUpper
(total-Hb)
SATab thickness----
%BF0.004 **0.8300.7310.941
visceral fat area0.044 *0.982 0.966 1.000
Relationship between (total-Hb) in the abdomen and body indicators, such as subcutaneous adipose tissue in the abdomen (SATab) thickness, %BF, and visceral fat area. Data derived from SATab. SegSAT+Mus, SATab thickness is less than 1.45 cm; SegSAT, SATab thickness is over 1.45 cm.

