The Optimized Production of 5-(Hydroxymethyl)furfural and Related Products from Spent Coffee Grounds

1
Department of Chemical Engineering, University of Bath, Bath BA2 7AY, UK
2
Department of Pharmacy & Pharmacology, University of Bath, Bath BA2 7AY, UK
*
Author to whom correspondence should be addressed.
Appl. Sci. 2019, 9(16), 3369; https://doi.org/10.3390/app9163369
Submission received: 16 July 2019
/
Accepted: 13 August 2019
/
Published: 15 August 2019
(This article belongs to the Special Issue Effective Biorefineries through the Co-production of Chemicals and Biofuels)
Abstract
:Featured Application
This work demonstrates the suitability of spent coffee waste to be fractionated by an organosolv process for further valorization.
Abstract
The increasing consumption of coffee worldwide has led to higher amounts of spent coffee grounds (SCG) being produced which are generally disposed of in landfill or used as compost. However, the wide range of molecules present in SCG such as saccharides, lignin, lipids and proteins give this biomass source a large chemical functionality. In this work, SCG were fractionated to separate the components into three separate portions for further valorization; these were hemicellulose-enriched fractions (HEF), lignin-enriched fraction (LEF) and cellulose-enriched fraction (CEF). HEF was effectively used in the growth of the oleaginous yeast Metschnikowia pulcherrima, additionally, the C6 sugars present in this fraction suggests that it can be used in the production of 5-hydroxymethylfurfural (HMF). The LEF had a considerable high heating value (HHV) and would be suitable as a biofuel component for combustion. CEF was efficiently used in the production of HMF as 0.35 g of this product were obtained from 10 g of SCG. Such results demonstrate that SCG can be effectively used in the production of HMF within a biorefinery concept.
1. Introduction
Coffee is one of the most consumed beverages in the world and as such is becoming a daily commodity in most people’s lives [1]. Such high consumption of coffee generates increasing amounts of spent coffee grounds (SCG). The United States Department of Agriculture estimate the yearly consumption to be 9.8 million tonnes of coffee beans worldwide [2], which has been increasing steadily since 2011 [2,3,4]. This demand for coffee demonstrates the lack of seasonality in the supply of coffee beans and the increasing availability of SCG to be industrially used and converted to fuels and higher value chemicals.
SCG were initially considered a waste, being landfilled or disposed in the sea [5,6]. However, the compositional analysis reveals the presence of carbohydrates (42–55% w/w), lignin (0–25% w/w), lipids (2–24% w/w), protein (10–18% w/w), caffeine (0–0.4% w/w), chlorogenic acids (1–3% w/w) and ash (1–2% w/w) [7,8,9,10,11,12]. This composition lends itself to the production of fuels and higher value chemicals, and as such is a highly suitable feedstock to be used in the biorefinery industry.
Initially, as the calorific value of SCG were considered to be similar to agro-chemical residues, SCG were used directly for heat generation in industrial boilers [13]. However, due to the increased heteroatom content, emissions from direct combustion are particularly hazardous. More suitably SCG have been pyrolyzed, yielding between 55% and 85% bio-oil, depending on the reaction conditions and moisture content [14]. The pyrolysis process is particularly attractive and as such higher value compounds such as diterpenes can be extracted from the bio-oil. To this end, Peshev et al. added a downstream nanofiltration process that used the permeate and retentate in the production of further products [15,16].
The pyrolysis yields are so high as SCG contain up to 15% triglyceride oil. Alternative work has therefore focused on the extraction and transesterification of these lipids into biodiesel [14,17,18,19]. However, the low triglyceride oil content in SCG requires large amounts of SCG to produce considerable amounts of biodiesel, and as such cannot be produced as economically as from other glyceride sources.
Due to the high carbohydrate content, SCG have also been used in the production of ethanol through fermentation. Mussatto et al. used an acid pretreatment of the SCG, followed by enzymatic step to release the monosaccahrides. The authors compared three different yeast strains on both SCG and coffee silverskin. The SCG used led to much higher ethanol productions (11.7 g/L) compared to the coffee silverskin (producing less than 1 g/L) [20]. Rocha et al., developed a biorefinery approach through fermentation of the SCG after the extraction of oil. This new design led to higher ethanol concentrations with a final titer of 19 g/L, while the extracted oil was used in the production of biodiesel.
However, with the unique diversity of molecules present in SCG there is also a large potential to produce higher value chemicals alongside fuels. Burniol-Figols et al. developed a biorefinery design to produce chlorogenic acid and bioethanol [21]. The process included the extraction of phenolics to be converted into chlorogenic acid where the extraction residues were submitted to an acid hydrolysis, to depolymerize the sugars into monosaccharides, followed by fermentation to ethanol. Karmee evaluated a wide range of processes to come up with SCG-based biorefinery design [10]. The evaluated processes included: different oil extraction processes, the production of biodiesel through base, acid, lipase catalysis or in-situ transesterification of the extracted oils, the catalytic upgrading of the oils to renewable diesel, production of bioethanol through hydrolysis and fermentation of the carbohydrates. The author also reported additional products such as carotenoids, antioxidants and polymers, such as polyols, polylactic acid and polyhydroxyalkanoates.
Caetano et al. presented a design composed of two initial extractions, one aqueous and one lipophilic, followed by the fermentation of the remaining solid waste [22]. The first extraction was intended to remove high value extracts for upgrading to pharmaceuticals or for the cosmetic industry, while the product of the second extraction were triglycerides, used in the production of biodiesel. Using a similar design, Mata et al. replaced the fermentation process by pyrolysis and torrefaction to produce biochar and bio-oil [23].
While the C6 sugars can be fermented into a range of products, another application is in the acid catalyzed dehydration to produce 5-hydroxymethylfurfural (HMF) [24]. HMF can be used in a wide range of applications such as polymers and biofuels. Two of the most common applications include dimethylfuran (DMF) and 2,5-furandicarboxylic acid (FDCA). While DMF is known for being a potential biofuel with comparable energy density to gasoline, FDCA is a building block used in the production of polyesters, one of which, PEF, is a potential replacement for PET [25,26]. To date, however, there are no reports of HMF being produced from SCG.
In this work, a conceptual HMF biorefinery was investigated with the SCG being fractionated to separate the biomass into three different fractions: a cellulose-enriched fraction (CEF), hemicellulose-enriched fraction (HEF) and lignin-enriched fraction (LEF). This process has been developed for other lignocellulosic biomass, though has again not been demonstrated on SCG, and uses sulfuric acid as a catalyst and a ternary mixture of methyl isobutyl ketone (MIBK), ethanol and water to separate the biomass into the various fractions [27]. More recent work done by Katahira et al., demonstrated that the replacement of ethanol in the ternary system with acetone leads to a more effective fractionation process [28]. In this investigation, these solvent systems were then examined for the suitability to produce multiple product streams from SCG, with a focus on the production of HMF.
2. Materials and Methods
2.1. Materials
The SCG were obtained from Bio-bean Ltd. They were stored at 4 °C. SCG are commonly composed by cellulose (10–13% w/w), hemicellulose (32–42% w/w), lignin (0–25% w/w), protein (10–18% w/w), lipids (2–24% w/w), ash (1–2% w/w), caffeine (0–0.4% w/w) and chlorogenic acids (1–3% w/w) [8,9,10,11,12]. Pistachio hull was supplied by the Wonderful Company (Los Angeles, CA, USA), the compositional analysis is given in the Appendix A (Table A1). All the chemicals used in this study were purchased from Sigma Aldrich (Gillingham, UK), and used without further purification.
2.2. Clean Fractionation
The fractionation process was carried out in a 300 mL Parr reactor (Parr Company Moline, IL, USA, 4560 mini reactors). In this process, 10 g of biomass were fractionated in three different solvent systems: (1) methyl isobutyl ketone (MIBK), ethanol and water (16/34/50 g/g/g; here forth this solvent system is denominated MEW); (2) MIBK, acetone and water (11/44/44 g/g/g, denominated MAW); (3) MIBK and water (16/84 g/g; MW). In all these systems, sulfuric acid was used as a catalyst in a concentration of 0.1 M. After loading both the biomass and solvent system, agitation was started, temperature increased to 140 °C and the reaction was carried out for 1 h. After the reaction, the reactor was cooled down to 30 °C. The obtained suspension was filtered and washed, initially with 200 mL of the same solvent system used in the fractionation, and secondly, with 650 mL of water to remove any soluble component present amidst the solids. The solid residue after filtration was denominated the cellulose-enriched fraction (CEF) and was dried at room temperature for 24 h. Then, 50 mL of MIBK was added to the filtrate in a separation funnel. The solution was mixed and left to rest until two distinct phases were observed (an aqueous and an organic phase). Once the phases were separated, 50 mL of MIBK was added to the aqueous phase for a second extraction. The solution was mixed, left to rest and the two distinct phases were separated. The obtained aqueous phase was denominated the hemicellulose-enriched fraction (HEF). Both organic phases (obtained from first and second extraction processes) were combined and the solvent removed under vacuum. The dried solids obtained from this process were further dried in an oven at 40 °C for 4 days, this was designated the lignin-enriched fraction (LEF).
2.3. Fermentation
The pH of the HEF fraction was increased to 4. This solution was then used in the preparation of four diluted solutions with deionized water: 25% HEF concentrated, 50% HEF concentrated, 75% HEF concentrated and a fully concentrated solution (100%). A control media of 30 g/L of peptone from soybean meal enzymatic digest and 25 g/L of malt extract was also prepared and autoclaved. All these solutions (4 dilutions from HEF and the control) were then inoculated with Metschnikowia pulcherrima (National Culture of Yeast Collection, NCYC4331) to make solutions with 500,000 cells/mL and a total volume of 20 mL in Erlenmeyer flasks. The flasks were sealed and placed in incubators at a temperature of 25 °C and 230 rpm for 3 days.
2.4. 2D-NMR
Solution state nuclear magnetic resonance (NMR) spectra were acquired using a Bruker Avance III NMR spectrometer operating at 500.13 MHz for 1 h and 125.77 MHz for 13 C. Samples were investigated in DMSO-d6 at 27 °C unless specified and were referenced to the residual solvent signal at 2.50 ppm (1H) and 39.52 ppm (13C). Following this, 1H-13C correlation spectra were obtained using the “hsqcedetgpsp” pulse sequence, with td = 256 and ns = 128 and a relaxation delay of 1.5 s. Spectra were acquired using Bruker Topspin 2.1 and processed using Bruker Topspin 3.1. Assignment of the individual components was follows previous reports [28,29].
2.5. Cellulose Hydrolysis
The enzymatic hydrolysis of cellulose was carried out in 50 mL Falcon tubes in an incubator at 50 °C. Then, 0.5 g of CEF were added to 5 mL of a 0.1 M buffer of sodium acetate and acetic acid with a pH of 4.8. Cellulase (Cellulase from Aspergillus niger sourced from Sigma-Aldrich, UK) was used as enzyme—137.04 FPU/mL. Antibiotics were also added to avoid contamination: 12 mg/L of tetracyclin and 15 mg/L of gentamicin. The reaction was carried out for 72 h. At the end of the reaction, the solution was placed in a hot bath at 85 °C for enzyme deactivation, followed by centrifugation to separate the majority of the solids. High Performance Liquid Chromatography (HPLC) equipped with an Aminex HPX-87H HPLC column from Bio-Rad (heated up to 65 °C, with a flow rate of 0.6 mL/min) and a refractive index detector was used to determine the sugars content in solution.
2.6. Glucose Isomerization
After hydrolysis, the buffer solution had to be neutralized to a pH of 7 as this is the ideal pH for glucose isomerase from Streptomyces murinus (Sigma-Aldrich, UK)—15 FPU of enzyme were added to solution. The reaction was carried out for 24 h at 60 °C. The same conditions (column and detector) used in the glucose analysis were used for fructose quantification. The glucose concentrations in the initial solution and the added volume of sodium acetate (used in neutralization) were taken into account in the fructose yield calculations.
2.7. Dehydration to HMF
The HMF production was carried out in a biphasic system composed of 1.5 g of sodium chloride saturated aqueous solution (5 wt% fructose, 5 mM of AlCl3, 3.17 mM of HCl) and 3 g of γ-valerolactone (GVL) as the organic solvent. The reaction was performed in glass pressure tubes and heated up to 170 °C. After 20 minutes the pressure tubes were cooled down to room temperature. The two phases were separated using a separating funnel. The HMF present in GVL was extracted from this solvent by mixing 1 part of GVL with 1 part of water and 20 parts of cyclopentane in a first extraction. This led to an aqueous solution containing 90% of the produced HMF and 43% of GVL [30]. By mixing the resulting aqueous phase with 20 parts of cyclopentane three more times, the percentage of GVL in the aqueous solution is reduced to 0.5% and the percentage of recovered HMF was 99% of the total produced. The same Aminex HPX-87H column was used in the HMF analysis, however a diode array detector was used at a wavelength of 280 nm. The 5 mM sulfuric acid aqueous solvent was set to a flow rate of 0.6 mL/min and the column heated up to 65 °C.
3. Results
The fractionation process was assessed in three different solvent systems. In the first MIBK, ethanol and water were used (MEW), which was compared to MIBK, acetone and water (MAW). Both the ethanol and acetone partitioned into the HEF and as these are inhibitory to microbes at these concentrations; a solvent system only composed of MIBK and water (MW) was also examined. For each one of these three solvent systems, two biomass sources were studied: SCG and pistachio hull, allowing the SCG to be compared to a lignocellulosic material. The initial mass balance for the three systems is given in Figure 1.
3.1. Hemicellulose Enriched Fraction (HEF)
Characterization
To characterize the HEF, samples were submitted to various different analysis methods, HPLC was used to evaluate what type of sugars and their quantities are present in this fraction. Total organic carbon (TOC) was performed to assess the amount of carbon present in the organic compounds (mainly carbohydrates) that can be used as a substrate to grow yeast/microalgae or to convert to furans. In addition to this, the amount of nitrogen in these fractions was obtained by a total nitrogen (TN) analysis (Figure 2). Finally, inductively coupled plasma optical emission spectrometry (ICP-OES) was used to quantify the metal composition of HEF samples to determine the suitability as a fermentation broth.
All the processes release suitable levels of micronutrients into the broth for fermentation (Table 1). Using the MW solvent system for SCG led to increases in sulfur and reduced levels of Na, though all other elements were widely similar irrespective of the system used. Pistachio hulls had higher concentration of calcium and potassium regardless of the solvent system, in line with the elemental composition of the initial feedstock. HPLC analysis using a refractive index detector was used to quantify the concentration of the sugars present in this fraction (Table 2). Interestingly, while xylose (and possibly arabinose which elutes at the same time) are present in the HEF produced from pistachio hulls, there were very few C5 sugars produced from SCG. Instead the soluble HEF fraction contained high levels of galactose and mannose, in addition to glucose, maltose and cellobiose. This demonstrates that SCG would be entirely unsuitable for the production of furfural but rather that fermentation would be a suitable processing step for this fraction.
To determine the suitability of HEF from SCG for fermentation, the substrate was used with Metshnikowia pulcherrima, an oleaginous yeast species which can ferment a large range of alternative sugars and has excellent inhibitor tolerance [31]. The yeast could not grow on the MEW and MAW derived HEF fractions (data not shown) presumably due to the elevated levels of both ethanol and acetone in the broth. The number of cells per mL increased with time for all the samples (Figure 3a). An increase in the concentration of the medium was directly proportional to an increase in the number of cells. At the end of the first day, the 25% concentrated medium achieved an increase of 1,204,375 cells per mL, the 50% concentrated medium increased by 2,530,000 in the number of cells per mL, the medium with 75% HEF registered an increase of 3,792,500 in the number of cells per mL while the fully concentrated medium increased by 7,665,625. This demonstrated that HEF was not toxic to the yeast and rather was limited by the carbon available. The fully concentrated medium therefore could potentially be used for fermentation as long as no ethanol or acetone were used in this fractionation process, or were removed prior to use.
3.2. Lignin Enriched Fraction (LEF)
LEF Characterization
In the fractionation, the lignin component is depolymerized into a thick bio-oil which is recovered from the MIBK. The main use for the LEF is as a biofuel component for combustion to be used to recover process energy on site or potentially to be used as a liquid fuel in a static combustion engine. As such, the high heating value (HHV) of this fraction is one of the most important features.
Initially, elemental analysis was used to assess the LEF fraction (Table 3). This analysis not only helps to characterize these samples but can also be used in the calculation of the theoretical HHV. According to Ziomek and Williams, lignin is composed of approximately 63% carbon, 5–6% hydrogen, 0–1% nitrogen and 1.5–3.5% sulfur [32]. In the samples obtained from the solvent systems MEW and MAW in Table 3, the carbon content is far lower than these values while the nitrogen content is higher. This may indicate the presence of protein in these samples. The samples obtained with MW show similar content to the one expected from lignin samples. This suggests that molecules such as protein and lipids must have migrated to the other fractions (CEF or HEF). However, the extremely low percentages of LEF obtained when using the MW solvent system suggest that most of the lignin present in both biomass sources may have also deposited in the CEF fraction. The experimental HHV was determined using a bomb calorimeter while the theoretical HHVS’s were calculated using the percentages of elements obtained in the elemental analysis and Equations (1)–(3).
Equations (1)–(3) are given in British thermal unit per pound which were then converted to Joule per gram to be in the same units as the value obtained from the bomb calorimeter [33,34,35]. Note that , , , , and are the contents of carbon, hydrogen, sulphur, oxygen, nitrogen and ash in weight percentage. The value of ash was assumed to be null in Equation (3). The models show highly similar results to one another, although were not as accurate as predicting the calculated HHV values, with the largest discrepancies being observed for the SCG LEF fractions (Table 4). This suggests that in the LEF fraction of SCG there are numerous biomolecules present that the simplistic models cannot account for. Additionally, the high error between the models and the experimental results for the MW samples indicates once more that this solvent system leads to fractions with a higher percentage of impurities.
The HHV is substantially higher for the SCG components than for the pistachio hulls, and higher than is typically found for lignin components alone. Lignin is also a valuable source of aromatics, and as such could be used for further chemical production. The LEF samples were therefore analyzed by 2D NMR and GC-MS to understand the functionality present in the fraction.
All the spectra obtained in this analysis were compared with previous literature reports [29] (Figure 4, Figure 5, Figure 6 and Figure 7, Table 5). The 2D NMR demonstrates the presence of aromatic species in the phase for all species examined. Furthermore, the presence of tricin and syringyl are the most prominent units in the pistachio hull, normally observed in woody biomass [36]. In the SCG spectra for all fractions, the presence of p-coumarate and ferulates were observed, these are commonly found in food wastes [37]. Additionally, carbohydrates were also observed in some of the samples, demonstrating some contamination from molecules that should have been deposited in one of the other fractions. Species common to both feedstock include, alkyl-aryl groups, methoxyls, guaiacyl and p-hydroxyphenyl units, usually found in lignin. Finally, the samples obtained using MW solvent system showed a higher number of unidentified peaks, when compared to the samples obtained using MEW and MAW.
GC-MS was also used to identify the LEF fraction (see Appendix A, Figure A1, Figure A2, Figure A3, Figure A4, Figure A5 and Figure A6); this analysis confirmed the presence of smaller lignin units, and of fatty acids, which are produced by the hydrolysis of triglycerides in the coffee oil. This would account for the higher HHV of the SCG samples. This confirms that the major two components in this phase are the lipids and lignin fragments from the SCG.
3.3. Cellulose Enriched Fraction (CEF)
3.3.1. CEF Characterization
CEF was characterized using four types of solid-state analysis: Fourier-transform infrared spectroscopy (FT-IR), solid state NMR (ssNMR), elemental analysis and thermogravimetric analysis (TGA). For FT-IR, the elemental analysis and TGA, the CEF samples were compared to pure cellulose.
In the FT-IR analysis, the samples were divided according to the solvent system, allowing the comparison between pure cellulose and CEF from pistachio hull and SCG (Figure 8). A large well-defined peak around 1000–1100 cm−1 was observed in all the spectra. This peak is characteristic of a C-O bond in the glucose monomer in cellulose. Additionally, another peak was observed around 3000 cm−1; characteristic of an alkyl group from the glucose ring was observed for all the fractions.
All the CEF fractions that were obtained from pistachio and SCG differed depending on the solvent system used. While distinctive peaks were observed for CEF in the MEW extraction, there were a number of other peaks suggesting esters and possibly proteinous species in both the MEW solid fractions derived from the pistachio and SCG. The cellulose fraction isolated using MAW was the most similar to pure cellulose with few other species observable for the SCG other than those for cellulose. The spectra relating to the pistachio CEF were highly similar for both MEW and MAW solvent extraction. The CEF samples obtained using MW, pistachio in particular, show some more unidentified peaks between 1200 and 1800 cm−1. Once more, this may be an indicator that the fractionation using this solvent led to samples with higher level of impurities. This correlates with the purity of the LEF fraction in the MAW samples and demonstrates the poor fractionation potential of the MW system.
To assess the samples in more detail, the solids were analyzed by solid state NMR (ssNMR). A 13C and 1H spectra were obtained for each sample (Figure 9). In the 13C spectra for the pistachio CEF, peaks characteristic of cellulose were observed between 60 and 100 ppm, although further downfield peaks assignable to acid or ester linkages were also present. The proton spectrum showed a broad, unresolved peak, which is typical of amorphous solid materials in this type of analysis. The 13C and 1H spectra for the SCG CEF were far better resolved. These narrower peaks are either associated with highly crystalline material, such as cellulose or a “soft” (mobile) component. Both of these spectra demonstrate a high level of cellulose has been extracted but that it is heavily contaminated with non-aromatic components such as fatty acids/esters or amino acid/proteinous material. The elemental analysis of the CEF fraction confirms this likely contamination to be protein for both the SCG and pistachio (Table 6). Compared to pure cellulose all the CEF fractions had elevated carbon, N and S while have lower O.
To estimate the amount of cellulose in the samples, thermogravimetric analysis was performed on all the six samples of CEF (Figure 10). By comparing the reduction in weight in the sample to that of pure cellulose, the total cellulose in the samples was estimated (Table 7). The percentage of cellulose in the CEF fractions produced from pistachio hulls is higher than CEF from SCG, irrespective of the solvent system used. This is presumably due to the higher level of cellulose and lower protein and other nitrogen species in the hulls. Additionally, the lower percentage of cellulose in the MW fraction demonstrates the poor separation afforded by the MW system.
3.3.2. Production of HMF from CEF
To demonstrate the suitability of the CEF fraction for HMF production, each fraction was converted without any purification. This was then compared to the same sample being enzymatically hydrolyzed to glucose before being converted to HMF and finally to the glucose being isomerized to fructose and this converted to HMF (Table 8). Each of the CEF fractions were compared with the same procedure for pure cellulose. The initial production of HMF directly from CEF yielded very low conversions for all systems, including pure cellulose. This was expected and is due to the high complexity, crystallinity and supramolecular structure of the cellulose [38]. Glucose is less stable, soluble and as such higher conversions can be obtained. A 61% yield of glucose was achieved from cellulose, although, due to the high stability of the pyranoside ring structure which has previously been reported to be a limiting factor to achieve high HMF yields [39], only 24% of the pure cellulose material was converted to HMF. This is a yield of 14.8% of the original starting material.
A far lower glucose yield was observed for both the CEF for pistachio (24%) and SCG (26%). However, when the reduced amount of cellulose of the CEF is factored in, then this is a similar yield to cellulose, suggesting that the CEF is not inhibitory to enzymes.
The most suitable starting material for HMF production is fructose [30]. Therefore, all glucose streams were isomerized to this sugar. The HMF yields from fructose were far higher, with just under 80% of the sugar converted to HMF; this result is similar to previous reports [30,40]. The glucose produced from both CEF fractions could be isomerized yielding similar amounts of fructose, on conversion 69.6% HMF was produced from pistachio and 70.3% from SCG. This gave a final yield of 8.2% from the original starting material for SCG and 8.0% from pistachio hull.
4. Discussion
The similar masses obtained in the fractionation process for SCG and pistachio hull indicate that this process, initially developed for lignocellulosic biomass sources, can be efficiently used in the separation of the components present in SCG. The CEF mass yields obtained were approximately in accordance with the higher content of cellulose present in pistachio hull than in SCG (14% and 12%, respectively). Both the MAW and MEW solvent systems also deposit a range of other components, up to 60%, into this phase. Although this is in accordance with other lignocellulosic biomass separated through this method [28].
The poor performance of the MW system demonstrates how both ethanol and acetone aid in the fractionation process. When these solvents are not used, most of the lignin remains as a solid species and is deposited elsewhere in the system. This reduces the ability to use LEF for bioenergy. Despite of the better fractionation performance, the presence of ethanol and acetone in the HEF fraction, demonstrated by the increased TOC in the phase, make it unsuitable for fermentation. In contrast, the aqueous fraction produced with MW contained all the micronutrients necessary for growth and could be used to grow the oleaginous yeast M. pulcherrima; interestingly the growth of the yeast was only limited by the sugar present and not inhibited by the presence of anything in the broth. For all the samples, the HEF fraction had a higher total nitrogen content when SCG was used. While this will relate to bioactive compounds such as caffeine as well as the increased protein content, it did not seem to have an inhibitory effect on the yeast.
The sugar content of the HEF fraction showed that, while HEF from pistachio hull can be used in the production of furfural, the absence of C5 sugars in SCG means that furfural could not be produced as a co-product with HMF in a SCG biorefinery. Instead, the presence of C6 sugars, such as galactose and mannose indicate that this fraction could potentially be used in the production of HMF, although with similar issues associated with the conversion of glucose. While the sugars in the HEF fraction could be fermented, to achieve a good fractionation in the overall system, ethanol and acetone must be used—this severely limits the use of these sugars without further costly separations.
The LEF fraction, solubilized in MIBK, obtained using MEW and MAW had a reasonably high HHV (15–26 MJ/kg) when compared to the LEF fraction from MW (approximately 11 MJ/kg). For both the MEW and MAW solvent systems, the LEF fractions from SCG had higher HHV (22–26 MJ/g) than pistachio hull (15–19 MJ/kg). This suggests that this fraction of SCG has higher potential to be used as a biofuel component. However, both the GC-MS and 2D NMR analysis of this fraction demonstrated the presence of depolymerized lignin and fatty acids. Both materials have elevated lipids, though the SCG has more. This indicates that this fraction may also be used in the production of renewable biodiesel and polymers, however, similar to the HEF fraction, the fatty acids would need to be separated from the other components, which could limit the applicability for lower value uses. One possibility would be to extract the lipids prior to the fractionation.
The final fraction contains the solids left over from the process, predominantly cellulose (CEF). The elemental analysis, TGA, ssNMR and FT-IR demonstrated that cellulose is present in both samples, up to approximately 40% of the phase. A large proportion of nitrogen and sulfur were also observed suggesting that protein was present, although there was no clear indication of high levels of lignin in this phase. As with the other phases, the CEF fraction from the MW separation was heavily contaminated for both biomass sources tested. The CEF fraction can be depolymerized to release glucose for either fermentation or further chemical manufacture. For the manufacture of HMF, the cellulose is too stable, and little HMF was produced from any of the CEF fractions. Indeed, it is only the conversion through multiple enzymatic steps to fructose that yielded reasonable HMF concentrations. While only 8.2% of the original starting material of HMF was produced from the SCG, 8.0% HMF was produced from pistachio hull. This is partly due to low percentage of cellulose in CEF and the thermodynamic equilibrium between glucose and fructose which limits the reaction yields [41]. According to Al-Tai et al. the maximum theoretical yield that can be obtained in the glucose isomerization reaction is approximately 50% [42]. This was the limiting step and reduces amounts of HMF produced per batch. As such, the yields obtained from SCG and pistachio were highly similar to crystalline cellulose when the lower amount of cellulose was taken into account. This suggests that the fractionation works well, and that there are no inhibitory compounds in this phase that limit further processing.
Considering the entire process of biomass fractionation (using both pistachio and SCG) and the subsequent conversion of CEF to HMF, it was possible to produce approximately 0.37 g of HMF from 10 g of pistachio hull and approximately 0.35 g from SCG. This value of approximately 4% is close to the theoretical possible, considering that there is 14% and 12% of cellulose in pistachio hull and SCG, respectively, that the conversion of cellulose to glucose is limited to between 75% and 95%, the conversion of glucose to fructose is limited by the kinetic equilibrium between these two sugars, which is translated to a maximum theoretical yield obtained is 50% and maximum HMF yield from fructose is 80%.
5. Conclusions
In the paper, a biorefinery based around the organosolv fractionation of spent coffee grounds (SCG) was attempted for the first time. The fractionation of SCG led to similar results to the fractionation of a lignocellulosic material, in this case pistachio hull. These results demonstrate that this organosolv process can effectively separate the components present in SCG into three different enriched fractions: yielding a solubilized fraction predominantly from hemicellulose (HEF), a cellulose enriched solid (CEF) and a lignin enriched organic phase (LEF). The fractionation worked well when ethanol and acetone were used, though both of these solvents partitioned into the aqueous phase, inhibiting the use as a fermentation media. On fractionating with just water and MIBK, the HEF fraction could be used for fermentation and was only limited by the amount of sugars that partitioned there. For the SCG, this was predominantly C6 mono- and disaccharides.
The LEF samples for the SCG had very high HHV and were predominately made up of lignin fragments and fatty acids. Both the MEW and MAW solvent systems were suitable for this fractionation. Finally, the CEF fraction was analyzed and demonstrated to contain large content of cellulose alongside a range of other macromolecules. The CEF fraction was shown to be suitable for the production of HMF, with close to the theoretical yield obtained when depolymerized to glucose and isomerized to fructose prior to conversion. This paper demonstrates that the organosolv process is suitable for fractionating SCG and multiple products can be produced in a biorefinery concept.
Author Contributions
All experimental work was undertaken by A.P.P. except the 2D NMR studies (T.J.W.) and fermentation (P.B.). The study was conceptualized, supervised, funding acquired and edited by C.J.C., with A.P.P. being responsible for the original drafting.
Funding
This research received no external funding.
Acknowledgments
We gratefully acknowledge the solid state NMR group at Durham University for their help in running the CEF fraction samples. Solution state NMR spectra were acquired using instruments from the Materials and Chemical Characterisation facility at the University of Bath.
Conflicts of Interest
The authors declare no conflict of interest.
Appendix A
Chromatograms from Gas Chromatography-Mass Spectrometry (GC-MS).
Figure A1.
GC-MS chromatogram obtained from MEW–pistachio hull.

Figure A2.
GC-MS chromatogram obtained from MEW–SCG.

Figure A3.
GC-MS chromatogram from MAW–pistachio hull.

Figure A4.
GC-MS chromatogram from MAW–SCG.

Figure A5.
GC-MS chromatogram from MW–pistachio hull.

Figure A6.
GC-MS chromatogram from MW–SCG.


Table A1.
Analysis of pistachio hulls used in this study.
| Soluble Sugars | |||||||||||||||||||
|---|---|---|---|---|---|---|---|---|---|---|---|---|---|---|---|---|---|---|---|
| Sample Description | % Total Ash | % Structural Inorganics | % Non-Structural Inorganics | % Total Protein | % Structural Protein | % Non-Structural Protein | % Sucrose | % Free Glucose | % Free Fructose | % Water Extractable Others | % Ethanol Extractives | % Lignin | % Glucan | % Xylan | % Galactan | % Arabinan | % Fructan | % Acetyl | Total % |
| Pistachio Hull | 9.4 | 5.4 | 4.0 | 7.5 | 6.2 | 1.3 | 0.0 | 0.0 | 0.0 | 15.6 | 11.1 | 26.6 | 13.6 | 5.0 | 2.8 | 4.8 | 0.0 | 1.4 | 91.3 |
References
- Baeza, G.; Sarriá, B.; Bravo, L.; Mateos, R. Polyphenol content, in vitro bioaccessibility and antioxidant capacity of widely consumed beverages. J. Sci. Food Agric. 2018, 98, 1397–1406. [Google Scholar] [CrossRef] [PubMed]
- Coffee: World Markets and Trade; United States Department of Agriculture, Foreign Agricultural Service 2018. Available online: https://www.fas.usda.gov/data/coffee-world-markets-and-trade (accessed on 14 May 2019).
- Coffee: World Markets and Trade; United States Department of Agriculture, Foreign Agricultural Service 2012. Available online: https://www.fas.usda.gov/data/coffee-world-markets-and-trade (accessed on 14 May 2019).
- Coffee: World Markets and Trade; United States Department of Agriculture, Foreign Agricultural Service 2015. Available online: https://www.fas.usda.gov/data/coffee-world-markets-and-trade (accessed on 14 May 2019).
- Da Cunha, M.R. Apêndice estatistico. In 150 anos de café; Bacha, E.L., Greenhill, R., Eds.; Salamandre: Rio de Janeiro, Brasil, 1992; pp. 286–388. [Google Scholar]
- Mussatto, S.I.; Machado, E.M.S.; Martins, S.; Teixeira, J.A. Production, Composition, and Application of Coffee and Its Industrial Residues. Food Bioprocess Technol. 2011, 4, 661. [Google Scholar] [CrossRef]
- Massaya, J.; Prates-Pereira, A.; Mills-Lamptey, B.; Benjamin, J.; Chuck, C.J. Conceptualization of a spent coffee grounds biorefinery: a review of existing valorisation approaches. Food Bioprod. Process. 2019, in press. [Google Scholar]
- Cruz, R.; Cardoso, M.M.; Fernandes, L.; Oliveira, M.; Mendes, E.; Baptista, P.; Morais, S.; Casal, S. Espresso Coffee Residues: A Valuable Source of Unextracted Compounds. J. Agric. Food Chem. 2012, 60, 7777–7784. [Google Scholar] [CrossRef] [PubMed]
- Ballesteros, L.F.; Teixeira, J.A.; Mussatto, S.I. Chemical, Functional, and Structural Properties of Spent Coffee Grounds and Coffee Silverskin. Food Bioprocess Technol. 2014, 7, 3493–3503. [Google Scholar] [CrossRef] [Green Version]
- Karmee, S.K. A spent coffee grounds based biorefinery for the production of biofuels, biopolymers, antioxidants and biocomposites. Waste Manag. 2018, 72, 240–254. [Google Scholar] [CrossRef]
- Somnuk, K.; Eawlex, P.; Prateepchaikul, G. Optimization of coffee oil extraction from spent coffee grounds using four solvents and prototype-scale extraction using circulation process. Agric. Nat. Resour. 2017, 51, 181–189. [Google Scholar] [CrossRef]
- Martinez-Saez, N.; García, A.T.; Pérez, I.D.; Rebollo-Hernanz, M.; Mesías, M.; Morales, F.J.; Martín-Cabrejas, M.A.; del Castillo, M.D. Use of spent coffee grounds as food ingredient in bakery products. Food Chem. 2017, 216, 114–122. [Google Scholar] [CrossRef]
- Silva, M.A.; Nebra, S.A.; Machado Silva, M.J.; Sanchez, C.G. The use of biomass residues in the Brazilian soluble coffee industry. Biomass Bioenergy 1998, 14, 457–467. [Google Scholar] [CrossRef]
- Girotto, F.; Pivato, A.; Cossu, R.; Nkeng, G.E.; Lavagnolo, M.C. The broad spectrum of possibilities for spent coffee grounds valorization. J. Mater. Cycles Waste Manag. 2017. [Google Scholar]
- Acevedo, F.; Rubilar, M.; Scheuermann, E.; Cancino, B.; Uquiche, E.; Garces, M.; Inostroza, K.; Shene, C. Spent Coffee Grounds as a Renewable Source of Bioactive Compounds. J. Biobased Mater. Bioenergy 2013, 7, 420–428. [Google Scholar] [CrossRef]
- Peshev, D.; Mitev, D.; Peeva, L.; Peev, G. Valorization of spent coffee grounds – A new approach. Sep. Purif. Technol. 2018, 192, 271–277. [Google Scholar] [CrossRef]
- Kondamudi, N.; Mohapatra, S.K.; Misra, M. Spent Coffee Grounds as a Versatile Source of Green Energy. J. Agric. Food Chem. 2008, 56, 11757–11760. [Google Scholar] [CrossRef] [PubMed]
- Jenkins, R.W.; Stageman, N.E.; Fortune, C.M.; Chuck, C.J. Effect of the Type of Bean, Processing, and Geographical Location on the Biodiesel Produced from Waste Coffee Grounds. Energ. Fuels 2014, 28, 1166–1174. [Google Scholar] [CrossRef]
- Liu, Y.; Tu, Q.; Knothe, G.; Lu, M. Direct transesterification of spent coffee grounds for biodiesel production. Fuel 2017, 199, 157–161. [Google Scholar] [CrossRef]
- Mussatto, S.I.; Machado, E.M.S.; Carneiro, L.M.; Teixeira, J.A. Sugars metabolism and ethanol production by different yeast strains from coffee industry wastes hydrolysates. Appl. Energy 2012, 92, 763–768. [Google Scholar] [CrossRef] [Green Version]
- Burniol-Figols, A.; Cenian, K.; Skiadas, I.V.; Gavala, H.N. Integration of chlorogenic acid recovery and bioethanol production from spent coffee grounds. Biochem. Eng. J. 2016, 116, 54–64. [Google Scholar] [CrossRef] [Green Version]
- Caetano, N.S.; Mata, T.M.; Martins, A.A.; Felgueiras, M.C. New Trends in Energy Production and Utilization. Energy Procedia 2017, 107, 7–14. [Google Scholar] [CrossRef]
- Mata, T.M.; Martins, A.A.; Caetano, N.S. Bio-refinery approach for spent coffee grounds valorization. Bioresour. Technol. 2018, 247, 1077–1084. [Google Scholar] [CrossRef] [PubMed]
- Agarwal, B.; Kailasam, K.; Sangwan, R.S.; Elumalai, S. Traversing the history of solid catalysts for heterogeneous synthesis of 5-hydroxymethylfurfural from carbohydrate sugars: A review. Renew. Sustain. Energy Rev. 2018, 82, 2408–2425. [Google Scholar] [CrossRef]
- Roman-Leshkov, Y.; Barrett, C.J.; Liu, Z.Y.; Dumesic, J.A. Production of Dimethylfuran for Liquid Fuels from Biomass-Derived Carbohydrates. Nature 2007, 447, 982–985. [Google Scholar] [CrossRef] [PubMed]
- Kucherov, F.A.; Gordeev, E.G.; Kashin, A.S.; Ananikov, V.P. Three-Dimensional Printing with Biomass-Derived PEF for Carbon-Neutral Manufacturing. Angew. Chem. Int. Ed. 2017, 56, 15931–15935. [Google Scholar] [CrossRef] [PubMed]
- Bozell, J.J.; Black, S.K.; Myers, M.; Cahill, D.; Miller, W.P.; Park, S. Solvent fractionation of renewable woody feedstocks: Organosolv generation of biorefinery process streams for the production of biobased chemicals. Biomass Bioenergy 2011, 35, 4197–4208. [Google Scholar] [CrossRef]
- Katahira, R.; Mittal, A.; McKinney, K.; Ciesielski, P.N.; Donohoe, B.S.; Black, S.K.; Johnson, D.K.; Biddy, M.J.; Beckham, G.T. Evaluation of Clean Fractionation Pretreatment for the Production of Renewable Fuels and Chemicals from Corn Stover. ACS Sustain. Chem. Eng. 2014, 2, 1364–1376. [Google Scholar] [CrossRef]
- del Río, J.C.; Rencoret, J.; Prinsen, P.; Martínez, Á.T.; Ralph, J.; Gutiérrez, A. Structural Characterization of Wheat Straw Lignin as Revealed by Analytical Pyrolysis, 2D-NMR, and Reductive Cleavage Methods. J. Agric. Food Chem. 2012, 60, 5922–5935. [Google Scholar] [CrossRef] [Green Version]
- Gallo, J.M.R.; Alonso, D.M.; Mellmer, M.A.; Dumesic, J.A. Production and upgrading of 5-hydroxymethylfurfural using heterogeneous catalysts and biomass-derived solvents. Green Chem. 2013, 15, 85–90. [Google Scholar] [CrossRef]
- Santomauro, F.; Whiffin, F.M.; Scott, R.J.; Chuck, C.J. Low-cost lipid production by an oleaginous yeast cultured in non-sterile conditions using model waste resources. Biotechnol. Biofuels 2014, 7, 1–11. [Google Scholar] [CrossRef] [PubMed]
- Ziomek, E.; Williams, R.E. Modification of Lignins by Growing Cells of the Sulfate-Reducing Anaerobe Desulfovibrio desulfuricans. Appl. Environ. Microbiol. 1989, 55, 2262–2266. [Google Scholar] [PubMed]
- Selvig, W.A.; Gibson, F.H. Calorific Value of Coal. In Chemistry of Coal Utilization; Lowry, H.H., Ed.; Wiley: New York, NY, USA, 1945. [Google Scholar]
- Boie, W. Fuel Technology Calculations. Energietechnik 1953, 3, 309–316. [Google Scholar]
- Grummel, E.S.; Davis, I.A. A new Method of Calculating the Calorific Value of a Fuel from Its Ultimate Analysis. Fuel 1933, 12, 199–203. [Google Scholar]
- Lan, W.; Rencoret, J.; Lu, F.; Karlen, S.D.; Smith, B.G.; Harris, P.J.; del Río, J.C.; Ralph, J. Tricin-lignins: occurrence and quantitation of tricin in relation to phylogeny. Plant J. 2016, 88, 1046–1057. [Google Scholar] [CrossRef] [PubMed]
- FooDB. Showing Compound Methyl trans-p-coumarate 4-glucoside (FDB002595). Available online: http://foodb.ca/compounds/FDB002595 (accessed on 25 November 2018).
- Su, Y.; Brown, H.M.; Huang, X.; Zhou, X.; Amonette, J.E.; Zhang, Z.C. Single-step conversion of cellulose to 5-hydroxymethylfurfural (HMF), a versatile platform chemical. Appl. Catal. A Gen. 2009, 361, 117–122. [Google Scholar] [CrossRef]
- Hu, L.; Zhao, G.; Hao, W.; Tang, X.; Sun, Y.; Liu, S. Catalytic conversion of biomass-derived carbohydrates into fuels and chemicals via furanic aldehydes. RSC Adv. 2012, 2, 11184–11206. [Google Scholar] [CrossRef]
- Chheda, J.; Román-Leshkov, Y.; Dumesic, J.A. Production of 5-hydroxymethylfurfural and furfural by dehydration of biomass-derived mono- and poly-saccharides. Green Chem. 2007, 9, 342–350. [Google Scholar] [CrossRef]
- Moliner, M.; Román-Leshkov, Y.; Davis, M.E. Tin-containing zeolites are highly active catalysts for the isomerization of glucose in water. Proc. Natl. Acad. Sci. USA 2010, 107, 6164–6168. [Google Scholar] [CrossRef] [Green Version]
- Al-Tai, A.M.; Ali, Y.; Abdul-Razzak, S.H. Isomerization of glucose to fructose: production and some properties of glucose isomerase from Streptomyces sp. strain C7. Enzyme Microb. Technol. 1987, 9, 632–634. [Google Scholar] [CrossRef]
Figure 1.
Cellulose-enriched fraction (CEF), hemicellulose-enriched fractions (HEF) and lignin-enriched fraction (LEF) yields obtained in the six different types of fractionation with two feedstock (pistachio hull and spent coffee grounds, SCG) and three solvent systems (MEW—MIBK, ethanol and water; MAW—MIBK, acetone and water; MW—MIBK and water).

Figure 2.
Total organic carbon (a) and total nitrogen (b) analysis performed on HEF samples obtained from the fractionation of pistachio hull (black) and SCG (green). The three solvent systems (MEW, MAW and MW) are compared in both analyses.
Figure 2.
Total organic carbon (a) and total nitrogen (b) analysis performed on HEF samples obtained from the fractionation of pistachio hull (black) and SCG (green). The three solvent systems (MEW, MAW and MW) are compared in both analyses.

Figure 3.
Growth of Metschnikowia pulcherrima in HEF substrate obtained from the fermentation of SCG. Where (a) is the logarithm of the number of cells per mL obtained over three days, and (b) shows the final cell count as a function of the initial sugar loading in the hydrolysate.
Figure 3.
Growth of Metschnikowia pulcherrima in HEF substrate obtained from the fermentation of SCG. Where (a) is the logarithm of the number of cells per mL obtained over three days, and (b) shows the final cell count as a function of the initial sugar loading in the hydrolysate.

Figure 4.
Two-Dimensional Nuclear Magnetic Resonance (2D-NMR) analysis of LEF obtained using MEW. See Table 5 for label assignments.
Figure 4.
Two-Dimensional Nuclear Magnetic Resonance (2D-NMR) analysis of LEF obtained using MEW. See Table 5 for label assignments.

Figure 5.
A 2D NMR analysis of LEF samples obtained using MAW. See Table 5 for label assignments.
Figure 5.
A 2D NMR analysis of LEF samples obtained using MAW. See Table 5 for label assignments.

Figure 6.
A 2D NMR analysis of LEF samples obtained using MW. See Table 5 for label assignments.
Figure 6.
A 2D NMR analysis of LEF samples obtained using MW. See Table 5 for label assignments.

Figure 7.
Main structures identified using 2D NMR: (A) β-O-4′ alkyl-aryl ethers with acylated γ-OH; (G) guaiacyl unit; (H) p-hydroxyphenyl unit; (PCA) p-coumarates; (FA) ferulates; (T) tricin; (S) syringyl unit.
Figure 7.
Main structures identified using 2D NMR: (A) β-O-4′ alkyl-aryl ethers with acylated γ-OH; (G) guaiacyl unit; (H) p-hydroxyphenyl unit; (PCA) p-coumarates; (FA) ferulates; (T) tricin; (S) syringyl unit.
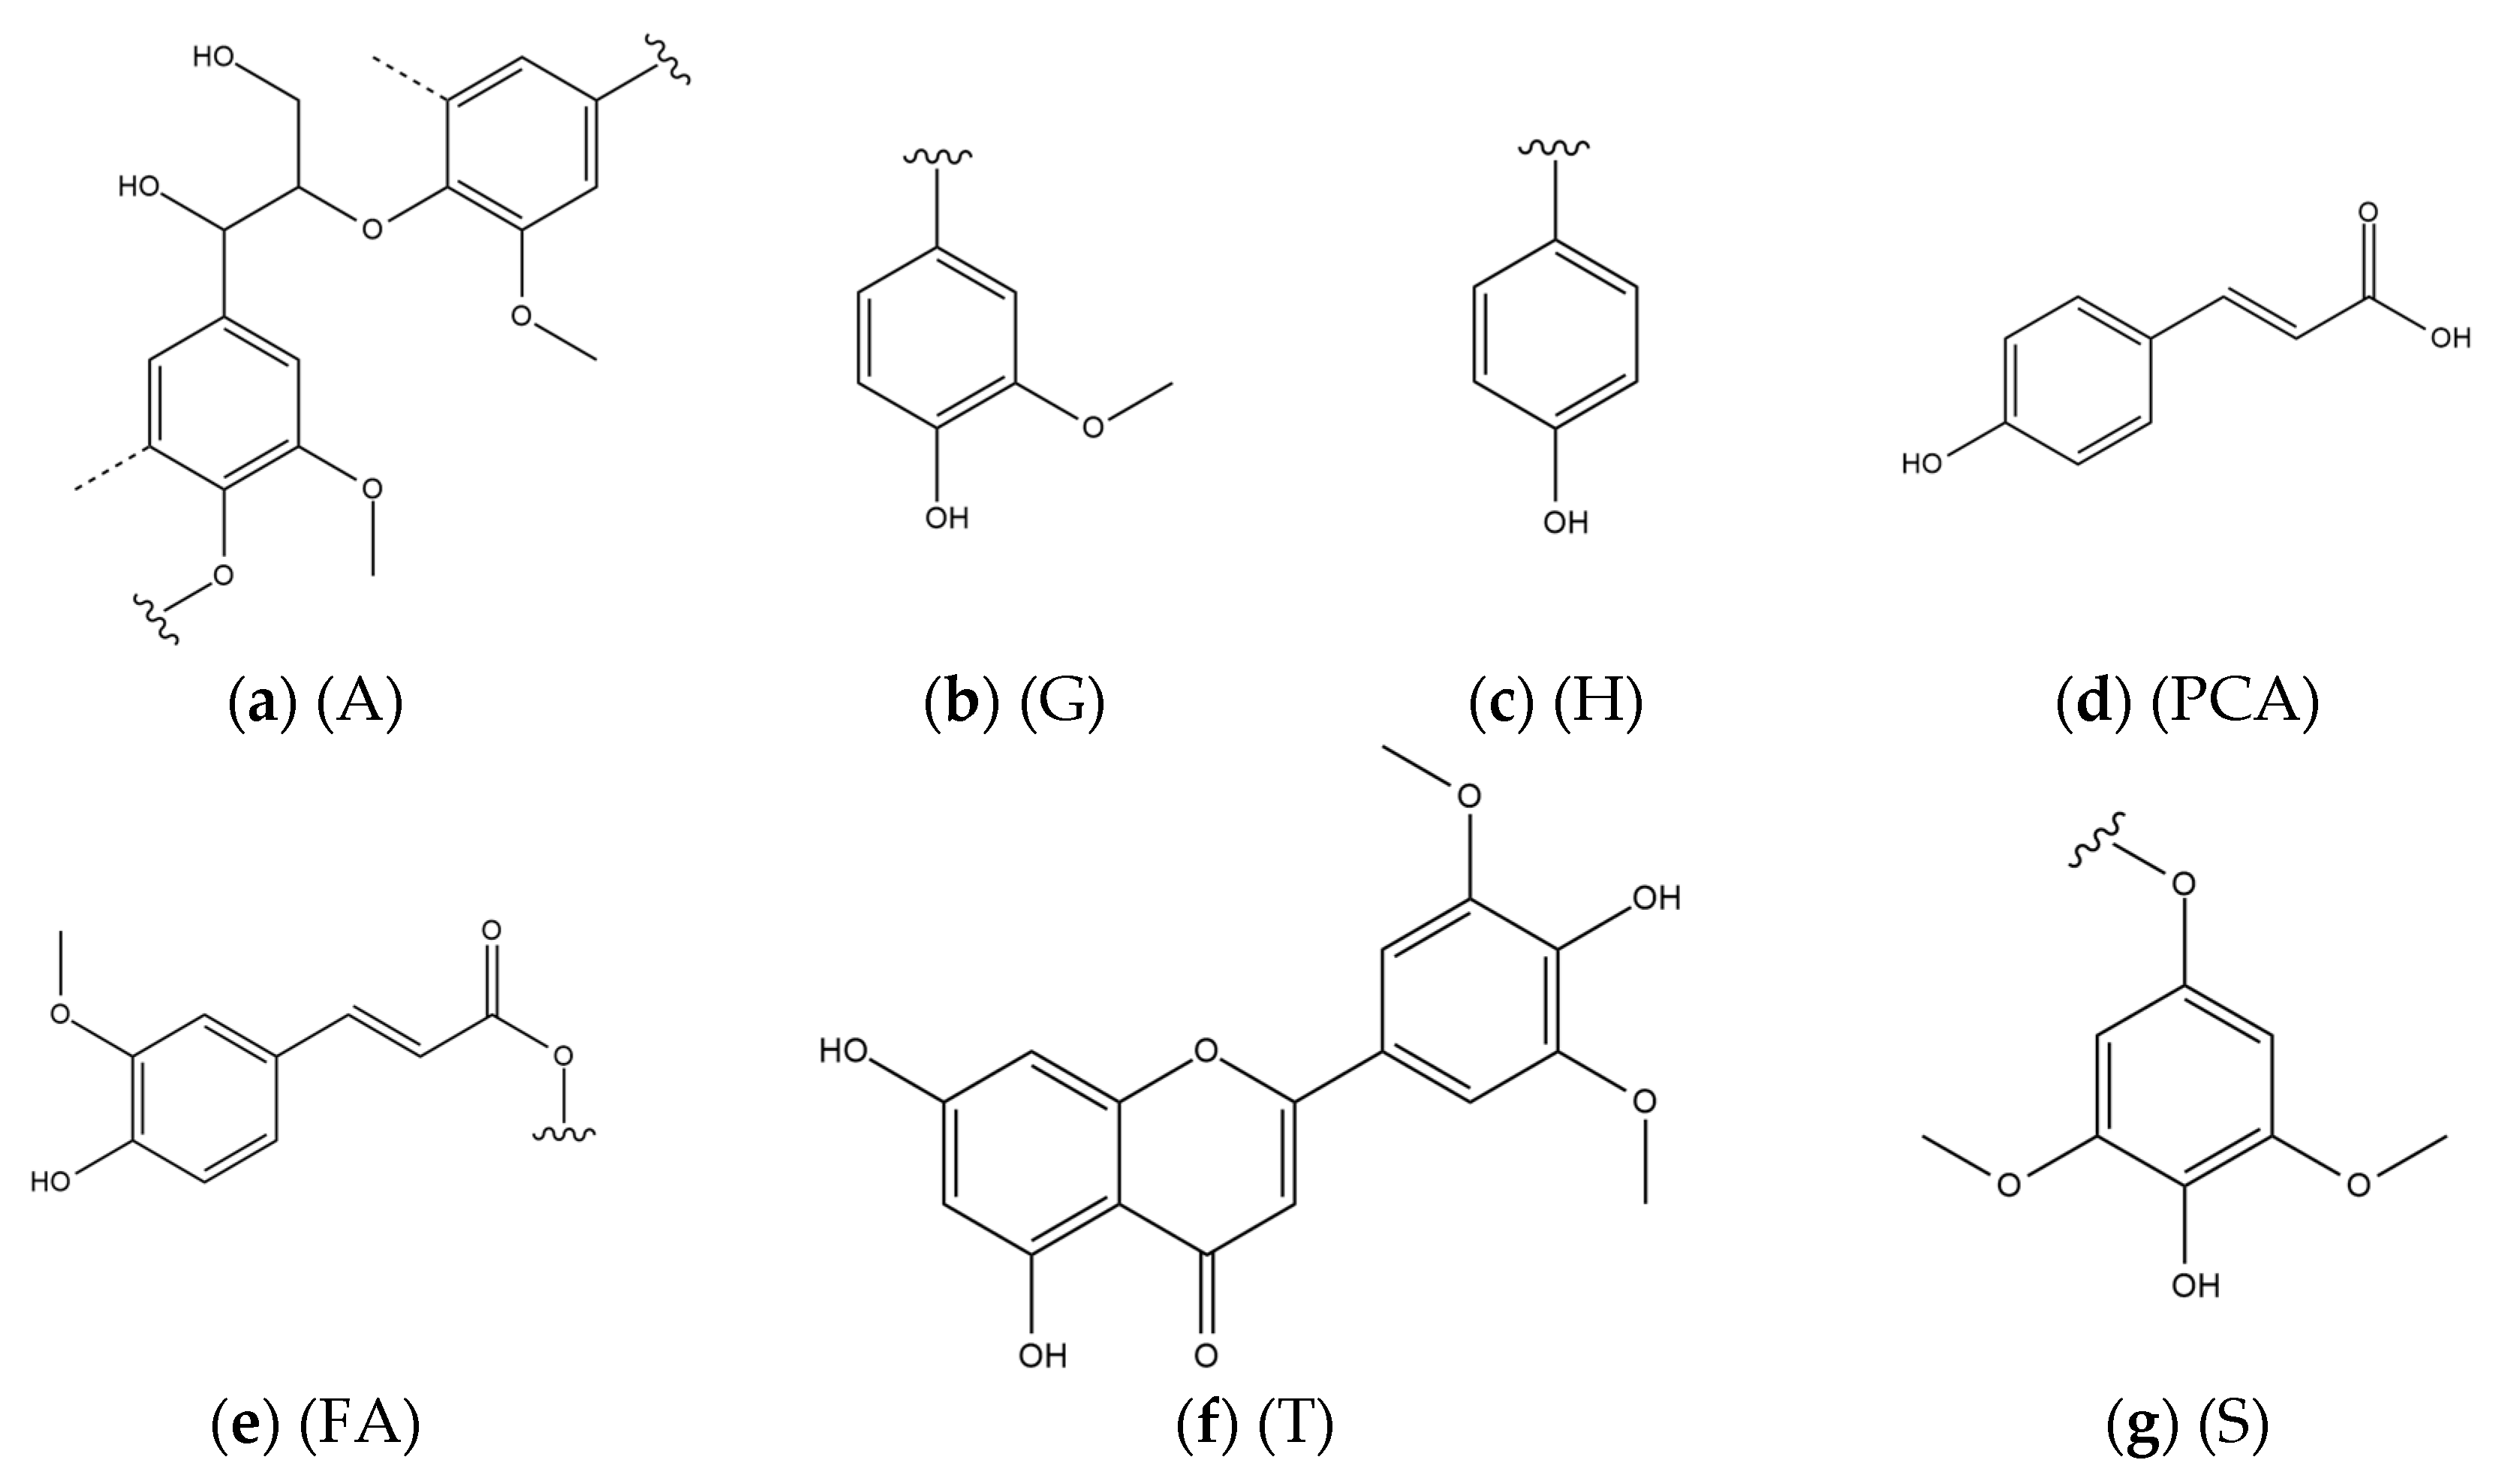
Figure 8.
Fourier-transform infrared spectroscopy (FT-IR) spectra of the CEF samples.

Figure 9.
Solid state Nuclear Magnetic Resonance (ssNMR) 13C, 1H spectra for MEW samples.
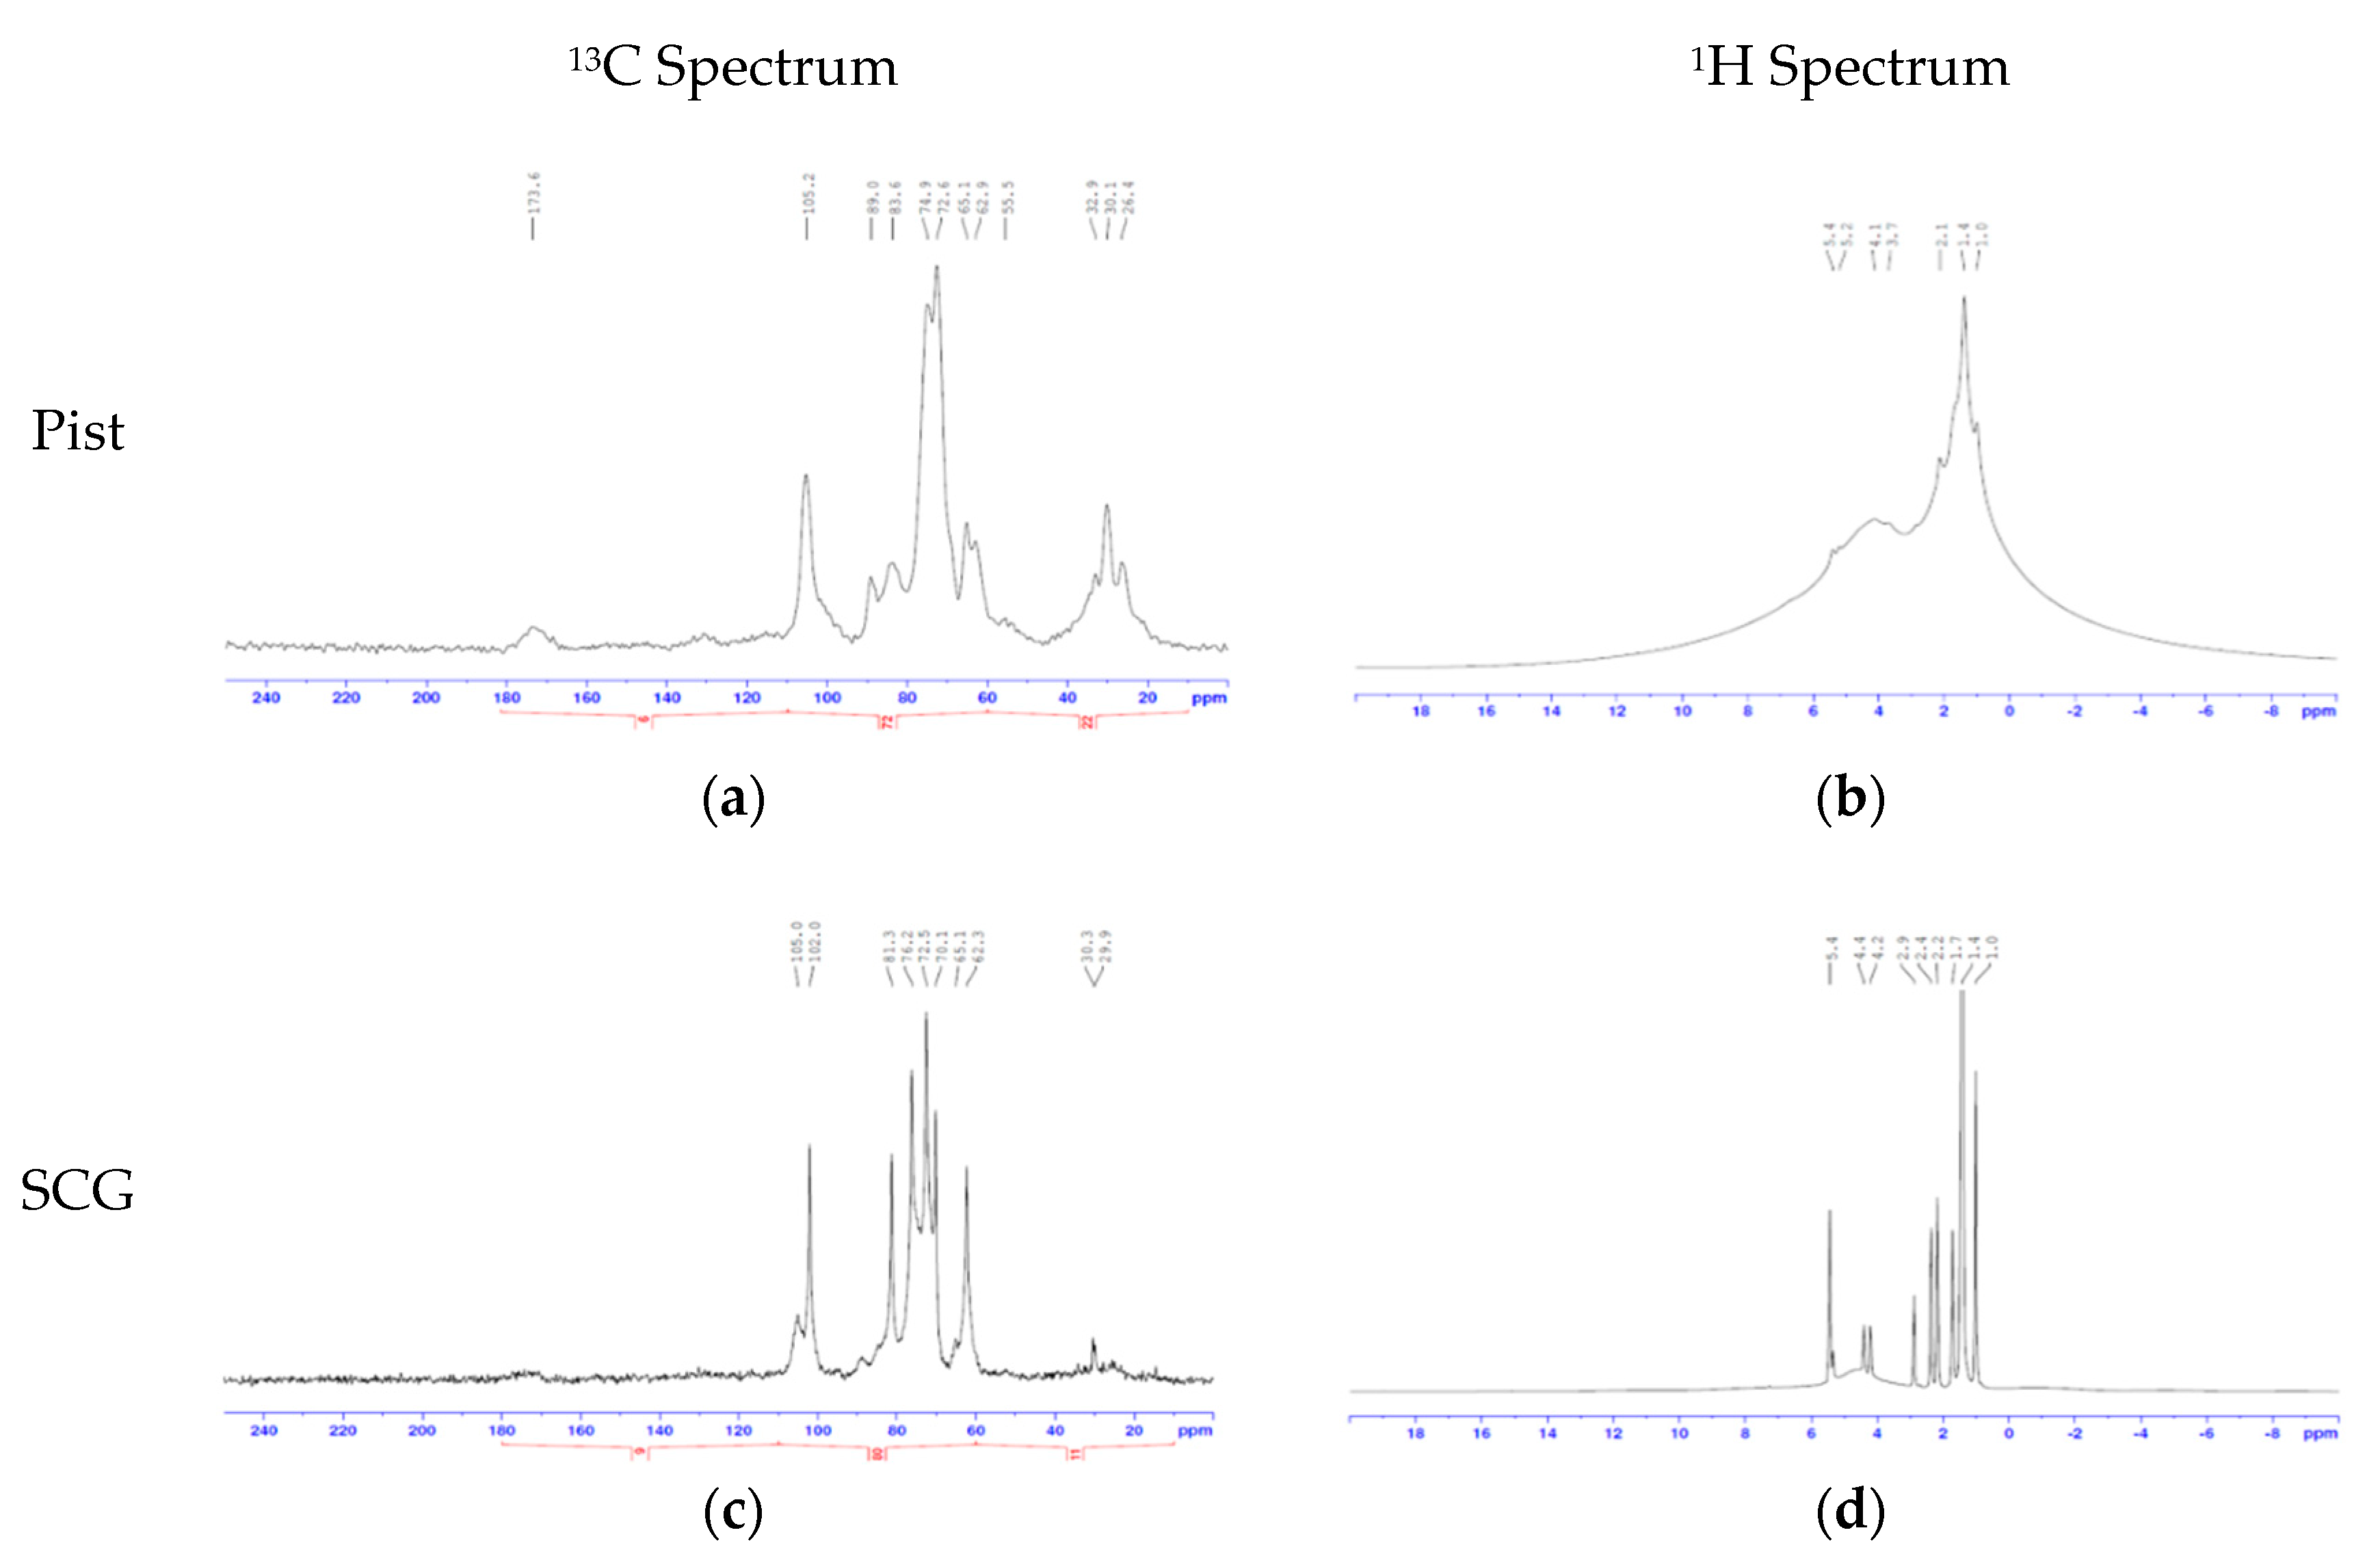
Figure 10.
Thermogravimetric analysis (TGA) of CEF samples from pistachio hull and SCG.

Table 1.
Summary of inductively coupled plasma optical emission spectrometry (ICP-OES) results performed to HEF samples.
Table 1.
Summary of inductively coupled plasma optical emission spectrometry (ICP-OES) results performed to HEF samples.
| System | Ca (ppm) | K (ppm) | Mg (ppm) | Na (ppm) | P (ppm) | S (ppm) | Others (ppm) |
|---|---|---|---|---|---|---|---|
| Pist–MEW | 46.1 | 123.3 | 42 | 503.8 | 6.9 | 123 | 6.0 |
| SCG–MEW | 13.2 | 56.1 | 6.2 | 355.5 | 7.4 | 137 | 10.3 |
| Pist–MAW | 37.9 | 130.9 | 1.9 | 480.2 | 6.3 | 105 | 7.1 |
| SCG–MAW | 21.7 | 37.0 | 8.2 | 10.7 | 9.9 | 134 | 5.8 |
| Pist–MW | 61.9 | 85.0 | 6.1 | 10.7 | 7.2 | 258 | 14.8 |
| SCG–MW | 16.1 | 24.3 | 7.4 | 3.9 | 7.4 | 225 | 5.7 |
Table 2.
Sugar content of HEF samples based on HPLC analysis.
| Solvent | Biomass | Cellobiose [g/L] | Maltose [g/L] | Glucose [g/L] | Xylose [g/L] | Galactose /Mannose [g/L] |
|---|---|---|---|---|---|---|
| MEW | Pist | 4.65 | 0.11 | 0.0008 | 0.34 | - |
| SCG | - | 1.15 | 0.0007 | - | 7.41 | |
| MAW | Pist | - | 0.01 | 0.0007 | 0.37 | - |
| SCG | - | 0.15 | 0.0007 | - | 8.21 | |
| MW | Pist | 0.71 | 0.01 | 0.0015 | 4.12 | - |
| SCG | - | 0.02 | 0.0010 | - | 18.74 |
Table 3.
Elemental analysis results performed to LEF samples. The “total metals” column is a sum of all the metals present in the respective sample obtained from ICP-OES, and the “total” column is the sum of the elemental analysis and the “total metals” column.
Table 3.
Elemental analysis results performed to LEF samples. The “total metals” column is a sum of all the metals present in the respective sample obtained from ICP-OES, and the “total” column is the sum of the elemental analysis and the “total metals” column.
| Solvent | Biomass | Elemental Analysis (%) | ||||||
|---|---|---|---|---|---|---|---|---|
| C | H | N | S | O | Total Metals | Total | ||
| MEW | Pist | 31.54 | 3.64 | 1.35 | 0.28 | 14.65 | 46.15 | 97.61 |
| SCG | 57.14 | 6.93 | 5.69 | 0.59 | 18.47 | 9.51 | 98.33 | |
| MAW | Pist | 44.52 | 5.05 | 1.54 | 0.34 | 17.05 | 29.47 | 97.97 |
| SCG | 61.84 | 8.56 | 2.57 | 0.81 | 16.03 | 8.60 | 98.41 | |
| MW | Pist | 64.86 | 7.66 | 0.26 | 2.55 | 19.62 | 5.44 | 100.39 |
| SCG | 62.82 | 9.17 | 0.74 | 3.81 | 21.13 | 0.15. | 97.82 | |
Table 4.
Experimental and theoretical high heating value (HHV) with respective errors to the experimental values.
Table 4.
Experimental and theoretical high heating value (HHV) with respective errors to the experimental values.
| Solvent | Bio-Mass | HHVexp [J/g] | Theoretical HHV (1) | Theoretical HHV (2) | Theoretical HHV (3) | ||||||
|---|---|---|---|---|---|---|---|---|---|---|---|
| Btu/lb | J/g | Error (%) | Btu/lb | J/g | Error (%) | Btu/lb | J/g | Error (%) | |||
| MEW | Pist | 14,854 | 5,720 | 13,306 | 11.6 | 5,938 | 13,812 | 7.5 | 5,541 | 12,889 | 15.2 |
| SCG | 22,038 | 11,201 | 26,053 | 15.4 | 11,402 | 26,521 | 16.9 | 11,158 | 25,953 | 15.1 | |
| MAW | Pist | 19,339 | 8,299 | 19,304 | 0.2 | 8,499 | 19,768 | 2.2 | 8,147 | 18,950 | 2.1 |
| SCG | 25,818 | 13,093 | 30,455 | 15.2 | 12,969 | 30,167 | 14.4 | 13,107 | 30,487 | 15.3 | |
| MW | Pist | 10,792 | 12,767 | 29,695 | 63.7 | 12,821 | 29,822 | 63.8 | 12,887 | 29,976 | 64.0 |
| SCG | 11,081 | 13,340 | 31,030 | 64.3 | 13,265 | 30,854 | 64.1 | 13,543 | 31,500 | 64.8 | |
Table 5.
Assignments to the labels in Figure 4, Figure 5 and Figure 6, see Figure 7 for the structures identified.
| Label | Assignment |
|---|---|
| Aα(G) | Cα-Hα in β-O-4′substructures (A) linked to a G-unit |
| Aγ | Cγ-Hγ in γ-hydroxylated β-O-4′ substructures (A) |
| G2 | C2-H2 in guaiacyl units (G) |
| G5/G6 | C5-H5 and C6-H6 in guaiacyl units (G) |
| H2,6 | C2,6-H2,6 in p-hydroxyphenyl units (H) |
| OMe | C-H in methoxyls |
| PCAα | Cα-Hα in p-coumarate (PCA) |
| PCAβ/FAβ | Cβ-Hβ in p-coumarate (PCA) and ferulate (FA) |
| S2,6 | C2-H2 and C6-H6 in etherified syringyl units (S) |
| T6/T8 | C6 and C8 in tricin (T) |
Table 6.
Elemental analysis of CEF. The column denominated “Total” corresponds to the sum of the analyzed elements.
Table 6.
Elemental analysis of CEF. The column denominated “Total” corresponds to the sum of the analyzed elements.
| Cellulose | C (%) | H (%) | N (%) | S (%) | O (%) | Total (%) | |
|---|---|---|---|---|---|---|---|
| 44.40 | 6.20 | 0.00 | 0.00 | 49.40 | 100.00 | ||
| MEW | Pist | 50.36 | 6.82 | 1.38 | 0.28 | 36.52 | 95.36 |
| SCG | 52.02 | 7.64 | 1.38 | 0.31 | 36.40 | 97.75 | |
| MAW | Pist | 52.81 | 7.17 | 1.38 | 0.38 | 35.80 | 97.54 |
| SCG | 49.38 | 7.28 | 1.65 | 0.30 | 39.51 | 98.12 | |
| MW | Pist | 58.76 | 7.82 | 1.23 | 0.67 | 30.46 | 98.94 |
| SCG | 56.11 | 7.74 | 3.23 | 0.46 | 30.45 | 97.99 | |
Table 7.
Percentage of cellulose and ash in CEF samples based on TGA.
| Solvent | Biomass | Estimated %cellulose |
|---|---|---|
| MEW | Pist | 43.7 |
| SCG | 41.0 | |
| MAW | Pist | 45.5 |
| SCG | 37.0 | |
| MW | Pist | 36.6 |
| SCG | 35.5 |
Table 8.
Summary of the cellulose/CEF hydrolysis, glucose isomerization and fructose dehydration.
| Biomass | Glucose Yield (%) | Fructose Yield (%) | HMF Yield (%) | Overall HMF Yield (%) |
|---|---|---|---|---|
| Cellulose | - | - | 0.8 | 0.8 |
| 60.8 | - | 24.3 | 14.8 | |
| 60.8 | 52.2 | 73.2 | 23.2 | |
| CEF from Pistachio | - | - | 0.1 | 0.1 |
| 23.7 | - | 21.8 | 5.2 | |
| 23.7 | 48.3 | 69.6 | 8.0 | |
| CEF from SCG | - | - | 0.1 | 0.1 |
| 25.9 | - | 22.0 | 5.7 | |
| 25.9 | 44.9 | 70.3 | 8.2 |
© 2019 by the authors. Licensee MDPI, Basel, Switzerland. This article is an open access article distributed under the terms and conditions of the Creative Commons Attribution (CC BY) license (http://creativecommons.org/licenses/by/4.0/).
Share and Cite
MDPI and ACS Style
Pereira, A.P.; Woodman, T.J.; Brahmbhatt, P.; Chuck, C.J. The Optimized Production of 5-(Hydroxymethyl)furfural and Related Products from Spent Coffee Grounds. Appl. Sci. 2019, 9, 3369. https://doi.org/10.3390/app9163369
AMA Style
Pereira AP, Woodman TJ, Brahmbhatt P, Chuck CJ. The Optimized Production of 5-(Hydroxymethyl)furfural and Related Products from Spent Coffee Grounds. Applied Sciences. 2019; 9(16):3369. https://doi.org/10.3390/app9163369
Chicago/Turabian StylePereira, André Prates, Timothy J. Woodman, Paraj Brahmbhatt, and Christopher J. Chuck. 2019. "The Optimized Production of 5-(Hydroxymethyl)furfural and Related Products from Spent Coffee Grounds" Applied Sciences 9, no. 16: 3369. https://doi.org/10.3390/app9163369
Note that from the first issue of 2016, this journal uses article numbers instead of page numbers. See further details here.