1. Introduction
Large scale neural activity patterns formed due to an interplay between dynamics of neurons and their network interconnections are principal fingerprints of brain functionality. At the same time, age and genetic disruption of neuronal connections can lead to neurodegenerative diseases such as Alzheimer’s, Parkinson’s, Huntington’s and others. The number of incidence cases is increasing due to population ageing associated with new advances in medicine and technology. Therefore, the key problem is the difficult search for mechanisms of neurodegenerative disorders and new approaches to their treatment.
The most widespread conventional method for studying mechanisms of neuronal activity uses electrical stimulation of electrodes placed in the extracellular space. Electrophysiology allows for easy control of temporal resolution; nevertheless, in most cases it activates a lot of neurons simultaneously but not individual neurons. This is a significant disadvantage since specific types of neurons have an intrinsic activity pattern [
1,
2]. There is also an intracellular stimulation method which provides the necessary spatial and temporal resolutions, but its application is restricted to neuronal culture or brain slices [
3].
One of the methods that allows for the study of the activity of certain neurons in vivo is the optical stimulation of neurons (optogenetics). In comparison with the methods mentioned above, it offers several advantages, such as a high spatio-temporal resolution with a parallel stimulation of certain brain areas [
4,
5]. The main principle of this method is based on the expression of light-sensitive ion channels called opsins in neuronal membranes. One of them, channelrhodopsin-2 (ChR2) isolated from the green alga
Chlamydomonas reinhardtii [
6,
7], and its modifications is used practically for neuron excitation. ChR2 is activated with blue light (470 nm), which in turn induces a photoreceptor current due to non-selective cation flux into the cytoplasm of cells [
6,
7,
8].
Since the method was developed, optogenetics has been widely used in neuroscience [
4,
8,
9,
10,
11]. Recently, optogenetics has also been applied to investigate neurodegenerative diseases (an area of scientific interest of the authors). For example, the authors [
12] used step-function opsin (SFO) for the long-term excitation of the hippocampal perforant pathway in amyloid precursor protein (APP) transgenic mice. As a result, a prolonged light excitation led to an increase in the level of amyloid deposits of peptide of 42 amino acid residues (Aβ42) that allows for the determination of a certain functional pathology in specific neuronal circuits in Alzheimer’s disease. The review [
13] contains a number of studies in which optogenetics is successfully used as a tool for activating or inhibiting specific regions or certain neurons involved in the development of neurodegenerative and neurological diseases such as Parkinson’s disease [
14], Huntington’s disease [
15], and epilepsy [
16,
17].
Despite the fact that optogenetics is one of the most developing areas of neurobiology and a widely used technique, there are some open questions related to the parameters of light stimulation for neurons expressing opsins. In this paper, we would like to emphasize the importance of light parameters during repeated light stimulation. Thus, our main goal is to determine the relationship between the light stimulation parameters (frequency, duration, intensity) and neuron activity during repeated light stimulation and define the optimal parameters for the stable activity of neurons.
2. Materials and Methods
2.1. Animals
The breeding colony of wild type mice of the same strain (C57BL/6J background, #000664) obtained from the Jackson Laboratory was established and maintained in a vivarium with 4–5 mice per cage and a 12 h light/dark cycle in the animal facility. All procedures were approved by principles of the European convention (Strasburg, 1986) and the Declaration of International Medical Association regarding the humane treatment of animals (Helsinki, 1996).
2.2. Hippocampal Primary Culture
The hippocampal cultures of mice were established from postnatal day 0–1 pups and maintained in culture as described earlier [
18]. Briefly, after dissection and dissociation, neurons were plated on coverslips (pre-coated with poly-D-lysine, 0.1 mg/mL, #27964, Sigma, St. Louis, MI, USA) and cultured in neurobasal A medium with an addition of 1% fetal bovine serum (FBS) and 2% optimized neuronal cell culture serum-free supplement B27. On the third day of in vitro culture (DIV3), cytosine arabinoside (Ara-C) (40 M, Sigma, #C1768) was added to prevent the growth of glial cells. At DIV7 and DIV14, 50% of the medium was exchanged with fresh neurobasal A medium containing 2% B27 without FBS. At DIV7, neurons were transfected using the calcium phosphate method.
2.3. The Calcium Phosphate Method of Transfection
At DIV7, neurons were transfected using the calcium phosphate method with a mammalian transfection kit (#631312, Clontech Laboratories Inc., Mountain View, CA, USA) according to the manufacturer’s protocol with recommendations from [
19]. Due to the fact that the excitation length (470 nm) of green fluorescent protein (GFP) coincides with the excitation length of chanalrhodopsin-2, we used the marker plasmid pCSCMV:tdTomato (#30530, Addgene, Watertown, MA, USA), which encodes a red fluorescent protein with an excitation wavelength of 530 nm. For multiple plasmid delivery, we used the calcium phosphate co-transfection method. Plasmids were mixed at a ratio of 3:1, with 3 parts containing the plasmid of interest.
2.4. Whole Cell Patch Recordings in Hippocampal Cultures
The recording of neuronal light-induced activity was performed with whole-cell voltage- and current-clamp techniques after 14 days of cultivation; at this time, neurons mature and form a stable network [
20,
21]. Whole-cell recordings were conducted in artificial cerebrospinal fluid (ACSF) external solution, which contains 124 mM NaCl, 26 mM NaHCO
3, 10 mM glucose, 5 mM KCl, 2.5 mM CaCl
2, 1.3 mM MgCl
2 and 1 mM NaH
2PO
4 (pH 7.4, 290–310 milliosmole (mOsm)) [
22]. An Olympus IX73 inverted microscope was used with the 40× objective and appropriate filters for fluorescence imaging. This microscope was equipped with a 4-channel light-emitting diode (LED) driver Thorlabs DC4104 to localize and target fluorescent ChR2-expressing neurons by expression of the tdTomato fluorescent protein.
Patch pipettes, pulled from borosilicate glass (1.5 mm outside diameter (OD), 0.86 mm inside diameter (ID), 3-5 MOm) were filled with a solution containing 140 mM K-Gluconate, 2 mM MgCl
2, 2 mM NaCl, 2 mM ATP-Na
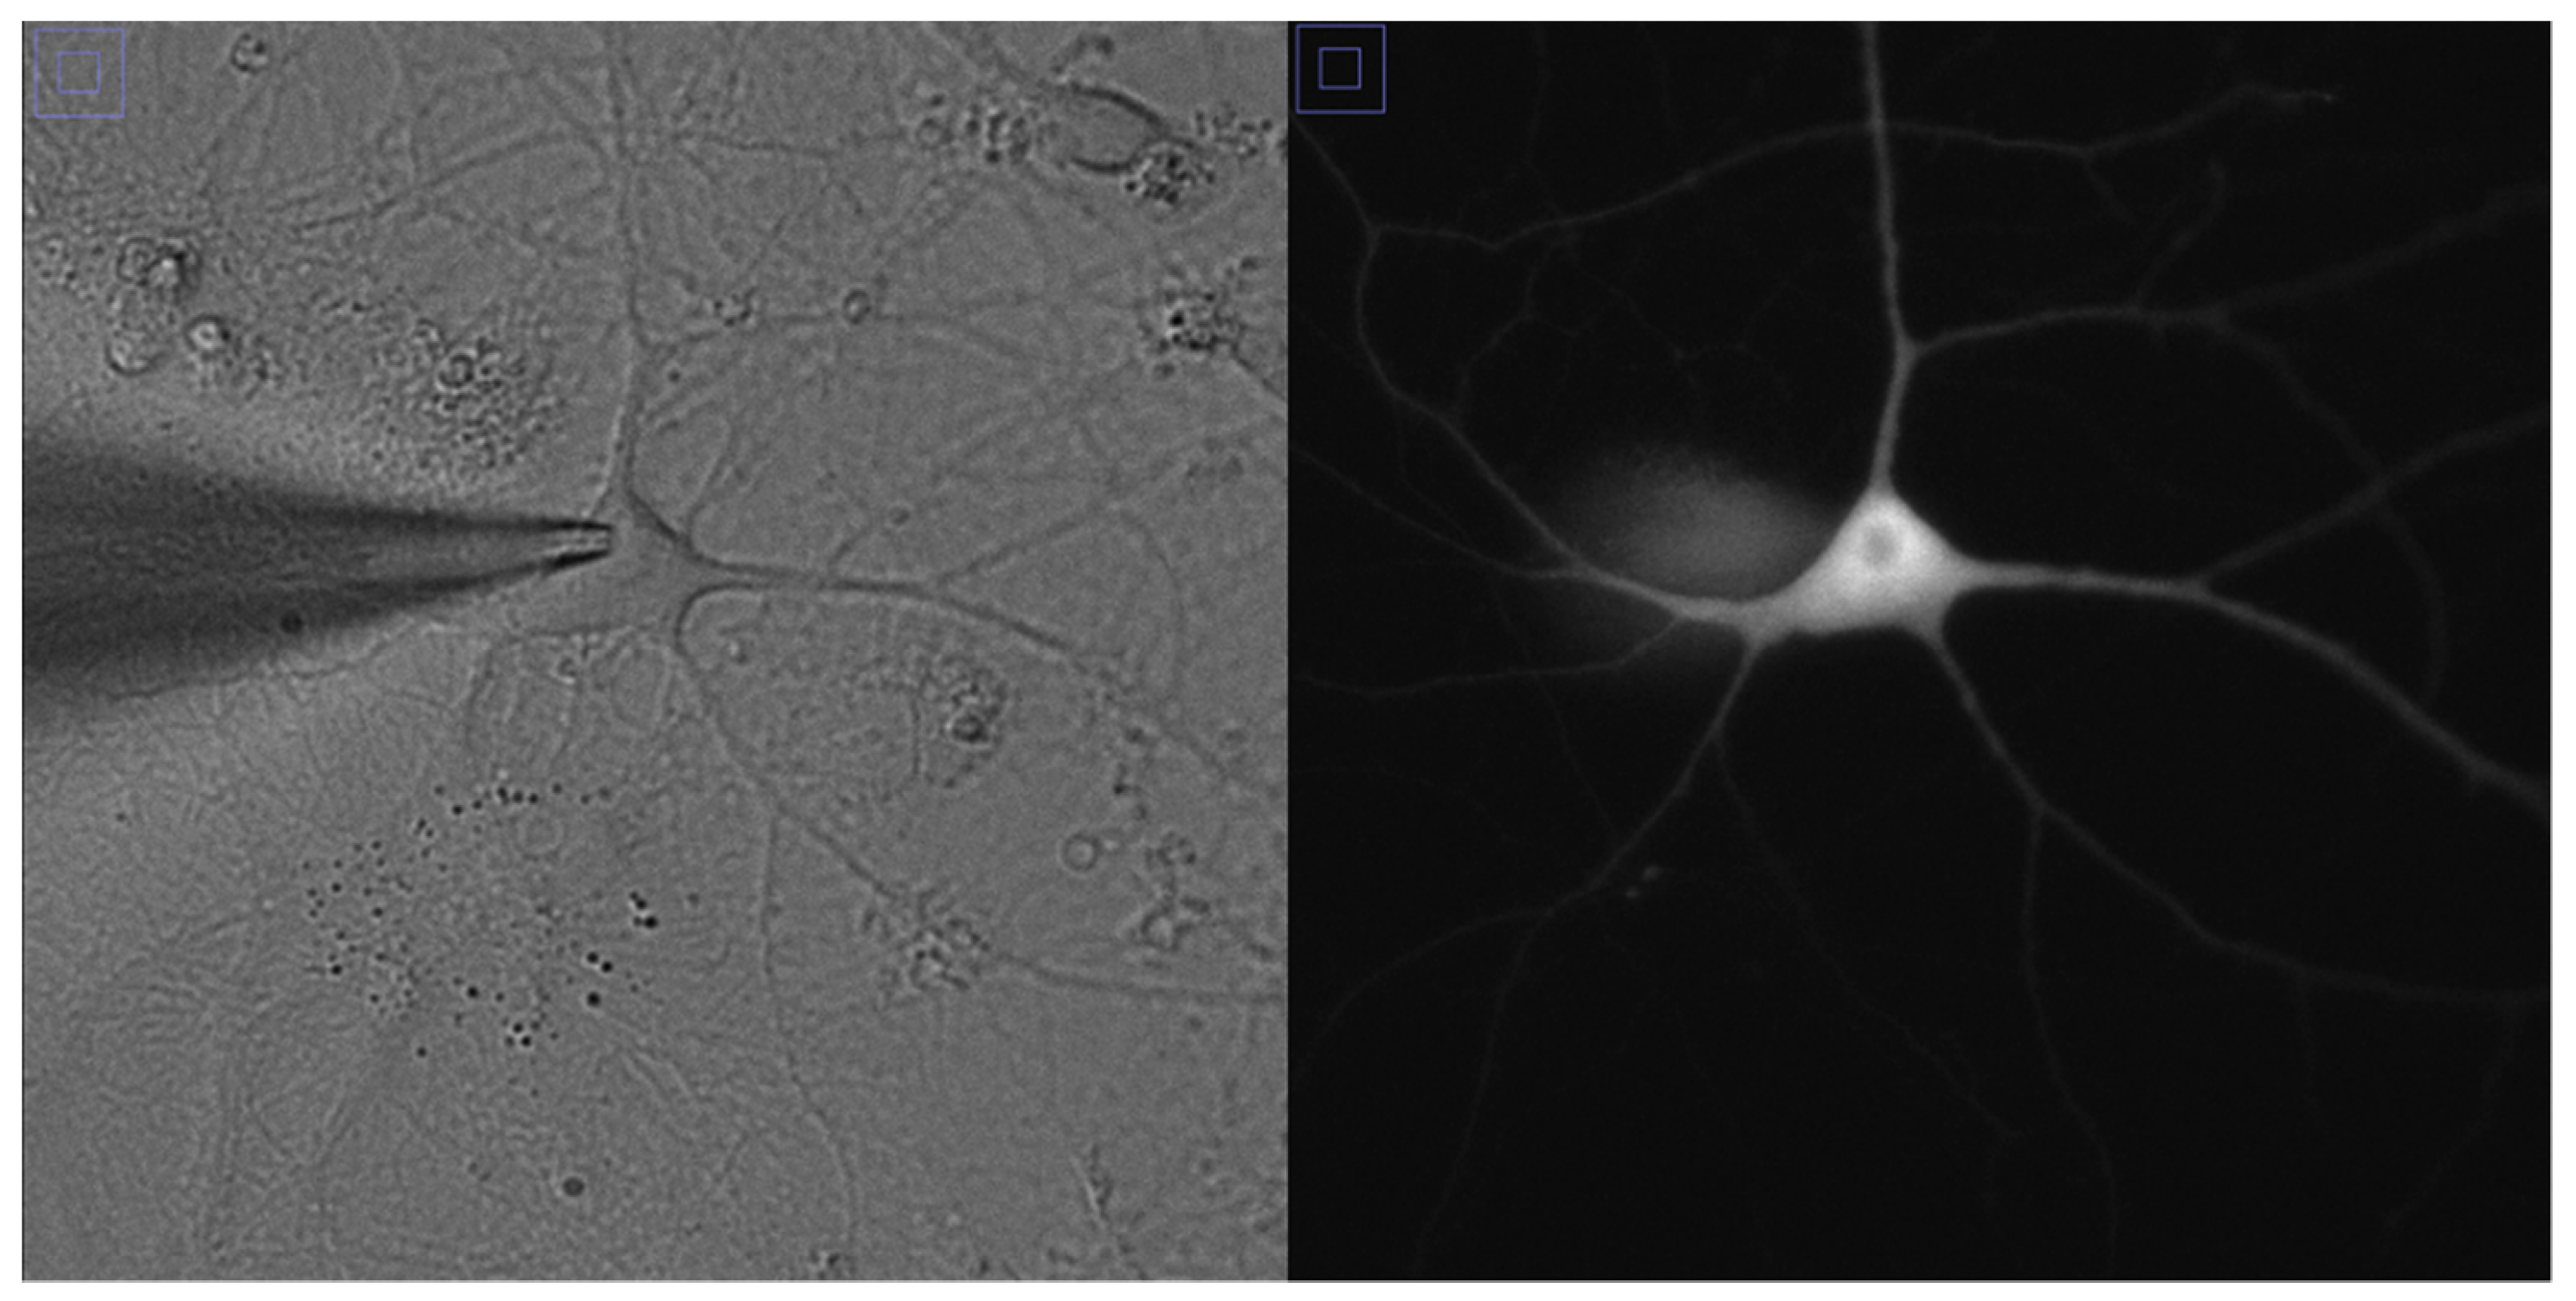
2, 0.3 mM GTP-Mg, 10 mM 4-(2-hydroxyethyl)-1-piperazineethanesulfonic acid (HEPES) (pH 7.35, 290–300 mOsm). Conventional whole-cell patch-clamp recordings were obtained via a MultiClamp 700 B double patch amplifier and a Digidata 1440A (Molecular Devices, Sunnyvale, CA, USA) coupled to the acquisition software pClamp 10.7. The holding potential in voltage-clamp mode was −70 mV, uncorrected for any liquid junction potential (in the range of −10 mV to −8 mV) between the internal and external solutions. After DIV14, light-evoked neuronal activity has been detected using the whole-cell patch clamp technique as shown in
Figure 1. We have used 10 primary cultures for the measurement of membrane currents and potentials.
2.5. Optogenetic Method
During the recording of neuronal activity, a pulse train of blue light (470 nm) was performed with different parameters (frequency, duration, intensity). In our experiments, we used a frequency range of 1–30 Hz in increments of 5 Hz and a pulse duration range of 1–5 ms in increments of 1 ms, 10–50 ms in increments of 10 ms, and 100–500 ms in increments of 100 ms. Ten light stimuli were used per frequency or duration (
Figure 2).
The maximum intensity of the blue LED (LED4D067, 470 nm, Thorlabs Inc., Newton, NJ, USA) was 35 mW mm−2 with a maximum photo flux of 250 mW. The values of light intensities were normalized, taking the maximum value in each sequence as unity, i.e., all indicated values are shown as relative ones.
The LED source has a modulation voltage in the range of 0–10 V and a current in the range of 0–1000 mA. We measured the intensity at the maximum current, i.e., 1000 mA, which corresponds to a modulation voltage of 10 V. To change the intensity, we connected a pulse generator to the LED source and changed the modulation voltage from 0 V to 10 V; while we considered that at a voltage of 10 volts, we get the maximum intensity. The values of light intensities were normalized, taking the maximum value in each sequence as unity.
2.6. Statistical Analysis
The mathematical software OriginPro 9.0 and GraphPad Prism 7 were used to process the data and obtain standard errors.
3. Results
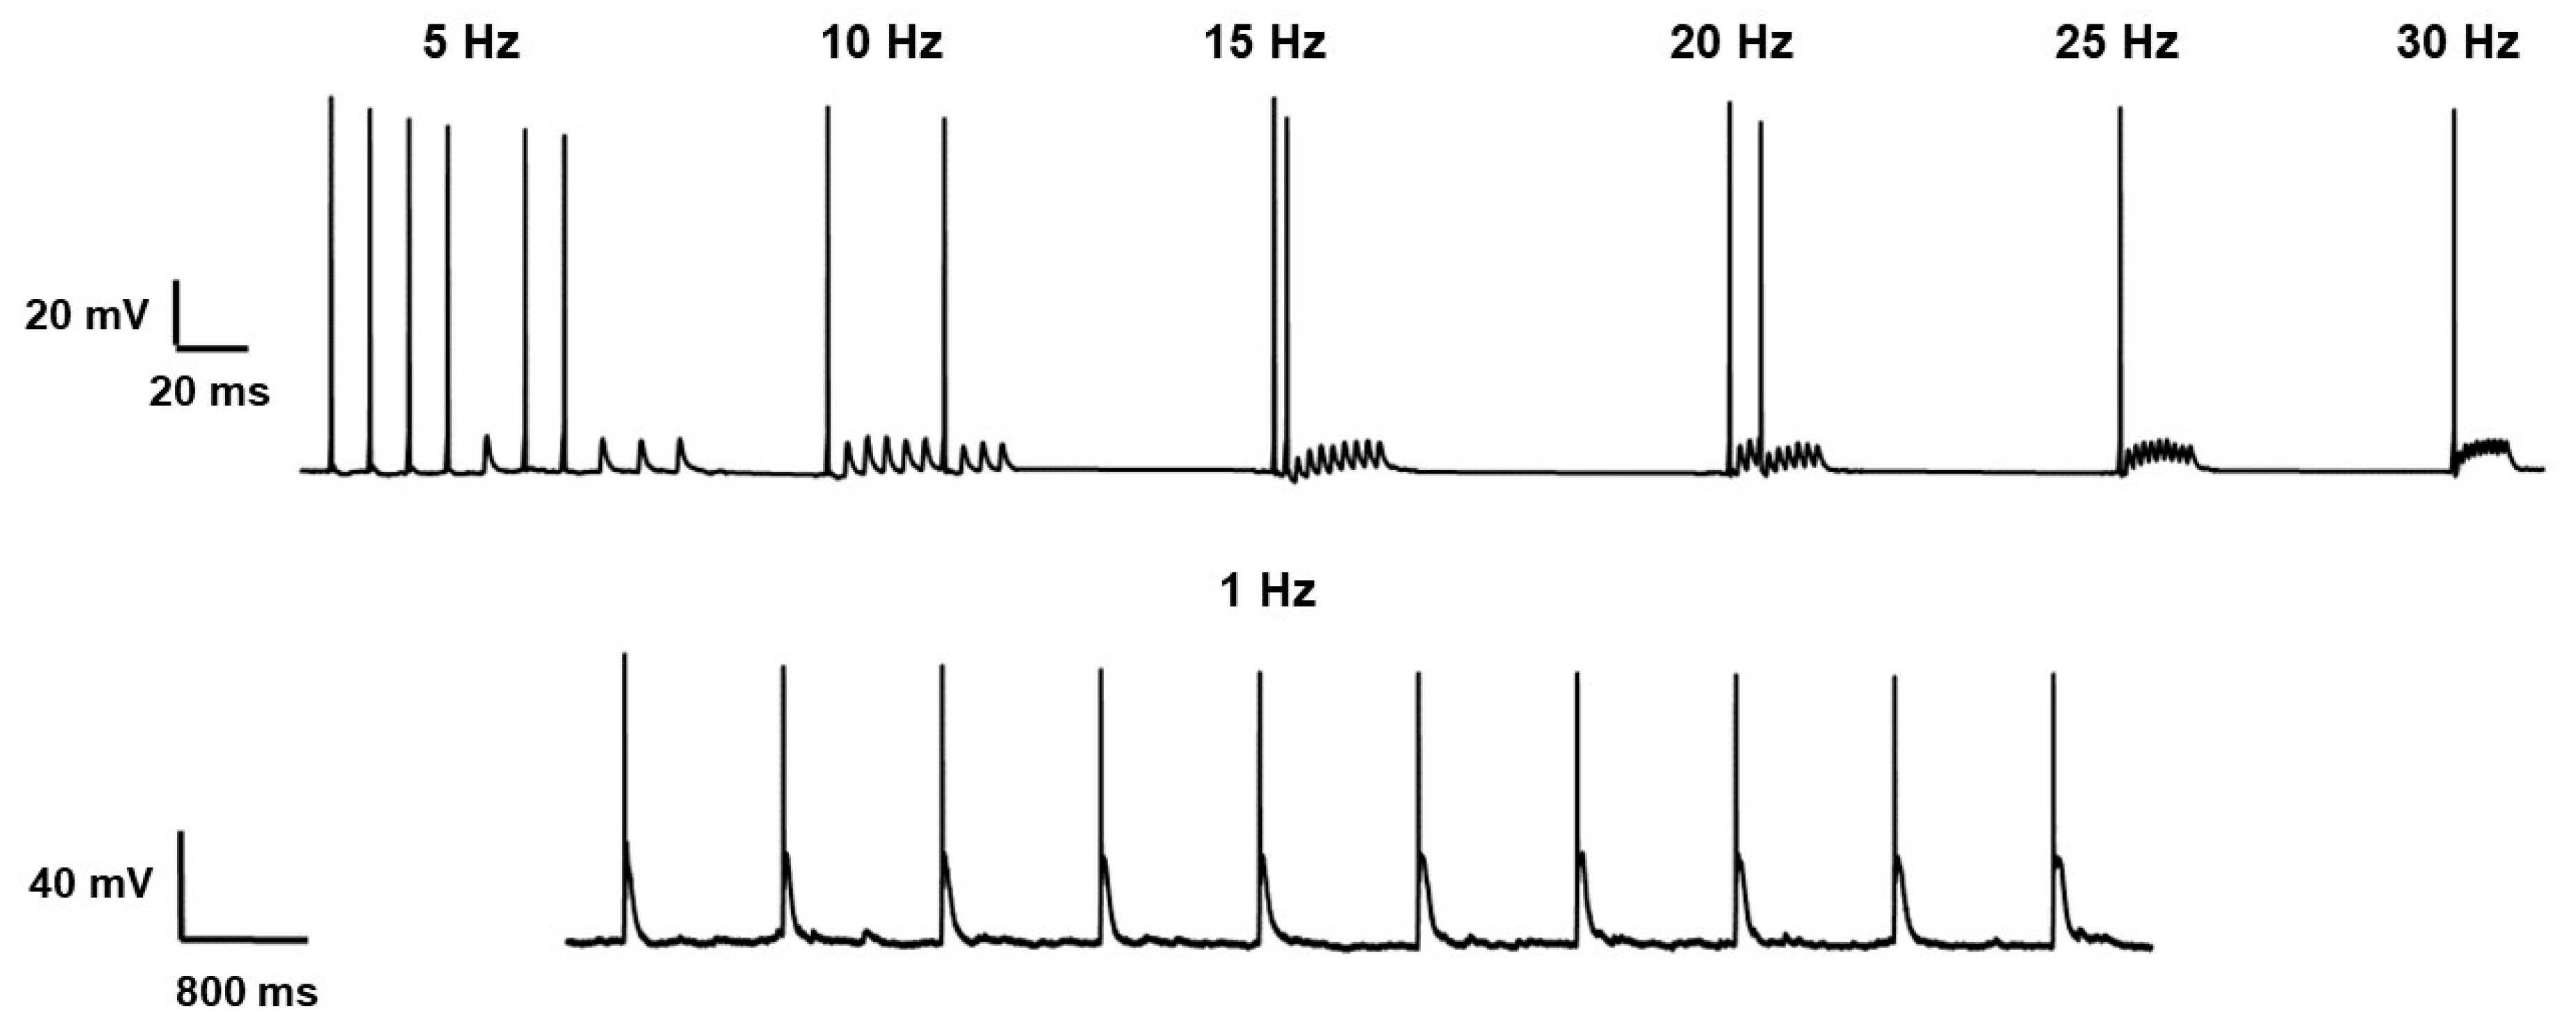
To define the relationship between the activity of the pyramidal neuron expressing ChR2 and the parameters of the light stimulus, we carried out experiments with a 10-light pulse train. We picked up the frequency at which the action potential (AP) was generated for each light stimulus (
Figure 3). We considered the generation of action potentials because the membrane current changed at all frequencies used in this study.
These results demonstrated a reduced number of AP with increasing frequency under blue light pulsing. The frequency at which the AP was generated for each light stimulus was in the range of 1–5 Hz. Further measurements were carried out at a frequency of 1 Hz. These results are similar to the data published previously [
23], but the range of optimal stimulation frequency was more narrow in our experiments. The reason for this discrepancy requires further study.
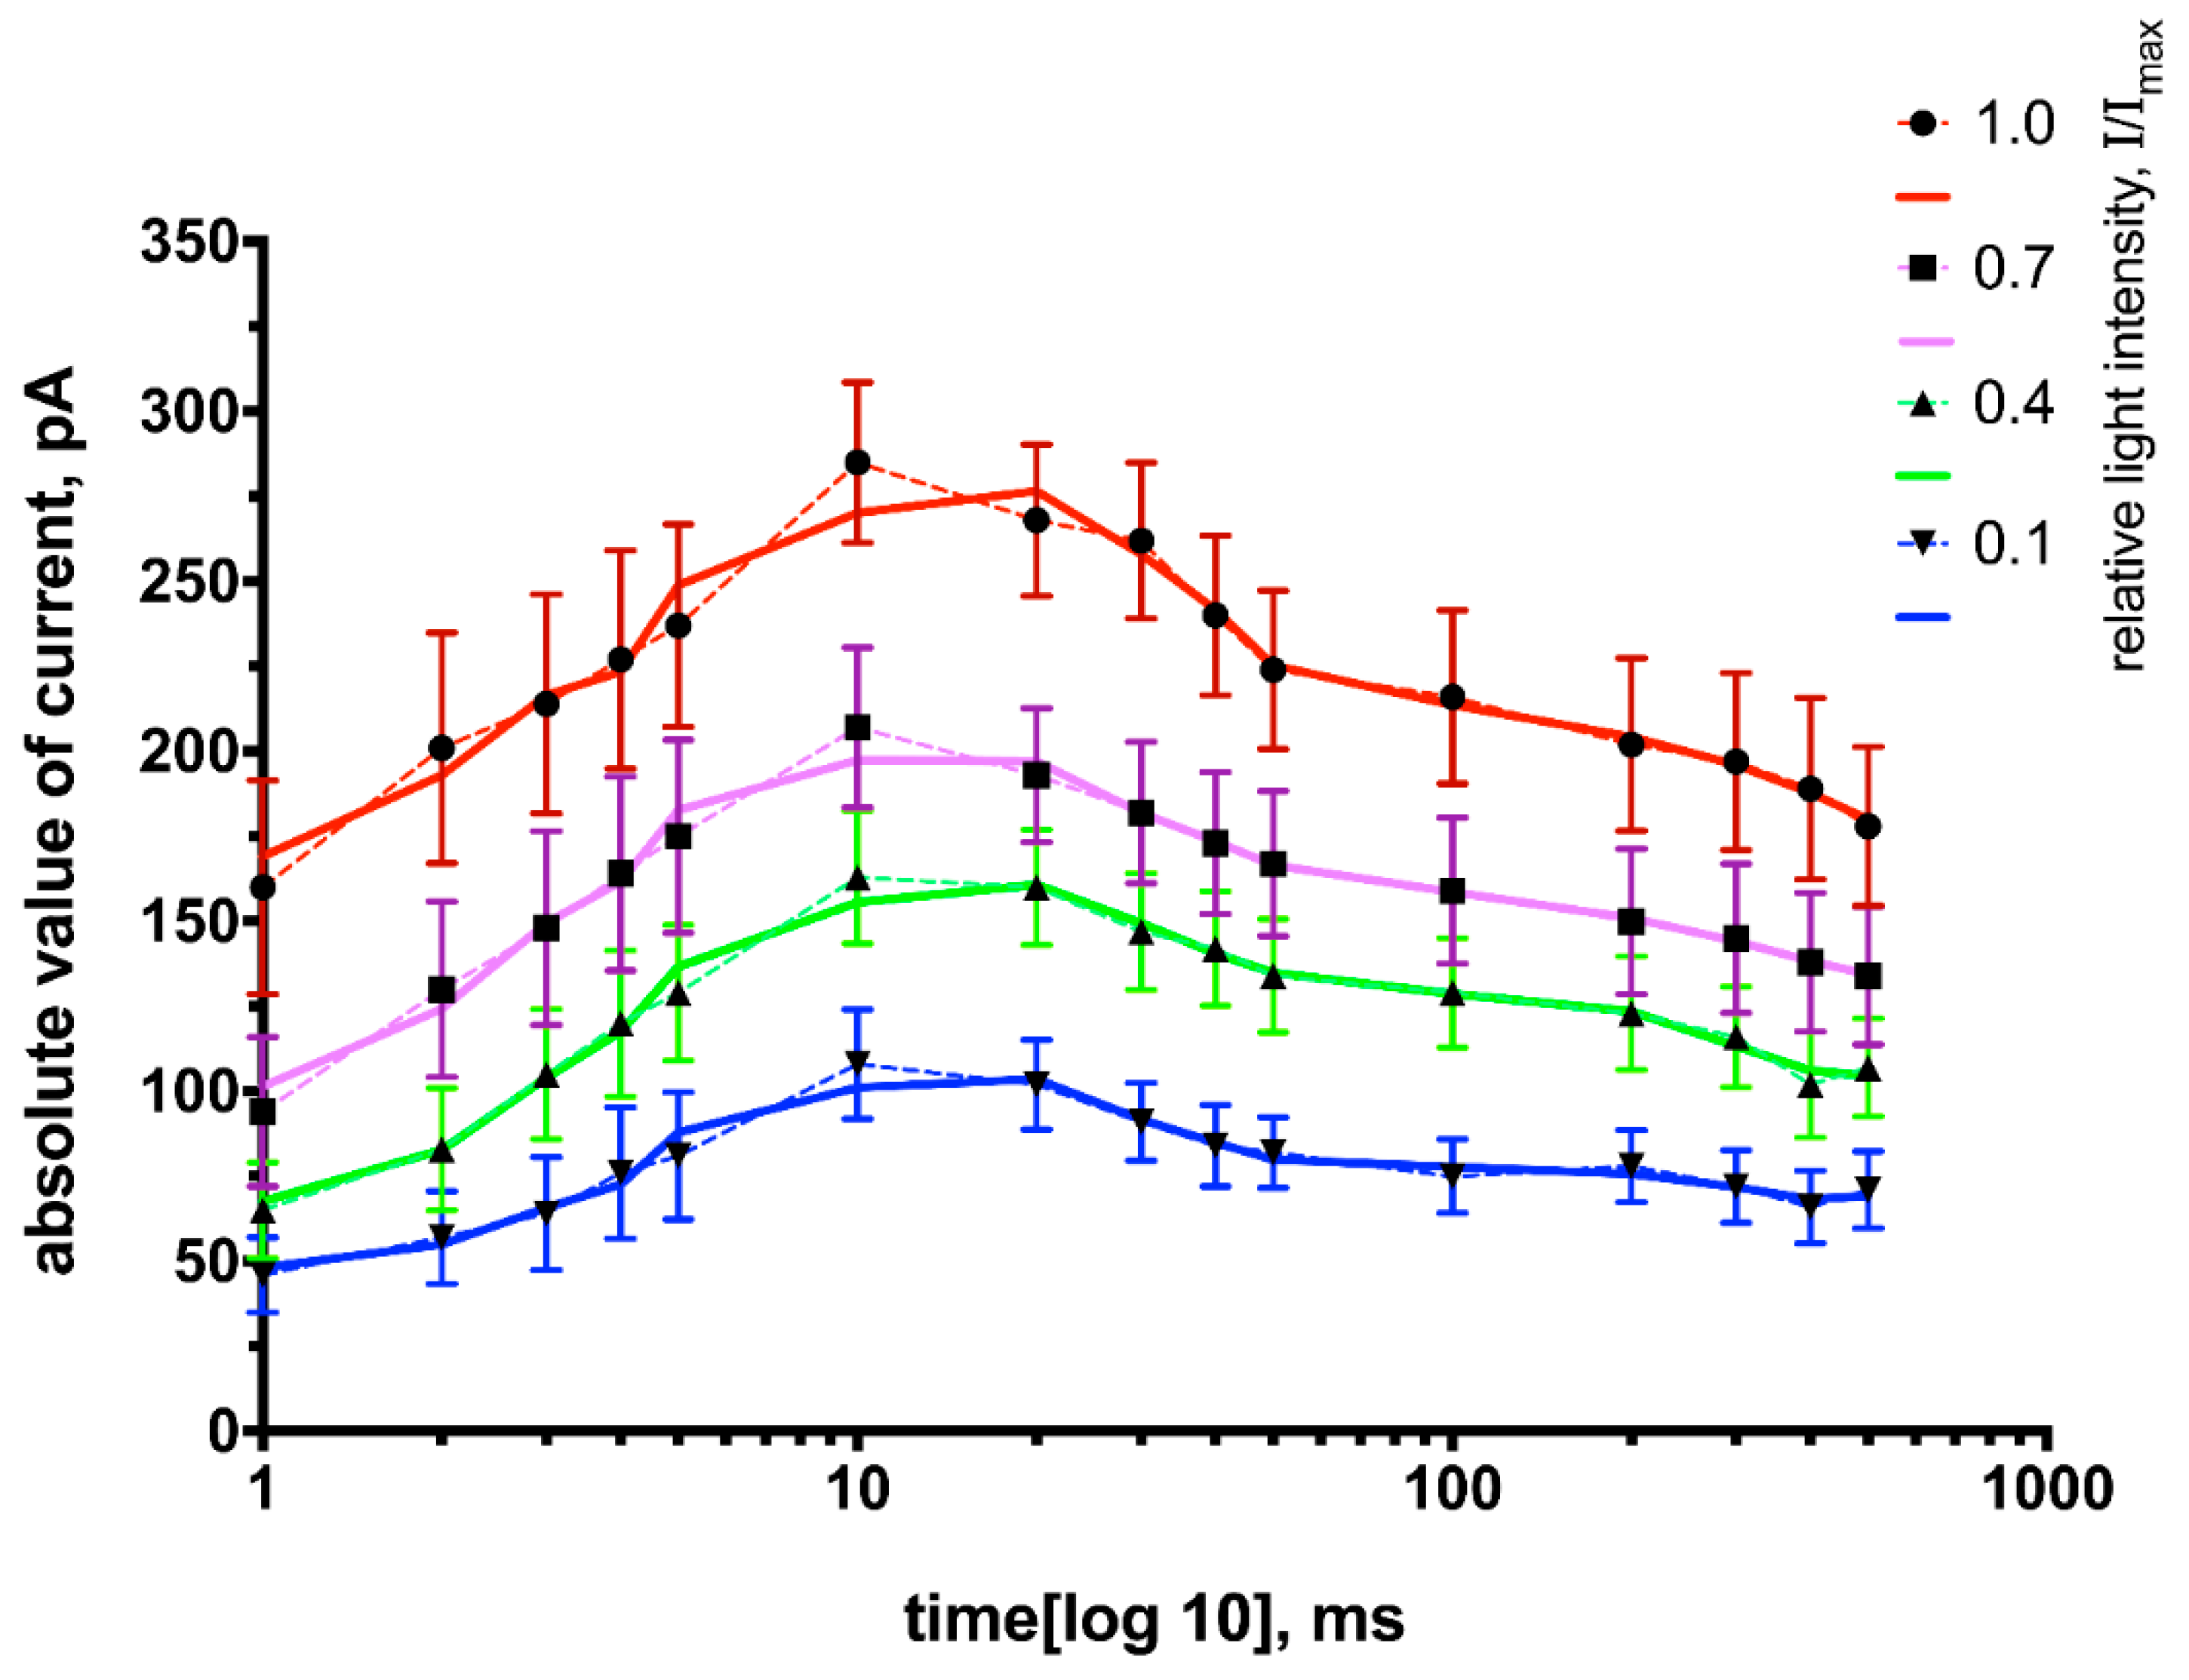
We have studied the effect of the light pulse duration in the range of 1–5 ms, 10–50 ms and 100–500 ms on the amplitude of photocurrents at various LED intensities; the value of maximum intensity has been normalized to unity. Each point in
Figure 4 represents the mean value of the measured amplitudes of the response to a 10-pulse train with fixed duration and intensity (see
Figure 2).
As shown in
Figure 4, the dependency of the photocurrent amplitude on the light pulse is described by a right-skewed bell-shaped curve. The obtained dependency was identical for all light intensities used in the experiment. The obtained results agree with results published earlier [
7,
24].
It should be noted that in the range of 1–20 ms, the value of this amplitude increases, while at higher values of pulse duration (30–500 ms), the amplitude decreases. An explanation for this fact may be based on the kinetic model of the ChR2 photocycle, in which three channel states (open (O), desensitized (D) and closed (C)) were considered [
7]. The three states model was the first model describing a photocycle of channelrhodopsin-2. However, after the spectral analysis of ChR2 [
25], an existence of four kinetic intermediate states (
P1,
P2,
P3 and
P4) was indicated. Based on this information, four [
24,
26] and six [
27] state models have been developed. To explain our findings, we utilized the four-state model of ChR2 photocycle, which consists of two open states (
O1 →
O2) and two closed states (
C1 →
C2). Thus, the states defined by the spectral analysis can be interpreted as follows:
O1 →
O2 corresponds to the states
P2 and
P3 (open states with the time constants of 1 ms and 10 ms, respectively) and state
C2 (the time constant ~5s) corresponds to the state
P4 (desensitized). The state of
C is the ground state of the channel and corresponds to
P0. We suppose that the decrease of photocurrents after 30 ms is due to the transition in the
P4 state, i.e., inactivation of ChR-2.
We have also studied the time interval tau (
τ), which is needed to reach the maximum photocurrent (
Figure 5) for different pulse durations (t) atmaximum intensities (I
max).
We analyzed the relationship between
τ and light pulse duration (t) (
Figure 6). According to dependence in the range of 10–30 ms,
τ corresponds to the light pulse duration.
After t = 50 ms, the time τ did not change. This suggests that light stimulation with a duration longer than 50 ms is impractical, because the response of neurons expressing ChR2 is not stable.
Figure 7 shows an example of ChR2 photocurrents of the primary hippocampal neuron for the first light stimuli at various pulse durations (1–5 ms, 10–50 ms, 100–500 ms).
As shown in
Figure 7 (left panel), the maximum photocurrent is already achieved after the light stimulus itself in the case of short pulse durations. At higher pulse durations (
Figure 7, middle panel),
τ either coincides with the pulse duration, or achieves maximum value before the end of the light stimulus itself. At large values of pulse duration (
Figure 7, right panel), the time interval
τ is always shorter than the duration of the light stimulus.
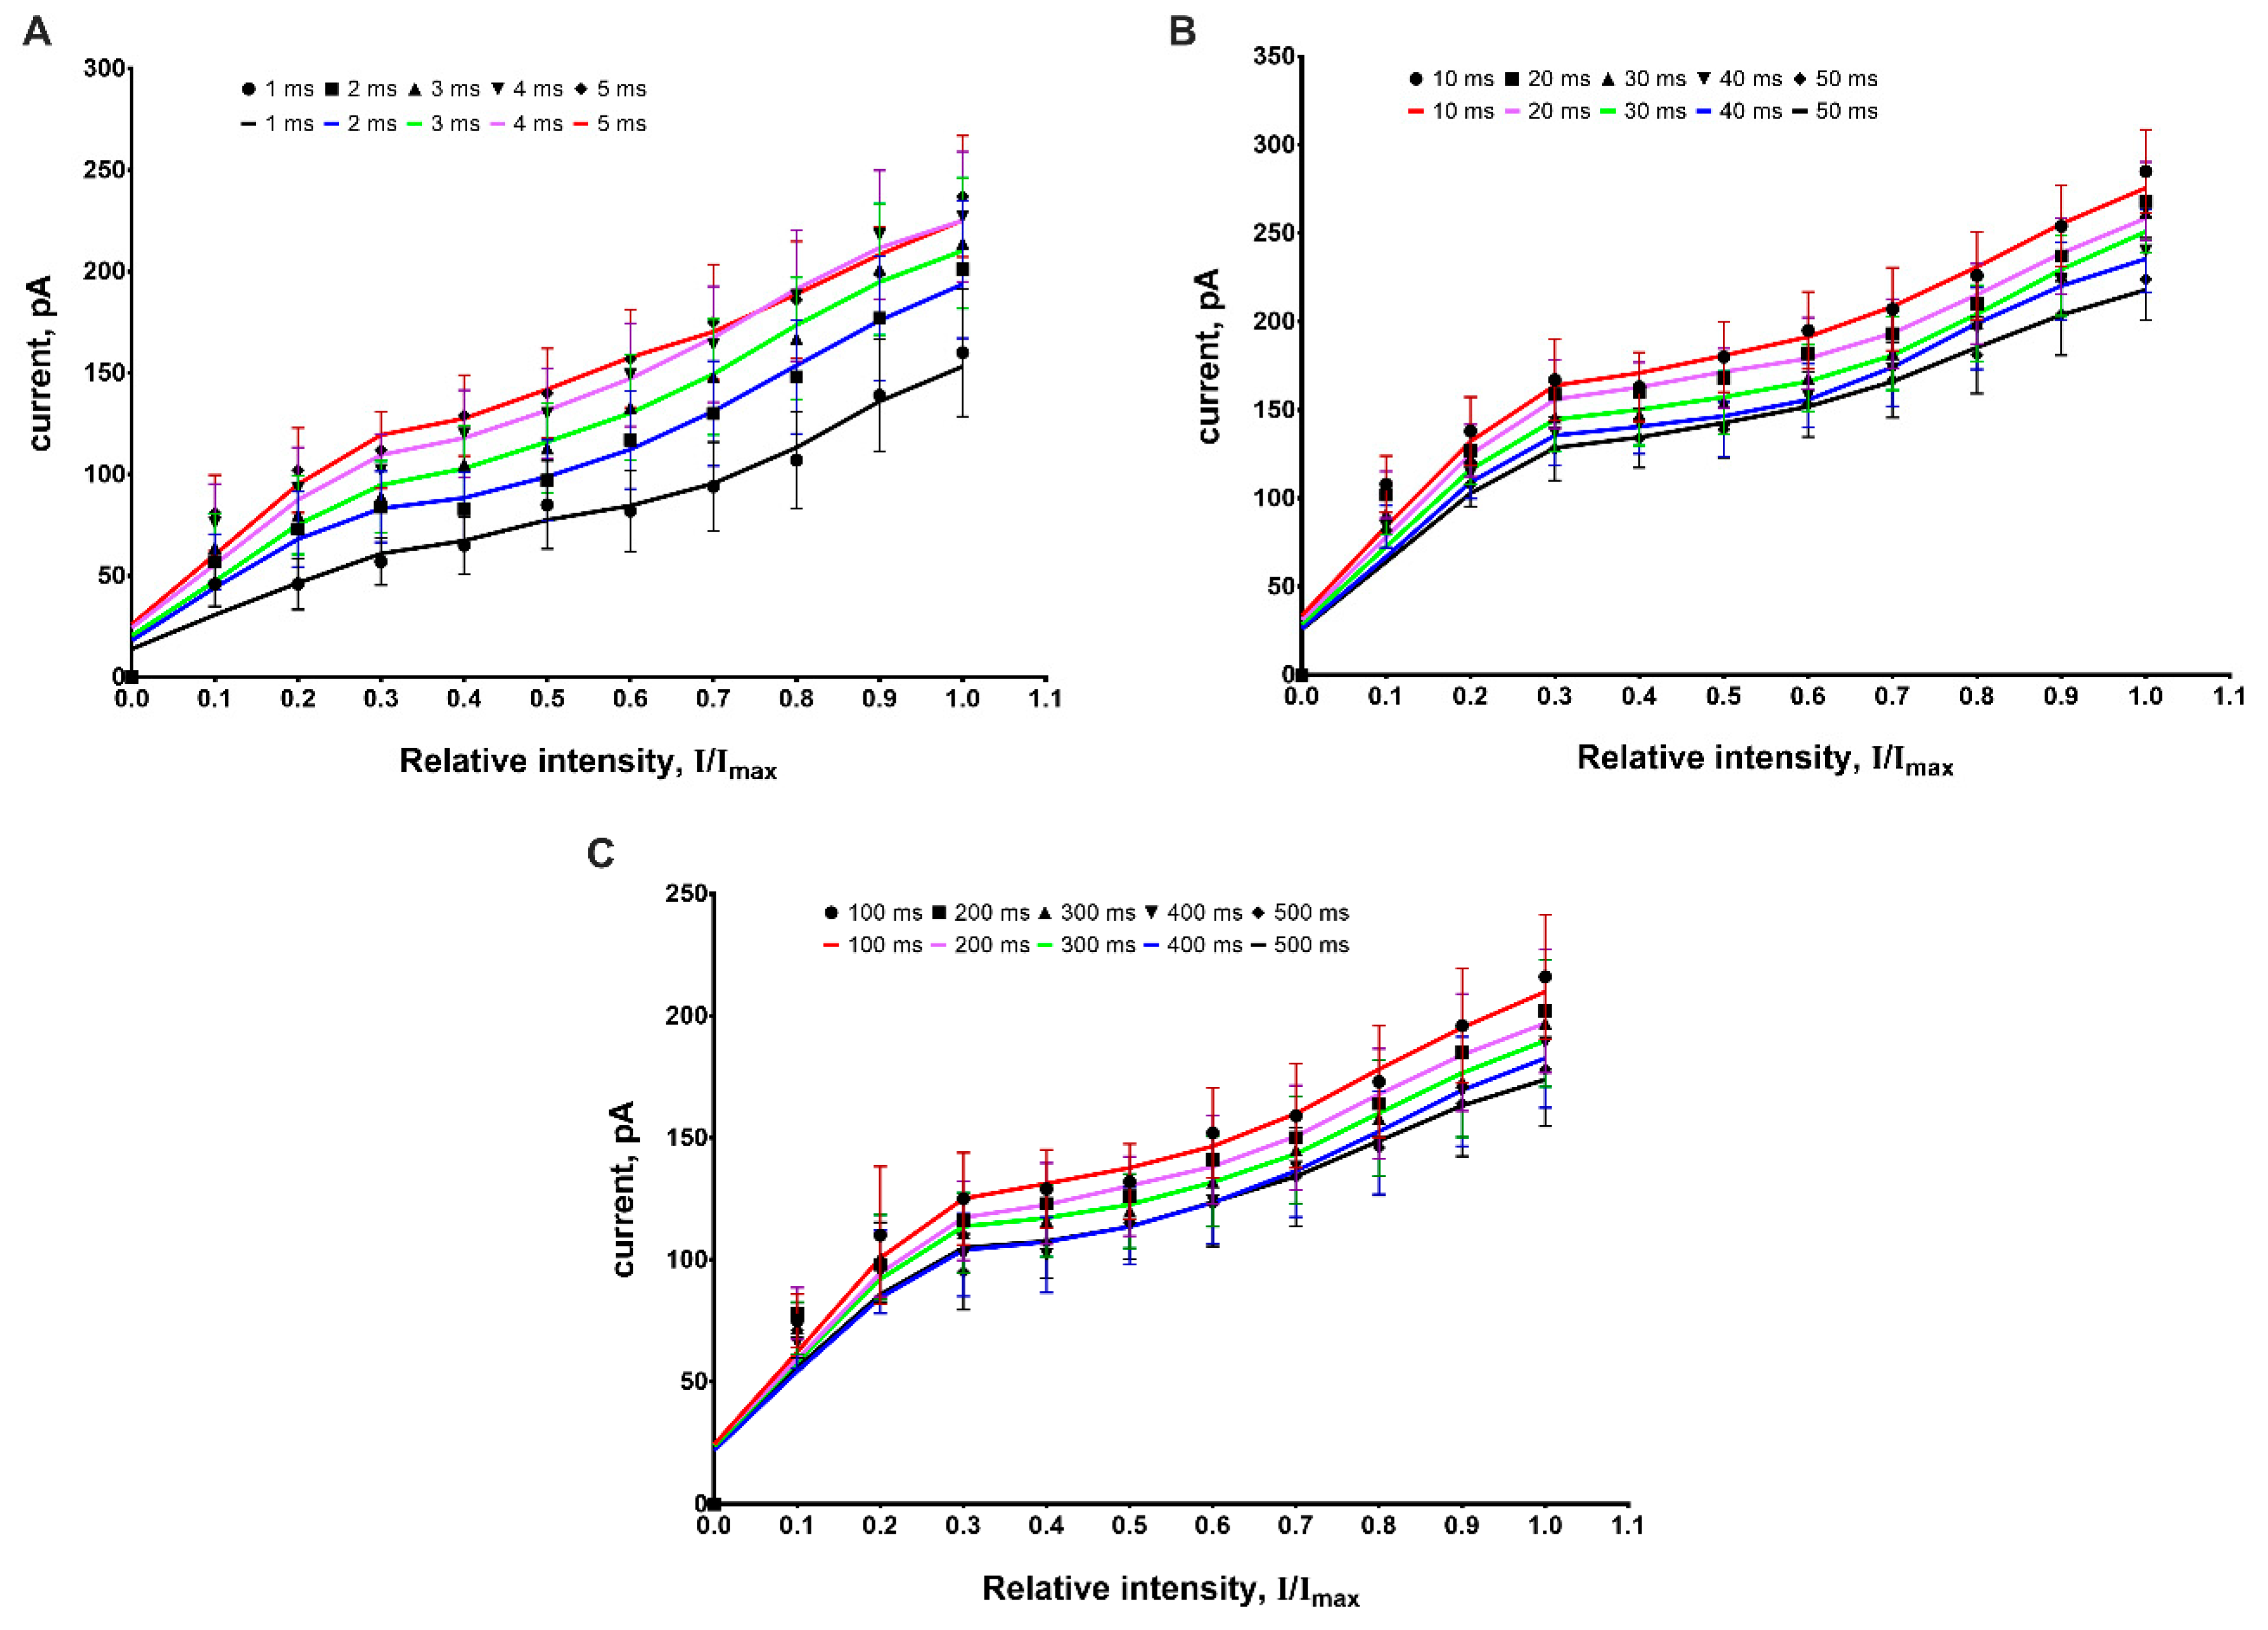
In the next series of experiments, we studied the effect of light intensity on photocurrent amplitude at different light pulse durations.
The obtained curves (
Figure 8) demonstrate a mostly linear dependency that is closed to the generation of sodium currents [
28].
The obtained dependency of photocurrent amplitude on light intensity corresponds with previously published data [
23].
4. Discussion
In this study, we analyzed a range of ChR2 stimulation conditions in experiments with primary hippocampal cultures.
We have determined an optimal frequency of light stimuli for generating APs in the current-clamp recording configuration. The optimal frequency range was between 1–5 Hz. Stimulation with frequencies less that 1 Hz was insufficient to generate APs, and stimulation with frequencies over 5 Hz results in the loss of fidelity of responses.
We have observed that the amplitude of ChR2 currents depends non-linearly (right-skewed bell-shaped curve) on the pulse duration. ChR2 photocurrent amplitudes were stable in the range of 10–30 ms, however, at low (1–5 ms) and large (100–500 ms) pulse duration values, the amplitudes changed in an almost stochastic manner (
Figure 2).
Amplitude differences at low (1–5 ms) values of pulse duration are presumably explained due the fact that ChR2 only reaches the
O1 state and cannot change to
O2 with maximum bandwidth. At the same time, the observed amplitude differences at large pulse durations are explained due to the desensitization and degradation of ChR2 and the
P4 state [
7]. Thus, we can conclude that the optimal interval of light stimuli is in the range of 10–30 ms.
The relationship between the photocurrent amplitude and the intensity of the light stimulus can be explained by the fact that increasing intensity leads to an increase of O2 channel state duration. At intensities above 35 mW mm−2, the amplitude of the photocurrent of ChR2 may decrease; this assumption needs further research.
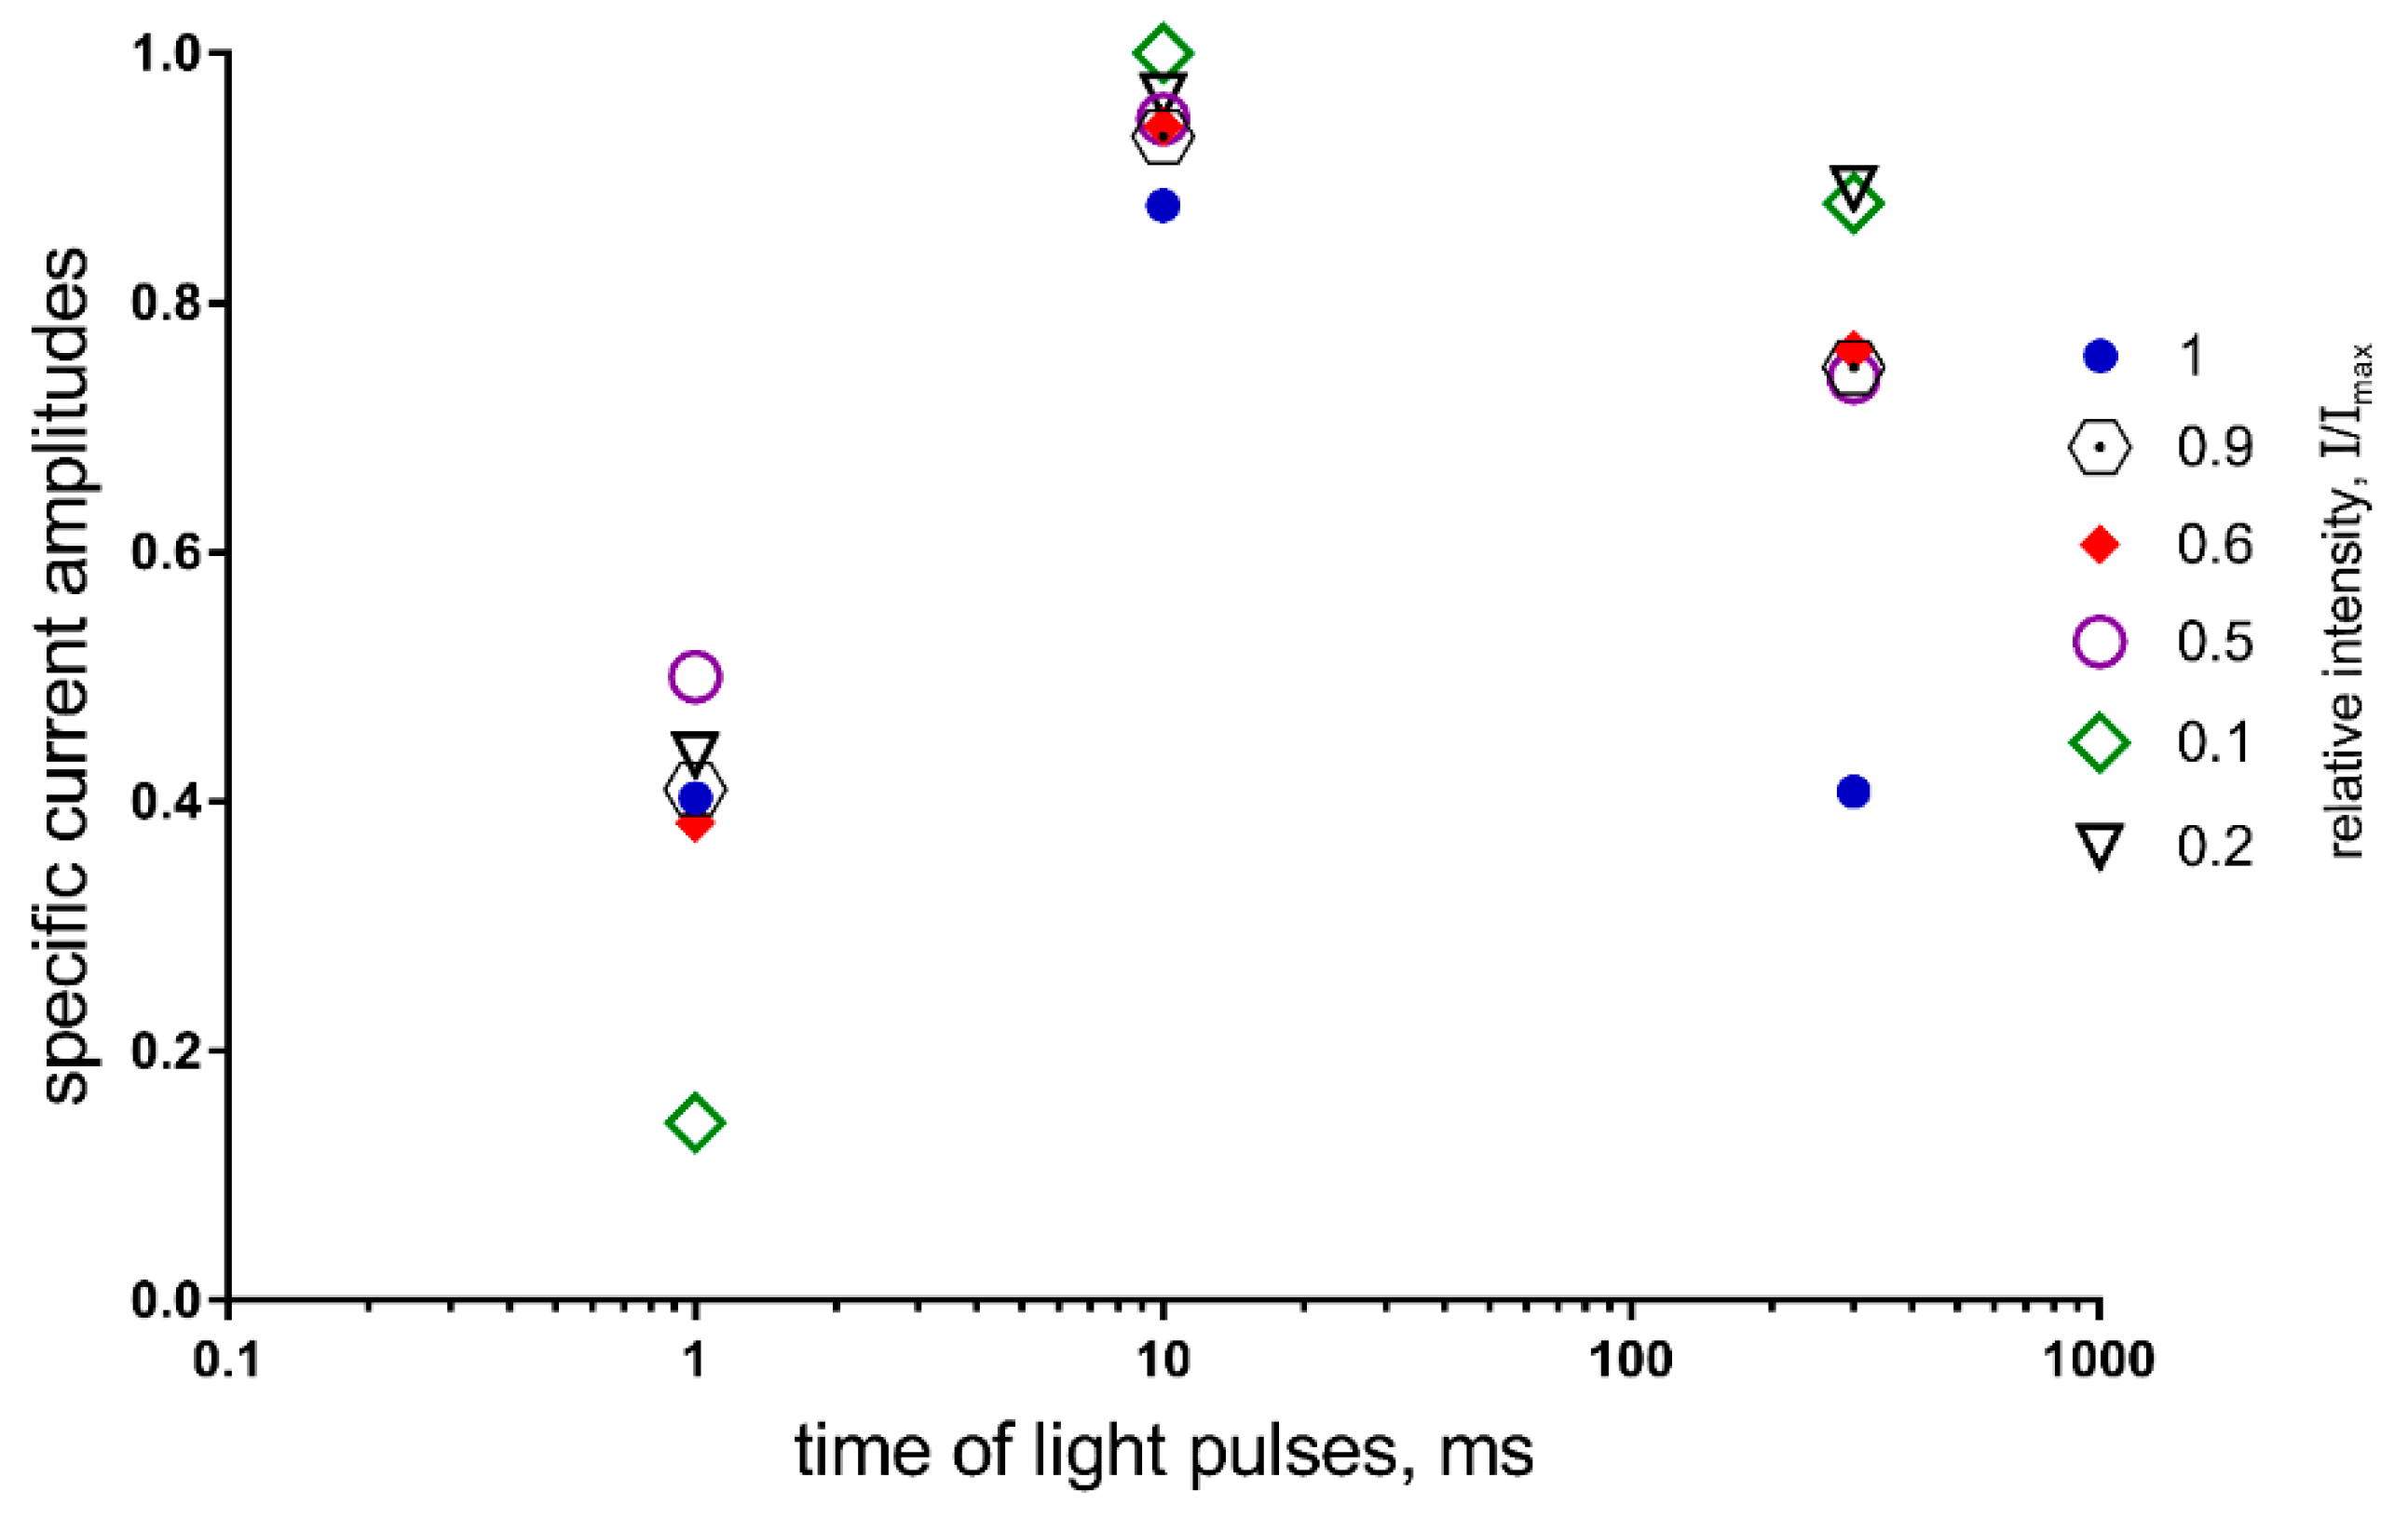
Thus, we found that the following parameters of light stimulation: frequency (F) = 1–5 Hz, t = 10–30 ms, I ≤ I
max are optimal for multiple light stimulation, i.e., the activity of neurons expressing ChR2 will be stable throughout the stimulation period. This is also shown in
Figure 9.
Figure 9 demonstrates the cumulative effect of duration and intensity on the activity of neurons expressing ChR2. Thus, the photocurrent amplitude is almost constant for the pulse duration, which is equal to 10 ms in the full range of intensities, while there is a wide variation of the amplitude values at other durations (1 ms and 300 ms) and intensities.

 ,
, 


