A Brunnstrom Stage Evaluation System with Fuzzy-Accelerometer

1
Department of Electronic Engineering, National Kaohsiung University of Sciences and Technology, Kaohsiung City 80778, Taiwan
2
Ph.D Program in Biomedical Engineering, Kaohsiung Medical University, Kaohsiung City 80708, Taiwan
3
Department of Electrical Engineering, National Cheng Kung University, Tainan City 70101, Taiwan
*
Author to whom correspondence should be addressed.
Appl. Sci. 2019, 9(18), 3718; https://doi.org/10.3390/app9183718
Submission received: 29 June 2019
/
Revised: 23 August 2019
/
Accepted: 28 August 2019
/
Published: 6 September 2019
(This article belongs to the Special Issue Intelligent System Innovation)
Abstract
:Advances in medical care has reduced the rate of mortality from strokes, but the incidence of stroke has remained stable while the incidence of ministrokes has increased. Most stroke victims require long-term care, imposing a heavy financial and emotional burden on families while incurring a heavy cost to society. Thus, strokes are a key issue in the context of health care in Taiwan. This paper proposes using VBA (Visual Basic for Applications) to build a system for assessing Brunnstrom stages based on the observation of several obvious rehabilitation features The system calculates features for accelerometer readings, which are then used as input parameters for a fuzzy algorithm to obtain the Brunnstrom action level. Experimental results show the proposed approach effectively assesses Brunnstrom level, and that the approach can be used to assist physical therapists in performing longitudinal assessments of stroke victim progress, thus improving evaluation efficiency.
1. Introduction
In recent years, the World Health Organization (WHO) has repeatedly issued a “1 in 6” warning referring to the likelihood that 1 in 6 people can expect to suffer a stroke sometime during their lifetime, regardless of age, gender or ethnicity [1]. Stroke incidents not only entail high medical costs for acute treatment proximate to the stroke incident, but also require intensive, long-term physical rehabilitation to restore mobility, resulting in huge costs to families and society at large. Limited human resources create an important need for, information technology and sensing devices that can be used to monitor and evaluate the rehabilitation status of hemiplegia patients.
During WWII, Signe Brunnstrom noted that hemiplegia patients seem to follow a stereotyped recovery process. Between 1954 and 1956, observation of 100 hemiplegia patients was used to divide the recovery process into seven distinct periods, referred to as Brunnstrom Stages [2], but a clear evaluation model was lacking. Later, in 1974, Leanne M. LaVigne established a clear stage evaluation model based on Brunnstrom’s staging test, and made suggestions for appropriate treatment, and these methods are still used by clinicians today as the basis for diagnosis of degree of hemiplegia [3]. To develop an appropriate rehabilitation strategy, physicians need to first evaluate the current degree of hemiplegia, using methods including the Brunnstrom Approach, the Fugl-Meyer Assessment (FMA) [4] and the Ueda 12-Stage Hemiplegic Function Test [5].
Human body posture recognition is often used in rehabilitation evaluation, sports and film production. The main methods include the use of an Oqus camera, Kinect sensors, and Inertial Measurement Units (IMU). An optical high-speed camera is used to record the movement of reflective markers attached at specific points on the surface of the human body, creating a series of dot trajectory data which describe the movement of each limb. This approach is often used to produce animation or to analyze the movement of athletes [6]. While this measurement method can accurately describe human body movement, it requires data collection equipment to be fixed in space along with significant high-speed computing resources for movement analysis. Somatosensory detectors use an infrared depth camera to capture skeletal images for motion capture and analysis [7,8]. This method does not require the subject to wear sensors, and thus does not impede subject movement. However this approach is relatively expensive, and is subject to limitations imposed by the recording venue and the number of subjects, making it inapplicable to the current case.
With the rapid development of sensing technologies in recent years, inertial sensors have gradually emerged as the mainstream method for capturing motion signals, including accelerometers, gyroscopes, and magnetic sensors. Of these, accelerometers provide good performance with low power consumption and low cost [9]. In addition, the development of Micro Electro Mechanical Systems (MEMS) allows for such sensors to be worn directly in various places on the human body, with data collected, processed and transmitted in real time anywhere and anytime. Acceleration sensors are now widely used in various types of human motion recognition research, including common daily motion activities such as walking [10], running [11], and ascending/descending stairs [12]. Real-time human motion recognition is useful for fall detection in home care research [13]. Machine learning techniques can be applied to longitudinal recording of human motion patterns to allow for more precise classification and recognition of various movement types [14]. Some studies have focused on the evaluation of hemiplegia patients [15,16] using machine learning techniques to train samples for the development of classification and evaluation models. While such approaches can provide highly accurate identification results, they require very large learning samples and complex mathematical operations. While fuzzy theory [17] is a relatively simple experience algorithm, it does not require a large sample set, and can be adjusted according to the experience of the physical therapist. Although the Brunnstrom sub-stages are still in use today, the evaluation method still needs to be modified according to the region in question. Applying machine learning techniques will require retraining with a large sample set. In addition, fuzzy calculations only require parameters adjustment to meet the requirements.
This paper combines the Brunnstrom method with the fuzzy algorithm to obtain more accurately and objectively characterize motion data and analyze the patient’s motion features, thus assisting physical therapists in diagnosis and treatment. Through action analysis, this paper sets 7 main features and performs a two-stage fuzzy assessment. In the first stage, the original accelerometer data for the Flexion and Pronation actions are smoothed using low-pass filtering [18,19], and the features are used as the input parameters for the fuzzy algorithm to calculate the Flexion and Pronation action scores. The second stage uses the Flexion and Pronation outputs as input Fuzzy parameters, and then adds the Lap to Chin action score to calculate a Brunnstrom grade.. For hemiplegia patients, this entails adjusting personalized parameters, such as applying the fuzzy parameters for degree of concealment to improve the training stability. Thus, fuzzy theory provides considerable value for rehabilitation practices.
2. System Development
Brunnstrom Stages are used for evaluation using three actions, as follows: Flexion, pronation and lap to chin (Table 1). These actions and assessed for correctness based on three concepts, as follows: Accuracy, stability and consistency. Accuracy refers to whether the action fulfills the requirements, while stability reflects the arm not bending during the action, and consistency reflects uniformity between the healthy limb and the affected limb. Flexion and Pronation emphasize accuracy and stability based on these three motion characteristics, while Lap to Chin does not require stability and performance is determined as a function of speed. Raw accelerometer data collects seven characteristic values.
Through action analysis, our paper employs a two-stage fuzzy method with seven main features. In the first stage, the original accelerometer data for the Flexion and Pronation actions are smoothed using low-pass filtering [18,19], and the features are used as the input parameters for the fuzzy algorithm to calculate the Flexion and Pronation action scores. The second stage uses the Flexion and Pronation outputs as input parameters, and then adds the Lap to Chin action score to calculate a Brunnstrom grade. The system development is described in detail as following sections.
2.1. Measurement System
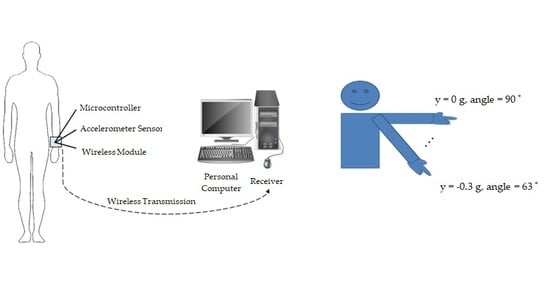
This system is built on an Arduino Nano development board (microcontroller: ATmega328, clock speed: 16 MHz, size: 18 × 45 mm; weight: 7 g), using an acceleration sensor (type MPU-6050, 16 bit A/D converter, size: 21 × 16 mm, range: ±16 g) to measure action acceleration in three dimensions (x,y,z). The analog signal of the obtained acceleration value is transmitted to the development board via an XBee-S2C wireless communication module (indoor/urban: 60 m; outdoor RF line-of-sight, RF data rate: 250 Kbps) to the Communication Port (COM Port) for subsequent analysis. Figure 1 shows the measuring device of the experimental system mounted on the user’s wrist.
2.2. Accelerometer Data Processing
Table 1 shows the features s and descriptions of the three actions in the experiment. When the Flexion action is performed, the y-axis values will clearly rise and fall, producing a waveform-like motion as shown in Figure 2. The maximum value (peak) is scaled and averaged to produce the first features value FAA (Flexion Average Angle), and Flexion Angle Standard Deviation (FASD) is the standard deviation of the obtained peak value. Finally, Flexion Lateral Stability (FLS) calculates the standard deviation based on the x-axis data for the Flexion. If the Flexion is performed with high stability, the x-axis data will show little variability. However, high variability in the x-axis will also result in parameter value variability in the z-axis during action performance. However, given that the Flexion action is mainly performed in the vertical and horizontal axes, it is not discussed in this experiment. Pronation is similar to Flexion in that it uses z-axis data to obtain the average angle, where the PAA (Pronation Average Angle) and the PASD (Pronation Angle Standard Deviation) are used to calculate the standard deviation of the peak angle, while standard deviation of the PVS (Pronation Vertical Stability) is calculated using y-axis data. Thus a stable pronation action will result in minimal y-axis variability, and vice versa. Pronation will also produce x-axis variability, but the action’s before and after position are mostly level, and thus is not discussed here. Lap to Chin variability is based on inconsistency between the patient’s affected and healthy sides, and neither accuracy nor stability are considered, thus the z-axis data can be taken as the action peak.
We first tested the simulation data for different levels and conditions, confirming that the simulation algorithm can correctly classify the various data as belonging to ST2–ST6 (stage 2 to stage 6) and Healthy. ST1(stage 1) is omitted because it is defined by Brunnstrom as “Flaccidity” or lack of movement and thus cannot be detected by use of the accelerometer. The definition of ST2–ST6 are list in Table 2.
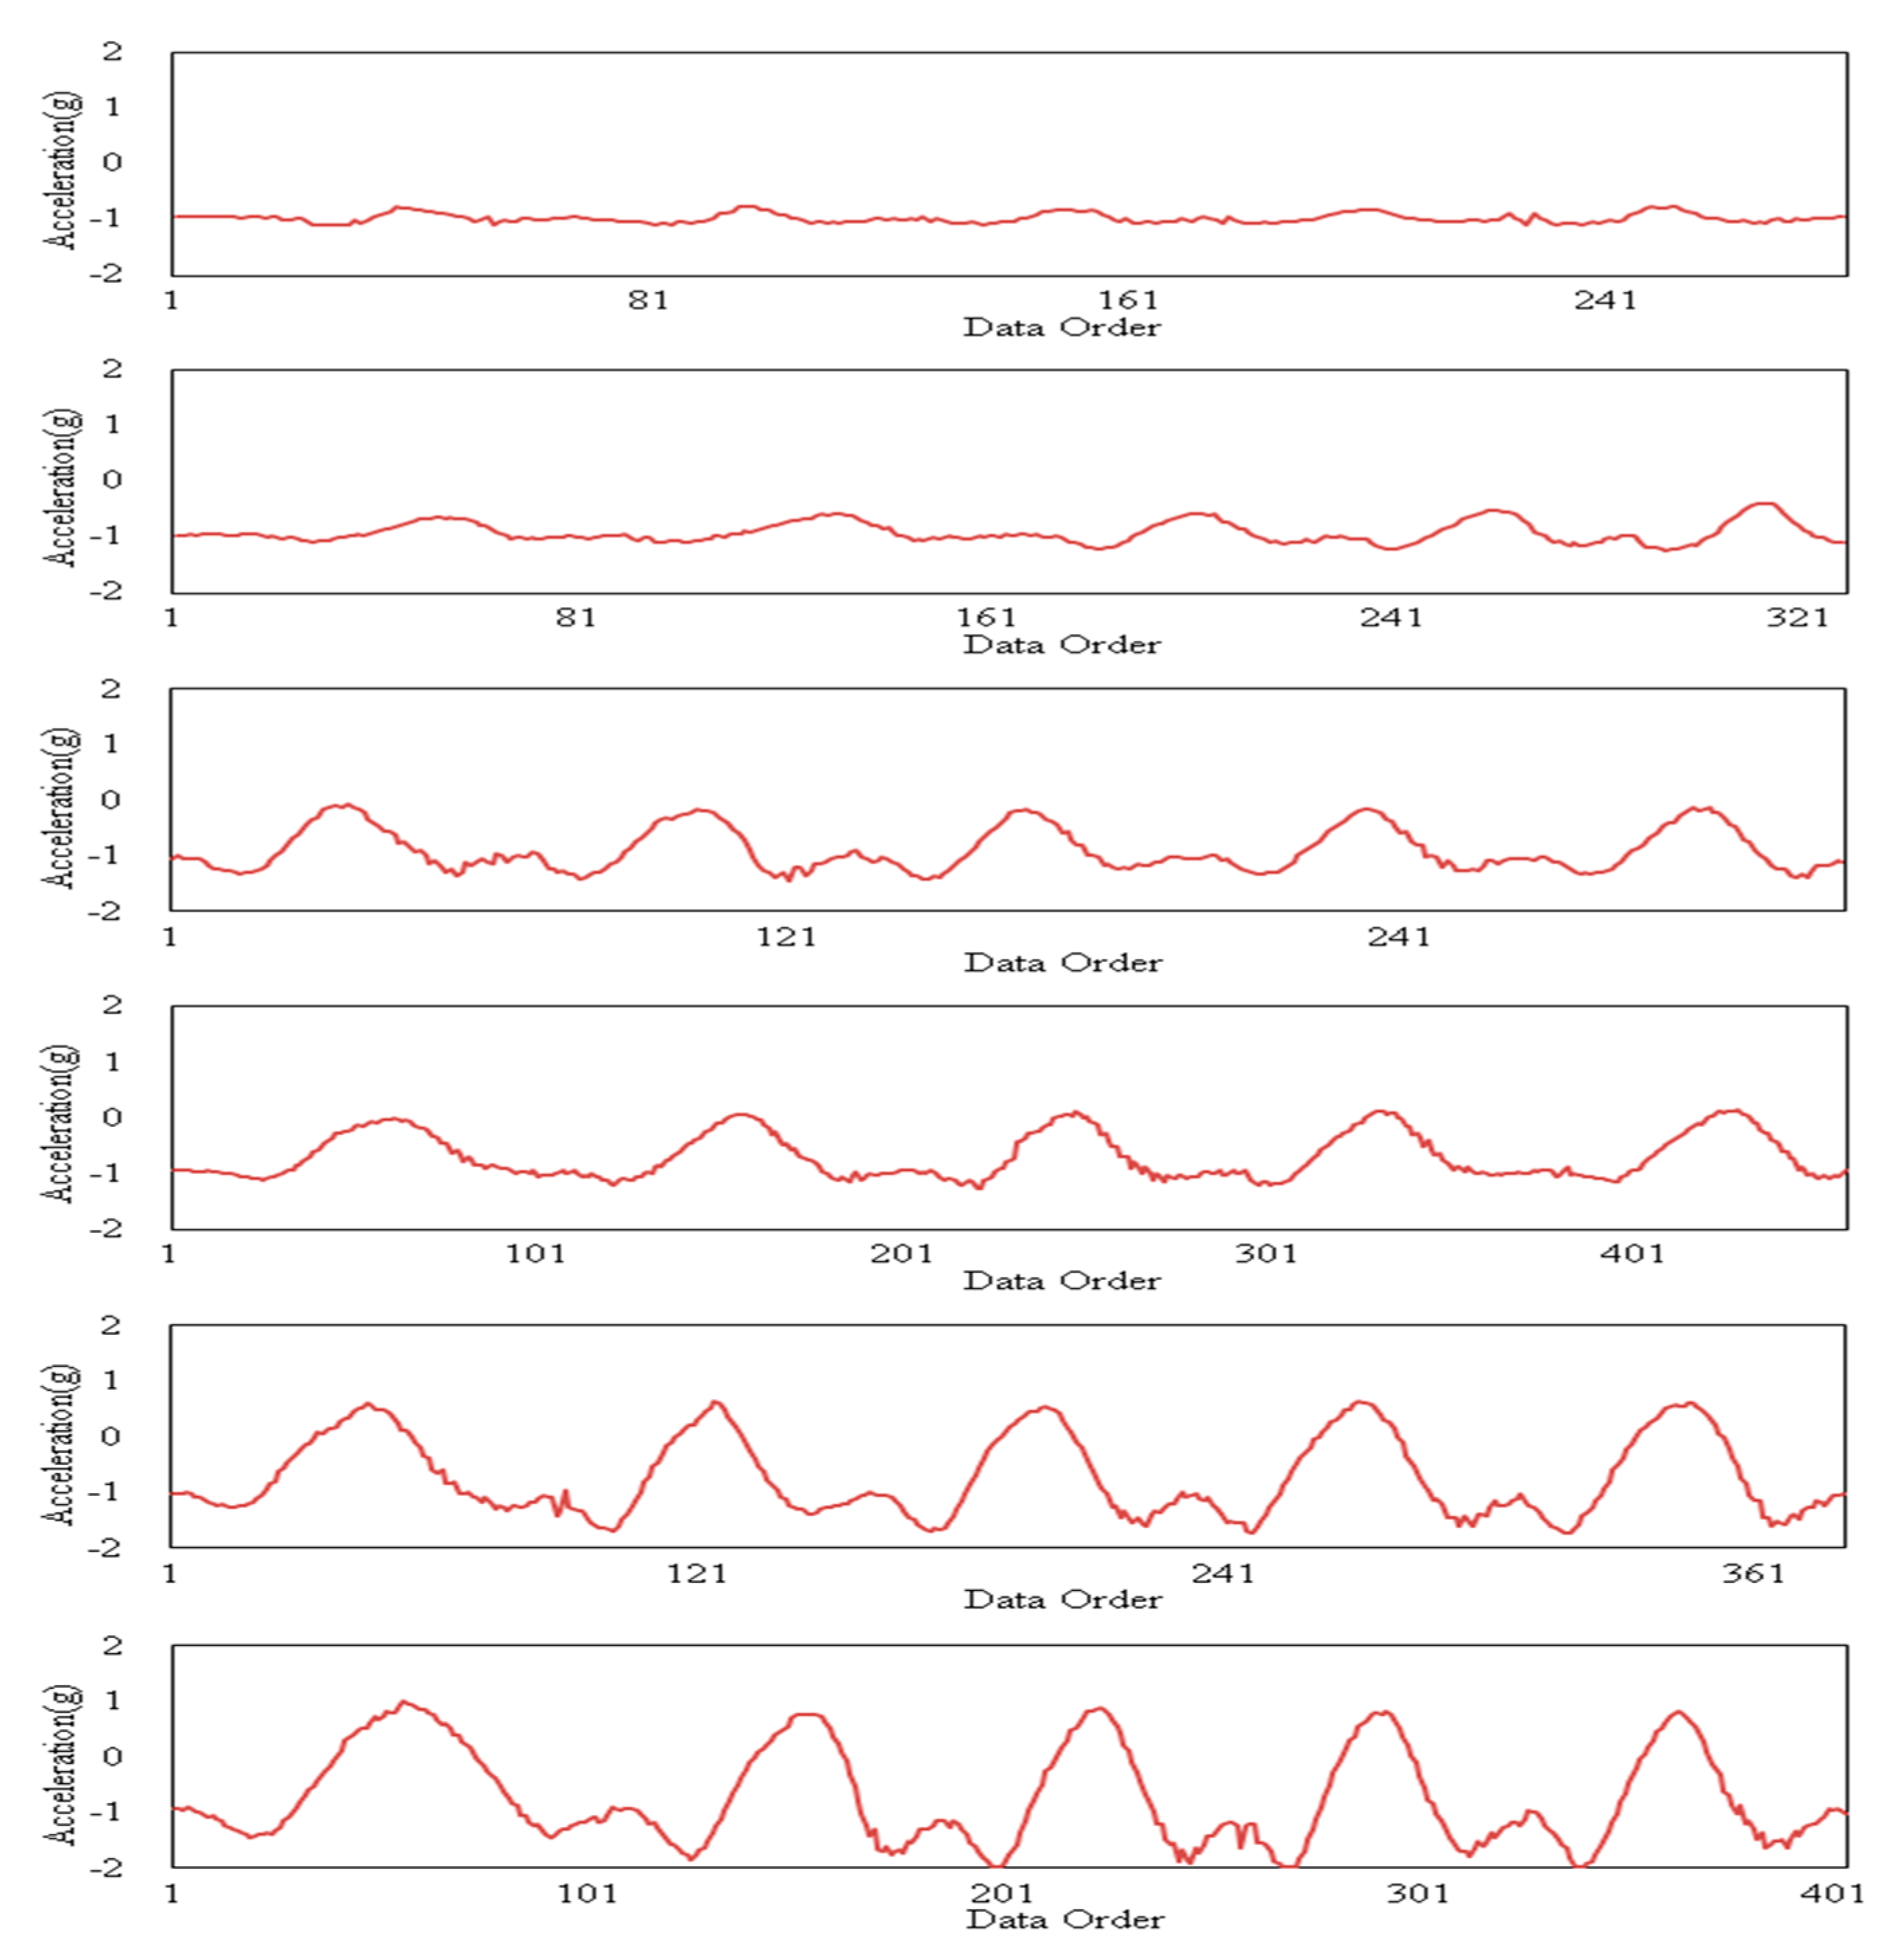
Figure 2 shows the raw acceleration data of ST2–ST6 along the y-axis for the Flexion action performed by the health limb. The horizontal access shows a data sequence with 20 data points per second, and the acceleration value of the vertical axis is (, ), thus the time required to perform the operation differs with stage, so Figure 2 extracts the acceleration signal for five movements.
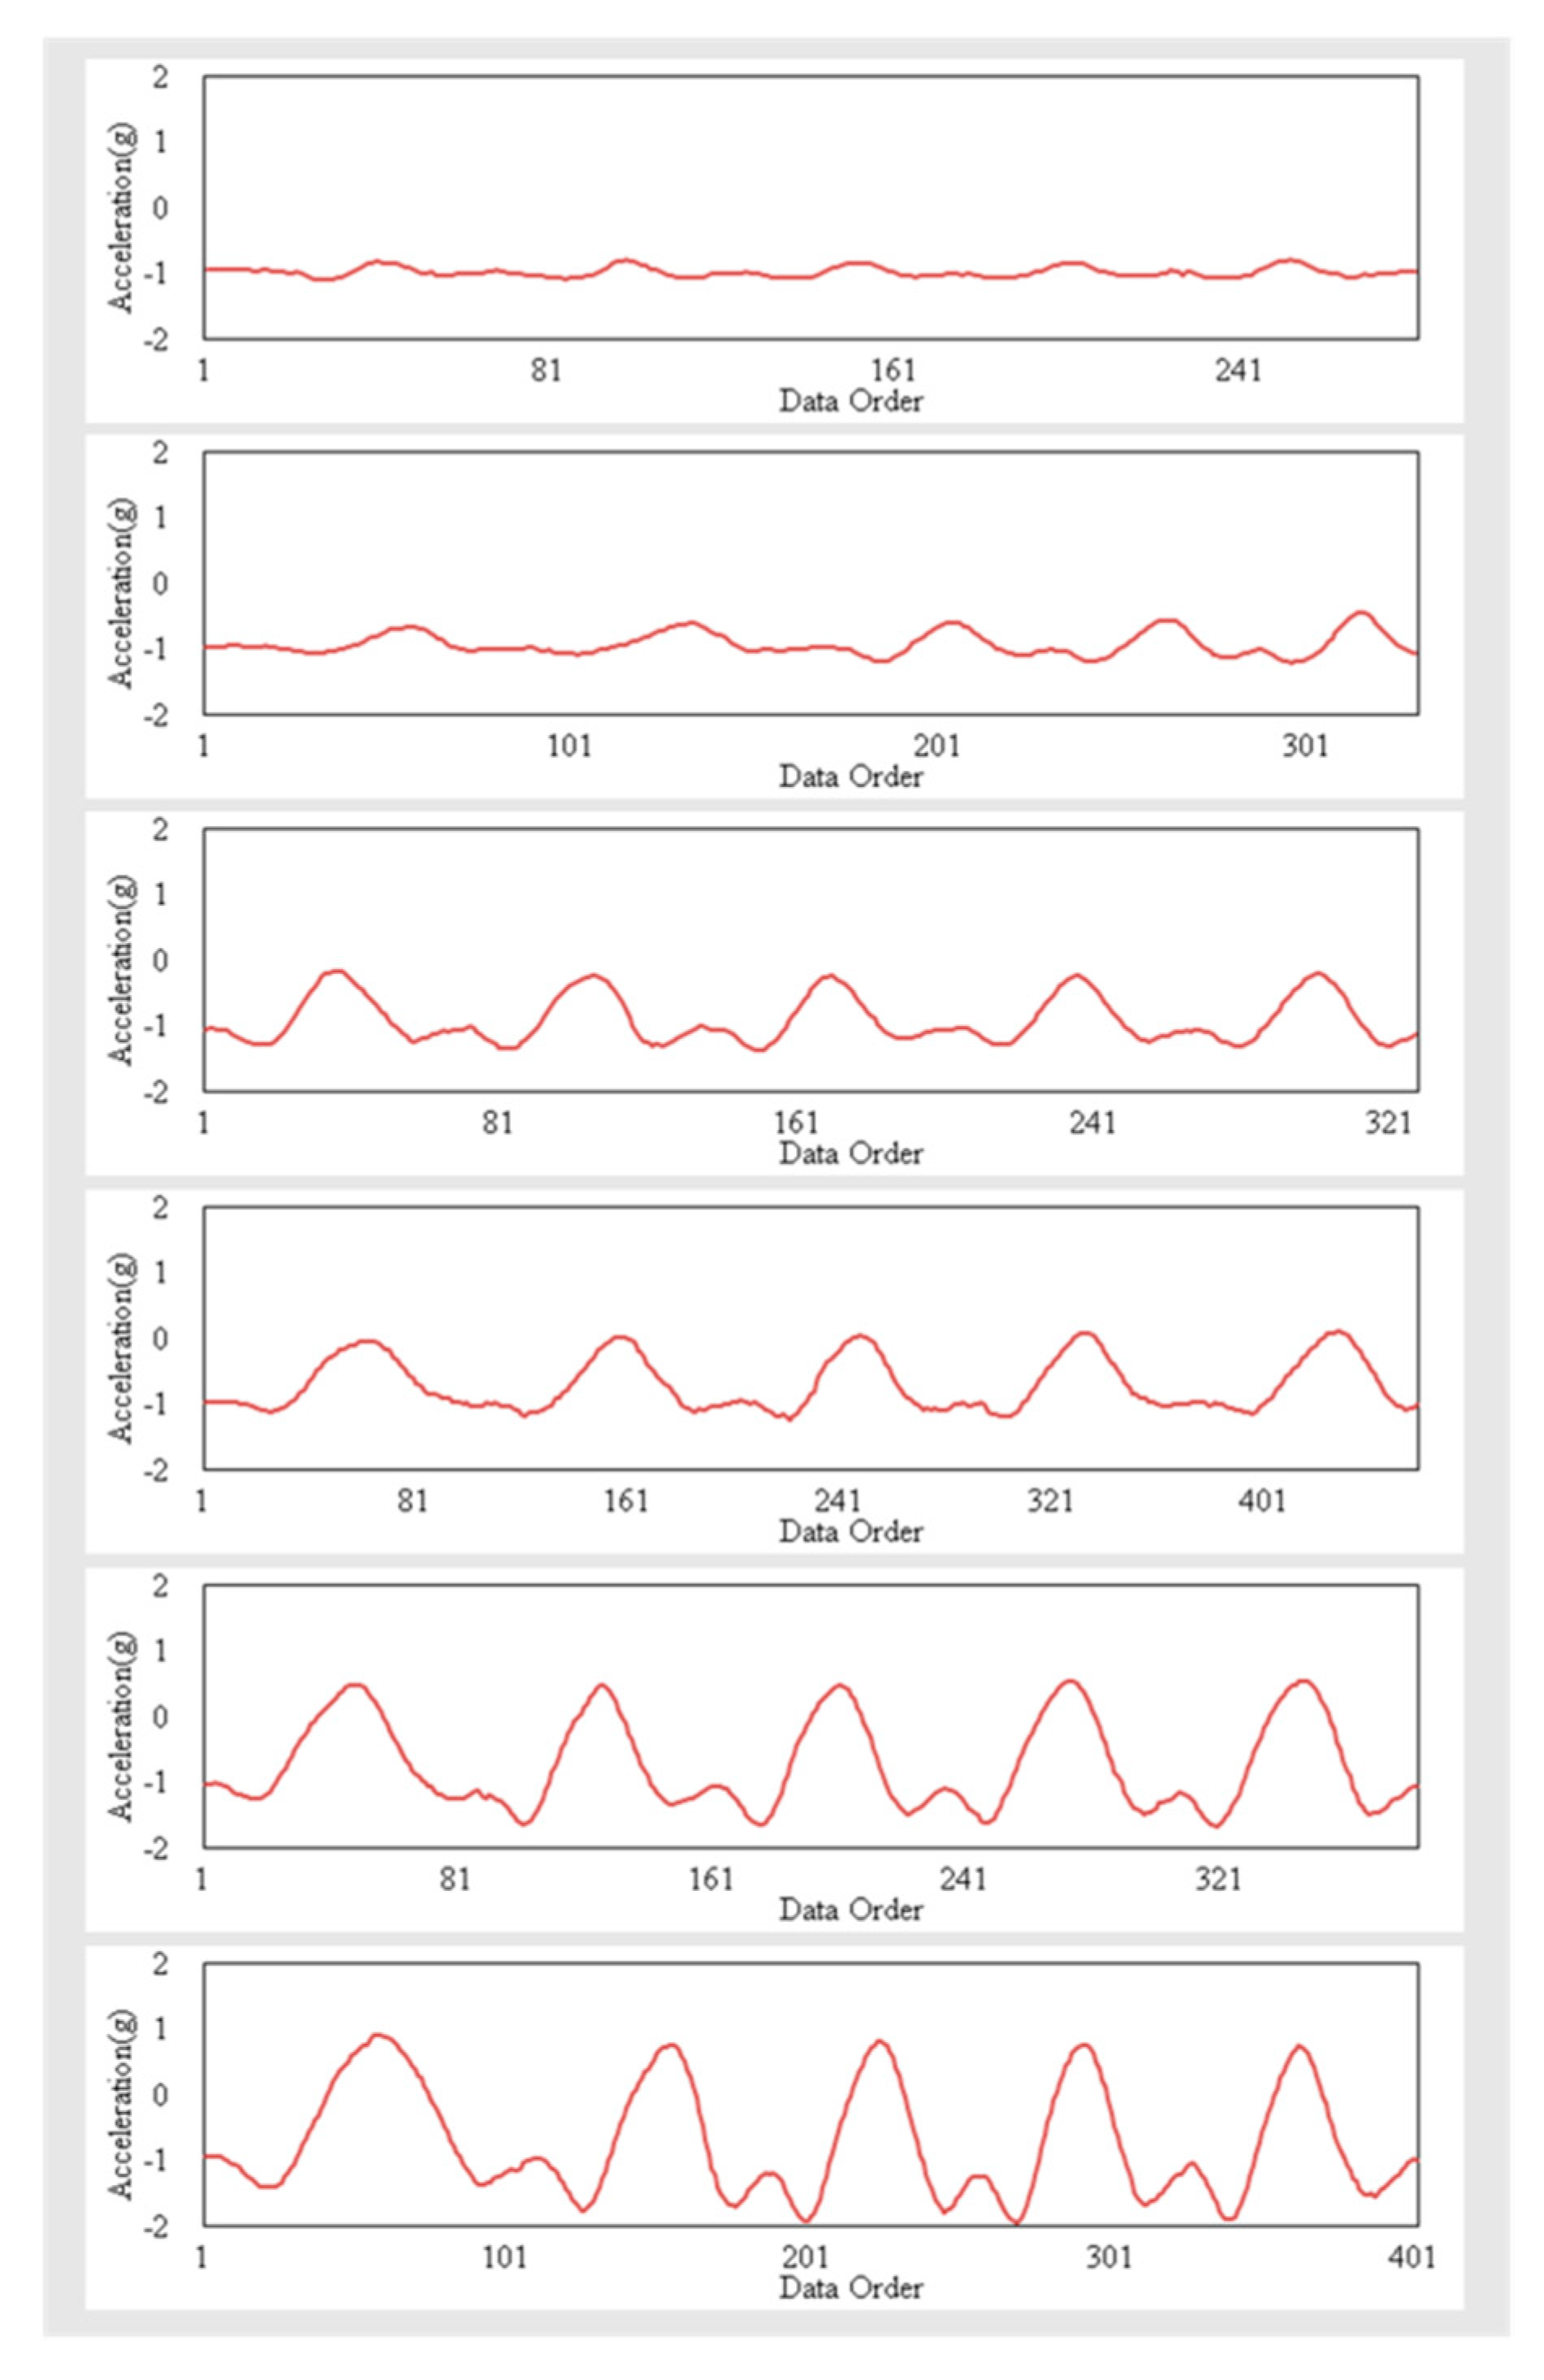
From Figure 2 we can see that some micro-vibrations produced a jagged signal during the action, causing system errors when identifying feature values. Therefore, this paper used low-pass filtering to filter out noise prior to identification. The characteristic values of each action are shown in Equation (1) [20]. Figure 3 shows the filtered acceleration value, where the original sawtooth signal is now smoothed.
where is the filtered data, is the weighting degree between 0–1, is the previous filtered data, and is the original data. In this paper, parameter is set to 0.4. Repeated experiment finds that excessively high settings resulted in a poor filtering effect, resulting in identification errors for feature values. Excessively low settings filter out too much, producing feature values inconsistent with the original data, thus the parameter value of 0.4 best meets system requirements.
2.3. Features Analysis
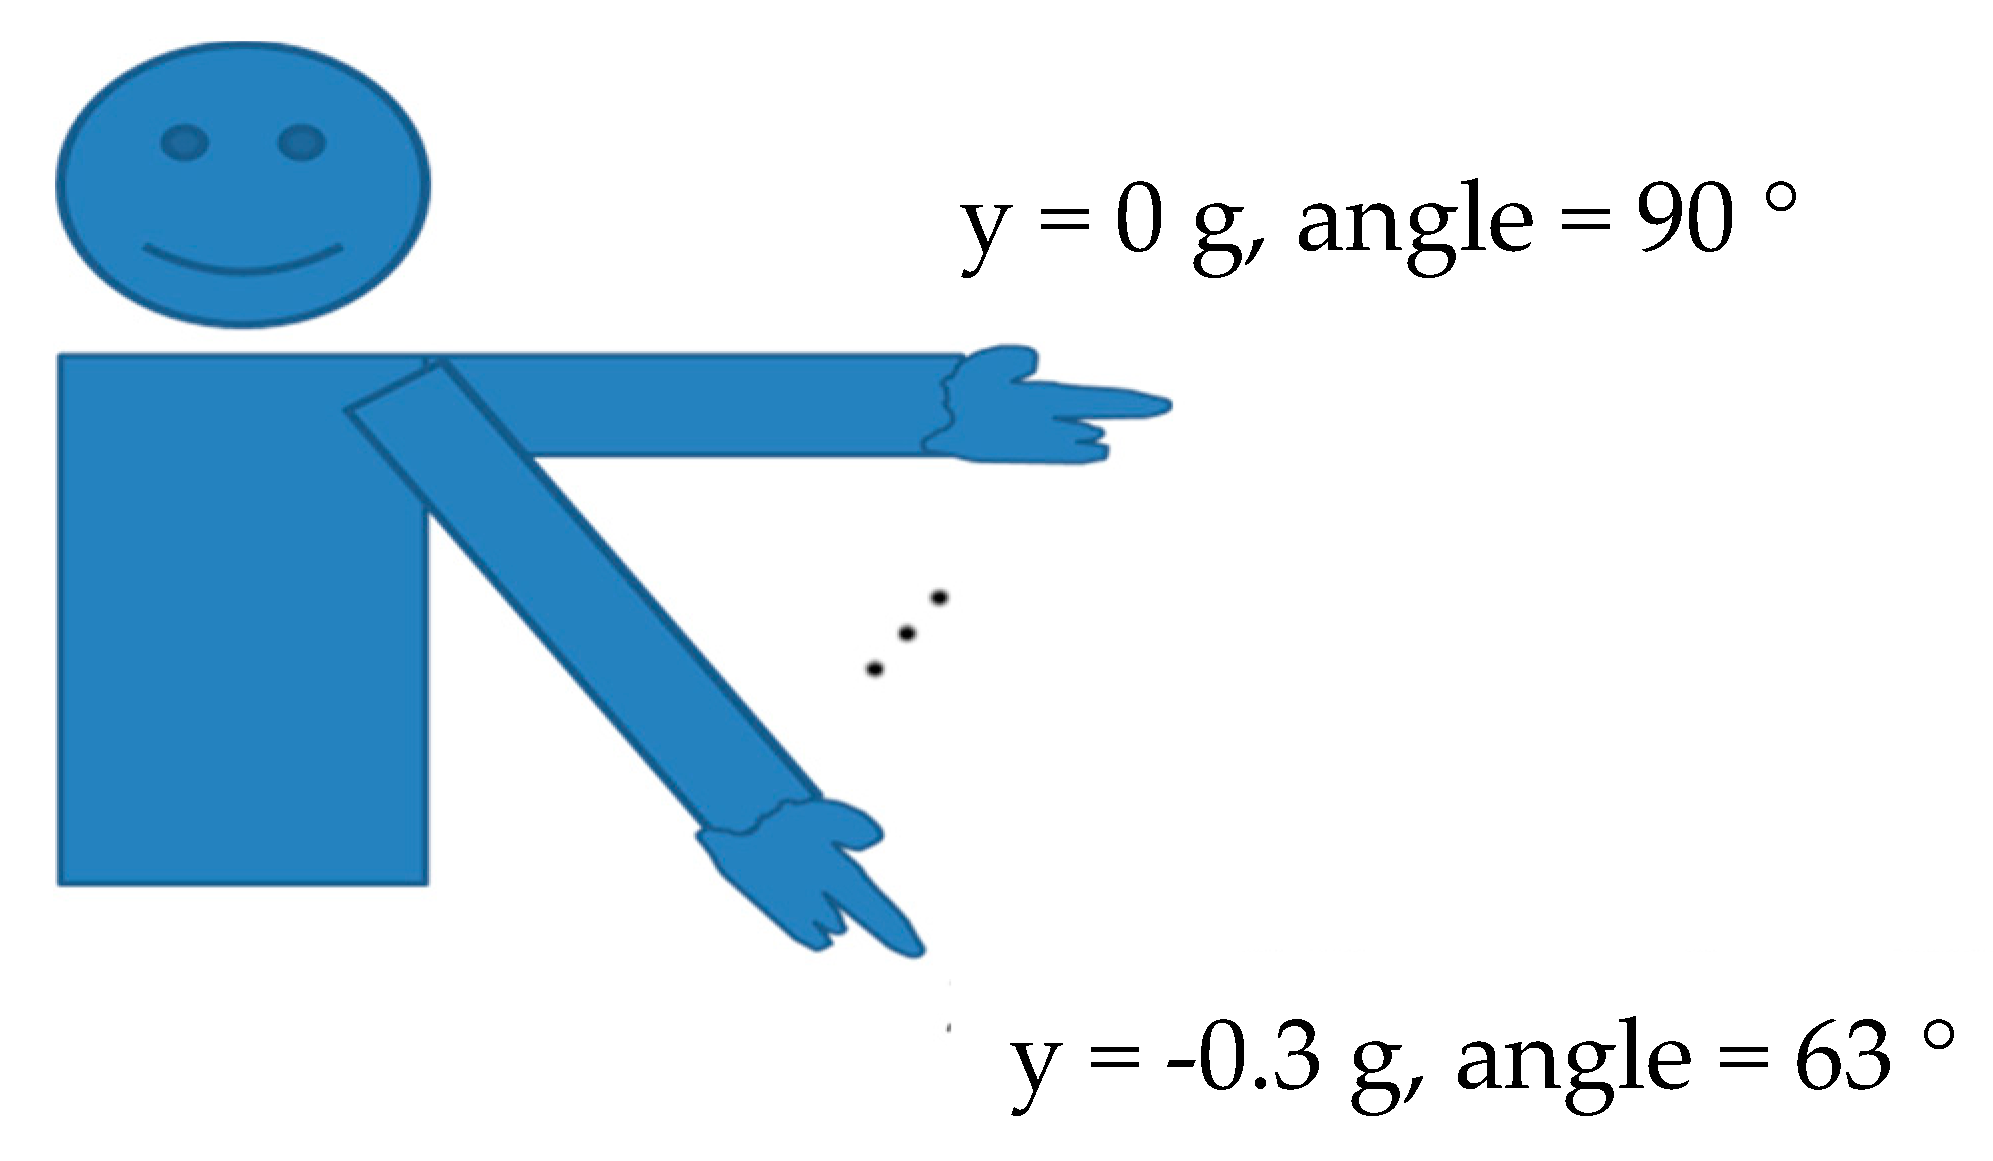
Figure 3 shows that, during the Flexion action, the acceleration along the y-axis is about −1 g during preparation, and the acceleration along the y-axis increases as the arm begins to rise and then decreases as the arm begins to fall. Figure 3 shows that each action has a maximum (peak) value, and this peak is used in Equation (2) to calculate the angle, which is then averaged as shown in Figure 4. As shown in the diagram of Equation (2), rather than taking the maximum or minimum angle of the user’s motion, averaging the angles provides a more objective representation of the angle of user motion, because there may be discrepancies between the angle of each action, thus the average angle better matches the value of a specific level.
where
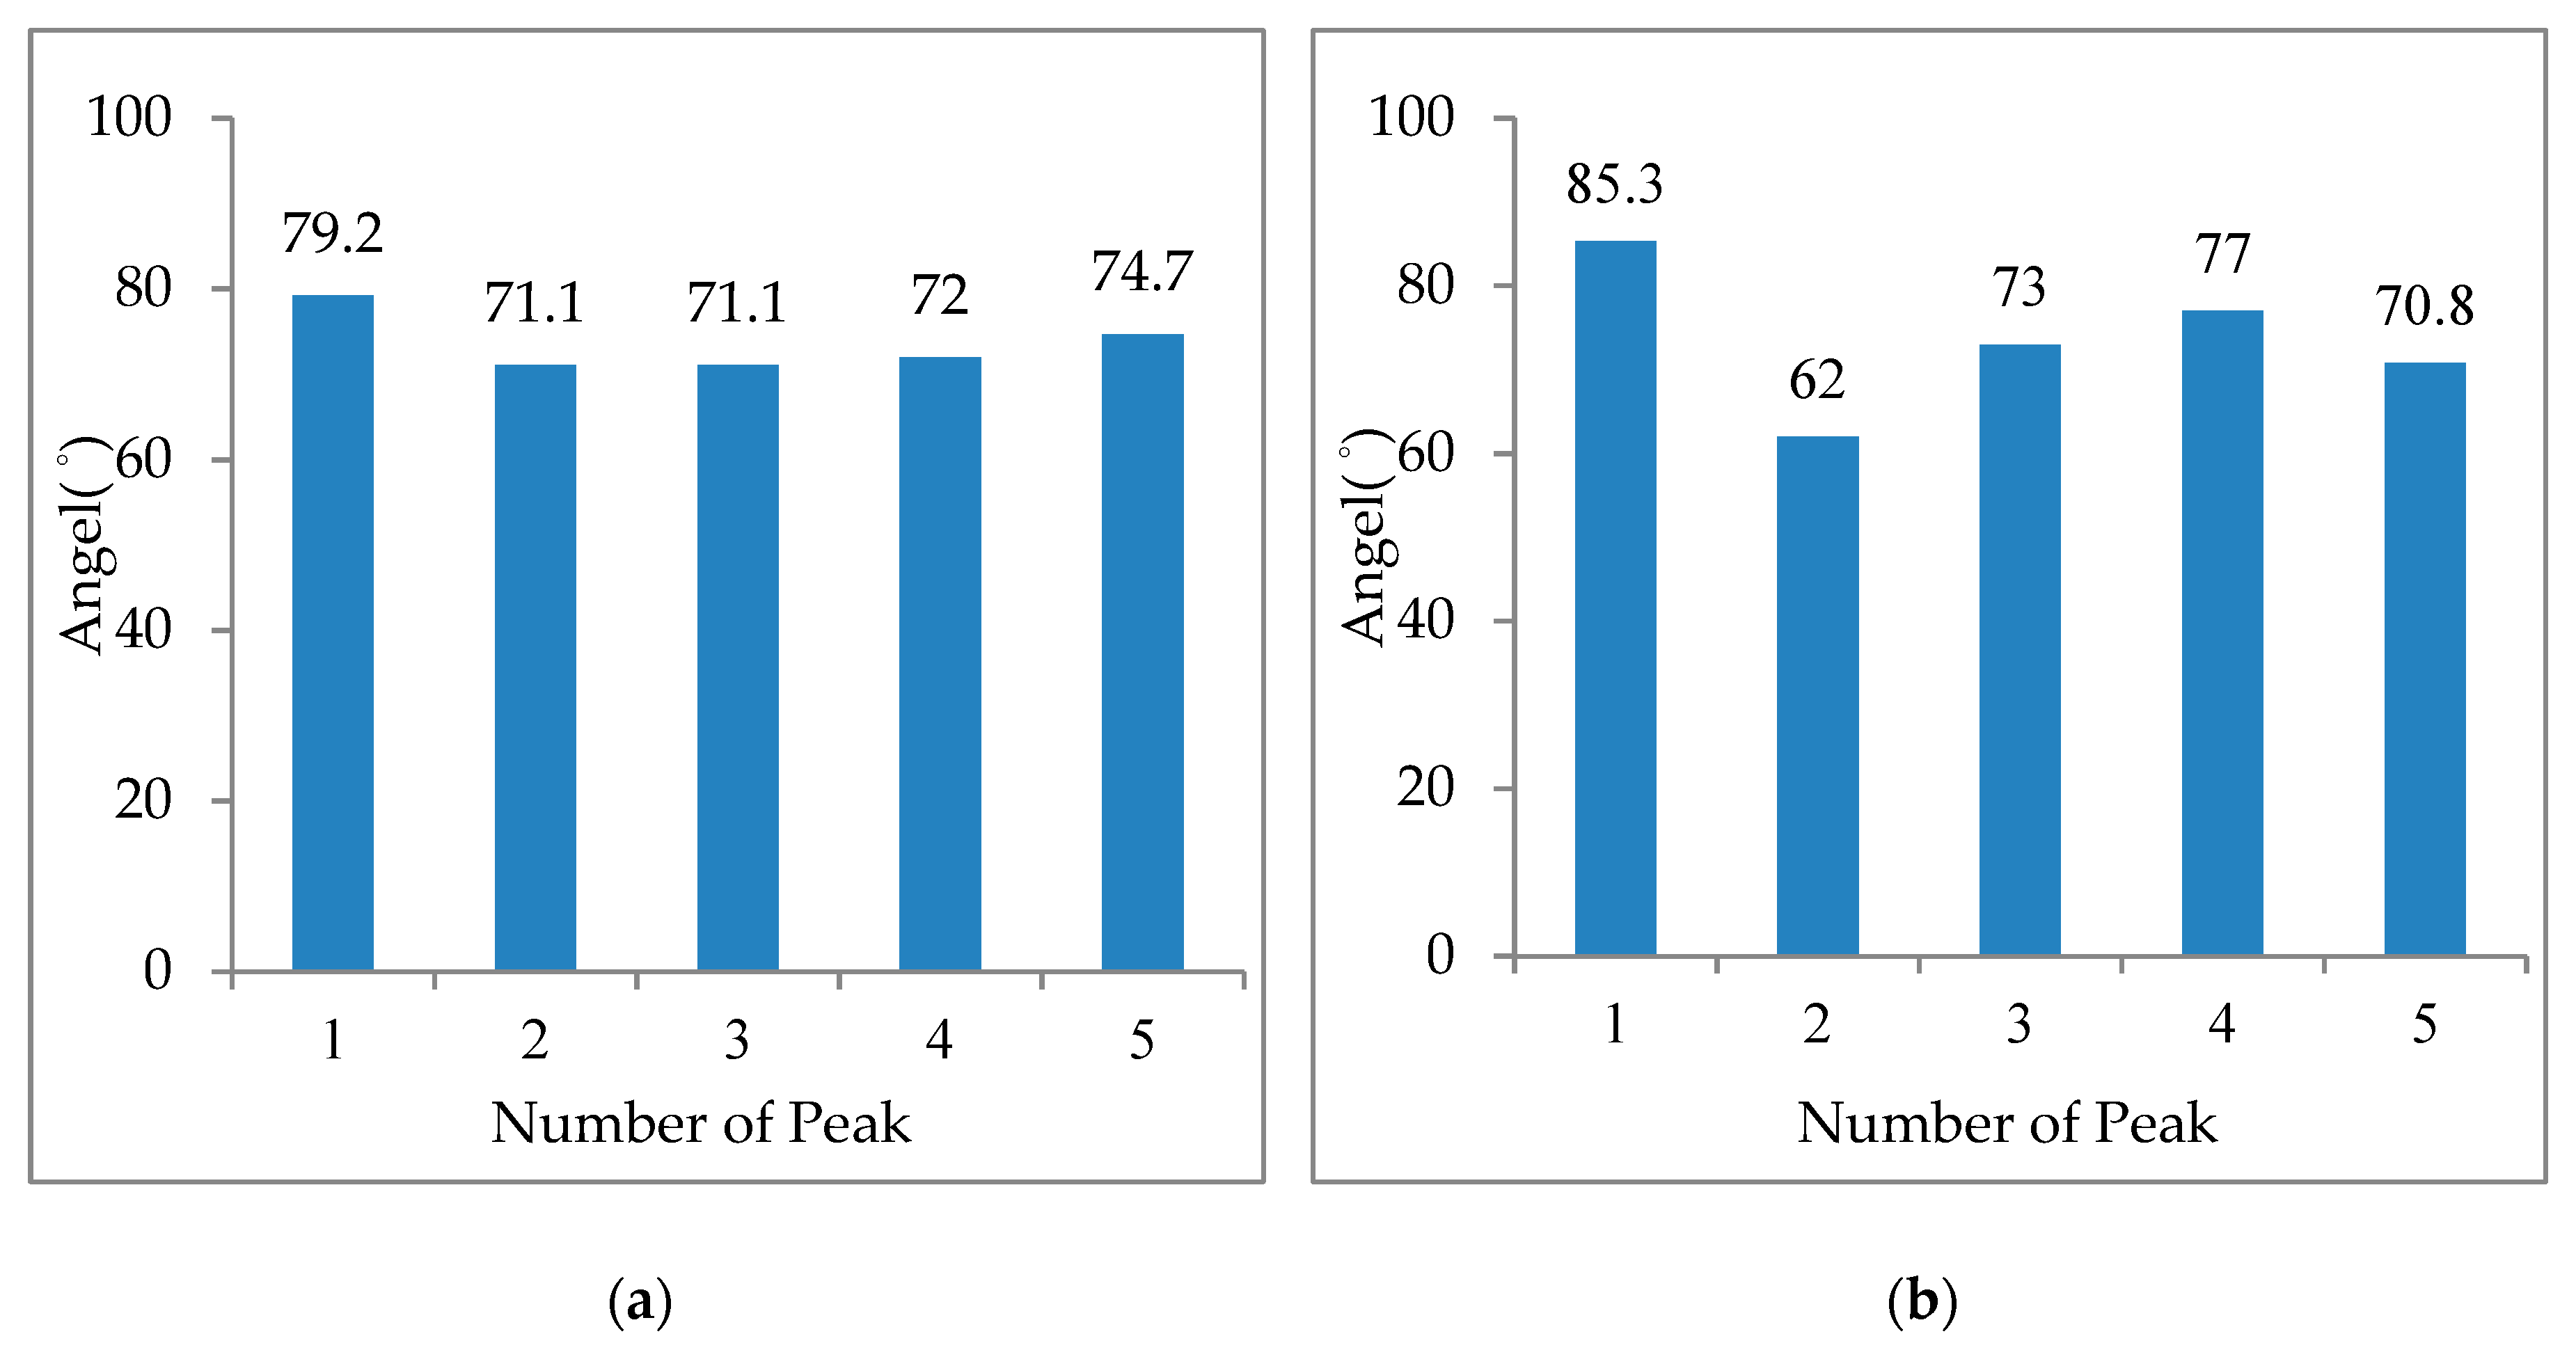
Figure 5a shows the results of the peaks for the ST4 acceleration data in Figure 3. Since ST4 falls between ST3 and ST5, the signal easily falls below or above the stage, thus ST4 is used as an example. Although the average angle more easily fits a specific level, the average angle disregards the peak levels for each action, and thus the precise angle of each action is unknown. It can be seen that the five peaks in Figure 5a are small and the motion is relatively stable, but the motion angle of 62–85.3° in Figure 5b represents a significant drop from the 71.1–79.2° angle in Figure 5a. The of both are 73.62°, thus the average angle alone cannot objectively represent the user’s movement, and the peak is incorporated into Equation (3) to calculate the standard deviation of the angle, where a smaller value indicates a small degree of variation.
where is the angular standard deviation, is the average angle, is the total number of peaks, and .
Figure 6 shows the x-axis acceleration data for the Flexion motion. Normally this data will remain relatively static during the motion. Figure 6a shows that x-axis acceleration data was both above and below 0 g during the motion. If the arm does not bend during the motion, the data will produce a line close to zero with minimal variation, as shown in Figure 6b. Figure 6b also shows that, during Flexion, the x-axis acceleration data varies greatly with respect to Figure 6a. Since the arm is also bent during the action, the value is not as smooth as in Figure 6a. Therefore, the system calculates the standard deviation using Equation (4) from the x-axis acceleration data, and uses this parameter to assess the degree of horizontal stability with which the subject performs the Flexion action, with a smaller value indicating higher stability.
where is the standard deviation of the -axis, is the average amplitude of the -axis, is the total number of data points on the -axis, and is the data.
The Pronation action uses the same features as the Flexion action. Pronation stretches and rotates the hand 180 degrees, and is used to determine the degree of write joint rotation. This action is calculated using acceleration data along the z-axis. The average angle and its standard deviation, along with the acceleration data along the y-axis is used to assess vertical stability when performing this action because the wrist is kept straight during Pronation, and the acceleration data in the y-axis is not due to motion of the wrist. When rotation is performed, the numerical value fluctuates in a large range, and if the value fluctuation increases as a function of wrist rotation, this indicates unstable wrist movement during Pronation. The Lap to Chin action is only tested in terms of speed to assess Brunnstrom stage, comparing the peaks taken from the healthy and hemiplegia sides over a five second period. This paper used the ratio of hemiplegia side actions to healthy side actions as the basis for assessing the difference between the subjects healthy and hemiplegia sides.
2.4. Fuzzy System Design
According to the Brunnstrom method, a higher average angle and lower angular standard deviation indicates higher action stability and a higher level. A set of fuzzy rules was accordingly established, and the fuzzy rule design was divided into establishing input and output language variables to create fuzzy rules, fuzzy inferences and defuzzification. This rule was used to design A Brunnstrom Stage Evaluation System (BSES) with the fuzzy system design, as shown in Figure 7.
2.4.1. Input and Output
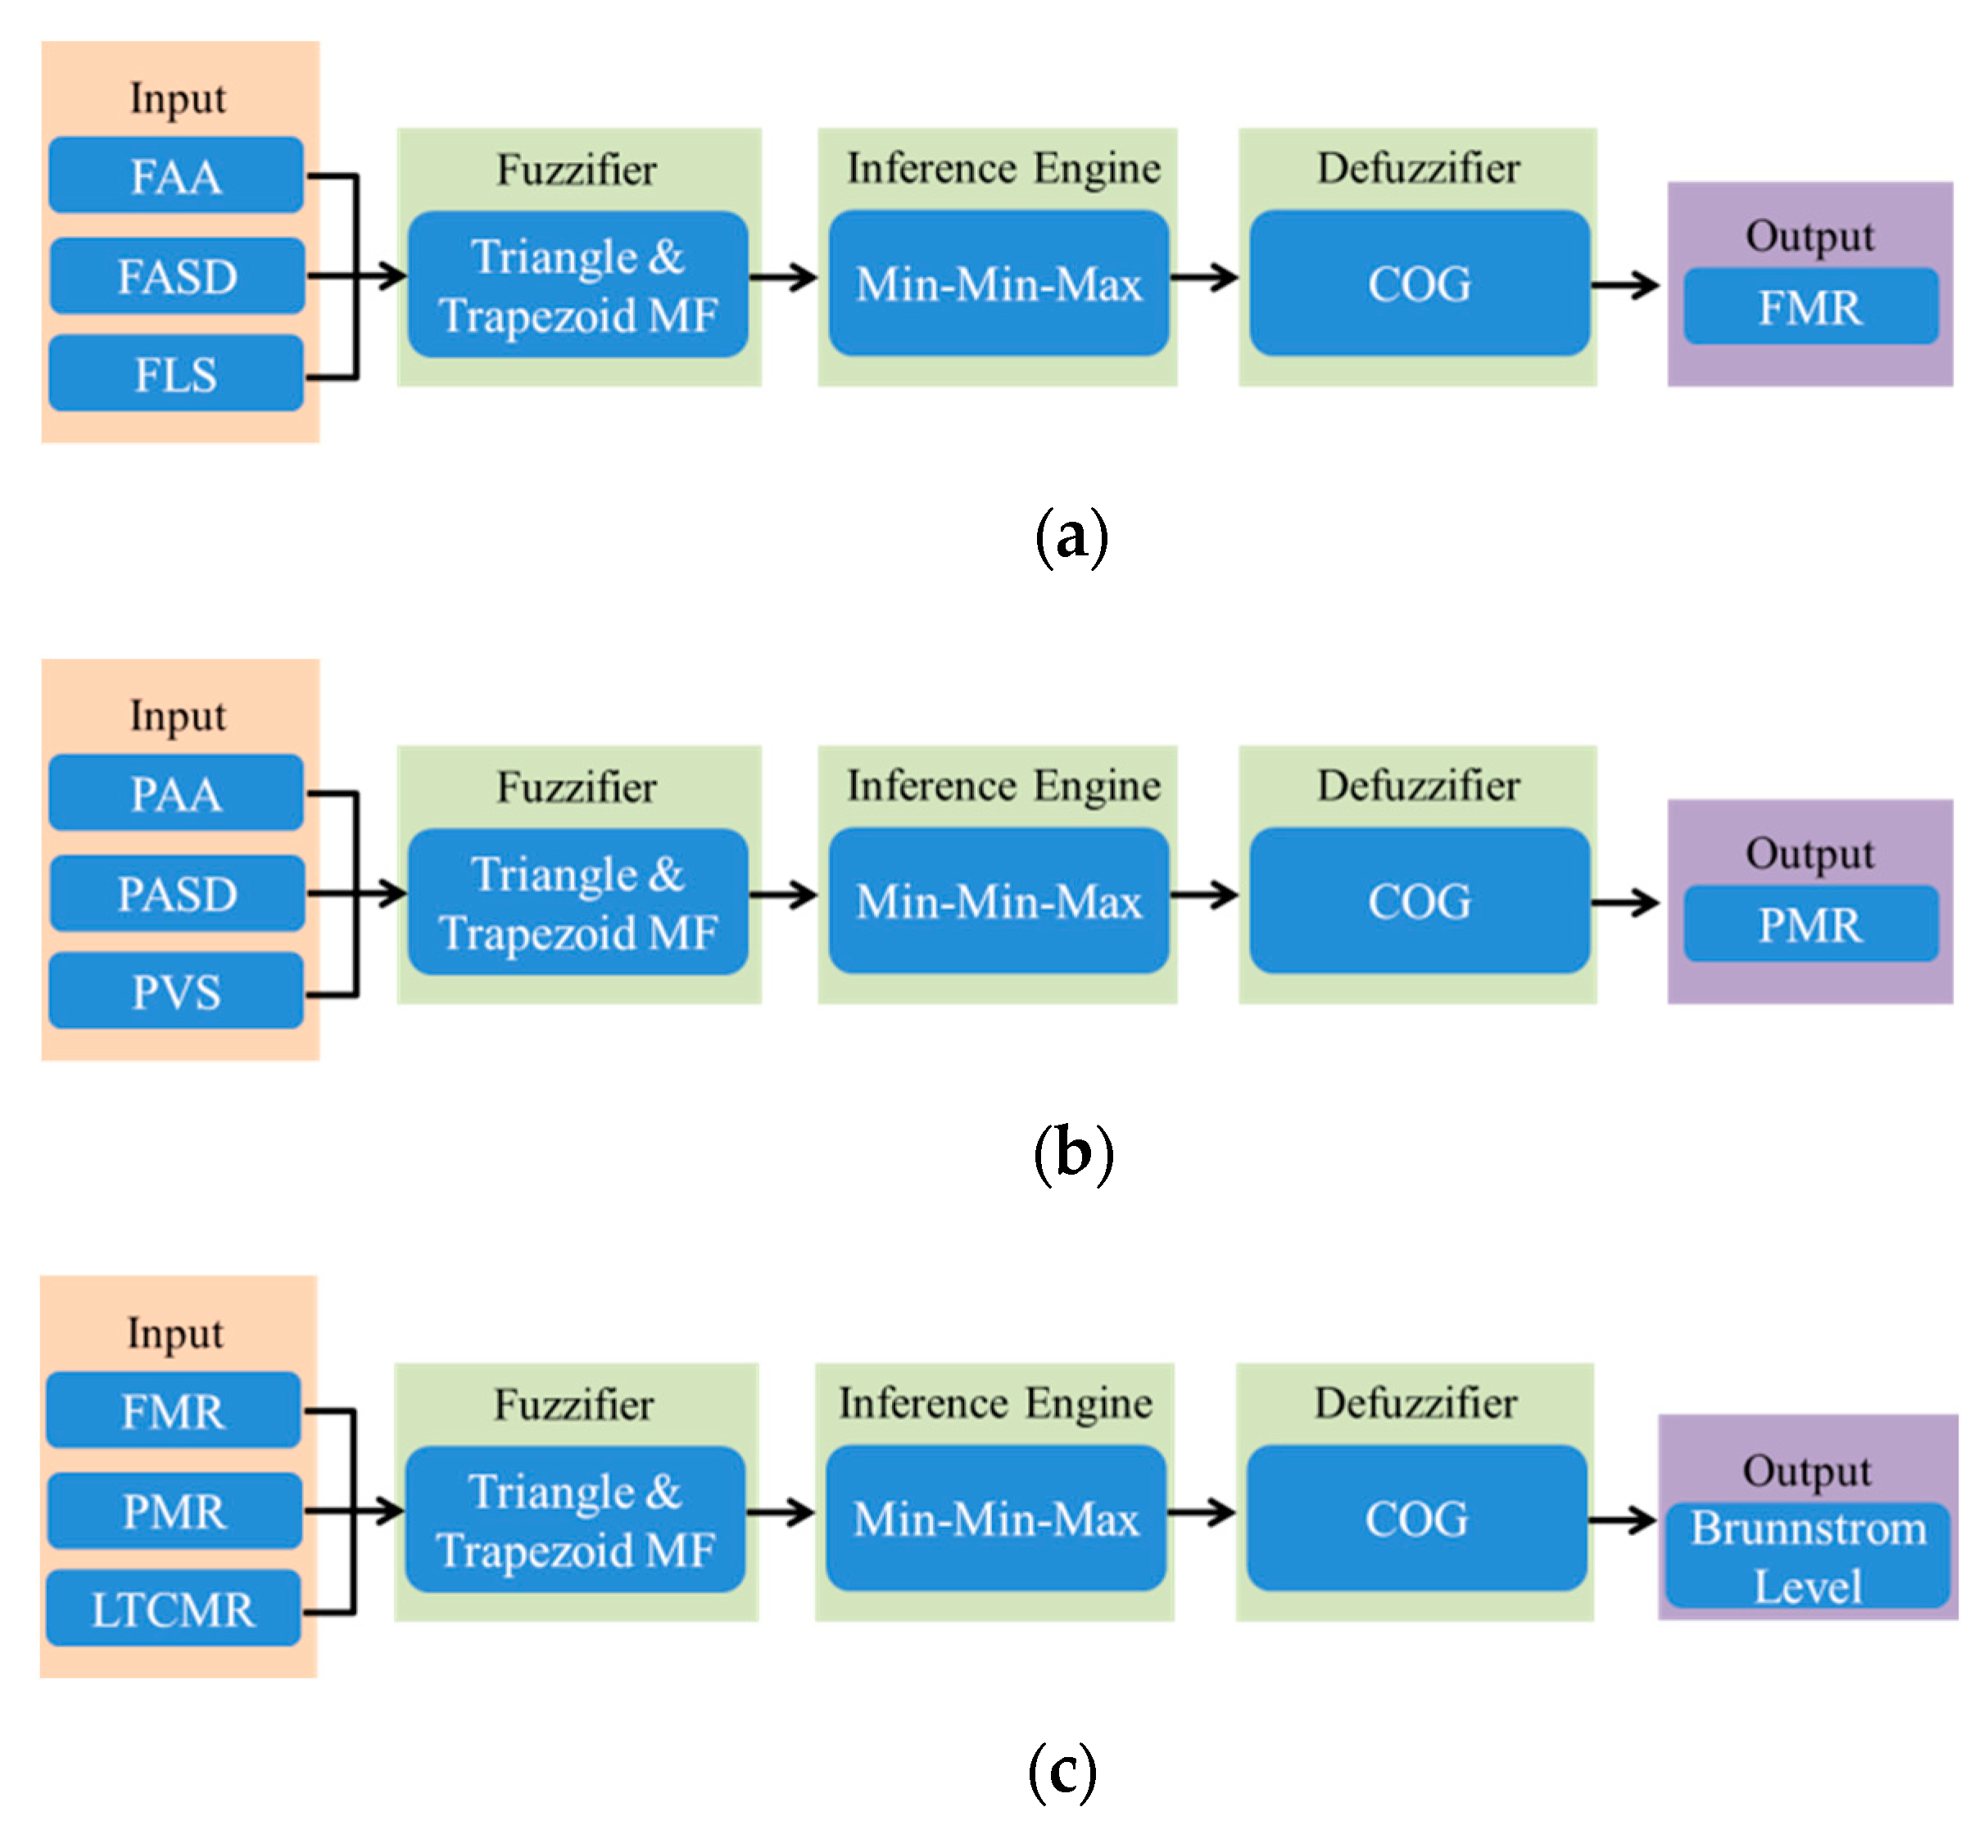
This paper uses two-order fuzzy judgment. The fuzzy inference is the min-min-max operations proposed by Mamdani in 1975, and defuzzification uses the centroid method to solve the explicit output (Crisp). Before making the judgment, we first confirm the input and output parameters. Figure 8a shows the Flexion motion fuzzy judgment diagram. FAA, FASD and FLS are used to calculate FMR. Figure 8b shows the Pronation motion fuzzy judgment diagram. PAA, PASD and PVS are used to calculate PMR, and Figure 8c shows the Brunnstrom level fuzzy judgment diagram. FMR and PMR are used as input parameters, and added to the Lap to Chin Motion Rate (LTCMR) to calculate the Brunnstrom Level.
2.4.2. Linguistic Terms and Membership Function
In the fuzzy judgment, the related linguistic terms are used according to the input variables. Each term is judged by at least three points (small, medium and large) from the polarized value to the intermediate value. The use of too many terms can easily lead to judgment problems and increase calculation time.
The first-order input parameters FAA and PAA are divided into five levels, as follows: very high, high, medium, low and very low. FASD and PASD are divided into three levels, as follows: low, medium and high. FLS and PVS are divided into five levels, as follows: very stable, moderate, acceptable, unstable and very poor. The outputs FMR and PMR are divided into nine levels, as follows: best, excellent, good, slightly better, normal, slightly worse, worse, very poor and worst.
The input parameters of the second stage, FMR and PMR are divided into three levels, as follows: poor, normal and good. LTCMR is divided into three levels, as follows: low, medium and high, and the output of the Brunnstrom grade is divided into six levels, as follows: ST2, ST3, ST4, ST5, ST6 and Healthy.
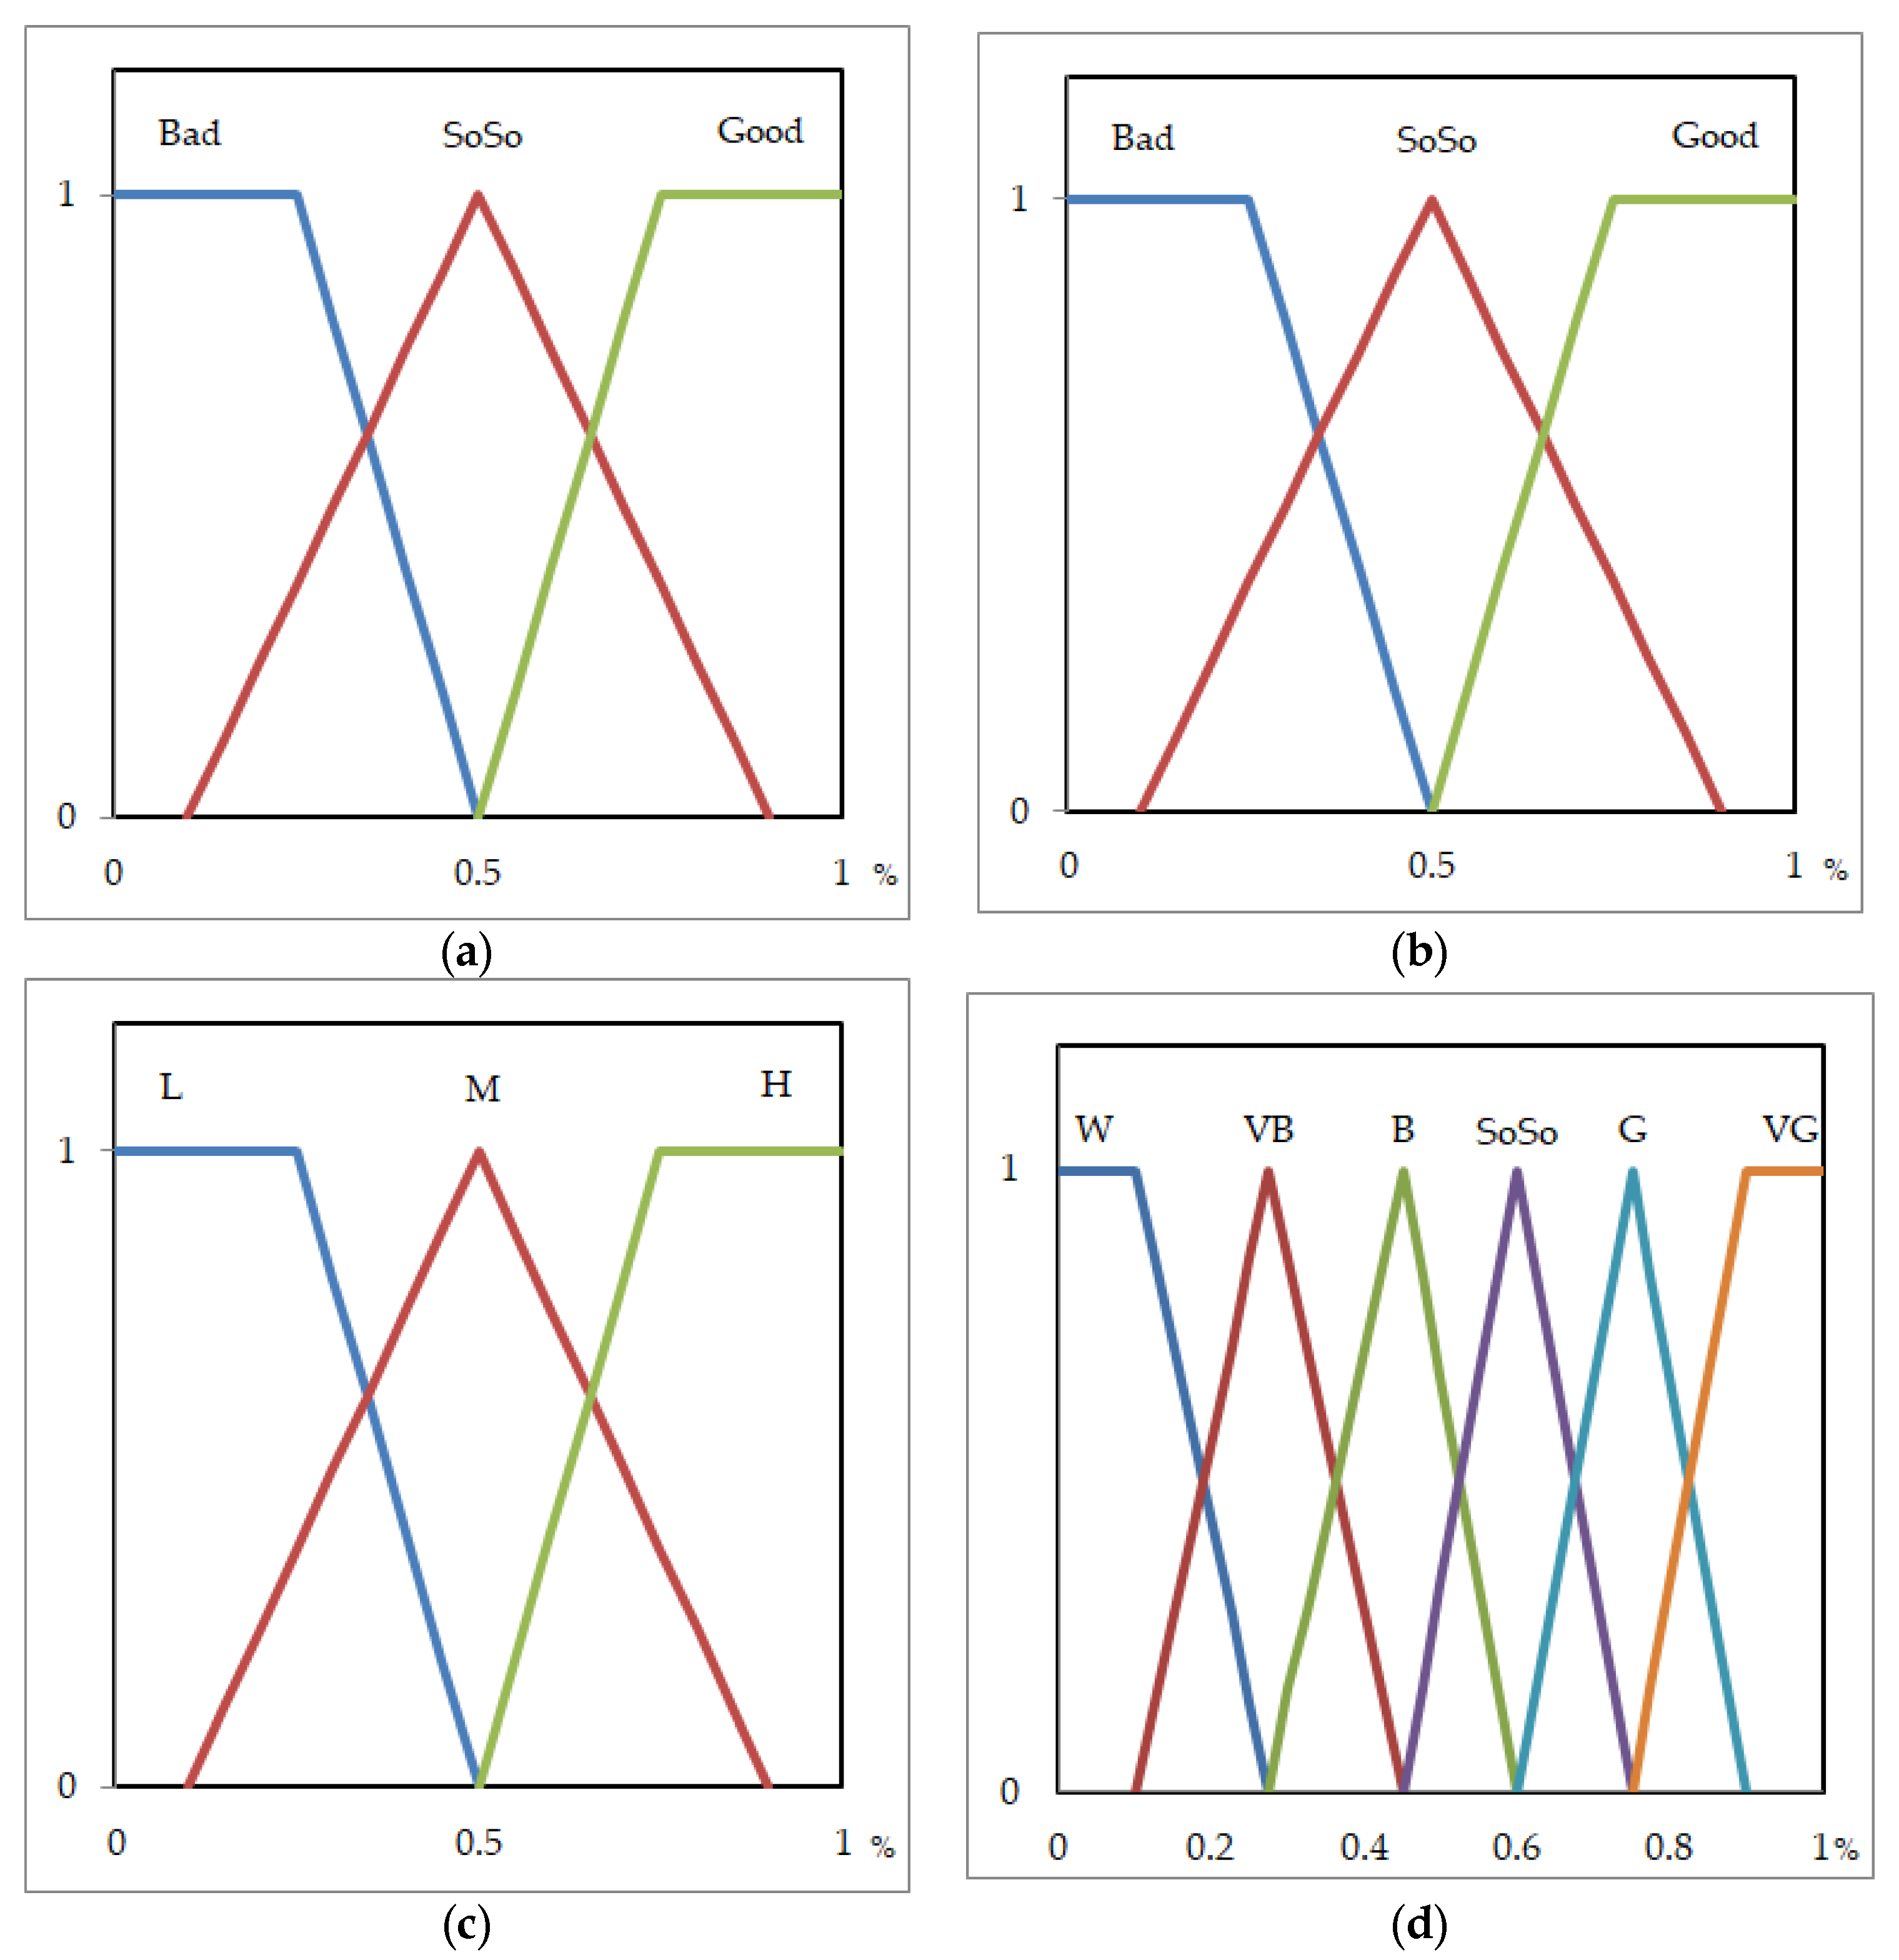
After establishing related terms, an attribution function must be defined for each term. The membership function (MF) inputs and outputs for this paper all use triangular and trapezoidal attribution functions. The various central values of the attribution function and their value range affect the fuzzification of the input variable. Figure 9 shows the attribution function of first-order Flexion and Pronation.
The first stage output results for FMR and PMR plus LTCMR are used as input parameters for the second stage. Figure 10 shows the attribution function design.
2.4.3. Fuzzy Inference Rules
Observations of the subject’s rehabilitation data can be combined with his Brunnstrom level and summarized for the fuzzy rule base. The user can then determine the output terms according to the input term. Table 3 and Table 4 list the 75 Flexion and Pronation action rules, while Table 5 lists the 27 Brunnstrom Level rules.
3. Experimental Design and Results
This study is designed by the researchers who are not clinicians but instructed by a doctor. Based on Brunnstrom Stages, ten healthy male research subjects were recruited to perform simulations (age 34 ±11 years, height 171.5 ±6.5 cm, weight 70 ±20 kg). Subjects first went through a 30 min training routine to familiarize them with the different movement ranges for each Brunnstrom Stage. As the use of authentic data would not meet the sampling requirement for the experiment, ten healthy subjects were used to simulate the actions of Brunnstrom Stage II (ST2) to VI (ST6) along with healthy action. In each simulation, 60 data points were obtained for Flexion, Pronation and Lap to Chin to analyze variation at different levels.
Table 6 provides a reference for the simulations tested in this experiment. Experimental subjects E1–E10 were instructed to repeatedly simulate Flexion and Pronation at Brunnstrom Stage-specific angles, along with Lap to Chin to obtain additional different Lap to Chin scores. Lap to Chin was simulated five times on the Good Side, and the Bad Side was then adjusted based on the specified level.
To meet experimental requirements, this paper recruited 10 students to simulate the actions shown in Table 7 in six different scenarios. The simulation table is based on the “Ueda 12-stage paralysis function” which divides the angle of action into six levels. To confirm the feasibility of the fuzzy algorithm in this situation.
Table 7 shows the corresponding Brunnstrom Level for each level simulated in this experiment. The Stage value calculated by the fuzzy system is mapped to Table 7.
Table 8 shows the simulation results for ST2, ST3, and ST4. Two of the results (E4, 20 %; E10, 23.5 %) in ST2 are classified as ST3, and the FMR score for E4 is slightly higher at 42.4 %. Since the FASD parameter is lower than that of the other data, the FMR score is higher and is thus classified in ST3. E10 has slightly higher FMR (38 %) and PMR (42.5 %) scores. Due to high action stability, the FMR and PMR scores are slightly higher and are thus classified in ST3. In the results for ST3, E7 (34.3 %) is classified in ST4, and the FMR of E7 is slightly over 50 %. As its FASD parameter is lower than that of the other data, it is classified in ST4. In the ST4 results, E3 (24.7 %) is classified in ST3. The FMR and PRM scores for E3 are slightly lower at 34.6 % and 32.6 %, and thus fall into ST3. Even if FAA has a range that conforms to the reference table, the action parameters FASD, FLS, PASD and PVS all show that E3 is insufficiently stable, and is thus determined by the system as ST3.
Table 9 shows the simulation results for ST5, ST6 and Healthy. It shows that E6 (60 %) is classified as ST5, despite its FMR score of 37 % being similar to ST4 results but is correctly classified as ST5 because its PMR score of 72.6 % is similar to that of ST6. In the ST6 results, the action assessment results of all subjects match the reference table, thus all ten subjects are correctly classified as ST6. The Healthy results of all subjects match the reference table, so all ten subjects are correctly classified as Healthy.
Figure 11 shows that a comparison of the actual experimental results with preset results. ST2 shows eight subjects successfully classified, while two are classified as ST3. Nine subjects are correctly classified as ST3, while one is classified as ST4. Likewise, nine subjects are correctly classified as ST4, and one is misclassified as ST3. For ST5–Healthy, all 30 data results are correctly classified. Thus, for the entire simulation, 56 results were correctly classified and four were misclassified, for a success rate of 93.3 %.
From the experimental results, the errors were concentrated between ST2 and ST4 in Table 5 because the movement of the test subjects differs from that of actual patients, corresponding to a low Brunnstrom level due to low stability and angle of action. There is no way to confirm the standard deviation, thus during simulations, subjects trying to mimic low action stability result in more exaggerated movements making it difficult to obtain a standard for the action. Thus the resulting value of the action may differ from the expected result. ST5–Healthy results are closer to the actions of healthy subjects, and thus ST2–ST4 miscategorizations are wavied.
The experimental results show that the fuzzy algorithm can effectively distinguish the features of different conditions and make correct classifications. Unlike Artificial Neural Networks (ANN) or Support Vector Machine (SVM) the proposed system allows physical therapists to make immediate adjustments to accommodate the actual condition and needs of hemiplegic patients. Although the fuzzy algorithm used in this paper is a subjective and simple method, it does not require the construction of complex mathematical models, and using rules of thumb it can be adjusted at any time in response to actual conditions. As the determination method is based on the observation of simulation data, errors are limited to ± 1 and thus will not significantly differ from actual results.
4. Conclusions
Based on fuzzy theory, this paper identifies features for discrete actions and evaluates the corresponding Brunnstrom levels, providing an improvement over previous evaluation methods, reducing the degree of subjectivity and facilitating recording of longitudinal tracking data. Although fuzzy theory provides a simple algorithm, it is more practical and simpler to use than other applications, such as SVM or ANN. In physical rehabilitation, the fuzzy algorithm is based on personal experience, thus allowing the physical therapist to adjust the parameters in response to differing requirements, such as changing the weight of action accuracy and stability.
Experimental results show that the acceleration data generated by the system can effectively filter out environmental noise by low-pass filtering, allowing the system to accurately capture feature values. From observing the feature values, we can determine the degree of stability with which the subject performs the action, and the numerical change for each action. The proposed BESE can improve on traditional physical rehabilitation methods with effective classifying and storing in databases. However, the present experiment used healthy subjects to simulate hemiplegia patients and their performance may differ from actual patients, with implications for the fuzzy system established here. For example, consider the simulated FLS parameter. During evaluation, the subject would deliberately increase the amplitude of the action and increase the FLS value. However, actual hemiplegic patients may not produce the same data. Verifying system validity and adjust the parameters of the simulated system requires submission to an Institutional Review Board (IRB) to collect data from actual hemiplegia patients, which would allow for the parameters to be modified to improve accuracy. This paper focused mainly on upper limb action, and future work can extend this work to lower limbs and fingers.
Author Contributions
System organization/design, experiment supervisor, paper editing and submitting, T.-J.S.; making experiments, paper editing, K.-L.L.; system design, paper editing, J.S.-H.T.; making experiments, W.-A.Y.; figures and tables editing, C.-F.K.
Conflicts of Interest
The authors declare no conflict of interest.
References
- Mackay, G.; Mensah, A.; Mendis, S.; Greenlund, K. The Atlas of Heart Disease and Stroke; World Health Organization: Geneva, Switzerland, 2004. [Google Scholar]
- Brunnstrom, S. Motor testing procedures in hemiplegia: Based on sequential recovery stages. Phys. Ther. 1966, 46, 357–375. [Google Scholar] [CrossRef]
- Brunnstrom, S. Movement Therapy in Hemiplegia: A Neurophysiological Approach; Medical Dept., Harper and Row: New York, NY, USA, 1970. [Google Scholar]
- Sanford, J.; Moreland, J.; Swanson, L.R.; Stratford, P.W.; Gowland, C. Reliability of the Fugl-Meyer assessment for testing motor performance in patients following stroke. Phys. Ther. 1993, 7, 447–454. [Google Scholar] [CrossRef]
- Ueda, B.; Fukuya, Y.K. Standardization of hemiplegia functional test-method of 12 stages hemiplegia recovery grade. Gen. Rehabil. 1977, 5, 749–766. [Google Scholar]
- Wang, W.F.; Yang, C.Y.; Wang, D.Y. Analysis of Movement Effectiveness in Badminton Strokes with Accelerometers. In Genetic and Evolutionary Computing. Advances in Intelligent Systems and Computing; Springer: Berlin/Heidelberg, Germany, 2015. [Google Scholar]
- Zhang, Z.; Liu, Y.; Li, A.; Wang, M. A novel method for user-defined human posture recognition using Kinect. In Proceedings of the 7th International Congress on Image and Signal Processing, Dalian, China, 14–16 October 2014; pp. 736–740. [Google Scholar]
- Wang, W.J.; Chang, J.W.; Haung, S.F.; Wang, R.J. Human Posture recognition based on images captured by the Kinect sensor. Int. J. Adv. Robot. Syst. 2016, 13, 54–69. [Google Scholar] [CrossRef]
- Lee, G.X.; Low, K.S. A factorized quaternion approach to determine the arm motions using triaxial accelerometers with anatomical and sensor constraints. IEEE Trans. Instrum. Meas. 2012, 61, 1793–1802. [Google Scholar] [CrossRef]
- Chen, J.R. Design and Implementation of Fall Detection and Triaxial Pedometer Based on Smartphone Platform. Master’s Thesis, Department of Computer Science and Information Engineering, Tamkang University, Taipei, Taiwan, 2014. [Google Scholar]
- Kostopoulos, P.; Nunes, T.; Salvi, K.; Deriaz, M.; Torrent, J. Increased Fall Detection Accuracy in an Accelerometer-based Algorithm Considering Residual Movement. In Proceedings of the International Conference on Pattern Recognition Applications and Methods, Lisbon, Portugal, 10–12 January 2015; pp. 30–36. [Google Scholar]
- Howcroft, J.; Kofman, J.; Lemaire, E. Prospective Fall-Risk Prediction Models for Older Adults based on Wearable Sensors. IEEE Trans. Neural Syst. Rehabil. Eng. 2017, 25, 1812–1820. [Google Scholar] [CrossRef]
- Weng, W.X. Fall Detection Based on Angular Variation and Acceleration. Master’s Thesis, Department of Computer Science and Information Engineering, Nation Dong Hwa University, Hualien, Taiwan, 2015. [Google Scholar]
- Wang, Z.; Wu, D.; Gravina, R.; Fortino, G.; Jiang, Y.; Tang, K. Kernel fusion based extreme learning machine for cross-location activity recognition. Inf. Fusion 2011, 37, 1–9. [Google Scholar] [CrossRef]
- Yu, L.; Xiong, D.; Guo, L.; Wang, J.A. A remote quantitative Fugl-Meyer assessment framework for stroke patients based on wearable sensor networks. Comput. Methods Programs Biomed. 2016, 128, 100–110. [Google Scholar] [CrossRef]
- Mannini, A.; Trojaniello, D.; Cereatti, A.; Sabatini, A.M. A Machine Learning Framework for Gait Classification Using Inertial Sensors: Application to Elderly, Post-Stroke and Huntingtons Disease Patients. Sensors 2016, 16, 134. [Google Scholar] [CrossRef]
- Zadeh, L.A. Fuzzy Sets. Inf. Control 1965, 8, 338–353. [Google Scholar] [CrossRef]
- Paskaš, M.; Reljin, B.; Reljin, I.; Dujković, D. Edge preserved low-pass filtering controlled by local dimension. In Proceedings of the 20th International Conference on Systems, Signals and Image Processing (IWSSIP), Bucharest, Romania, 7–9 July 2013; pp. 87–90. [Google Scholar]
- Mamdani, E.H.; Assilian, S. An experiment in linguistic synthesis with a fuzzy logic controller. Int. J. Man-Mach. Stud. 1975, 7, 1–13. [Google Scholar] [CrossRef]
- Lee, C.C. Fuzzy logic in control systems: fuzzy logic controller. II. IEEE Trans. Syst. Man Cybern. 1990, 20, 419–435. [Google Scholar] [CrossRef]
Figure 1.
Schematic diagram of measurement system.

Figure 2.
Flexion motion’s y-axis’s raw data from top to bottom ST2, ST3, ST4, ST5, ST6, and Healthy.
Figure 2.
Flexion motion’s y-axis’s raw data from top to bottom ST2, ST3, ST4, ST5, ST6, and Healthy.

Figure 3.
Flexion motion’s y-axis’s filtered data from top to bottom as ST2, ST3, ST4, ST5, ST6, Healthy.
Figure 3.
Flexion motion’s y-axis’s filtered data from top to bottom as ST2, ST3, ST4, ST5, ST6, Healthy.

Figure 4.
Schematic diagram of Equation (2).

Figure 5.
Flexion average angle comparison (a) Stability peak value and (b) Non stability peak value.
Figure 5.
Flexion average angle comparison (a) Stability peak value and (b) Non stability peak value.

Figure 6.
Flexion x-axis standard deviation comparison (a) stable x-axis acceleration data, (b) less-stable x-axis acceleration data.
Figure 6.
Flexion x-axis standard deviation comparison (a) stable x-axis acceleration data, (b) less-stable x-axis acceleration data.

Figure 7.
Schematic diagram of BSES Fuzzy System.

Figure 8.
Schematic diagram of Fuzzy inference (a) Flexion (b) Pronation, and (c) Brunnstrom Level.

Figure 9.
Flexion and Pronation MFs (a) FAA, PAA (b) FASD, PASD (c) FLS, PVS (d) FMR, PMR.

Figure 10.
Brunnstrom Level MFs (a) FMR (b)PMR (c) LTCMR, and (d) Brunnstrom Level.

Figure 11.
Default results comparison with actual results.


Table 1.
Define motions Features.
| Motion Name | Features | Description |
|---|---|---|
| Flexion | FAA | Average angle of peak values for y-axis |
| FASD | Standard deviation of peak values for y-axis | |
| FLS | Standard deviation of values for x-axis | |
| Pronation | PAA | Average angle of peak values for z-axis |
| PASD | Standard deviation of peak values for z-axis | |
| PVS | Standard deviation of values for y-axis | |
| Lap to Chin | LTCMR | Times of the peak value for z-axis |
Table 2.
Definition of Brunnstrom Stages.
| Flexion | Pronation | Simulate Level |
|---|---|---|
| 0–30 | 0–30 | ST2 |
| 30–60 | 30–60 | ST3 |
| 60–90 | 60–90 | ST4 |
| 90–120 | 90–120 | ST5 |
| 120–150 | 120–150 | ST6 |
| 150–180 | 150–180 | Healthy |
Table 3.
Stage 1 rules: Some part of Flexion motion’s rules.
| IF | Then | ||
|---|---|---|---|
| FAA | FASD | FLS | FMR |
| Very High | Low | Very Good | Best |
| Very High | Low | Good | Very Good |
| Very High | Low | SoSo | Good |
| Very High | Low | Bad | Not Bad |
| Very High | Low | Very Bad | SoSo |
| Very High | Middle | Very Good | Very Good |
| Very High | Middle | Good | Good |
| Very High | Middle | SoSo | Not Bad |
| Very High | Middle | Bad | SoSo |
| Very High | Middle | Very Bad | Not Good |
| Very High | High | Very Good | Good |
| Very High | High | Good | Not Bad |
| Very High | High | SoSo | SoSo |
| Very High | High | Bad | Not Good |
| Very High | High | Very Bad | Bad |
Table 4.
Pronation motion’s rules of Stage 1.
| IF | Then | ||
|---|---|---|---|
| PAA | PASD | PVS | PMR |
| Very High | Low | Very Good | Best |
| Very High | Low | Good | Very Good |
| Very High | Low | SoSo | Good |
| Very High | Low | Bad | Not Bad |
| Very High | Low | Very Bad | SoSo |
| Very High | Middle | Very Good | Very Good |
| Very High | Middle | Good | Good |
| Very High | Middle | SoSo | Not Bad |
| Very High | Middle | Bad | SoSo |
| Very High | Middle | Very Bad | Not Good |
| Very High | High | Very Good | Good |
| Very High | High | Good | Not Bad |
| Very High | High | SoSo | SoSo |
| Very High | High | Bad | Not Good |
| Very High | High | Very Bad | Bad |
Table 5.
Some part of Level rules.
| IF | Then | ||
|---|---|---|---|
| FMR | PMR | LTCMR | Level |
| Bad | Bad | Low | Worst |
| Bad | Bad | Middle | Worst |
| Bad | Bad | High | Very Bad |
| Bad | SoSo | Low | Worst |
| Bad | SoSo | Middle | Very Bad |
| Bad | SoSo | High | Bad |
| Bad | Good | Low | Very Bad |
| Bad | Good | Middle | Bad |
| Bad | Good | High | SoSo |
Table 6.
Simulation Motions references.
| Experimenter | Number of Motion | Flexion | Pronation | Lap to Chin | Simulate Level | |
|---|---|---|---|---|---|---|
| Bad Side | Good Side | |||||
| E1–E10 | 10 | 0–30 | 0–30 | 0–1 | 5 | ST2 |
| E1–E10 | 10 | 30–60 | 30–60 | 1–2 | 5 | ST3 |
| E1–E10 | 10 | 60–90 | 60–90 | 2–3 | 5 | ST4 |
| E1–E10 | 10 | 90–120 | 90–120 | 2–4 | 5 | ST5 |
| E1–E10 | 10 | 120–150 | 120–150 | 3–4 | 5 | ST6 |
| E1–E10 | 10 | 150–180 | 150–180 | 5 | 5 | Healthy |
Table 7.
Brunnstrom Level mapping table.
| Range | Brunnstrom Level |
|---|---|
| 0% > Level < 17% | ST2 |
| 17% ≥ Level < 34% | ST3 |
| 34% ≥ Level < 51% | ST4 |
| 51% ≥ Level < 68% | ST5 |
| 68% ≥ Level < 85% | ST6 |
| 85% ≥ Level < 100% | Healthy |
Table 8.
ST2–ST4 Simulations results.
| Level | ST2 | ST3 | ST4 | |||||||||
|---|---|---|---|---|---|---|---|---|---|---|---|---|
| Experimenter | FMR | PMR | LTCMR | Level | FMR | PMR | LTCMR | Level | FMR | PMR | LTCMR | Level |
| E1 | 29.8% | 10.3% | 20.0% | 15.8% | 39.5% | 41.1% | 20.0% | 18.8% | 56.4% | 51.2% | 40.0% | 41.0% |
| E2 | 31.0% | 27.2% | 0.0% | 16.0% | 37.3% | 27.0% | 40.0% | 24.2% | 48.0 | 50.8% | 60.0% | 47.2% |
| E3 | 27.5% | 17.2% | 20.0% | 15.1% | 36.7% | 30.3% | 40.0% | 25.0% | 34.6% | 32.6% | 40.0% | 24.7% |
| E4 | 42.4% | 22.1% | 20.0% | 20.0% | 25.5% | 45.5% | 40.0% | 24.8% | 46.5% | 53.0% | 40.0% | 35.7% |
| E5 | 27.7% | 23.9% | 20.0% | 15.2% | 36.1% | 41.0% | 40.0% | 27.0% | 58.0% | 48.4% | 40.0% | 40.0% |
| E6 | 32.5% | 33.5% | 20.0% | 16.6% | 45.9% | 32.6% | 20.0% | 21.1% | 45.8% | 54.8% | 60.0% | 49.6% |
| E7 | 21.0% | 30.0% | 0.0% | 14.8% | 50.0% | 41.2% | 40.0% | 34.3% | 49.1% | 51.3% | 40.0% | 34.4% |
| E8 | 12.3% | 24.6% | 0.0% | 10.0% | 32.5% | 34.0% | 20.0% | 17.1% | 43.0% | 48.8% | 60.0% | 40.8% |
| E9 | 24.0% | 17.0% | 20.0% | 14.3% | 44.0% | 40.8% | 20.0% | 20.7% | 49.7% | 48.0% | 60.0% | 45.5% |
| E10 | 38.0% | 42.5% | 20.0% | 23.5% | 43.9% | 30.8% | 20.0% | 27.5% | 50.5% | 46.7% | 40.0% | 34.5% |
Table 9.
ST5–ST6 and Healthy Simulations results.
| Level | ST5 | ST4 | Healthy | |||||||||
|---|---|---|---|---|---|---|---|---|---|---|---|---|
| Experimenter | FMR | PMR | LTCMR | Level | FMR | PMR | LTCMR | Level | FMR | PMR | LTCMR | Level |
| E1 | 60.3% | 57.1% | 60.0% | 65.3% | 69.2% | 64.2% | 80.0% | 78.9% | 87.1% | 93.1% | 100.0% | 93.3% |
| E2 | 65.6% | 67.6% | 40.0% | 51.4% | 63.7% | 62.0% | 80.0% | 77.3% | 71.7% | 83.8% | 100.0% | 85.8% |
| E3 | 61.6% | 49.1% | 80.0% | 65.2% | 60.7% | 75.5% | 60.0% | 69.8% | 74.0% | 91.3% | 100.0% | 89.6% |
| E4 | 52.6% | 53.0% | 60.0% | 58.0% | 62.1% | 65.7% | 60.0% | 68.5% | 86.6% | 80.1% | 100.0% | 84.2% |
| E5 | 51.3% | 56.7% | 60.0% | 58.0% | 62.1% | 65.7% | 60.0% | 70.5% | 73.6% | 85.2% | 100.0% | 88.3% |
| E6 | 37.0% | 72.6% | 80.0% | 60.0% | 74.9% | 71.0% | 60.0% | 70.5% | 73.6% | 85.2% | 100.0% | 87.5% |
| E7 | 60.9% | 54.6% | 60.0% | 62.5% | 63.8% | 74.1% | 60.0% | 69.4% | 73.3% | 79.2% | 100.0% | 85.3% |
| E8 | 51.0% | 52.3% | 60.0% | 53.9% | 62.2% | 67.9% | 80.0% | 78.1% | 86.5% | 68.3% | 100.0% | 86.7% |
| E9 | 53.8% | 56.1% | 60.0% | 61.8% | 61.0% | 68.3% | 60.0% | 68.2% | 72.3% | 90.8% | 100.0% | 89.0% |
| E10 | 61.0% | 63.6% | 40.0% | 52.1% | 70.8% | 63.8% | 60.0% | 68.3% | 90.1% | 82.5% | 100.0% | 91.3% |
© 2019 by the authors. Licensee MDPI, Basel, Switzerland. This article is an open access article distributed under the terms and conditions of the Creative Commons Attribution (CC BY) license (http://creativecommons.org/licenses/by/4.0/).
Share and Cite
MDPI and ACS Style
Su, T.-J.; Lo, K.-L.; Tsai, J.S.-H.; Yeh, W.-A.; Kuo, C.-F. A Brunnstrom Stage Evaluation System with Fuzzy-Accelerometer. Appl. Sci. 2019, 9, 3718. https://doi.org/10.3390/app9183718
AMA Style
Su T-J, Lo K-L, Tsai JS-H, Yeh W-A, Kuo C-F. A Brunnstrom Stage Evaluation System with Fuzzy-Accelerometer. Applied Sciences. 2019; 9(18):3718. https://doi.org/10.3390/app9183718
Chicago/Turabian StyleSu, Te-Jen, Kun-Liang Lo, Jason Sheng-Hong Tsai, Wen-An Yeh, and Cho- Feng Kuo. 2019. "A Brunnstrom Stage Evaluation System with Fuzzy-Accelerometer" Applied Sciences 9, no. 18: 3718. https://doi.org/10.3390/app9183718
Note that from the first issue of 2016, this journal uses article numbers instead of page numbers. See further details here.