Design of Micro-Phasor Measurement System to Identify Phasor of Distribution Transformers


1
Department of Electrical Engineering, National Kaohsiung University of Science and Technology, Kaohsiung 80778, Taiwan
2
Institute of Nuclear Energy Research, Longtan District 32560, Taiwan
*
Author to whom correspondence should be addressed.
Appl. Sci. 2019, 9(18), 3831; https://doi.org/10.3390/app9183831
Submission received: 27 July 2019
/
Revised: 29 August 2019
/
Accepted: 9 September 2019
/
Published: 12 September 2019
(This article belongs to the Special Issue Intelligent System Innovation)
Abstract
:In this paper, the micro-phasor measurement system is developed to support phasor identification of distribution transformers for the distribution mapping management system (DMMS) of Taiwan Power Company (TPC). The one pulse per second signal (1PPS) from the global positioning system (GPS) is used to synchronize the voltage sampling between reference and measurement sides. By receiving 1PPS from GPS, the phasor measurement of three-phase voltage at the reference site of the substation is stored in the master station with a time-stamp. This paper proposes a timing synchronous module with an embedded temperature compensated crystal oscillator (TCXO) to generate highly accurate timing for field measurement of underground distribution facilities. Mobile communication network is used to compare measurement results between reference and field sides of voltage angle that define distribution transformer phasor. This paper also designs and develops an application for mobile devices by importing DMMS database, which is used to search the attributes of the distribution transformers for measurement at the field. After the transformer phasor is identified, the results are stored in the mobile device to update the attributes of distribution transformers in DMMS.
1. Introduction
Taiwan Power Company (Taipower) has installed more than 1.4 M distribution transformers to serve 12 M residential and commercial customers in Taiwan. Those single-phase transformers cause to unbalance and increase line loss of distribution systems. To improve system unbalancing, Taipower has developed a standard procedure to rephase the transformer before measuring feeder and lateral current from the feeder terminal unit (FTU) of distribution automation system (DAS). To improve the accuracy of the DMMS database, this paper developed a micro-phasor measurement system to measure the phase of a distribution transformer and update the attributes of distribution transformers. This system consists of a master station and portable devices. The master station is installed in the substation to measure voltage angle of each phase based on the 1PPS. After the measurement, the mobile communication network is used to transmit data to the server and stored in the database. The portable devices are designed to measure the distribution transformers or test points of medium voltage (MV) plugs. The portable devices also use GPS 1PPS to synchronize sampling signal between substation and field measurement sides [1,2]. In the urban areas, most of the transformers are installed in the underground distribution systems. To maintain the accuracy of the sampling signal, the TCXO is used to generate highly accurate timing for the consecutive measurement. The field measurement results are transmitted via Bluetooth to the mobile device. The mobile communication network is also used to retrieve data from the server and display phasor real-time in the screen. All the measurement results are also stored in the mobile device to update the attributes of distribution transformers in DMMS and provide ancillary services of distribution system such as phasor balancing.
2. Design of the Micro-Phasor Measurement System
2.1. Signal Measuring Circuit
To measure phasor of distribution transformers, the 110/220 V signal was directly connected to the signal measuring circuit, an isolation transformer was adopted to isolate the signal of primary and secondary sides. A fuse F1 is designed as overcurrent protection at the input and a surge absorber VR1 is also designed in this circuit to absorb instantaneous surge that occurred at the signal input to protect the circuit from being damaged. In addition, to reduce noises in the circuit, the voltage signal that passed the isolation transformer is subsequently filtered through a low-pass filter, consisting of a resistor R3 and capacitor C1. Finally, a Zener diode D1 prevented excessive voltage signal from flowing directly into back-end circuits and burning the integrated circuit. The designed voltage signal isolating circuit is shown in Figure 1.
2.2. Voltage Sampling Circuit
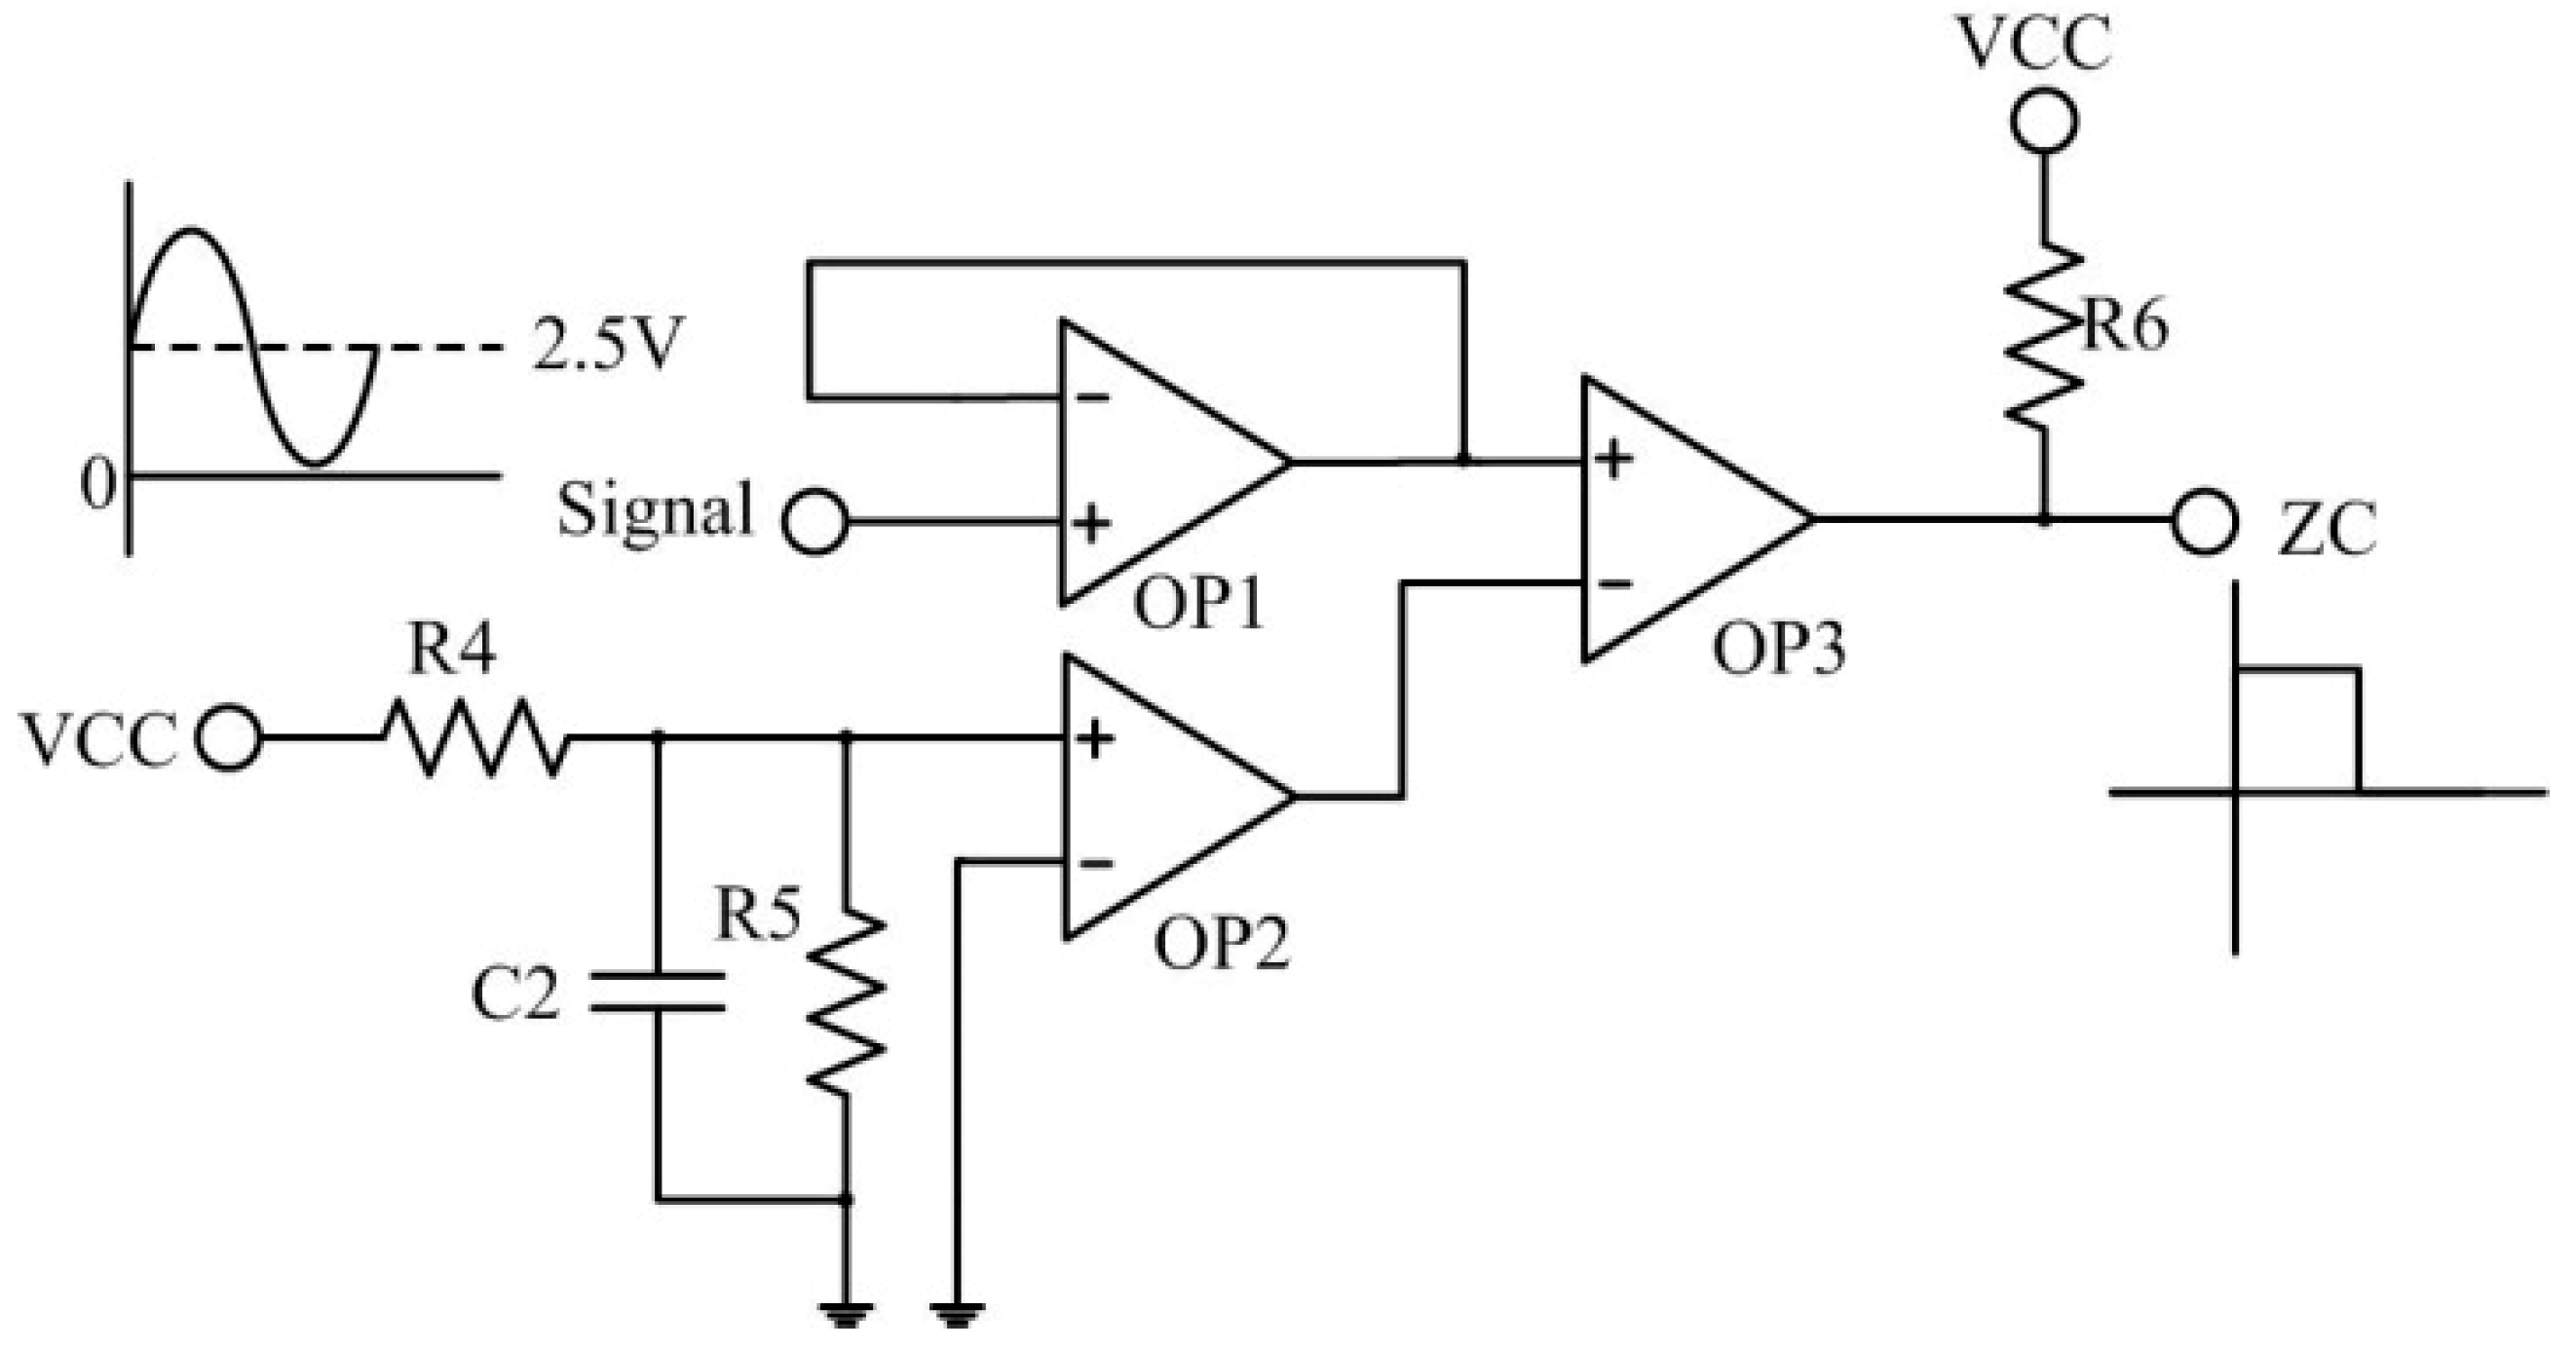
The voltage sampling circuit is designed by using operational amplifiers. First, the isolated voltage signal is input to voltage follower OP1 while OP2 is developed to generate a voltage reference based on resistors R4 and R5, a voltage divider of the DC power supply at the input. A reference could be output through OP2 with the capacitor C2 that stabilizes the voltage reference output. Since the signals of the 3-phase AC source comprise positive and negative cycles, OP3 is used to compare the input AC signal from OP1 and compare voltage reference signal from OP2 to generate a zero-crossing signal for the digital signal processor (DSP) with R6 pull-up resistor. The designed voltage sampling circuit is illustrated in Figure 2.
2.3. Time Synchronization
To identify the phasor of the transformers, the sampling signals of the phasor identification system at the reference and measuring sides have to be synchronized. Signals were first received by GPS module and then output as 1PPS, which then initiated the TCXO to produce a highly stable synchronous clock.
GPS reception varies according to weather and barriers such as buildings. Although the influence of barriers on outdoor transformers is inconspicuous, numerous distribution transformers are established in basements because most of the distribution systems in the city are underground. GPS signals from basements are substantially sheltered by the buildings, which hinders GPS reception. To identify phasor of distribution transformers in basement, the TCXO is used to maintain the 1PPS when synchronizing the GPS signals in an outdoor space area where signal reception is satisfactory before entering the basements. Once time synchronization was completed and reached the basement, the GPS module could be switched off and TCXO generates clock source to maintain 1PPS for measurements. Crystal in the TCXO could age and offset, adjustment for sampling signal was required to adequately compensate. In a high-temperature environment such as distribution room in the basement, the adopted TCXO could aptly adjust signals according to current temperature to enhance the precision of sampling signals.
2.4. Voltage Angle Calculation
The GPS 1PPS signals were adopted as the standards for synchronous signals sampling in two locations. Once the sampling synchronization is completed, the DSP receives 1PPS that serves as the starting point of time measurement. To identify the absolute phase angle of voltage, the voltage passed through the sampling and zero-crossing circuits to produce zero-crossing signals. Once the DSP received the signals, time measurement is stopped. The time difference was then calculated and converted into a phase angle.
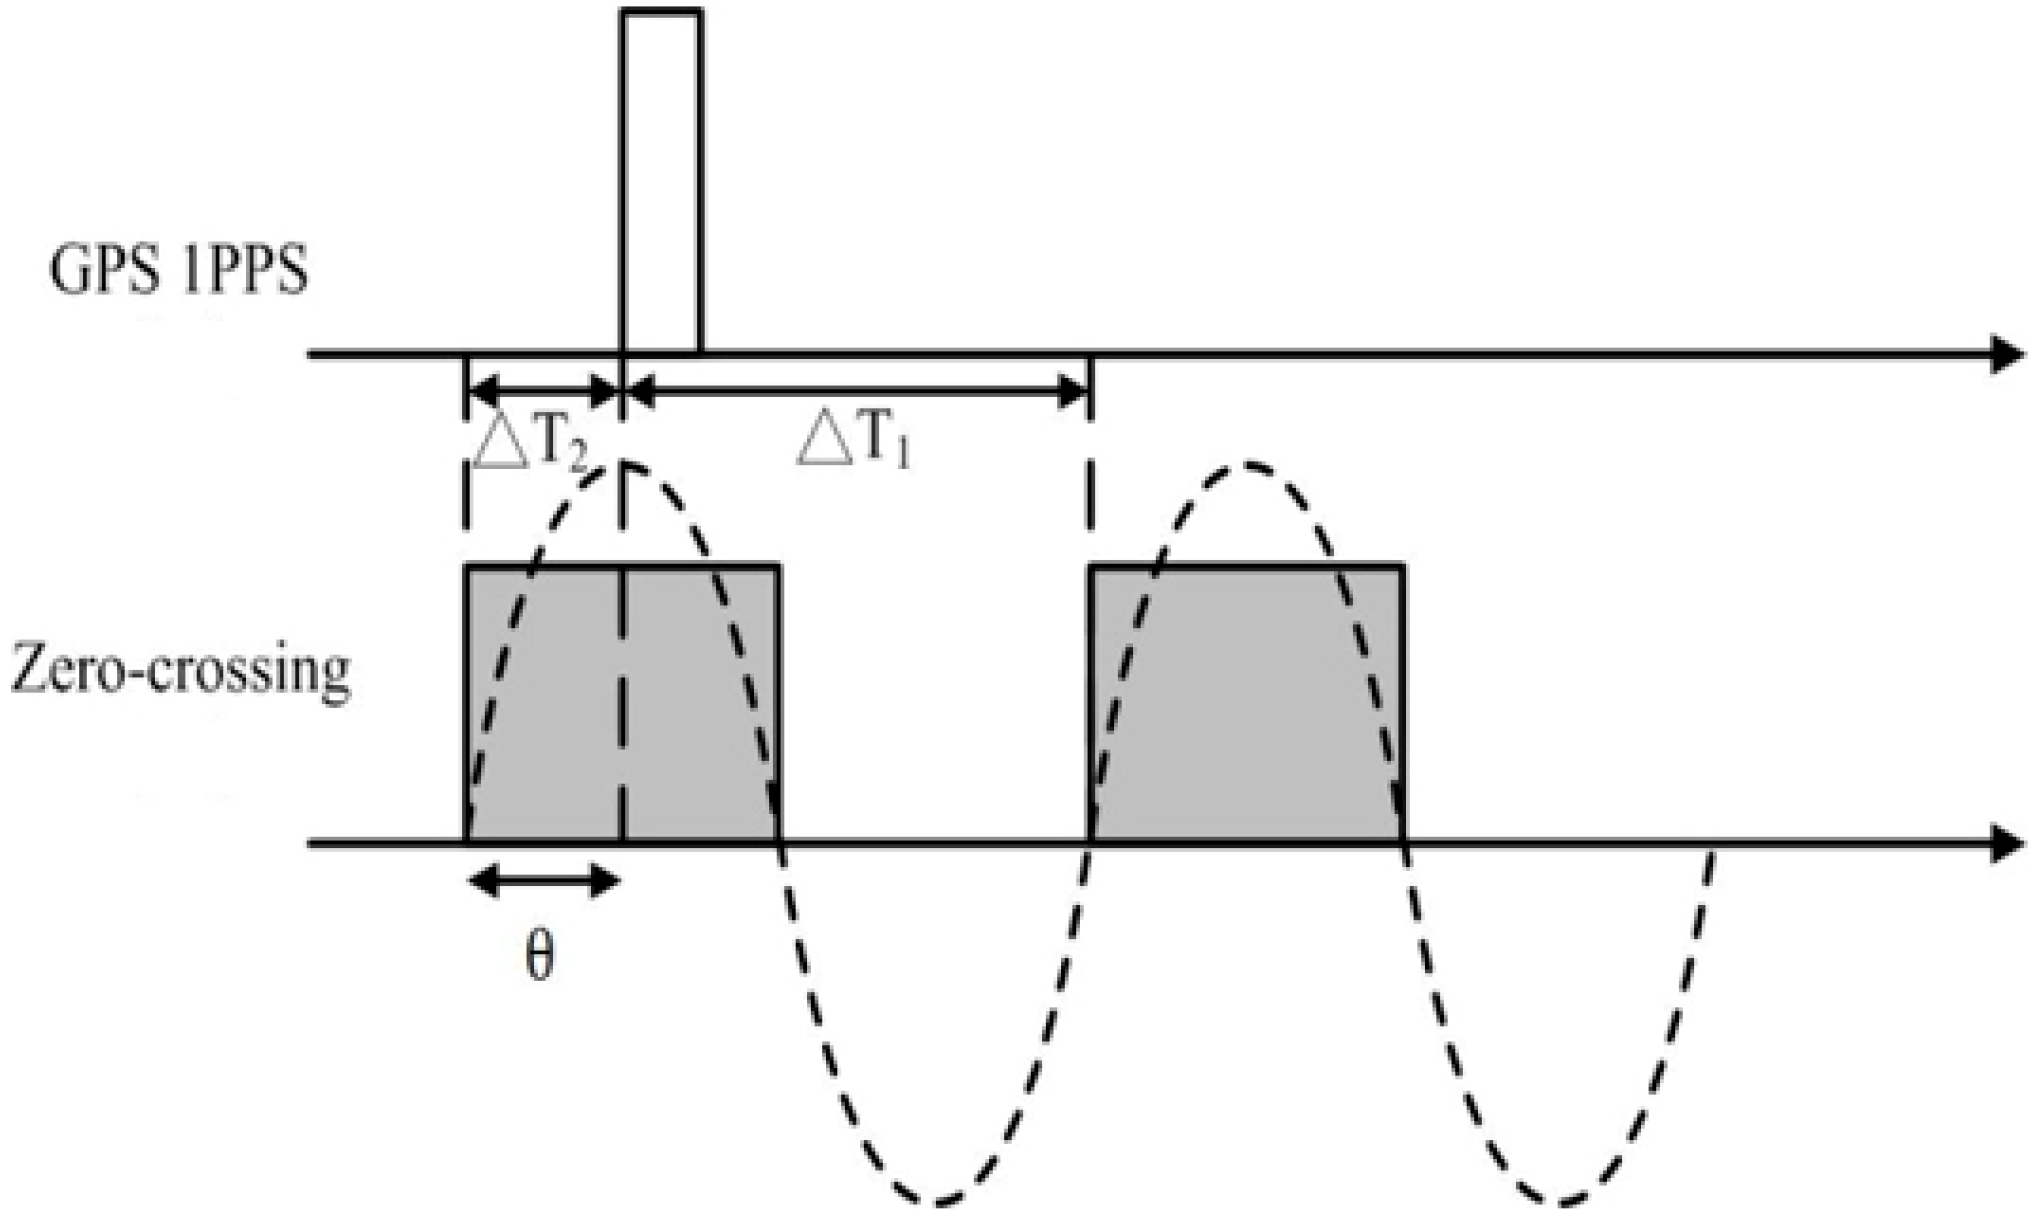
In Figure 3, ∆T1 is the time difference between the reception of the 1PPS signal and that of the voltage zero-crossing signal. The entire period could be converted to 360°, and be expressed as the reciprocal of frequency (T = 1/f), ∆T2 could be calculated as follows:
where ∆T1 is the time obtained through measurement, ∆T2 the time acquired through calculation, θ the absolute angle converted from ∆T2, and f is the frequency of voltage signals. Subsequently, (1) was substituted into (2) to obtain (3).
Therefore, the absolute angle θ could be calculated once the time difference between 1PPS and voltage zero-crossing signals is measured.
2.5. Voltage Phasors Comparing
To obtain the phase angles, the proposed system comprises two parts. Specifically, the reference side involves the main transformer located in the substation, and the measurement side involves the distribution transformers [3]. Data were sent from the reference side to the server through mobile communication network and measurement results are stored in the database. On-site portable device sent measurement statistics to a mobile device via Bluetooth. Finally, the mobile device is connected to mobile network to retrieve data from server database and compare the statistics acquired from both sides, and the phasor of the distribution transformer at the on-site measurement could be determined. Figure 4 shows the framework of the voltage phasor comparison.
3. Compensation of Sampling Signal
In the micro-phasor measurement system, the 1PPS pulse signal output from a GPS is adopted as the starting sampling point. However, it is not easy to receive GPS signals in basements. Therefore, a TCXO is adopted to retain the strength of the sampling signals. Notably, the clock of the TCXO may variation due to temperature, humidity, frequency, pressure, and aging. Hence, appropriate adjustment and compensation should be performed to improve the accuracy of measurements [4,5,6,7].
During compensation, the difference between the offset of the GPS and TCXO generated sampling signals is referred to as gain. This is obtained by averaging n gains that were repeatedly acquired from sampling signals. After the TCXO was triggered by the 1PPS sampling signals sent from the GPS, the DSP required additional time to complete its programming procedures before it could be started. Therefore, a time difference is produced between the 1PPS signals and the sampling signals generated after TCXO started. This time difference is referred to as offset C0, and the time difference caused by the required initial programming procedures is referred to as ∆t. Thus, the actual time difference should be the sum of the offset and the measured time difference. The calculation equation is shown in (4).
where treal is the actual time difference and C0 the initial offset value. The calculation of compensation value is outlined in Figure 5.
Regarding the compensation values used in adjustment, the first gain was acquired by subtracting offset C0 from offset C1 (notably, C1 refers to a new offset value measured after a certain time interval from the previous value). The second gain was then acquired by subtracting offset C1 from offset C2. This calculation is repeated for n times. All gains were then totaled and averaged to produce Cavg, namely the average compensation value. Finally, adding offset C0 to Cavg produced Vcomp, which is the adjustment compensation value required by the system. Equations (5) and (6) present the calculation of the average compensation value and adjustment compensation value respectively.
After Vcomp is obtained, it could be added to the time difference between the sampling signals generated by the TCXO and the zero-crossing sampling signals to elevate the accuracy of the measured data at each measurement time. With this adjustment and compensation mechanism, the proposed method is tested and confirmed to the standards developed by the Taipower. Equation (7) expresses the measured data after compensation. The principle of TCXO compensation is outlined in Figure 6.
4. Interface Design of the Portable Device
To improve the process and efficiency of distribution transformers phasor identification, this paper developed an Android application (APP) that provides an easy way to identify phasor quickly. With this APP, the distribution transformer properties in the database of the DMMS were imported to the mobile device to enable staff to search for the information about a specific distribution transformer at the measuring site. The mobile device is then connected to the portable device such as smart phone or tablet with Bluetooth, which enables staff to give the information before measuring. When the portable device has measured voltage signal, these measurement results were returned to the mobile device automatically. Finally, with mobile network communication, data are retrieved from server and APP compares voltage angles between reference and measurement sides. The phasor of distribution transformer will be displayed in the APP that assists staff identify phasor quickly.
4.1. Interface Design of the Application
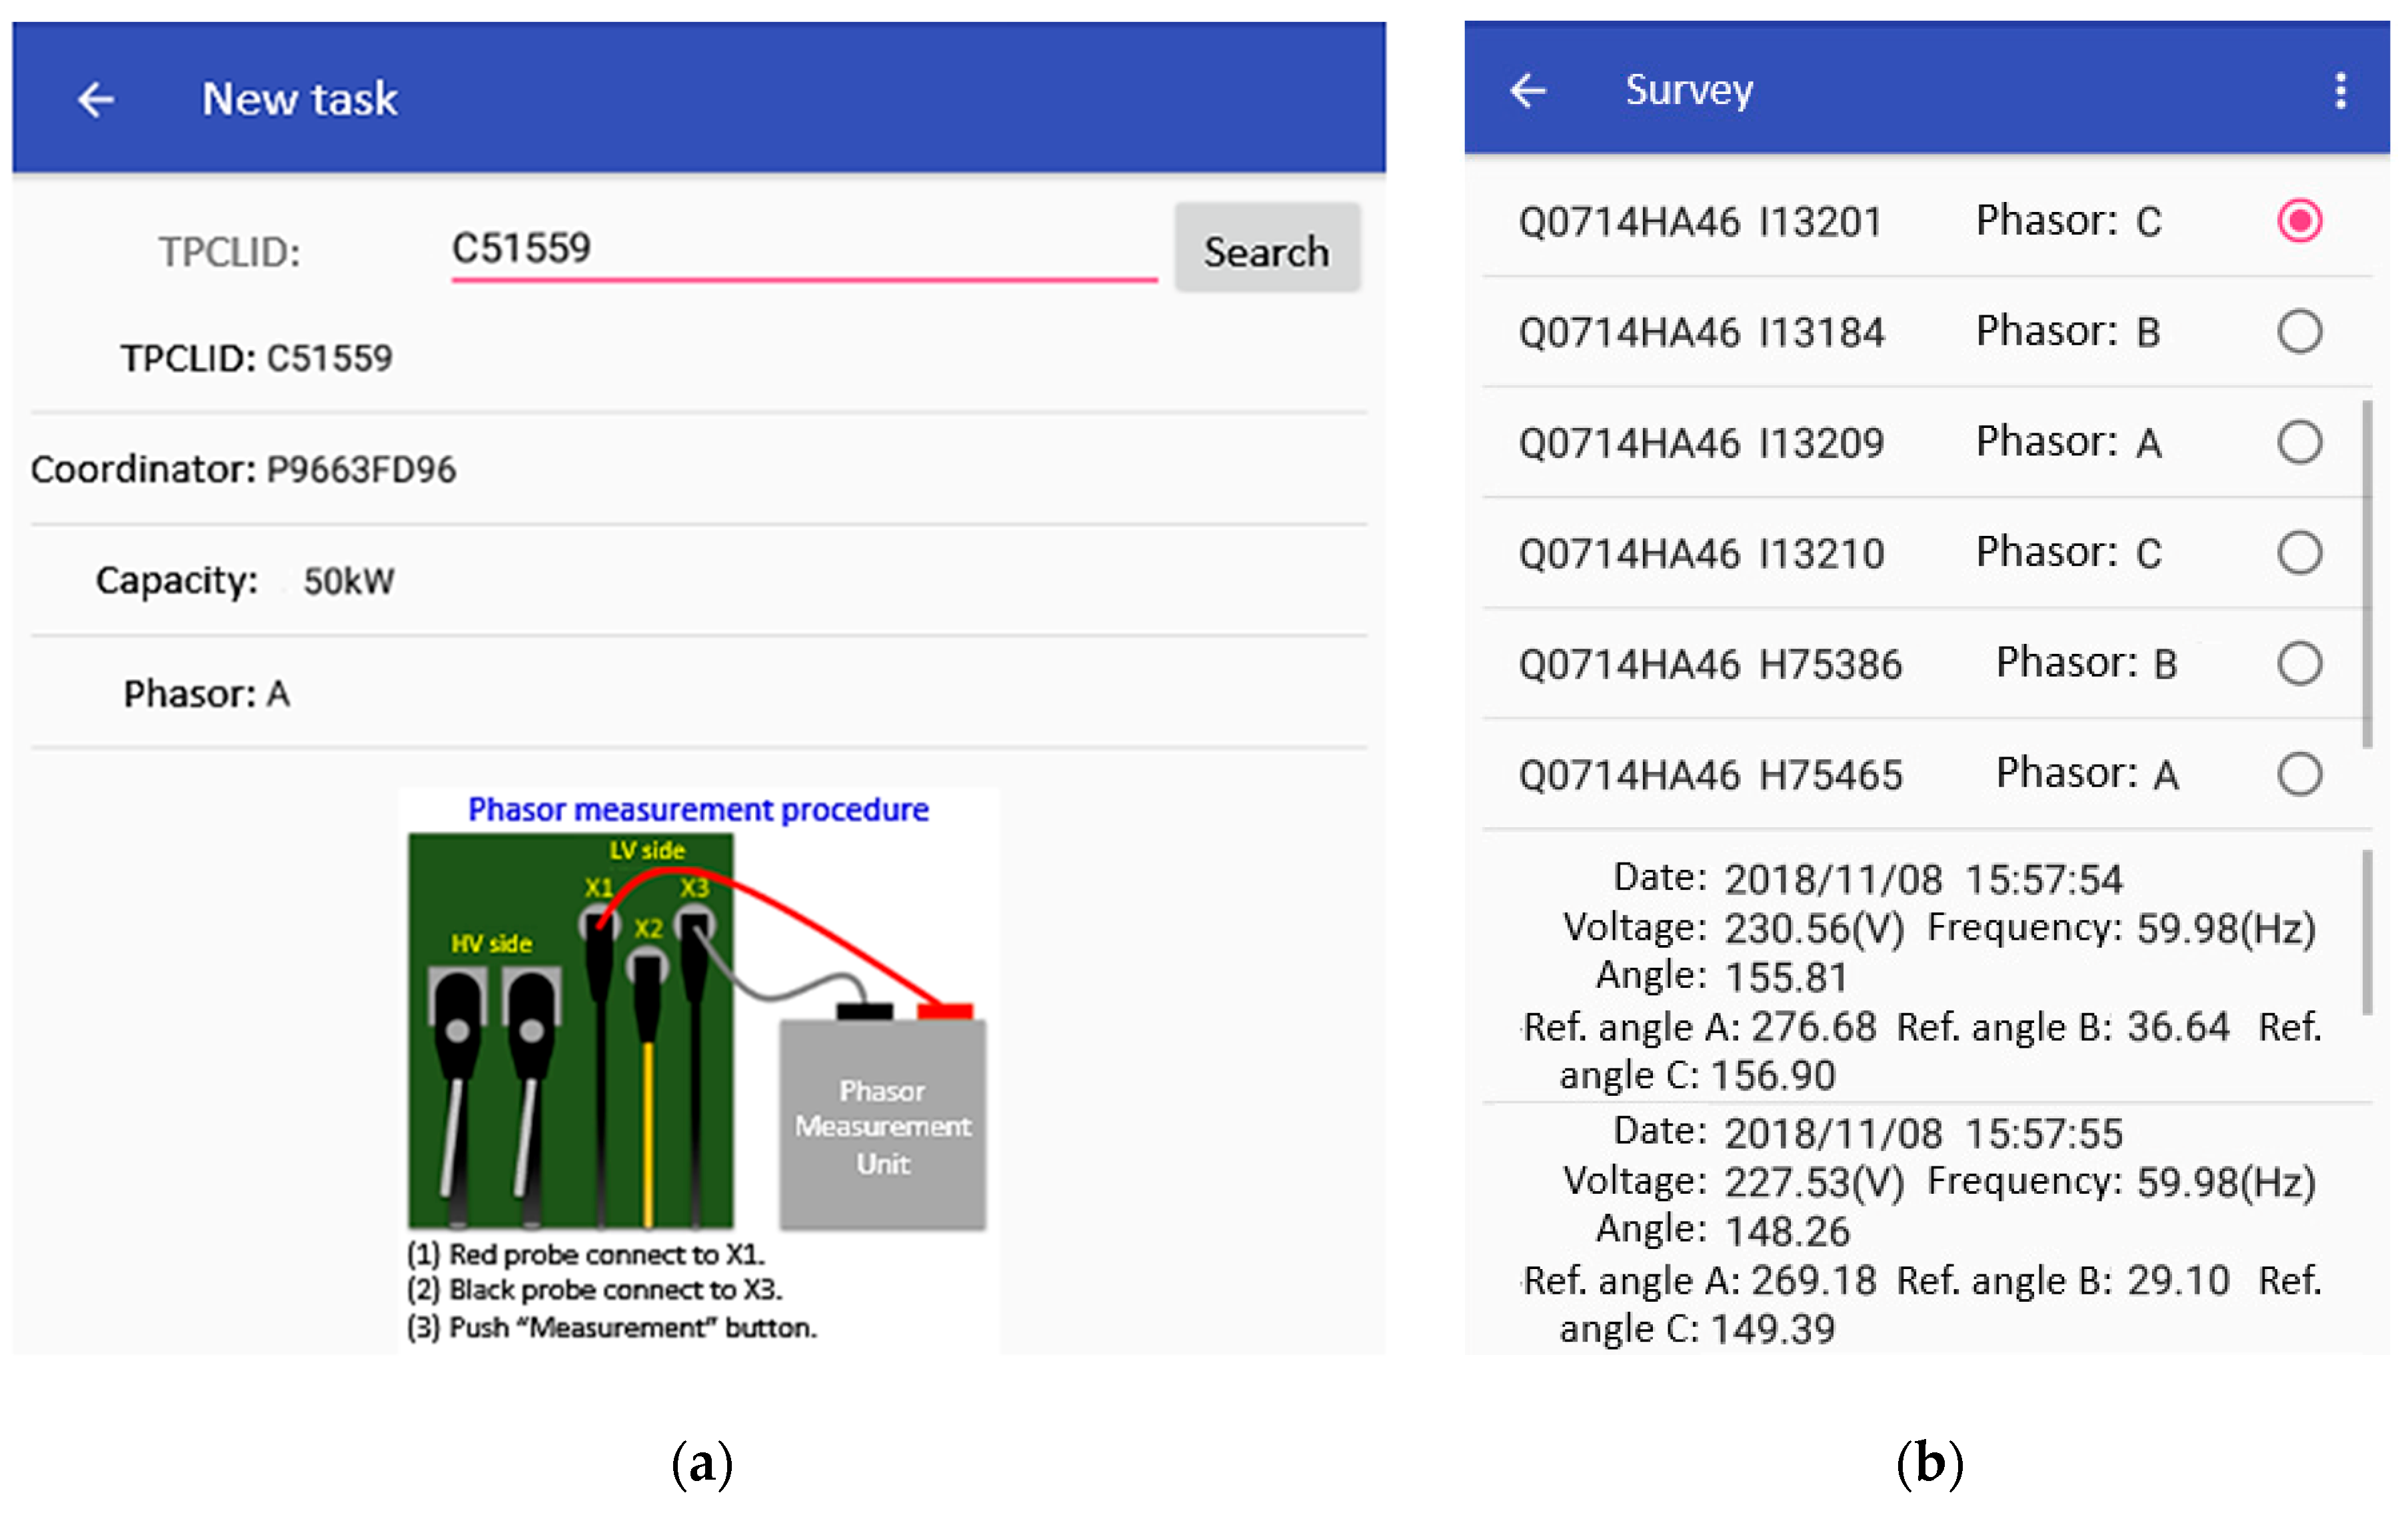
The interface of the proposed APP displays the information of the specific transformer that to be measured. With this system, users can search for specific transformers by their property numbers and locate the capacity and original phasor of all transformers labeled under that code. After a transformer is selected as a target of measurement, phasor identification begins. Characteristics including time, phasor, frequency, and voltage are measured, and the data are saved in the mobile device to enable subsequent comparison. Figure 7 presents the interface page of about transformers information and phasor identification results.
4.2. The framework of the Micro-Phase Identification System
Measurement data at the reference side are stored in the server via the mobile communication network that installed in the substation. When the on-site measurements are completed, the APP allows staff to connect to the server, thereby enables data comparison. Figure 8 illustrates the flow chart of the APP used at on-site measurement.
On the interface of the APP, users can search for the distribution transformer to be measured or update which distribution transformer is imported from the DMMS database. However, the property of distribution transformers are excessively large in quantity, a SQLite database is added to this APP to accelerate the searching process. After a transformer is selected as a measurement target, an APP interface on the portable device is used to connect with the micro-phasor measurement system to measure the target distribution transformer. Figure 9 depicts the framework of this APP.
The main interface of the server displays information regarding measurement time, voltage, angle, and frequency. Because of the excessively large data quantity, this server also employs a built-in database that saves the measurement results obtained from the master station. When the mobile device sends a request to the server, it will search for data from the database automatically and reply to the mobile device for phasor comparison. This server also provides interface when inputting the time and voltage angle measured on-site that show phasor comparison result. The framework of the phase comparison is illustrated in Figure 10.
5. Field Test of the Micro-Phasor Measurement System and Database Update for DMMS
The phasor of the distribution transformers recorded in the DMMS database is important for three-phase power flow analysis in the distribution systems that determine if the systems are balanced or unbalanced. An excessive phasor inconsistency between DMMS and on-site distribution transformers hinders power flow analysis and impedes the improvement of unbalanced currents in a three-phase system. Consequently, the problem of relatively high unbalanced current cannot be effectively addressed. The phasor attributes of distribution transformers in the DMMS database is frequently inconsistent with on-site measurement. Consequently, three-phase imbalances grow increasingly severe.
Table 1 presents the phasor identification results of the distribution room coordinate EC00 in Kaohsiung Meishuguan area. The distribution room comprises one three-phase transformer and seven single-phase transformers. The measurement results indicate that the accuracy rate of the phasor is 40%. After the field test, phasor identification of 102 distribution transformers from 15 selected underground distribution rooms in Kaohsiung Meishuguan area were applied. The measurement results were compared with the DMMS to determine the accuracy rate of the transformer phasor. The results suggest that the rate of phase inconsistency between DMMS and on-site identification results was exceptionally high. Furthermore, 73 of the distribution transformers were identified as exhibiting an inconsistent phase to that registered in the DMMS and 29 were marked correctly, yielding an accuracy rate of 28.43%.
6. Conclusions
The DMMS is the essential data system of the Taipower distribution system. However, because the data contained are digitalized from conventional blueprints, the phasor of distribution transformers marked in the database is often inconsistent with that identified on site, creating difficulties in system operation, maintenance, and planning for the Taipower. In addition, the prevalence of the underground distribution system and the elevated complexity of the distribution framework caused by increasing loads have incurred the difficulty for Taipower staff when conducting phasor identification. Therefore, this paper designed and developed a micro-phasor identification system and DMMS database property updating system to enhance convenienceness for the Taipower in phasor identification and data updating. A total of 102 distribution transformers in 15 underground distribution rooms in Kaohsiung Meishuguan area were selected as the targets for measurement, and the master station was established in Gushan Substation. After the on-site measurement and phasor identification of the 102 distribution transformers, conspicuous inconsistency was identified between the measurement results and the marked phasors provided by the DMMS. Specifically, only 29 distribution transformers exhibited phase consistency with that marked in the DMMS database, yielding a correct marking rate of 28.43%. Once phasor identification was completed, the content in the DMMS database was simultaneously updated. Overall, the inconsistency between the on-site and database measurements causes unsatisfactory operation efficiency of distribution system, suggesting a three-phase imbalance, excessive neutral currents, and increased loss in transmission lines.
This paper also developed an APP to serve as an interface for the phase-measuring system. Phasor identification could thus be performed by connecting to the server through mobile communication network. Regarding the safety of on-site measurement, voltage sampling device was designed and installed at the secondary side of the distribution transformer to avoid operations under high-voltage environments. Moreover, voltage measurements were adopted as samples to prevent errors of phase angle offset caused by the load. Concerning time synchronization, because of the prevalence of underground distribution, GPS signals could not be received on site when Taipower staff performed basement measurements. A TCXO that underwent adjustments and compensation was adopted as the source of sampling signals in the system. The coordinated universal time provided by the GPS served as a reference time for the measuring units at both the reference and on-site measurement, and the empirical results demonstrated that the error subsequently produced was within the tolerance range of the Taipower. After the measurement was completed, the phase identification results were returned to the Taipower offices for subsequent DMMS database property updates.
Author Contributions
Conceptualization, T.-T.K.; Resources, Y.-R.C. and Y.-D.L.; Validation, C.-S.L.; Writing—original draft, T.-T.K.; Writing—review & editing, C-H.L.
Funding
This work was supported in part by the Ministry of Science and Technology of the Republic of China under the Contract MOST 108-3116-F-042A-004-CC2.
Conflicts of Interest
The authors declare no conflict of interest.
References
- Carta, A.; Locci, N.; Muscas, C.; Sulis, S. A Flexible GPS-Based System for Synchronized Phasor Measurement in Electric Distribution Networks. IEEE Trans. Instrum. Meas. 2008, 57, 2450–2456. [Google Scholar] [CrossRef]
- Wilson, R.E. PMUs [phasor measurement unit]. IEEE Potentials 1994, 13, 26–28. [Google Scholar] [CrossRef]
- Depablos, J.; Centeno, V.; Phadke, A.G.; Ingram, M. Comparative Testing of Synchronized Phasor Measurement Units. In Proceedings of the Power Engineering Society General Meeting, Denver, CO, USA, 6–10 June 2004; Volume 1. [Google Scholar]
- Komarnicki, P.; Dzienis, C.; Styczynski, Z.A.; Blumschein, J.; Centeno, V. Practical Experience with PMU System Testing and Calibration Requirements. In Proceedings of the IEEE Power and Energy Society General-Conversion and Delivery of Electrical in the 21st Century, Pittsburgh, PA, USA, 20–24 July 2008. [Google Scholar]
- Ghiocel, S.G.; Chow, J.H.; Stefopoulos, G.; Fardanesh, B.; Maraga, D.; Blanchard, B.; Razanousky, M.; Bertagnolli, D.B. Phasor-Measurement-Based State Estimation for Synchrophasor Data Quality Improvement and Power Transfer Interface Monitoring. IEEE Trans. Power Syst. 2014, 29, 881–888. [Google Scholar] [CrossRef]
- Zhang, P.; Chan, K.W. Reliability Evaluation of Phasor Measurement Unit Using Monte Carlo Dynamic Fault Tree Method. IEEE Trans. Smart Grid 2012, 3, 1235–1243. [Google Scholar] [CrossRef]
- Tu, K.Y.; Chang, F.R.; Liao, C.S.; Wang, L.S. Frequency Syntonization Using GPS Carrier Phase Measurements. IEEE Trans. Instrum. Meas. 2001, 50, 833–838. [Google Scholar]
Figure 1.
Voltage signal isolating circuit.

Figure 2.
Voltage sampling circuit.

Figure 3.
Method to measure voltage angles.

Figure 4.
Framework of the voltage phasor comparison.

Figure 5.
Calculation of compensation value.

Figure 6.
Principle of TCXO compensation.

Figure 7.
Designed interface of application: (a) Transformers information; (b) Phasor identification results.
Figure 7.
Designed interface of application: (a) Transformers information; (b) Phasor identification results.

Figure 8.
Flow chart of the APP used at the on-site measurement.

Figure 9.
The framework of the APP.

Figure 10.
The framework of the phasor comparison.


Table 1.
Identification results of distribution room EC00.
| ID | Voltage Angle | Phasor | Error | ||
|---|---|---|---|---|---|
| Reference | On-Site | DMMS | Measurement | ||
| T01 | 68.76 | 69.03 | R | T | 0.27 |
| 132.12 | 131.46 | T | R | 0.66 | |
| 288.29 | 286.7 | S | S | 1.59 | |
| T02 | 290.74 | 289.58 | R | T | 1.16 |
| T03 | 255.01 | 254.89 | T | R | 0.12 |
| T04 | 57.62 | 58.41 | S | S | 0.79 |
| T05 | 133.89 | 134.68 | R | T | 0.79 |
| T06 | 138.34 | 139.12 | T | R | 0.78 |
| T07 | 336.01 | 335.87 | S | S | 0.14 |
| T08 | 301.23 | 299.75 | S | S | 1.48 |
The accuracy rate of transformer phasor: 40%.
© 2019 by the authors. Licensee MDPI, Basel, Switzerland. This article is an open access article distributed under the terms and conditions of the Creative Commons Attribution (CC BY) license (http://creativecommons.org/licenses/by/4.0/).
Share and Cite
MDPI and ACS Style
Ku, T.-T.; Lin, C.-H.; Li, C.-S.; Chang, Y.-R.; Lee, Y.-D. Design of Micro-Phasor Measurement System to Identify Phasor of Distribution Transformers. Appl. Sci. 2019, 9, 3831. https://doi.org/10.3390/app9183831
AMA Style
Ku T-T, Lin C-H, Li C-S, Chang Y-R, Lee Y-D. Design of Micro-Phasor Measurement System to Identify Phasor of Distribution Transformers. Applied Sciences. 2019; 9(18):3831. https://doi.org/10.3390/app9183831
Chicago/Turabian StyleKu, Te-Tien, Chia-Hung Lin, Chung-Sheng Li, Yung-Ruei Chang, and Yih-Der Lee. 2019. "Design of Micro-Phasor Measurement System to Identify Phasor of Distribution Transformers" Applied Sciences 9, no. 18: 3831. https://doi.org/10.3390/app9183831
Note that from the first issue of 2016, this journal uses article numbers instead of page numbers. See further details here.