Article

Statistical Analysis and Data Envelopment Analysis to Improve the Efficiency of Manufacturing Process of Electrical Conductors

by
Marco Antonio Zamora-Antuñano
1,†,
Jorge Cruz-Salinas
2,
Juvenal Rodríguez-Reséndiz
3,*,†,
Carlos Alberto González-Gutiérrez
1,
Néstor Méndez-Lozano
1,
Wilfrido Jacobo Paredes-García
3,
José Antonio Altamirano-Corro
1 and
José Alfredo Gaytán-Díaz
4
1
Engineering Department, Universidad del Valle de Mexico, 76230 Querétaro, Mexico
2
Centro de Investigación en Ciencia Aplicada y Tecnología Avanzada, IPN, 76090 Querétaro, Mexico
3
Facultad de Ingeniería, Universidad Autónoma de Querétaro, 76010 Querétaro, Mexico
4
Engineering Department, Universidad Politécnica de Santa Rosa Jáuregui, 76220 Querétaro, Mexico
*
Author to whom correspondence should be addressed.
These authors contributed equally to this work.
Appl. Sci. 2019, 9(19), 3965; https://doi.org/10.3390/app9193965
Submission received: 22 July 2019 / Revised: 18 September 2019 / Accepted: 19 September 2019 / Published: 21 September 2019
(This article belongs to the Special Issue Design and Optimization of Production Lines)

Abstract

:
The main focus of this research was to develop an approach using statistical tools and Data envelopment analysis (DEA) to tackling productivity measurements and benchmarking problems in electrical conductor manufacturing environment. In the present work, a tooling efficiency study was carried out with a nozzle used for the manufacture of 23-AWG wires. The efficiency of five types of tooling, four non-Mexican-manufactured types and one Mexican-manufactured type, were compared. Analysis of Variance (ANOVA) and the Tukey test were applied. Six factors were considered that influence of the performance of the tooling during the manufacturing process: productivity, quality, time, machine, operator, and color of the insulating material, but the research work focuses on the efficiency of the tooling die-nozzle. The results demonstrated that two die-nozzle models exhibited the best performance; one of them was the Mexican model, surpassed by a non-Mexican model, the capability process index Cpk = 1.26 manifested a better performance for the 3DND die-nozzle according to the statistical analysis and the tests performed. Subsequently, through a super-efficiency DEA model of inputs-oriented with non-decreasing returns to scale (NDRS). The results obtained in the statistical analysis were corroborated using this technique, its application combined with statistical tools represents an innovation for knowledge in manufacturing processes of electrical conductors. Input data were obtained at a manufacturer of electrical conductors supplier of the automotive sector in the Querétaro City of Mexico.

1. Introduction

ANOVA is a statistical technique widely used to evaluate the importance of one or more factors in a product or a process when comparing the means of the response variable at the different levels of the factors. ANOVA analyses require data from populations that follow an approximately normal distribution with equal variances between factor levels. The name “analysis of variance” is based on the approach in which the procedure uses the variances to determine if the means are different. The procedure works by comparing the variance between the means of the groups and the variance within the groups as a way to determine if the groups are all part of a larger population or separate populations with different characteristics. Presently, it is possible to combine other techniques to give greater effectiveness. Over time, the Design of Experiments (DOE) has been applied with great success in all types of processes and products, mainly in the automotive sector. DOE is used as the first approach for optimization of processes, devices, and manufacture of electrical circuits, pinpointing the factors involved in failures in manufacture processes [1], and identification of elements in the manufacture process to improve the reliability [2]. Based on [3], through the DOE, we made improvements in organic processes. In [4], developed the DOE, improved manufacturing tolerances in permanent magnet motors. Taking into consideration [5], applied the DOE in a spot welding process to identify the key parameters of the process, which influence the tensile strength of welded joints. Also, DOE had been employed successfully en R&R analysis [6], surface response analysis [7] and, algorithm analysis [8]. There have been many cases of successful application of the DOE in all types of production processes. The motivation of this study lies in the interest of analyzing the efficiency of tooling, real monitoring, and measurement processes developed with DOE, and identifying the efficiency of the tooling for the manufacture of electrical conductors. Through a combination of techniques of DOE and DEA, it is intended to establish an analysis of the performance of the tooling and validate the efficiency of the die-nozzle 3DND model of Mexican manufacture versus the die-nozzle models of foreign manufacture. The main problem in the manufacture of electrical conductors is the wear on the die-nozzle tooling. It generates frequent changes and causes stoppages in the production lines and implies a high consumption of the die-nozzle. In addition to this, there is an increase in the indirect costs of the process, losses generated by the non-conforming product, waste of materials and contamination. Therefore, the problem in this research work was defined in terms of the durability of the torque die-nozzle because the accelerated wear of this leads to the loss of productivity due to downtime, waste, and contamination [9]. It was developed in a company that manufactures electrical conductors for suppliers of the automotive sector, the efficiency of die-nozzle tooling was analyzed.

1.1. Manufacturing 23-AWG Wire Process and Die-Nozzle

The insulator of the electrical conductors are applied using a plastic extrusion machine whose schematic cut is displayed in Figure 1. A die-nozzle is inserted in the head. The equipment is complemented with a hopper feeding polymer granules and dryer, which are not shown.
In this work, we applied the DOE and DEA to find an optimal solution to the manufacturing problem specifically in an electrical conductor manufacturing industry. The DEA provides a framework for ranking efficient units and facilitates comparison with rankings based on parametric methods [10].

1.2. Data Envelopment Analysis
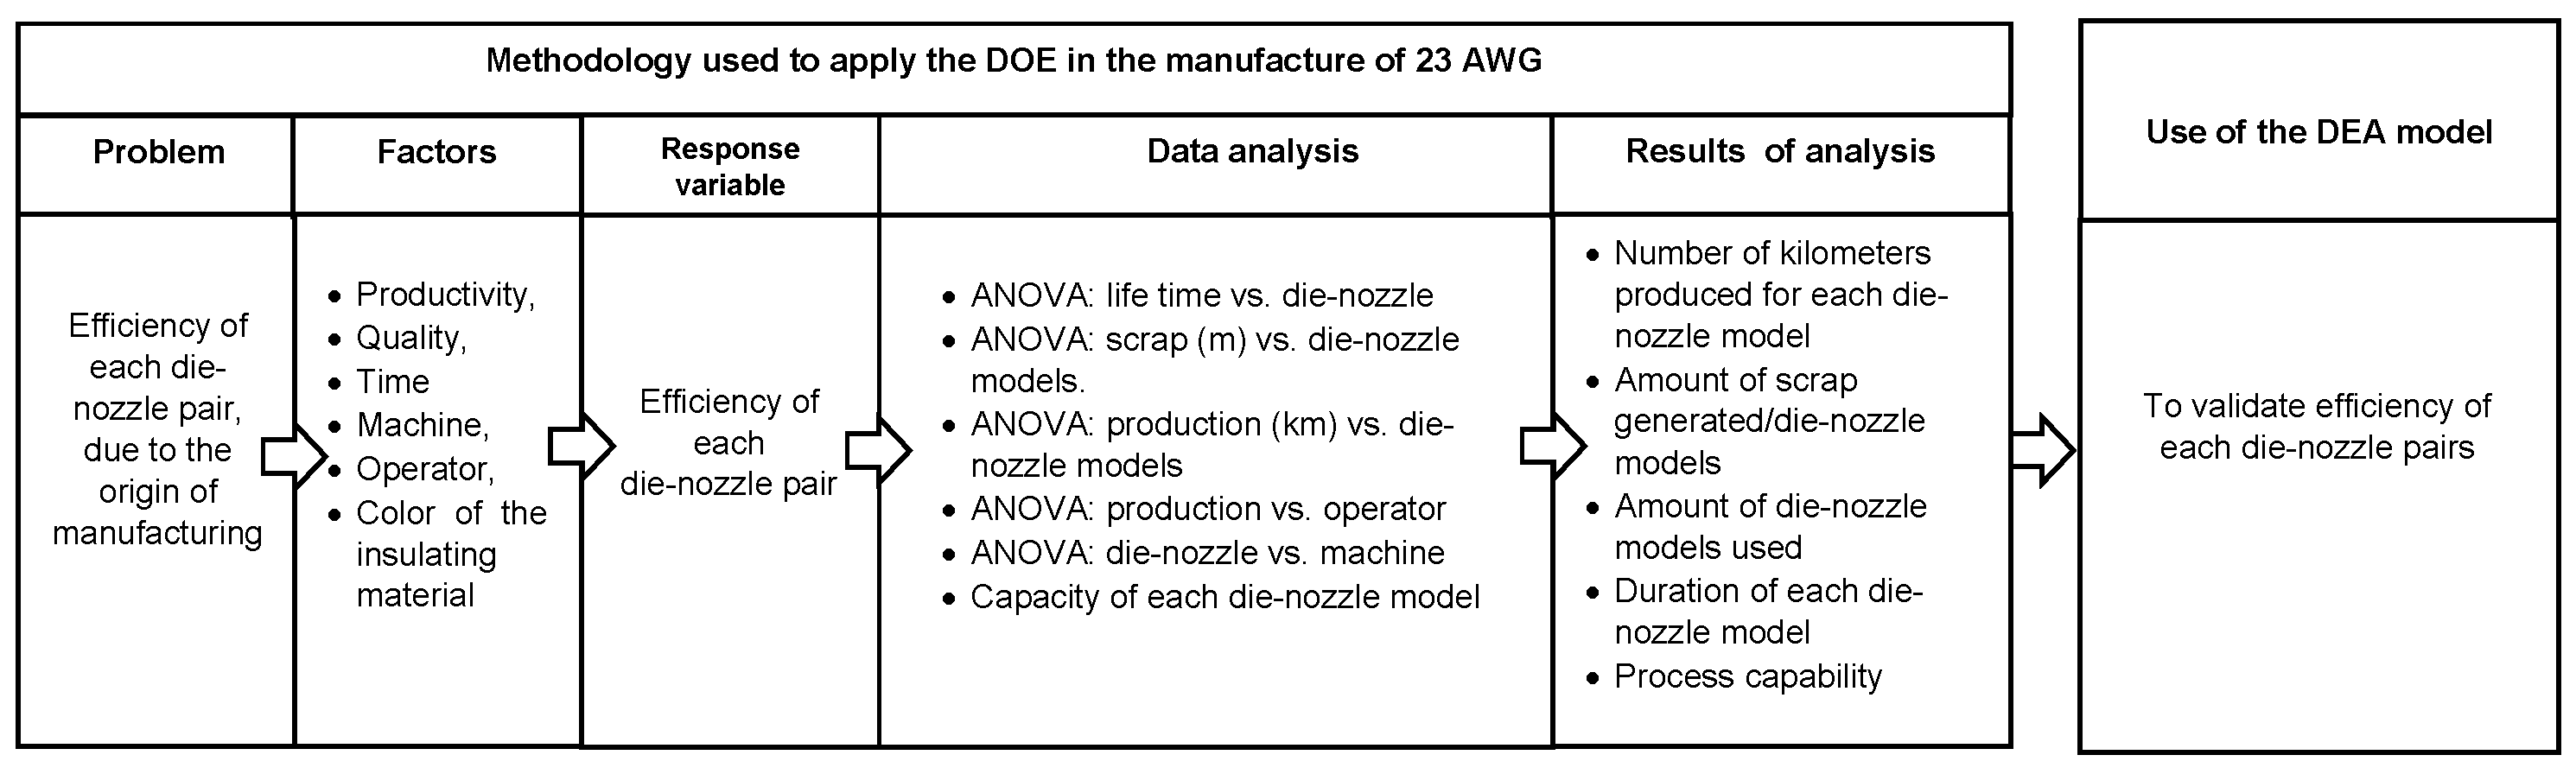
DEA is an operational research technique focused on measuring and analyzing the efficiency with which goods and services are produced. Its main applications have been in sectors such as finance, health, services, education or to measure the effectiveness of organizational indicators [11].
DEA is a relatively new data-oriented approach for evaluating the performance of a set of peer entities called Decision Making Units (DMUs) which convert multiple inputs into multiple outputs. The definition of a DMU is generic and flexible. Recent years have seen a great variety of applications of DEA for use in evaluating the performance of different kinds of entities engaged in different activities in certain contexts in lots of countries [12].
To differentiate and rank the performance of efficient DMU, [13] proposed the concept of super-efficiency. DEA is capable of transforming a productive situation in which diverse resources generate multiple products in a single index of efficiency. This index is identified with the value that maximizes the quotient between the weighted sum of the outputs and the weighted sum of the inputs of the entity analyzed, to estimate the level of relative efficiency of a company or production unit with respect to the rest of the units that are evaluated simultaneously, making the best use of resources. It provides useful information to improve efficiency by providing tools establishing which cases do not use resources efficiently and which are the recommendations on the use of resources to improve the efficiency of the organization [14].
Analyzing the performance of a set of homogeneous items is very important in the manufacturing processes. Parametric and non-parametric methods are proposed for evaluating the performance of DMUs. DEA is one of the most famous and applicable parametric techniques in this field. It has many applications for interpreting the productivity of complex systems manufacturing [15]. In this project, we made an extensive review covering the literature from 2000 to 2019 and several analyses about DEA. [16] applied the DEA in the design of production lines. In [17], due to advances in data collection systems and analysis tools, data mining (DM) applied DEA and Quality Improvement (QI), in manufacturing. In [18], it is demonstrated how the DEA model might be useful to screen training data so a subset of examples that satisfy the monotony property can be identified. They used real-world health care and software engineering data, managerial monotony assumption, and Artificial Neural Network (ANN) as a forecasting model. [19] used DEA and an analytic hierarchy process (AHP) to measure the performance of ball valve production. In [20], taking into account non-operational factors, the DEA was proposed to measure the technical efficiency, scale efficiency and pure technical efficiency of innovation in Semiconductor industry of China. [21] analyzed the effect of reducing energy savings on the efficiency of innovation and performed the DEA and Tobit regression analysis. This was in agreement with [22], who developed for the Chinese Government a model on the allocation of carbon emission reduction quotas through DEA. [23] established improved manufacturing methods using DEA. In addition, [24] studied recent advances and trends in predictive manufacturing systems in big data environments using DEA. Table 1 illustrates the 23-AWG wire. We intend to analyze the performance of a 3DND die-nozzle model of Mexican manufacturing versus four foreign-made die-nozzle models, and its impact on the variation in the thickness of the insulation to determine the capability and performance of the process of each die-nozzle model, with the range of ±0.06 mm for a base dimension of 0.58 mm.

2. Methodology

The project was carried out in a manufacturing industry supplier of the automotive sector, in the City of Queretaro, Mexico. The name of the company is not mentioned for reasons of confidentiality. What follows is a census of data was made in the process of extrusion of insulating material in 23-AWG wire. The results were compared vs. the manufacturing standards of each die-nozzle models. Figure 2 depicts the representation of die-nozzle, one manufactured domestically and four imported. Figure 3 shows the tooling code. The data processing was computed by using Minitab v18® [25].
The manufacture of the 23-AWG wire is ordered in production lines depending on the color of the insulation. The reason for this arrangement is due to the optimization of spaces and the simplification of machine cleaning when a color change of the insulation is made in the manufacturing process [26].
  • Line A where the colors black, red, brown and blue are processed.
  • Line B with the colors orange, green, yellow and violet.
  • Line C that processes the colors white, gray, beige and pink.
There is a total of five work stations in the company, each station is composed of a machine and peripheral equipment, each line produces only four different colors of insulation, the company works four shifts, for the present work the operators of the machines were the same during the whole period of data census. The production of the drivers is subject to market demand, which is the availability of tools of different die-nozzle models. The difference between each die- nozzle pair is defined in the diameter and the material, gibr models of die-nozzle were used, then the manufacturing origin of each model is specified as follows:
  • 1DNL: die-nozzle of german manufacturing, diameter: 0.60 mm, material: DIN 420.
  • 2DNV: die-nozzle of USA manufacturing, diameter: 0.58 mm, material: ASTM (AISI) 316Ti.
  • 3DND: die-nozzle of mexican manufacturing, diameter: 0.59 mm, material: ASTM (AISI) 420.
  • 4DNK: die-nozzle of australian manufacturing, diameter: 0.58 mm, material: BSI 316S.
  • 5DNS: die-nozzle of japanese manufacturing, diameter: 0.60 mm, material: JIS (SUS 304).
Figure 4 presents the methodology used to apply the DOE and validation with the DEA Model.
The population that is the object is constituted by the production data for 23-AWG wire: machines, operators, shifts, colors, meters of cable produced, meters of scrap and die-nozzle models that are used for a 23-AWG wire. By convenience sampling, it was determined that the sample would be a proportion of the production from January to June 2018 for the analysis of: Production volume and scrap, variable production vs. die-nozzle quantity, analysis of the production, machine and operator, Key Performance Indicator (KPI) analysis, determination of process capacity indexes, result of analysis and calculation of sigma level [27].
The data available for this investigation correspond to the production history from January to June 2018 (see Table 2), which were registered according to the internal procedures of the company and registered by the production staff directly at the work stations, the data resources correspond to the electrical conductor manufacturing records.
Due to the manufacture efficiency of the 23-AWG wire can be measured through three indicators: its lifetime, the amount of wire manufactured, and the amount of wire’s scrap generated. These indicators were measured during six months for 5 different manufacturing models in order to determine if there was a change at manufacture efficiency of the 23-AWG. However, manufacturing model is not the only factor can affect manufacture efficiency of the 23-AWG wire. Several noisy factors such as: machine, operator, supervisor, shift and, color can alter the manufacturing efficiency [28].
In this way, the following expression can be used to modeling the changes in the manufacturing efficiency:
E = δ M o d e l + δ M a c h i n e + δ O p e r a t o r + δ S h i f t + δ C o l o r + ε
where: δ i is the effect of the factor into the manufacture efficiency and N ( 0 , σ 2 ) . Nevertheless, as a result of quality control of the company the previous model can be reduced as follows:
E = δ + δ M o d e l + ε
where: N ( 0 , σ 2 ) with σ < γ . Therefore, the effect of the model can be explored by using a 1-way ANOVA. In Table 2 is presented the measures of the three indicators for every model during the 6-months period and, Figure 5 shows the data analysis workflow. Table 3 presents number of km produced by cable vs. the number of die-nozzles/month, used for each production line.

DEA Model

The concept of efficiency is related to the economy of resources, efficiency is often defined as the relationship between the results obtained (outputs) and the resources used (inputs). Numerically, an efficiency score can be obtained as a relation between output and input, called technical efficiency. DEA uses linear programming models to determine weights and calculate the efficiency score for each DMUs [29,30]. The only requirements are that the DMUs convert inputs into outputs, both similar and quantifiable. Simultaneously, the multiple inputs and outputs are analyzed in their natural physical units instead of having to convert them to a common denominator [31].
It is assumed that if a die-nozzle DMU, named d i e - n o z z l e 1 can produce or generate Y 1 output units with X 1 input units, then other die-nozzle must also be able to do the same if they are operated efficiently. Similarly, if d i e - n o z z l e 2 can produce Y 2 output units with X 2 input units, then the other die-nozzle must also be able to do the same. D i e - n o z z l e 1 and d i e - n o z z l e 2 can be combined to generate a die-nozzle composed of inputs and outputs of them. This virtual die-nozzle is used as a standard of performance for the die-nozzle.
Equation (3) describes the mathematical model of DEA. It allowed to validate the results obtained in the analysis of the performance of the five die-nozzle types. See Section 3.7 Computational results of the DEA model.

Formulation of DEA Model for Die-Nozzle Pairs

min θ * , Subject to j = 1 , j 0 n λ j x i j θ * x i o for i = 1 , 2 , , m ; j = 1 , j 0 n λ j y r j y r o for r = 1 , 2 , , s ; λ j 0 for j 0 ; j 0 n λ j 1 .
where: D M U 0 represents one of the n DMUs under evaluation, and x i o and y r o are the i t h input and r t h output for D M U 0 , respectively. To rate the performance of a particular die-nozzle pair, DEA forms a weighted average of all the observations. The average represents a composite die-nozzle pair. The weights are to be determined so that the composite die-nozzle pair is located on the frontier. It represents best practice. The actual die-nozzle pair at hand is then compared with its best practice. Denoting the weights to be attached to a particular die-nozzle pair by λ j . The inputs and outputs for this model are indicated in Table 4. In Table 4, the inputs and outputs of the DMUs are determined, the meaning of these is as follow:
  • Productivity: meters produced with a specific die-nozzle pair/total meters by period (%).
  • Machine: numbers of machine-hours used with a specific die-nozzle pair/total of machine hours/period (%).
  • Time: time in hours using a specific die-nozzle pair/total of hours by period (%).
  • Cpk: capability process index.

3. Results 23-AWG Production Process

Based on production of 23-AWG, statistical information was given to the information collected for the development of the proposed methodology. The analysis was carried out from January–June 2018. Table 5 presents ANOVA duration vs. die-nozzle model. Table 6 presents the the results of the ANOVA for the three variables: duration, volume of production, and volume of scrap, it can be seen that the value P t e s t is limited to a precision of only 1 thousandth, so any value less than this amount is presented as 0.000 [32]. In this case, it can be observed that there is a significant difference in the average duration of at least two die-nozzle models, with a value of significance α = 0.05 [33]. The results established that the 3DND and 1DNL models are the longest, so they produce more meters of cable than the others.

3.1. Results of Volume vs. Scrap

In Table 6 P t e s t = 0.011 <( α ) 0.05, therefore, it can establish that there is a significant difference in the average duration of at least two die-nozzle models.
Table 7A shows the Tukey test, which allowed identifying that the 1DNL and 3DND models have the longest duration and that the 3DND model has an average duration of 2.8 ± 0.4 days. It was also verified that there is a significant difference in the production of cable and scrap between die-nozzle models. Moreover, Table 7B displays the Tukey test results for each indicator and presents two different groups for production: A(5DNS, 3DND, 4DNK and 2DNV) and B(1DNL), where model group A has higher production that model group B. Finally, Table 7C points to three different groups for scrap: A(5DNS and, 2DNV), AB(4DNK and, 1DNL) and, B(3DND), where model group B presents the lowest scrap generated and two different groups of models for lifetime: A (3DND and 1DNL) and B(2DNV, 5DNS and, 4DNK), where model group A has higher lifetime than model group B [34].

3.2. Results of Data Analysis

The results of the data analysis of the three production lines with the monthly data of the period under study demonstrates the behavior of the operating variables included in the performance evaluation affects the die-nozzle pair, illustrates for this case [35]. Table 2A shows that average life. Table 2B displays the average km of electrical conductor produced with each die-nozzle model. Table 2C shows the scrap generated [36]. To validate the employed model, graphical analysis was run. Figure 5 describes the evidence, which is often an assumption, randomness and, homogeneity of variance were accurate for each ANOVA analysis.
In Figure 5 and Figure 6, no significant outliers that affect the normality assumption were detected. A homogeneous variance is maintained in all die-nozzle models.
The results of the statistical analysis applied to the variables of die-nozzles against the production, for each production line, allowed to identify that there is a difference in the production rate between the lines [37]. This is attributed to a dye effect since the production is divided between the lines according to the color of the cable. The dye in the polymers can be obtained using pigments which are inorganic materials, or using dyes which are organic compounds. On the other hand, the tonality is a function of the chemical compound used. In production Line A, the blue dye has a formulation of cobalt aluminate (cobalt oxide and aluminum oxide), which is an abrasive compound, and for the violet which belongs to the group of the production Line B, its formulation is di oxazine (Tetrachloride 1, 4-Benzoquinone), which is a corrosive compound. As can be seen, the composition of the dye formula affects the mechanical elements differently [38].
The results in Table 8, F t e s t = 28.66 , F t a b l e = 2.76 , and P t e s t = 0.000 < 0.05 = α , show that there is a significant difference, with a value of significance α = 0.05 in the average duration of at least two die-nozzle models.

3.3. Results of Analysis Machine, Production and Operator

Finally, in this case, a behavior similar to that of the Production Lines A and B are observed. The order of origin is not significant. Then, it can be excluded from the model. The coefficients of determination are close to 100%. So, it can be concluded that the production in Line C increases at a rate of 416 ± 28 km per die-nozzle unit. Similarly, the regression analysis is performed for the scrap variable, the results are presented in computational results of the DEA. Figure 5 and Figure 6 are presented these results, which were compared with the proposed methods in [39,40]. Table 9 exemplified the results of ANOVA for machine and operator.
In Table 10, it is observed in the results F t e s t = 129.74 > F T a b l e = 3.10, therefore, in terms of the value P t e s t shows that P t e s t = 0.000 <( α ) 0.05, there is a significant difference that at least one operator produces more units/period.

3.4. Key Performance Indicator (KPI) Analysis

The performance indicators were calculated using the data of Table 3B. Table 11 presents the concentration of results the performance indicators for each die-nozzle models.

3.5. Determination of Process Capacity Indexes

The significant values of this analysis are Cp = 1.59, Pp = 1.09, Cpk = 1.26, and PPM = 4726.1 (parts/million) of allowed defects. In Table 12, the results are presented in die-nozzle models, the best results were from the model 3DND the die-nozzle of Mexican manufacturing [41].
It is essential to emphasize that the natural variability of the process, 6 σ , is intrinsic to it and independent of the tolerances assigned. Therefore, if 6 σ is less than the range of tolerances to be met, some manufactured products are out of tolerance and non-compliant. If this fact is not taken into account and it is intended to correct based on the readjustment of the process, i.e., modify the centering, the only thing that is achieved is to increase its variability. It can be thought that the process is out of control or unstable in the die of non-Mexican manufacturing because of the variations are caused by somewhat unpredictable behavior. In Table 13 and Table 14, it is observed that the 3DND model that shows the production process is control C p k > 1 , the other models presents variability, C p k < 1 , that does not necessarily imply obtaining products outside of specification. The 3DND model process control allows establishing that the objectives of the project are being met through regular monitoring and measurement of its progress to identify planned variations [42].

3.6. Result of Analysis and Calculation of Sigma Level

Sigma level indexes of the process are calculated using dimensional data from the die-nozzle. Table 13 indicates the results of the Sigma level analysis for each model die-nozzle. With the analysis of the level of Sigma, the significant results are Z (level of Sigma), PPM and Cpk [36].
It is observed that the 1DNL and 3DND models have the highest levels of sigma, of 2.08 and 3.79 respectively. For these die-nozzle models, the Cpk indexes were 0.73 and 1.26. Those of Cp were 1.59 and 0.80, and the Pp were 1.09 and 0.80 respectively, so these die-nozzle models are the closest ones to the reference established by the norm. For that reason, they are the best capacity and ability of the process, in that order. Models 2DNV, 4DNK, and 5DNS resulted in levels lower than what is specified by the Standard for Electrical Products-Conductors-Wires and cords with PVC insulation 105 C, for Electronic Uses-Specifications (NMX-J-429-ANCE-1994) [19].

3.7. Computational Results of the DEA Model

To carry out the calculations, the DEA FrontierTM software was used, which is an Excel.
DEA FrontierTM uses the Excel solver as the engine to solve DEA models and was used to solve the DEA super efficiency-oriented model to inputs with NDRS [29,30].

4. Discussion and Conclusions

4.1. Discussion

Based on the results obtained by statistical analysis, it can be mentioned that the manufacturing process of 23-AWG wire presented the best performance in terms of the defined variables and results obtained through the DOE. The Cpk of 1.26 allowed to verify that the process with the 3DND model is the most stable compared to the models of this foreign-made die. As for the scrap it generates, the 3DND model was the one with the best performance, as well as the average hours of use, and the second-best performance in terms of total km produced. Being in this last point the model 2DNV the one of better performance. It is proven that through the application of the DOE and process optimization significant results were achieved in continuous improvement for any product or process. In [37] applied the SPC, DOE and Six Sigma in the manufacture of electrical circuits achieving a significant decrease in manufacturing defects. Also many success stories in different scenarios or organizations used the application of statistical tools and techniques improvements are established. Successful cases: In accordance with [6], proposed rapid modeling and optimization of manufacturing processes based on DOE. In [7] is described how processes can be optimized efficiently and how DOE findings may be applied to scale-up. Others [8], used the DOE to improve the manufacturing results in engines. In [9], through DOE it was able to establish critical parameters associated with the processes an indefinite number of success stories in the application of the DOE. The JIT, such as philosophy developed at Toyota and its different methods and systems have served as an example for many organizations to establish continuous improvement, this is a reference for any. In [38], established the methodology allowed the identification of variables that influenced the risk. Davim mentioned that the approach is based on a combination of Techniques of Taguchi and ANOVA [36]. The Statistical Process Control (SPC) is a solution developed to easily collect and analyze data, allowing performance monitoring as well as achieving sustainable improvements in quality which in turn allows increasing the profitability [35]. Based on [36] has proposed a new paradigm in the application of different techniques and improvement tools that imply: Quality, Cost, and Delivery (QCD), and this is to combine techniques and tools already tested as SPC and DOE, with other models in our case the DEA. For [29,30], DEA it is an extremely powerful tool that can assist decision-makers in benchmarking and analyzing complex operational performance issues in manufacturing organizations as well as evaluating processes in banking, retail, franchising, health care, public services, and many other industries. Rau through a combination of SPC and DEA, optimal solutions were introduced in different processes [37].

4.2. Conclusions

ANOVA, with a level of significance α = 0.05 , was performed on the variables: durability, production, and scrap. These analyses demonstrated that there is a significant difference in the average duration between die-nozzle models. The Tukey test identified that the 1DNL and 3DND models have greater durability. The 3DND model has average durability of 2.8 ± 0.4 days. It was also verified that there is a significant difference between cable and scrap production of all die-nozzle models [29,30].
With the results of the statistical analysis previously described, it is justified that the variables: durability, production, scrap, the color of the insulator, machine, and operator, are considered relevant for the calculation of the performance indicators due to the influence of the die-nozzle pairs, the 3DND model is the best performer in terms of the generated scrap [38,39].
Therefore, the results demonstrated that there is an effect of the model of die-nozzle on the variables. The performance is calculated individually with the method of the cable manufacturer, where the result indicates that the models 1DNL = 81.2% and 3DND = 80.2%, are those with the highest performance indicators [40].
The second phase was carried out applying formal tools of Total Quality Management: Benchmarking, Statistical Process Control and DOE. It was obtained that the 3DND and 1DNL models have a σ level of 3.79 and 2.08. Their indicators Cpk = 1.26, 0.73, Cp = 1.59, 0.80, and Pp = 1.09, 0.80 respectively, so these die-nozzle models are the most approach the references established by the norm, for that reason, they are the best in the capability of the process, in that order [41].
The indicators of performance under the criterion of the analysis of the company evaluate in percentages the factors considering a higher weight to three of the six: productivity, quality and time, obtaining like the result the following order of performance of the die-nozzle models 1DND, 4DNK, 2DNV, and 5DNS. The results of the Statistical Process Control and Six Sigma are based on the evaluation of the variability of the measurements of the finished product and the scrap volume generated, obtaining, as a result, the following order: 3DND, 1DNL, 2DNV, 4DNK, and 5DNS, which It is different because different criteria are used. However, it is observed that the models with the best performance are those that have the highest indicators of processes capability. Therefore, the Manufacturing Company could be used the method of Statistical Control and DOE to evaluate the performance of the die-nozzle pairs [42]. Other authors have applied different statistical techniques and have proposed a routine for evaluated the failure rate and inspection intervals using the first-order reliability method (FORM + Fracture) to alleviate the computational cost of probabilistic defect-propagation analysis. The proposed method is one of the first applying reliability concepts to additive manufacturing (AM) components [1]. It is proven that significant improvements can be generated through the systematic application of the TQM process [2]. With the use and application of statistical analysis, reductions in manufacturing, inspection, materials or methods costs can be achieved [43]. The concept of additive manufacturing [7], will be very useful for the optimization of processes in all types of components.
With the results obtained using the DEA model of Super Efficiency oriented to inputs with non-decreasing returns to scale, the same conclusions were obtained as those obtained through Statistical Process Control and DOE, so that the order of preference of the die-nozzle models is as follows: 3DND, 1DNL, 2DNV, 4DNK, and 5DNS [32,33]. The methods to optimize the design proposed in [1] were very useful for following work in the improvement of tooling and manufacturing processes. By an early control such as that proposed in [2], substantial improvements in the manufacture of electrical conductors and other products can be achieved. In the present project, it is very useful to compare the use of ANOVA in [3,4], to improve the proposed method of analysis. Through optimizing other variables such as those mentioned in [5,6] it is possible to generate substantial improvements that will be taken into account in future work in the optimization of manufacturing processes. It can be concluded that DEA model is a method that can be of great help, and although it will not replace the DOE, if it allows manufacturing companies to perform analysis and process improvements in a faster way.
In the informed literature, there are no application cases to measure the efficiency of the production lines in the manufacturing sector of electrical conductors [28]. With this study, the objective established in the present work was fulfilled.

Author Contributions

Conceptualization, M.A.Z.-A. and J.R.-R.; methodology, J.C.-S.; software, J.A.A.-C.; validation, C.A.G.-G., N.M.-L., and J.R.-R.; formal analysis, J.A.A.-C., J.C.-S., and M.A.Z.-A; investigation and visualization, J.A.G.-D., J.A.A.-C. and J.R.-R.; data curation, J.R.G.-M., W.J.P.-G., and M.A.Z.-A.; writing—original draft preparation; writing—original draft, review, and editing, all the authors.

Funding

This research was partial funded by CONACYT and PRODEP.

Acknowledgments

The authors thank CONACYT for the academic scholarship for CVU No 573233. We appreciate the support of Centro de Investigación en Ciencia Aplicada y Tecnología Avanzada del Instituto Politécnico Nacional (CICATA), Unidad Querétaro. Especially for Master Jorge Cruz Salinas, who was the project leader and main author of the design of the method of validation of die-nozzle tooling, that allowed the project development, and for his dedication to obtaining a Master’s Degree in Advanced Technology. We also thank National Research Vice Rectory of UVM-Mexico, for the support provided. The authors recognize in a special way PhD. Ivan Domínguez López and Adrián Luis García García, for the advice provided during the development of the project. The authors appreciate Master Rodrigo Pinto Castillo and César Javier Ortíz Echeverri for his support during the revision of the project.

Conflicts of Interest

The authors declare no conflict of interest.

References

  1. Ambühl, S.; Kramer, M.; Sørensen, J. Reliability-based structural optimization of wave energy converters. Energies 2014, 7, 8178–8200. [Google Scholar] [CrossRef]
  2. Mejia-Parra, D.; Sánchez, J.R.; Ruiz-Salguero, O.; Alonso, M.; Izaguirre, A.; Gil, E.; Palomar, J.; Posada, J. In-Line Dimensional Inspection of Warm-Die Forged Revolution Workpieces Using 3D Mesh Reconstruction. Appl. Sci. 2019, 9, 1069. [Google Scholar] [CrossRef]
  3. Nguyen, H.T.; Hsu, Q.C. Surface roughness analysis in the hard milling of JIS SKD61 alloy steel. Appl. Sci. 2016, 6, 172. [Google Scholar] [CrossRef]
  4. Costa, A.; Cappadonna, F.; Fichera, S. A hybrid metaheuristic approach for minimizing the total flow time in a flow shop sequence dependent group scheduling problem. Algorithms 2014, 7, 376–396. [Google Scholar] [CrossRef]
  5. Ambühl, S.; Kramer, M.; Dalsgaard Sørensen, J. Structural reliability of plain bearings for wave energy converter applications. Energies 2016, 9, 118. [Google Scholar] [CrossRef]
  6. Arbogast, G.W. A case study: Statistical analysis in a production quality improvement project. J. Qual. Manag. 1997, 2, 267–277. [Google Scholar] [CrossRef]
  7. Coro, A.; Macareno, L.M.; Aguirrebeitia, J.; López de Lacalle, L.N. A Methodology to Evaluate the Reliability Impact of the Replacement of Welded Components by Additive Manufacturing Spare Parts. Metals 2019, 9, 932. [Google Scholar] [CrossRef]
  8. Umeda, S.; Nakano, M.; Mizuyama, H.; Hibino, N.; Kiritsis, D.; Von Cieminski, G. Advances in Production Management Systems: Innovative Production Management towards Sustainable Growth: IFIP WG 5.7 International Conference, APMS 2015; Springer: Berlin/Heidelberg, Germany, 2015; Volume 459, pp. 7–9. [Google Scholar]
  9. Boning, D.S.; Mozumder, P. DOE/Opt: A system for design of experiments, response surface modeling, and optimization using process and device simulation. IEEE Trans. Semicond. Manuf. 1994, 7, 233–244. [Google Scholar] [CrossRef]
  10. Weissman, S.A.; Anderson, N.G. Design of experiments (DoE) and process optimization. A review of recent publications. Org. Process Res. Dev. 2014, 19, 1605–1633. [Google Scholar] [CrossRef]
  11. Khan, M.A.; Husain, I.; Islam, M.R.; Klass, J.T. Design of experiments to address manufacturing tolerances and process variations influencing cogging torque and back EMF in the mass production of the permanent-magnet synchronous motors. IEEE Trans. Ind. Appl. 2013, 50, 346–355. [Google Scholar] [CrossRef]
  12. Rowlands, H.; Antony, J. Application of design of experiments to a spot welding process. Assem. Autom. 2003, 23, 273–279. [Google Scholar] [CrossRef]
  13. Andersen, P.; Petersen, N.C. A procedure for ranking efficient units in data envelopment analysis. Manag. Sci. 1993, 39, 1261–1264. [Google Scholar] [CrossRef]
  14. Khezrimotlagh, D.; Chen, Y. Decision Making and Performance Evaluation Using Data Envelopment Analysis; Springer: Berlin/Heidelberg, Germany, 2018; Volume 269, pp. 217–234. [Google Scholar]
  15. Koksal, G.; Batmaz, İ.; Testik, M.C. A review of data mining applications for quality improvement in manufacturing industry. Expert Syst. Appl. 2011, 38, 13448–13467. [Google Scholar] [CrossRef]
  16. Pendharkar, P.C. A data envelopment analysis-based approach for data preprocessing. IEEE Trans. Knowl. Data Eng. 2005, 17, 1379–1388. [Google Scholar] [CrossRef]
  17. Naghiha, S.; Maddahi, R.; Ebrahimnejad, A. An integrated AHP-DEA methodology for evaluation and ranking of production methods in industrial environments. Int. J. Ind. Syst. Eng. 2019, 31, 343–359. [Google Scholar] [CrossRef]
  18. Li, H.; He, H.; Shan, J.; Cai, J. Innovation efficiency of semiconductor industry in China: A new framework based on generalized three-stage DEA analysis. Socio-Econ. Plan. Sci. 2019, 66, 136–148. [Google Scholar] [CrossRef]
  19. Shin, J.; Kim, C.; Yang, H. Does Reduction of Material and Energy Consumption Affect to Innovation Efficiency? The Case of Manufacturing Industry in South Korea. Energies 2019, 12, 1178. [Google Scholar] [CrossRef]
  20. Emrouznejad, A.; Yang, G.L.; Amin, G.R. A novel inverse DEA model with application to allocate the CO2 emissions quota to different regions in Chinese manufacturing industries. J. Oper. Res. Soc. 2019, 70, 1079–1090. [Google Scholar] [CrossRef]
  21. Kamarudin, N.F.; Rani, R.M.; Halim, F.A. Improving the Food Manufacturing System by Using Simulation and DEA. In Proceedings of the Third International Conference on Computing, Mathematics and Statistics (iCMS2017); Springer: Singapore, 2019; pp. 555–561. [Google Scholar] [CrossRef]
  22. Liu, G.; Zhou, Z.; Qian, X.; Wu, X.; Pang, W. Multidisciplinary design optimization of a swash-plate axial piston pump. Appl. Sci. 2016, 6, 399. [Google Scholar] [CrossRef]
  23. Ammons, D.N.; Roenigk, D.J. Benchmarking and interorganizational learning in local government. J. Public Adm. Res. Theory 2014, 25, 309–335. [Google Scholar] [CrossRef]
  24. Thue, W.A. Electrical Power Cable Engineering; CRC Press: Boca Raton, FL, USA, 2012. [Google Scholar]
  25. MINITAB. Computer Program Manual; Software; MINITAB: State College, PA, USA, 2014. [Google Scholar]
  26. Yang, Y.; Cao, J. Solving quadratic programming problems by delayed projection neural network. IEEE Trans. Neural Netw. 2006, 17, 1630–1634. [Google Scholar] [CrossRef] [PubMed]
  27. Tai, Y.T.; Pearn, W.L.; Kao, C.-M. Measuring the Manufacturing Yield for Processes with Multiple Manufacturing Lines. IEEE Trans. Semicond. Manuf. 2012, 25, 284–290. [Google Scholar] [CrossRef]
  28. Xiao, R.; Liu, B.; Shen, J.; Guo, N.; Yan, W.; Chen, Z. Comparisons of energy management methods for a parallel plug-in hybrid electric vehicle between the convex optimization and dynamic programming. Appl. Sci. 2018, 8, 218. [Google Scholar] [CrossRef]
  29. Zhu, J. Super-efficiency and DEA sensitivity analysis. Eur. J. Oper. Res. 2001, 129, 443–455. [Google Scholar] [CrossRef]
  30. Zhu, J. Quantitative models for performance evaluation and benchmarking: Data envelopment analysis with spreadsheets. Int. Ser. Oper. Res. Manag. Sci. 2014, 213, 175–205. [Google Scholar] [CrossRef]
  31. Andreadou, N.; Lucas, A.; Tarantola, S.; Poursanidis, I. Design of Experiments in the Methodology for Interoperability Testing: Evaluating AMI Message Exchange. Appl. Sci. 2019, 9, 1221. [Google Scholar] [CrossRef]
  32. Han, C.; Sin, I.; Kwon, H.; Park, S. The Role of the Process and Design Variables in Improving the Performance of Heat Exchanger Tube Expansion. Appl. Sci. 2018, 8, 756. [Google Scholar] [CrossRef]
  33. Lou, P.; Yuan, L.; Hu, J.; Yan, J.; Fu, J. A Comprehensive Assessment Approach to Evaluate the Trustworthiness of Manufacturing Services in Cloud Manufacturing Environment. IEEE Access 2018, 6, 30819–30828. [Google Scholar] [CrossRef]
  34. Yaste, R.E.; Budrow, R.B. Void-Free Electrical Conductor for Power Cables and Process for Making Same. US Patent 4,319,074, 1982. [Google Scholar]
  35. Realyvásquez-Vargas, A.; Arredondo-Soto, K.; Carrillo-Gutiérrez, T.; Ravelo, G. Applying the Plan-Do-Check-Act (PDCA) Cycle to Reduce the Defects in the Manufacturing Industry. A Case Study. Appl. Sci. 2018, 8, 2181. [Google Scholar] [CrossRef]
  36. Dyck, T.; Bund, A. Influence of the Bead Geometry and the Tin Layer on the Contact Resistance of Copper Conductors. IEEE Trans. Compon. Packag. Manuf. Technol. 2018, 8, 1863–1868. [Google Scholar] [CrossRef]
  37. Kilickap, E.; Yardimeden, A.; Çelik, Y.H. Mathematical Modelling and Optimization of Cutting Force, Tool Wear and Surface Roughness by Using Artificial Neural Network and Response Surface Methodology in Milling of Ti-6242S. Appl. Sci. 2017, 7, 1064. [Google Scholar] [CrossRef]
  38. Sorensen, D.G.H.; Brunoe, T.D.; Nielsen, K. A classification scheme for the processes of the production system. Procedia CIRP 2018, 72, 609–614. [Google Scholar] [CrossRef]
  39. Yang, C.M.; Lin, K.P.; Chen, K.S. Confidence Interval Based Fuzzy Evaluation Model for an Integrated-Circuit Packaging Molding Process. Appl. Sci. 2019, 9, 2623. [Google Scholar] [CrossRef]
  40. Godina, R.; Pimentel, C.; Silva, F.; Matias, J.C. Improvement of the Statistical Process Control Certainty in an Automotive Manufacturing Unit. Procedia Manuf. 2018, 17, 729–736. [Google Scholar] [CrossRef]
  41. Amasaka, K. Applying New JIT, a management technology strategy model at Toyota-Strategic QCD studies with affiliated and non-affiliated suppliers. Int. J. Prod. Econ. 2002, 80, 135–144. [Google Scholar] [CrossRef]
  42. Rau, H.; Wu, C.H.; Shiang, W.J.; Huang, P.T. A decision support system of statistical process control for printed circuit boards manufacturing. In Proceedings of the 2010 International Conference on Machine Learning and Cybernetics, Qingdao, China, 11–14 July 2010; Volume 5, pp. 2454–2458. [Google Scholar] [CrossRef]
  43. Coro, A.; Abasolo, M.; Aguirrebeitia, J.; de Lacalle, L.L. Inspection scheduling based on reliability updating of gas turbine welded structures. Adv. Mech. Eng. 2019, 11. [Google Scholar] [CrossRef] [Green Version]
Figure 1. Schematic cutting of the die-nozzle composite head.
Applsci 09 03965 g001
Figure 2. Representation die-nozzle.
Applsci 09 03965 g002
Figure 3. Tooling code for industrial protection purposes.
Applsci 09 03965 g003
Figure 4. Explain the steps to apply the proposed methodology, data analysis through ANOVA and validation of results with DEA model.
Applsci 09 03965 g004
Figure 5. Graphical analysis of residuals of the ANOVA contrast of the model vs. scrap.
Applsci 09 03965 g005
Figure 6. Graphical analysis of the lifetime vs. model.
Applsci 09 03965 g006
Table 1. Features of 23-AWG wire.
AWGDiameter (mm)Section mm 2 Number of Turns/cmkg/kmResistance ( Ω /km)Capacity (A)
230.580.2616.02.2956.40.73
Table 2. Collected data from January to June 2018.
A. Average life duration in hours per month for each die-nozzle model
ModelJanuaryFebruaryMarchAprilMayJune
1DNL586057636680
2DNV534861455650
3DND626456737669
4DNK394644513743
5DNS493654404738
B. Average production per unit in meters per month
for each model of die and nozzle
ModelJanuaryFebruaryMarchAprilMayJune
1DNL719,368699,942769,032783,215694,142793,167
2DNV879,598759,975869,432779,216865,774894,302
3DND689,050659,920679,106746,627653,511696,131
4DNK798,534789,231898,535899,477775,281892,387
5DNS899,506799,926877,924895,685864,309894,033
C. Amount of average scrap per unit in meters, generated each month
for each model of die and nozzle, used in the extrusion process
ModelJanuaryFebruaryMarchAprilMayJune
1DNL73667620723980018382101,607
2DNV9129826810,507775196468613
3DND640266085782753778477124
4DNK749388388454979871098661
5DNS10,161746611,198829597477880
Table 3. Number of km produced by cable vs. the number of die-nozzles/month, used for each production line.
Production Line A
JanuaryFebruaryMarchAprilMayJune
Production quantity in km44,88940,45446,73645,65043,64747,956
Number of die-nozzles/month151145152143159138
Production Line B
JanuaryFebruaryMarchAprilMayJune
Production quantity in km44,59739,79445,47647,48743,79446,433
Number of die-nozzles/month124139134121135145
Production Line C
JanuaryFebruaryMarchAprilMayJune
Production quantity in km42,75338,73845,48843,87641,37644,289
Number of die-nozzles/month1087411111211388
Table 4. DMUs definitions.
InputsOutputs
MachineTimeProductivityCpk
Table 5. ANOVA: duration vs. die-nozzle model.
SourceDFSSMSFP
Model42865.5716.415.180.000
Error251179.547.2
Total294045.0
Table 6. ANOVA: scrap (m) vs. die-nozzle models.
SourceDFSSMSFP
Models419,119,3364,779,8344.110.011
Error2529,095,5721,163,823
Total2948,214,907
Table 7. Tukey Test.
A. Tukey Test for Duration
ModelNMeanGrouping
3DBD666.67A
1DBL664A
2DBV652.17B
5DBS644B
4DBK643.33B
B. Tukey Test Production
ModelNProductionGrouping
5DNS6871,897.2A
3DND6860,724.2A
4DNK6842,240.8A
2DNV6841,382.8A
1DNL6743,144.3B
C. Tukey Test for Scrap
NScrapGrouping
5DNS69,124,500A
2DNV68,985,667A
4DNK68,392,167AB
1DNL67,869,167AB
3DND66,883,333B
Table 8. ANOVA:Production volume vs. die-nozzle models.
SourceDFSSMSFP
Model49.88E102.47E1028.660
Error252.15E108.62E8
Total291.20E11
Table 9. Results of ANOVA analysis for the machine and operator variables.
Parameters through ANOVA.
Variable F test F test (table value) P test α
Machine7.393.100.0020.05
Operator129.743.100.0000.05
Table 10. ANOVA: production vs. operator.
SourceDFSSMSFP
Operator322821.27607.1129.740
Error201172.658.6
Total2323993.8
Table 11. Concentration of results of the performance indicators for each die-nozzle models.
ModelPerformance Indicators
ProductivityQualityMachineOperatorTimeColorResults
3DND0.200.130.090.090.270.0481.2%
1DNL0.120.080.100.100.130.0558.7%
2DNV0.220.130.080.080.260.0480.6%
5DNS0.120.080.100.100.140.0559.7%
4DNK0.100.070.100.100.130.0555.1%
Table 12. Summary of the results of the processing capacity of each die-nozzle model.
ModelParameters of Process Capability
Standard DeviationCpCpkPPMPPM General P value
1DNL0.0250.800.7318,93118,4840.431
2DNV0.0230.860.6232,18416,0860.086
3DND0.0011.591.2617,54047260.255
4DNK0.0370.550.52101,85369,8660.736
5DNS0.0250.780.5550,796103,3050.625
Table 13. Summary of sigma level results for each model.
ModelsLevel ZPPMPPM GeneralCpk
1DNL2.0818,93118,4840.73
2DNV1.8532,18416,0860.62
3DND3.7917,54047261.26
4DNK1.27101,85369,8660.52
5DNS1.6450,796.14103,304.560.55
Table 14. DEA model dataset.
InputsOutputs
ModelsMachineTime (s)ProductivityCpk
3DND0.090.270.201.26
1DNL0.010.130.120.73
2DNV0.080.260.220.62
5DNS0.10.140.120.55
4DNK0.10.130.100.52

