Featured Application
The proposed technique has potential for head mounted near-eye VR or AR applications.
Abstract
A fast computer-generated holographic method with multiple projection images for a near-eye VR (Virtual Reality) and AR (Augmented Reality) 3D display is proposed. A 3D object located near the holographic plane is projected onto a projection plane to obtain a plurality of projected images with different angles. The hologram is calculated by superposition of projected images convolution with corresponding point spread functions (PSF). Holographic 3D display systems with LED as illumination, 4f optical filtering system and lens as eyepiece for near-eye VR display and holographic optical element (HOE) as combiner for near-eye AR display are designed and developed. The results show that the proposed calculation method is about 38 times faster than the conventional point cloud method and the display system is compact and flexible enough to produce speckle noise-free high-quality VR and AR 3D images with efficient focus and defocus capabilities.
1. Introduction
A holographic display is a promising candidate for 3D display because the phase and amplitude of a 3D scene can be completely reconstructed. It is possible to implement computer-generated holograms (CGH) for a holographic 3D display [1,2]. High resolution holograms such as rainbow holograms and Fresnel holograms have been proposed [3,4]. Many dynamic holographic display solutions have also been implemented [5,6,7,8,9,10]. Among them, notable frequency domain multiplexing methods are used for color video display through Fresnel hologram with red, green and blue lasers as illumination [7,8]. However, such an optical system is often bulky and the image quality is poor because of the coherent illumination, which affects the practical application of the technology. A lot of efforts have been made, but the progress on the holographic 3D display still has proven difficult due to the following constraints, such as the computational difficulty for the large size of 3D point cloud data, the limited bandwidth of spatial light modulator (SLM), and the speckle noise of the reconstructed 3D images due to the use of coherent illumination sources. The narrow diffraction angle of the current SLM often dictates that the holographic 3D display is restricted to quite small 3D images and narrow viewing angles, with no sign of a significant improvement in the short run.
While these difficulties exist, Virtual Reality (VR) and Augmented Reality (AR) displays have become emerging technologies. In the VR display, the human eye views the virtual image through the display device. However, in the AR display, users can view both real scenes and some virtual images simultaneously [11]. In this technique, the virtual image is displayed in front of the human eye through an optical system and AR eyepiece and ambient light from a real object can pass incident on the human eye through the AR eyepiece without distortion. The combination of holography and VR or AR display to achieve a true 3D display is quite intuitive and thus desirable, which can avoid the accommodation convergence conflict problem existing in binocular parallax-based 3D displays [12,13].
The Fresnel hologram is often chosen to produce 3D displays with large depths of field using a coherent source such as laser as illumination. However, it is not quite suitable for holographic VR or AR display because of the large imaging distance between the reconstructed image and the Fresnel hologram. Additionally, for use of a coherent illumination source, speckle noise of holographic 3D display can also bring a negative impact on image quality.
Several hologram computation methods such as point cloud-based, layer-based, and triangular mesh-based algorithms [14,15,16,17,18,19] have been proposed for speeding up the calculation of the Fresnel hologram. To improve the calculation efficiency, holographic stereogram methods using numerous projection images have been proposed [20,21]. The essence of those methods is to represent the information of one point in the frequency domain by the superimposition of one orthogonal projection image multiplied by the phase of the corresponding direction. Subsequently, the frequency is converted into a spatial domain for an image plane hologram calculation or using Fresnel diffraction for Fresnel hologram calculation. While those methods have merits, a huge number of projected images are required for high-resolution hologram calculation.
In order to achieve an efficient and more compact holographic display system, a hologram calculation method similar to holographic stereogram and an optical display system for holographic near eye VR and AR display are proposed. Within this calculation method, a plurality of images with different angles are projected on a projection plane near the holographic plane. Subsequently, the optical field on the holographic plane is computed by superposition of the convolution of each 2D projected image with specific point spread functions (PSF) corresponding to propagation from the projection plane to the holographic plane in the appropriate directions. Additionally, in order to reduce the speckle noise, LED is chosen as the light source for the optical display system. 4f optical filtering system is utilized for filtering out the unwanted noise. Another lens is used as the eyepiece for VR display and reflective volume holographic optical element (HOE) is used as a combiner for AR display. Overall, the proposed display system is compact and displayed 3D images are free of speckle noise.
2. Methods
The concept of hologram calculation is shown in Figure 1 with two projection planes for ease of explanation since the projection of 3D object is multidirectional. In Figure 1a, A and B are two points in the space, and layer1 and layer2 are two projection planes. On each projection plane, the projected rays from the spatial 3D object points are in the same direction. p1A and p1B are the projected points of the spatial points A and B on layer1, respectively. p2A and p2B are the projection points of space points A and B on layer2, respectively. The projection of 3D object points on one projection plane forms a projected image corresponding to this projecting angle. In the hologram calculation process, the illumination direction of each point on different projection planes is set as the propagation direction, as shown in Figure 1b. The complex amplitude distribution on the holographic plane H is a superposition of light field from all projection planes. When the hologram is reconstructed, the beamlets in these directions are diffracted from the hologram. Similar to integral imaging 3D displays, the overlapping regions of the different beamlets form a 3D object for 3D display [22,23], where the propagation direction of the beamlets determines the outcome of the 3D display.
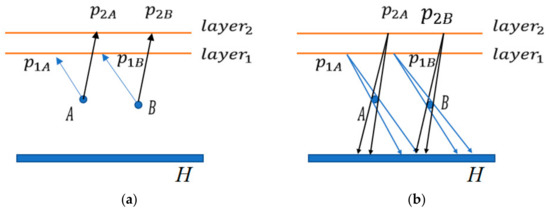
Figure 1.
The concept of hologram calculation. (a) Projection of 3D object to different layers; (b) the calculation of complex amplitude on holographic plane H.
To simplify calculation, the projection layers are all assumed to coincide in the same plane. On this projection plane, projected images from the 3D object are obtained with the designed projection angles. The light in different directions of the 3D object is calculated onto holographic plane H from the projected images. The direction of propagation of light on a projected image is and angular interval is as shown in Figure 2. The distance from the projection plane to the holographic plane H is z. The boundary of the propagation of the light from point p on the image on the holographic plane falls between and , respectively.
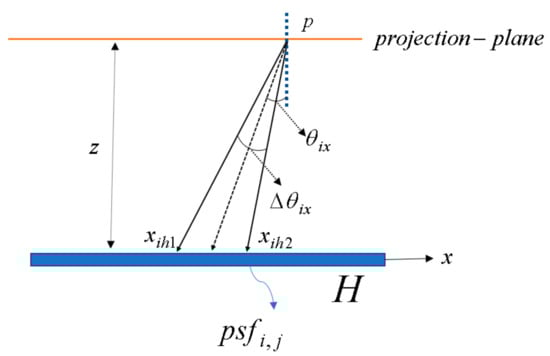
Figure 2.
The hologram projection angle and boundary.
Assume the point p is an on-axis point and the PSF of light propagating from the projection plane to the holographic plane can be expressed as:
where . and are the boundary of the light field on the holographic plane limited by the projection angle and angle interval in the x direction, respectively. i and j are the index of projected images in x and y directions, respectively. and are the boundary of the light field on the holographic plane limited by the projection angle and angle interval in the y direction, respectively.
The boundary of the light field distribution area on the holographic plane limited by the projection angle and angle interval can be expressed as:
where and are the projection angle and angular interval in the y direction, respectively.
The complex amplitude on the holographic plane H is the superposition of the convolution of each projected image with its corresponding PSF, which can be expressed as:
where I and J are the number of projected images in x and y directions, respectively. The complex amplitude U(x, y) on the hologram plane can be further encoded as a double phase hologram or as an off-axis amplitude hologram by introducing reference light [24,25]. Thus, the proposed approach has good degree of freedom for potential downstream of visualization tasks.
From above, it is evident that the simplified model consists of one projection plane on which 3D objects yield multiple projection images, as shown in Figure 3. The convolution of each projected image with a PSF yields complex amplitude distribution of the 3D object. Assume that the projection angles are and in the x and y directions, respectively. The coordinates of the spatial point on the projection plane can be expressed as:
where Xp and Yp are the coordinates of projected point of p on the projection plane. The projected image imi,j can be expressed as:
where Ap is the amplitude of object p.
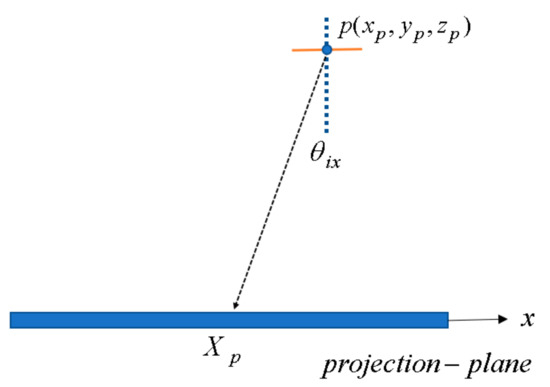
Figure 3.
Diagram of the calculation of the projected image.
3. Experiments and Result Analysis
Our experiment utilizes the principle of off-axis amplitude hologram for achieving holographic VR and AR 3D display. Within the experiment, a liquid-crystal-on-silicon (LCoS) SLM is utilized for modulating the holograms. The parameters of the SLM are shown in Table 1. Green light LED from Osram with 1 W power, center wavelength of 528 nm, light-emitting area of 1 mm × 1 mm, bandwidth of 28 nm is used as the illumination source. The center wavelength is used for hologram calculation.

Table 1.
Optical parameters in the experiment.
For the center wavelength, the diffraction angle of the SLM is
where is the pixel size of the LCoS. Given that the distance between the projection plane and the holographic plane is 10 mm, it is possible to calculate the PSF. It is assumed that the plane wave perpendicular to the holographic plane is used as a reference wave, which means that the phase of the reference wave on the holographic plane is a constant value. Under this situation, the real part of the PSF in Equation (1) on the holographic plane is an amplitude type hologram. This amplitude type hologram can be regarded as new PSF, as shown in Figure 4. The resolution of the PSF is about 84 pixels × 84 pixels, which corresponds to the viewing angle of 3.78° both in x and y directions from the hologram. For calculation of off-axis amplitude type hologram, only the upper half of the PSF (outlined with red rectangles) is used for the hologram calculation, as shown in Figure 4. The eight PSF sections correspond to eight PSFs of a 3D object projected onto one projection plane with eight different projection angles. Each PSF section has a resolution of 20 pixels × 20 pixels. Each PSF section is named as psfi,j according their positions. Hence in this design, the angular separation between the two adjacent projected images in the x and y directions is set as 0.9°.
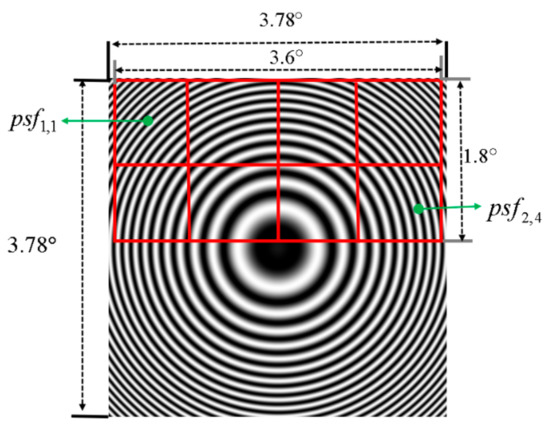
Figure 4.
The calculation of point spread functions (PSF).
Figure 5 shows the calculation of the hologram. A 3D object with size of 4.23 mm × 7.05 mm × 3.52 mm and a distance of 5 mm from the center of 3D object to the projection plane is used for hologram calculation. This 3D color model contains 41,022 object points. Two rows and four columns of the projected images of the 3D object are calculated according to Equation (5), and each projected image is firstly converted to grayscale image with a resolution of 600 × 600 and then interpolated and zero padded into a projected image with resolution of 1920 × 1080. The process of convolving the projected images with the corresponding PSF is shown in Figure 5. The projected image convolves with the corresponding . Then, the results are superimposed to obtain the hologram.
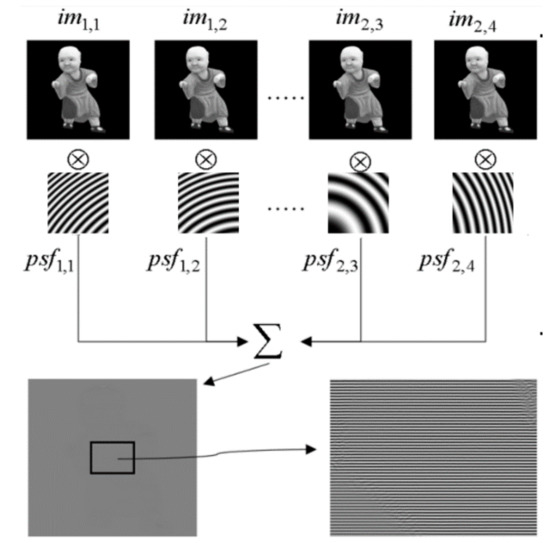
Figure 5.
The process of hologram calculation through convolution of corresponding PSF with projected images.
The optical setup of the experiment for holographic 3D VR display is shown in Figure 6. In this setup, the divergent illumination light emitted by the green LED is collimated by the lens1, and the LCoS is illuminated by the reflected light from beam splitter BS. The computer-generated hologram is loaded on the LCoS, and the illumination light is modulated. The modulated light field is filtered by the 4f optical filtering system to form a real 3D image free of zero order and high order image noise finally incident on human eye through the eyepiece lens4. The lenses used for collimating, 4f optical filtering system and eyepiece are all cemented doublet achromatic lenses with focal length of 50 mm and diameter of 30 mm. In this case, the distance from the LCoS to the eye is less than 25 cm, which means this setup is a relatively compact display system.
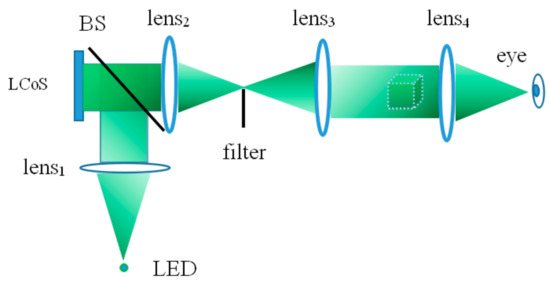
Figure 6.
Optical setup for Virtual Reality (VR) display.
The experimental results of the VR setup are shown in Figure 7. Figure 7a shows the reconstructed image of the hologram calculated by the proposed algorithm. For comparison, Figure 7b shows the result of the hologram calculated using the direct point cloud algorithm [14] of the red channel data from the color 3D model. The reproductions are similar, but the computational speed of our proposed method takes only about 2 s on average whereas the 3D cloud point data approach consumes about 76 s on average (38 times slower than our method). The comparison is based on the MATLAB 2015 with a laptop with i7-7700HQ CPU and 16G RAM.
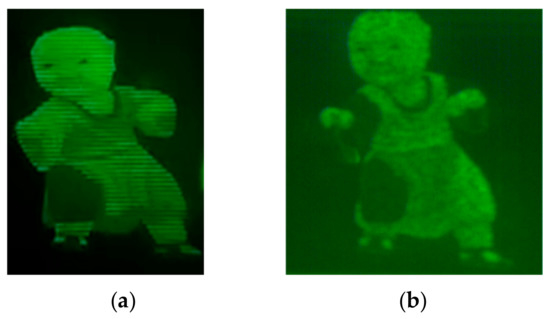
Figure 7.
Optical reconstructions. (a) Proposed method; (b) 3D cloud point data method.
Similarly, with the same experimental conditions, we also show another sample to demonstrate the capability of our method that can focus and defocus objects at a scene. For the tested scene, we utilize a stationary coral and a swimming fish 3D animation model (constructed using Unity3D), as shown in Figure 8. For projection of images, eight images at 0.9° angle interval both in the x and y directions are projected by Unity3D to generate projected images for each hologram calculation. In Figure 8a, the camera is aimed at two objects, and both are in focus yielding clear images because distance between the coral and the fish is close. As shown in Figure 8b,c, the distance between fish and coral becomes far in comparison to Figure 8a. Figure 8b,c show different focuses, where b is focused at coral and c is focused at fish.
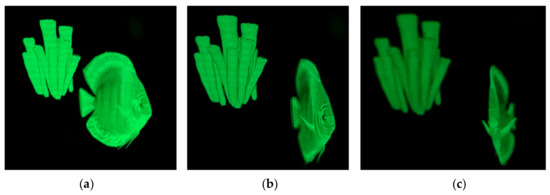
Figure 8.
Optical reconstructions of second 3D animation model. (a) Both in focus; (b) Coral in focus; (c) Fish in focus.
The results of Figure 7 and Figure 8 show that the proposed holographic 3D VR display is high in image quality, free of speckle noise, and also able to realize 3D display.
For the AR experiment, volume HOE is used for producing the AR 3D image due to its angle and wavelength selectivity [24,25,26]. The recording of the HOE is illustrated in Figure 9. The light wave emitted from the laser is filtered and collimated by lens1, and then split into two parts through the beam splitter (BS). The transmitted light passes through lens2 to form a convergent spherical wave, which undergoes interference with the plane wave reflected by mirror1 and mirror2 on the holographic material to form the HOE. The laser used for HOE recording is a single mode semiconductor laser with a wavelength of 532 nm and power of 400 mW. The lens2 is a commercially available aspherical mirror with focal length of 40 mm and a diameter of 50 mm (Thorlabs, AL5040M-A, NA = 0.55). The recording material we used in the experiment is a commercial holographic film (Ultimate Holography, U04), which requires an exposure density of ~600 μJ/cm2 [27].
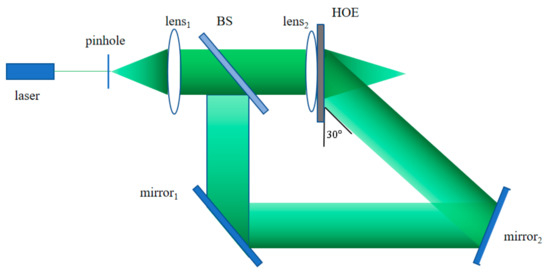
Figure 9.
Optical system for holographic optical element (HOE) recording.
Using the optical recording system, the angular selectivity of the reflective volume HOE recorded without using lens2 was tested, and the angular selectivity was within . Using the SLM described above, the diffraction angle is within , which means that most light diffracted by the SLM can be diffracted by HOE in a high efficiency.
Figure 10a,b are a schematic and a photograph of AR 3D display system, respectively. The angle between the illumination light and the HOE is approximately 30°. The holographic 3D real image reproduced by the optical system is imaged by the HOE and incident at human eye. Ambient light from the real object does not meet the angular selectivity of the fabricated reflective HOE, and thus can directly reach the human eye, forming a holographic AR 3D display.
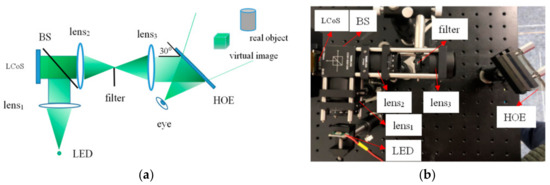
Figure 10.
Holographic Augmented Reality (AR) 3D display system. (a) Schematic of display system; (b) Optical display system.
The diameter of the fabricated HOE for AR 3D display is about 40 mm, which is shown in Figure 11a. The 3D model used for the AR experiment is the same as the second experiment of the VR display. Figure 11b,c shows two reconstructed images taken at different depths. Fish and coral are about 1.2 m and 3 m deep, respectively, which are calibrated with a CCD camera. The calibration process is as follows: Given the camera is focused on a virtual image (e.g., either fish or coral), we move a real object away from the camera. When the captured image of the real object becomes clear, the distance between the real object and the camera is the depth at which the camera can clearly image the real object. The distance is also the distance between the virtual image and camera as well. In our display experiment, when the image of the fish is clear, the image of the coral and external environment are blurred due to the defocus. The results show that the proposed method is able to produce correct depth cues, and hence the accommodation convergence conflict problem can be eliminated.
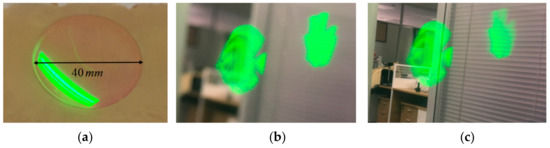
Figure 11.
Optical experiment results. (a) Fabricated HOE; (b) Focused on Fish (1.2 m); (c) Focused on coral (3 m).
4. Discussion
The VR results of our method are faster (38 times faster) than the traditional point cloud method. The VR results also show that the proposed method is able to achieve focus and defocus of the 3D images. Similarly, AR results also show that the proposed method is able to achieve a good image quality with 3D display capability as well. More importantly, use of LED as illumination source results in speckle noise-free VR/AR 3D images so that the image quality is better than the use of coherent source as illumination for holographic display. Another advantage of this method is that the depth of the 3D image can be easily controlled through the SLM.
It is worthwhile to point out that the calculation time is determined by the number of views of the projected image and the distance from the projection plane to the holographic plane. The computation time is a trade-off between the number of the projected images and the distance between the projection plane and the holographic plane. Further increase of computational speed is still possible through the use of GPU acceleration for the convolution.
It is also worth noting that the difference between the display modes of AR and VR can be easily changed with different eyepieces, and all the underlying computation should be identical. This offers convenience for easily switching between VR and AR devices for practical applications. The 3D object can be set between the holographic plane and projected plane or the projected plane can be set between the 3D object and holographic plane. In the experiment we used the former method. For an extreme situation, the holographic plane is the projection plane. Under this condition, the convolution in spatial domain is not possible because the PSF cannot be calculated. However, the calculation of the hologram can be performed in the frequency domain [4].
It should be pointed out that use of LED as the illumination source is also associated with potential drawbacks. For example, due to the large light-emitting area of the LED and poor spatial coherence, it is more difficult to produce a large depth of field image. Another disadvantage is that when the increase of the distance between the holographic plane and the 3D object is over a certain threshold (e.g., 20 mm), the blur of the VR/AR image becomes more evident. While this may not be significant for near-eye VR/AR 3D display, a careful control of coherence of the light source as well as more controllable propagation of the light can be potentially useful to solve these problems.
5. Conclusions
We demonstrate a holographic 3D VR and AR technique with a multiple projection image-based method to successfully create high quality near-eye VR and AR 3D display free of speckle noise and without accommodation convergence conflict problems. The proposed calculation method has high computational efficiency and the proposed display system is compact and flexible, which has potentials for head mounted near-eye VR and AR applications.
Author Contributions
X.Y. wrote the program for hologram calculation and completed the relevant experiments; H.Z. helped to discuss the research and modified the document; Q.-H.W. led the project.
Funding
This research was funded by National Key R & D Program of China, under Grant No. 2017YFB1002900 and by National Natural Science Foundation of China under Grant No. 61535007.
Conflicts of Interest
The authors declare no conflict of interest.
References
- Yaras, F.; Kang, H.; Onural, L. State of the art in holographic display: A survey. J. Disp Technol. 2010, 6, 443–454. [Google Scholar] [CrossRef]
- Matsushima, K.; Arima, Y.; Nakahara, S. Digitized holography: Modern holography for 3D imaging of virtual and real objects. Appl. Opt. 2011, 50, H278–H284. [Google Scholar] [CrossRef] [PubMed]
- Shi, Y.; Wang, H.; Li, Y.; Jin, H.; Ma, L. Practical method for color computer-generated rainbow holograms of real-existing objects. Appl. Opt. 2009, 48, 4219–4226. [Google Scholar] [CrossRef] [PubMed]
- Yang, X.; Wang, H.; Li, Y.; Xu, F.; Zhang, H.; Zhang, J.; Yan, Q. Computer generated full-parallax synthetic hologram based on frequency mosaic. Opt. Commun. 2018, 430, 24–30. [Google Scholar] [CrossRef]
- Cai, X.O.; Wang, H. Study of relationship between recording wavelength and hologram compression. Opt. Commun. 2006, 256, 111–115. [Google Scholar] [CrossRef]
- Zhang, C.; Yang, G.L.; Xie, H.Y. Information compression of computer-generated hologram using BP Neural Network. In Digital Holography and Three-Dimensional Imaging (DH); Optical Society of America: Miami, FL, USA, 2010; p. JMA2. [Google Scholar]
- Lin, S.; Kim, E. Single SLM full-color holographic 3-D display based on sampling and selective frequency-filtering methods. Opt. Express 2017, 25, 11389–11404. [Google Scholar] [CrossRef] [PubMed]
- Lin, S.; Cao, H.; Kim, E. Single SLM full-color holographic three-dimensional video display based on image and frequency-shift multiplexing. Opt. Express 2019, 27, 15926–15942. [Google Scholar] [CrossRef] [PubMed]
- Chang, C.; Xia, J.; Yang, L.; Lei, W.; Yang, Z.; Chen, J. Speckle-suppressed phase-only holographic three-dimensional display based on double-constraint Gerchberg-Saxton algorithm. Appl. Opt. 2015, 54, 6994–7001. [Google Scholar] [CrossRef]
- Jeon, W.; Jeong, W.; Son, K.; Yang, H. Speckle noise reduction for digital holographic images using multi-scale convolutional neural networks. Opt. Lett. 2018, 43, 4240–4243. [Google Scholar] [CrossRef]
- He, Z.; Sui, X.; Jin, G.; Cao, L. Progress in virtual reality and augmented reality based on holographic display. Appl. Opt. 2019, 58, A74–A81. [Google Scholar] [CrossRef]
- Huang, H.; Hua, H. Systematic characterization and optimization of 3D light field displays. Opt. Express 2017, 25, 18508–18525. [Google Scholar] [CrossRef] [PubMed]
- Huang, H.; Hua, H. Effects of ray position sampling on the visual responses of 3D light field displays. Opt. Express 2019, 27, 9343–9360. [Google Scholar] [CrossRef] [PubMed]
- Su, P.; Cao, W.; Ma, J.; Cheng, B.; Liang, X.; Cao, L.; Jin, G. Fast computer-generated hologram generation method for three-dimensional point cloud model. J. Display Technol. 2016, 12, 1688–1694. [Google Scholar] [CrossRef]
- Wei, H.; Gong, G.; Li, N. Improved look-up table method of computer-generated holograms. Appl. Opt. 2016, 55, 9255–9264. [Google Scholar] [CrossRef]
- Arai, D.; Shimobaba, T.; Murano, K.; Endo, Y.; Hirayama, R.; Hiyama, D.; Kakue, T.; Ito, T. Acceleration of computer-generated holograms using tilted wavefront recording plane method. Opt. Express 2015, 23, 1740–1747. [Google Scholar] [CrossRef] [PubMed]
- Liu, J.; Liao, H. Fast occlusion processing for a polygon-based computer-generated hologram using the slice-by-slice silhouette method. Appl. Opt. 2018, 57, A215–A221. [Google Scholar] [CrossRef]
- Ji, Y.; Yeom, H.; Park, J. Efficient texture mapping by adaptive mesh division in mesh-based computer generated hologram. Opt. Express 2016, 24, 28154–28169. [Google Scholar] [CrossRef]
- Matsushima, K.; Nakahara, S. Extremely high-definition full-parallax computer-generated hologram created by the polygon-based method. Appl. Opt. 2009, 48, H54–H63. [Google Scholar] [CrossRef]
- Abookasis, D.; Rosen, J. Three types of computer-generated hologram synthesized from multiple angular viewpoints of a three-dimensional scene. Appl. Opt. 2006, 45, 6533–6538. [Google Scholar] [CrossRef]
- Shaked, N.; Katz, B.; Rosen, J. Review of three-dimensional holographic imaging by multiple-viewpoint projection-based methods. Appl. Opt. 2009, 48, H120–H136. [Google Scholar] [CrossRef]
- Zhang, Y.; Fu, Y.; Wang, H.; Li, H.; Pan, S.; Du, Y. High resolution integral imaging display by using a microstructure array. J. Opt. Technol. 2019, 86, 100–104. [Google Scholar] [CrossRef]
- Zhang, H.; Deng, H.; Li, J.; He, M.; Li, D.; Wang, Q. Integral imaging-based 2D/3D convertible display system by using holographic optical element and polymer dispersed liquid crystal. Opt. Lett. 2019, 44, 387–390. [Google Scholar] [CrossRef]
- Maimone, A.; Georgiou, A.; Kollin, J. Holographic near-eye displays for virtual and augmented reality. ACM Trans. Graph. 2017, 36, 8501–8516. [Google Scholar] [CrossRef]
- Ting, C.H.; Wokunami, K.; Yamamoto, K.; Huang, Y.P. Reconstruct holographic 3D objects by double phase hologram. Proc. SPIE 2015, 9495, 1–5. [Google Scholar]
- Zhou, P.; Li, Y.; Liu, S.; Su, Y. Compact design for optical-see-through holographic displays employing holographic optical elements. Opt. Express 2018, 26, 22866–22876. [Google Scholar] [CrossRef] [PubMed]
- Gentet, P.; Gentet, Y.; Lee, S. Ultimate 04 the new reference for ultra -Realistic color holography. In Proceedings of the 2017 International Conference on Emerging Trends& Innovation in ICT (ICEI), Pune, India, 3–5 February 2017; pp. 162–166. [Google Scholar]
© 2019 by the authors. Licensee MDPI, Basel, Switzerland. This article is an open access article distributed under the terms and conditions of the Creative Commons Attribution (CC BY) license (http://creativecommons.org/licenses/by/4.0/).