Review

A Review of Recent Results on Simultaneous Interrogation of Multiple Fiber Bragg Grating-Based Sensors Using Microwave Photonics

1
Department of Electrical and Computer Engineering, McGill University, Montreal, QC H3A 0E9, Canada
2
School of Physics and Optoelectronic Technology, Dalian University of Technology, Dalian 116024, China
3
QPS Photronics, Inc., Pointe Claire, QC H9R 5L7, Canada
*
Author to whom correspondence should be addressed.
Appl. Sci. 2019, 9(2), 298; https://doi.org/10.3390/app9020298
Submission received: 9 December 2018 / Revised: 6 January 2019 / Accepted: 9 January 2019 / Published: 15 January 2019
(This article belongs to the Special Issue Microwave Photonics 2018)

Abstract

:
We review recent results on exploiting microwave photonics to enable simultaneous interrogation of multiple fiber Bragg grating (FBG)-based sensors. In particular, we describe the use of (1) microwave photonic filtering and (2) chirped microwave pulse generation and compression as a means to map the wavelength (spectral) changes in the response of FBG-based sensors (specifically, an in-fiber Fabry-Pérot cavity sensor based on FBGs, FBG sensors directly, and a linearly chirped FBG sensor) to applied temperature (or strain) to the power of a radio-frequency signal (i.e., a wavelength-to-power mapping) or to the correlation peak of the compressed microwave signal. The approaches support high-resolution and high-speed interrogation and can be suitable for large scale sensing networks.

1. Introduction

Optical sensing is important for monitoring the integrity of structures and the conditions of an environment, providing information on parameters, such as strain, temperature, pressure, humidity, vibration, and chemical species, among others. Fiber optic sensors are attractive due to their compactness, immunity to electromagnetic interference, resistance to harsh operating conditions, and the possibility to implement in point and/or distributed configurations. The spectral response of a fiber Bragg grating (FBG) changes—especially in terms of a wavelength shift—when it is exposed to a variation in strain, temperature, pressure, humidity, etc. As such, FBGs are a key enabling technology for fiber optic sensing [1,2].
FBG sensors lend themselves readily for multiplexing in wavelength, time, and space, thereby allowing the same interrogation system to monitor multiple sensors and achieve quasi-distributed (multipoint) sensing. Information from an FBG sensor is generally wavelength encoded, i.e., a change in the measurand (strain or temperature) causes a wavelength shift in its spectral response. This wavelength shift is then detected using an optical spectrum analyzer (OSA), or with some system that converts the wavelength shift into another detectable quantity, such as power (the system performs essentially a wavelength-to-power mapping). Although OSAs can provide a high resolution for detecting small wavelength shifts in various industrial (e.g., condition monitoring in oil and gas) and medical applications (e.g., medical wearables), they are bulky and provide low interrogation speeds [3,4]. The latter is a significant limitation for interrogation in large capacity sensing networks where high-speed and/or real-time operation is required.
Microwave photonics (MWP) is a field that focuses on exploiting photonic techniques and technologies for generating, processing, and analyzing/characterizing radio-frequency (RF) signals. Recently, there was growing interest in exploring the use of MWP for applications in fiber optic sensing, particularly as a means to achieve high-resolution and high-speed sensor interrogation (including sensors based on FBGs) [5,6,7,8,9,10,11]. Approaches include the use of FBG sensors in (1) opto-electronic oscillators (OEOs), (2) MWP filters, and (3) for generating chirped microwave waveforms. Wavelength shifts in the spectral response of the FBG sensors are translated into changes in the output frequency of OEOs, the power at a specific RF frequency (or set of RF frequencies) in a MWP filter, and shifts in the correlation peak associated with compressing chirped microwave waveforms. Most of the demonstrations thus far have focused on the interrogation of a single fiber optic sensor. However, simultaneous interrogation of multiple sensors with low crosstalk is important for quasi-distributed sensing or large capacity sensing networks. In this paper, we review our recent work on exploiting MWP techniques, particularly those based on MWP filters and chirped microwave waveform generation/compression, for simultaneous interrogation of multiple FBG-based sensors (an in-fiber Fabry-Pérot (FP) cavity sensor based on FBGs, FBG sensors directly, and a linearly chirped FBG sensor) [12,13].

2. Microwave Photonic Filters

2.1. Background

Figure 1 shows generic implementations for an incoherent finite impulse response MWP filter using taps created from (a) a single wavelength optical source or (b) a multiple wavelength optical source (we assume operation in a regime where coherent interference effects can be ignored). In the former, the output from the optical source is modulated using an electro-optic modulator (EOM), then split to create multiple taps. The amplitude and delays of each tap are adjusted before being recombined and detected. Successive taps are delayed by multiples of the delay unit Δ T . Assuming amplitude modulation, the magnitude of the MWP filter frequency response | H ( f R F ) | is proportional to [14]
| H ( f R F ) | | m = 1 N P m e x p [ j ( m 1 ) f R F Δ T ] |
where N is the number of taps and P m denotes the amplitude of the m t h tap. For the case of a multiple wavelength optical source, each wavelength defines a tap. The taps are modulated and then propagated through a dispersive medium characterized by a dispersion D [ps/nm]. For taps that are separated equally in wavelength by an amount Δ λ , the corresponding delay is Δ T = D Δ λ . The MWP filter response | H ( f R F ) | can also be calculated using Equation (1).
The MWP filter response described by Equation (1) is a periodic function of f R F with a free spectral range (FSR) given by
F S R = 1 Δ T = 1 D Δ λ
If the spectral distribution of the taps from a multiple wavelength optical source follows a continuous and sinusoidal function of wavelength, then the MWP filter response features a single passband and is not periodic [15]. This passband is located at a central frequency f 0 = 1 / ( D Δ λ ) .
The multiple wavelength optical source can be obtained using FBGs to spectrally slice a broadband source (BBS). The FBGs themselves can be sensors that are subjected to varying environmental conditions, such as strain, temperature, etc. If we assume a fixed dispersion D , then tuning the wavelength separation Δ λ of the taps by applying strain or temperature to the FBG sensors will cause | H ( f R F ) | to shift. Figure 2 illustrates the principle of detecting changes in the MWP filter response | H ( f R F ) | by monitoring the change in RF power at a specific RF frequency. These changes can then be correlated to changes applied to the FBG sensor (e.g., strain or temperature). If | H ( f R F ) | shifts to higher frequencies, then choosing a frequency along the rising ( f R F 1 ) or falling edge ( f R F 2 ) of | H ( f R F ) | will result in a decrease or increase in detected RF power, respectively. The relationship between the change in RF power as a function of strain or temperature depends on several factors, including (1) the shape of the MWP filter response, (2) the RF frequency used for monitoring, and (3) the amount that | H ( f R F ) | will shift. The relationship can be linear, but it does not need to be so.

2.2. Single Bandpass MWP Filter

First, we consider interrogating a temperature sensor based on an in-fiber FP cavity formed with two near-identical low-reflectivity FBGs, as shown in Figure 3a. The reflection spectrum of the FBG structure is a sinusoidal-like pattern characterized by an FSR of Δ λ F S R = λ 2 2 n e f f L where n e f f is the effective refractive index, L is the center-to-center length between the FBGs, and λ is the center wavelength of the reflection response of each FBG. Figure 3b illustrates the reflection spectrum of such an in-fiber FP cavity where the peak reflectivity of each FBG is ~17% and L = 10 mm.
When the in-fiber FP cavity is exposed to a change in temperature, both the length and the refractive index of the fiber separating the FBGs, as well as the FBGs themselves, will vary due to thermal expansion and thermo-optic effects. Thus, the FSR of the reflection response Δ λ F S R will change, resulting in a shift in the MWP filter response | H ( f R F ) | , i.e., in the value of f 0 . For multiple sensor operations, we can wavelength multiplex multiple in-fiber FP cavity temperature sensors, each having its own FSR, and track temperature changes on the individual sensors by monitoring changes in their corresponding MWP filter passbands. Note that the use of an in-fiber FP cavity as the sensing element is more compact compared to the use of a Mach-Zehnder interferometer as demonstrated in [10].
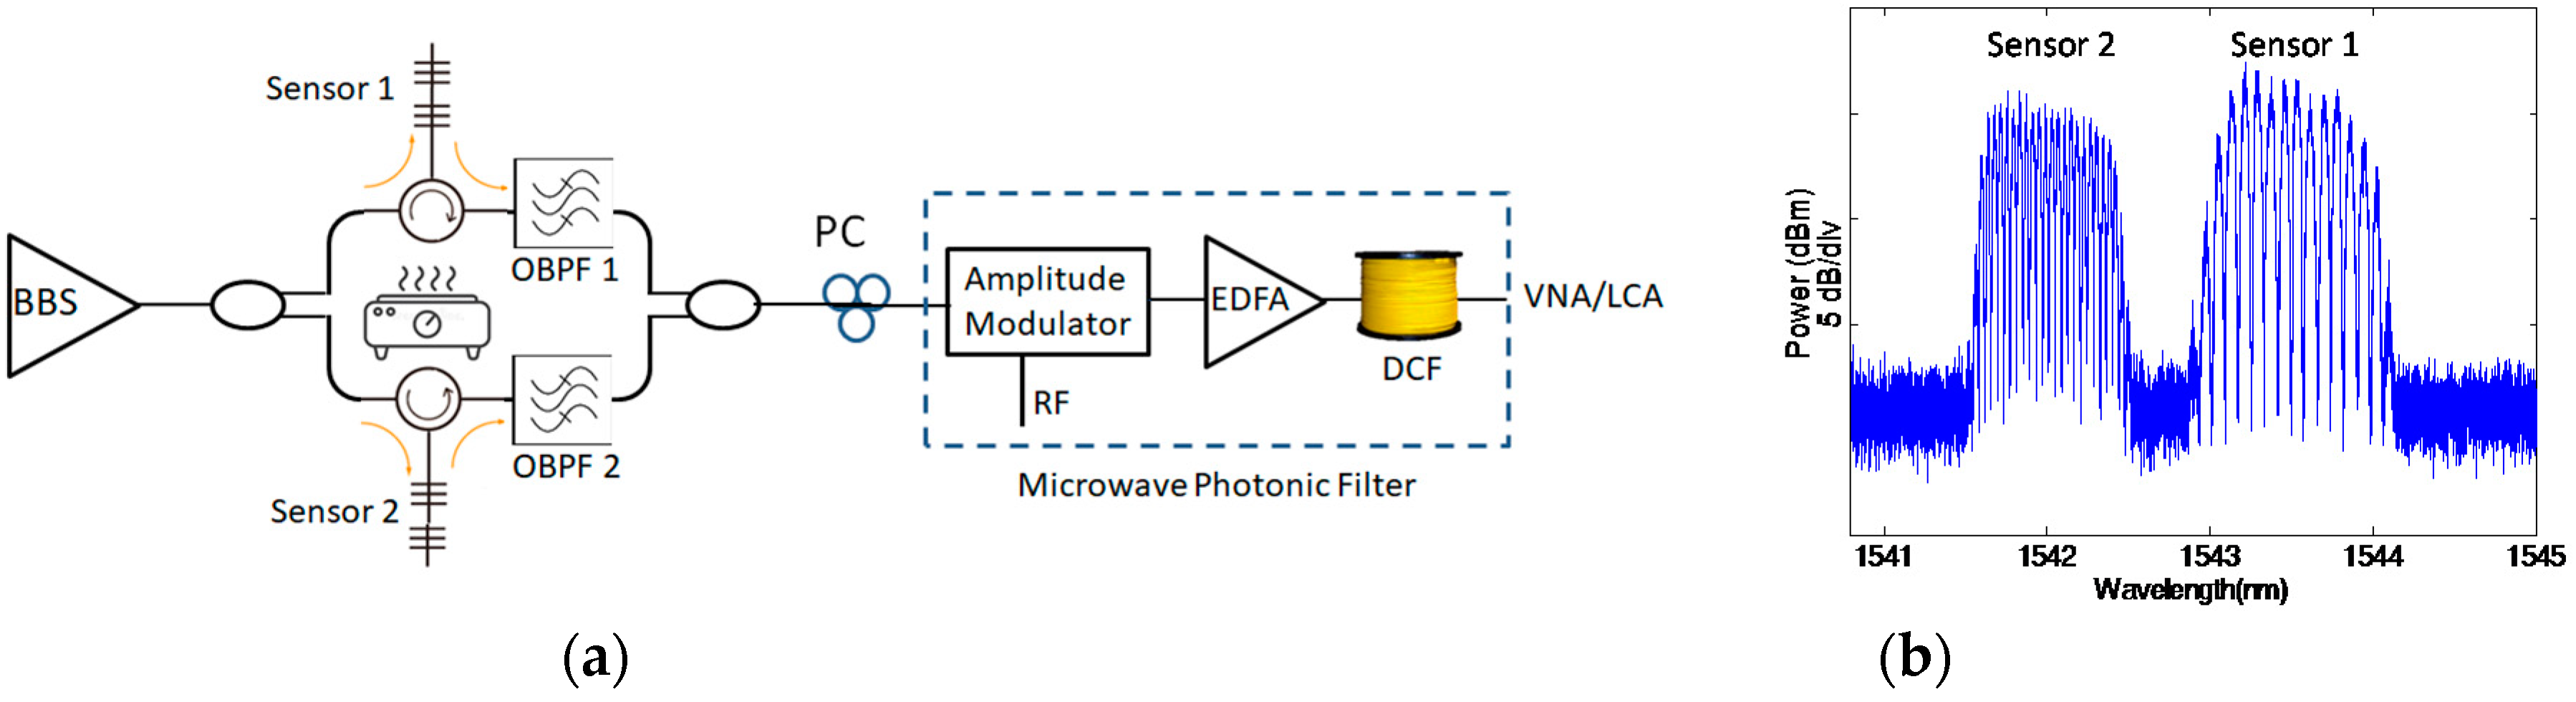
Figure 4a illustrates the experimental setup used to demonstrate the ability to interrogate multiple temperature sensors using the MWP filter system (two sensors were considered in our proof-of-principle demonstration) [12]. The output from a BBS is spectrally sliced using two in-fiber-FP cavity sensors, one with L 1 = 10 mm (Sensor 1) and the other with L 2 = 20 mm (Sensor 2), that are placed at different locations and exposed to different temperature conditions. The spectrally sliced spectra are shown in Figure 4b. Sensor 1 operates at longer wavelengths and occupies a broader optical spectrum, while Sensor 2 operates at shorter wavelengths. The corresponding FSRs for Sensor 1 and Sensor 2 are Δ λ F S R , 1 ≈ 80 pm and Δ λ F S R , 2 ≈ 40 pm, respectively.
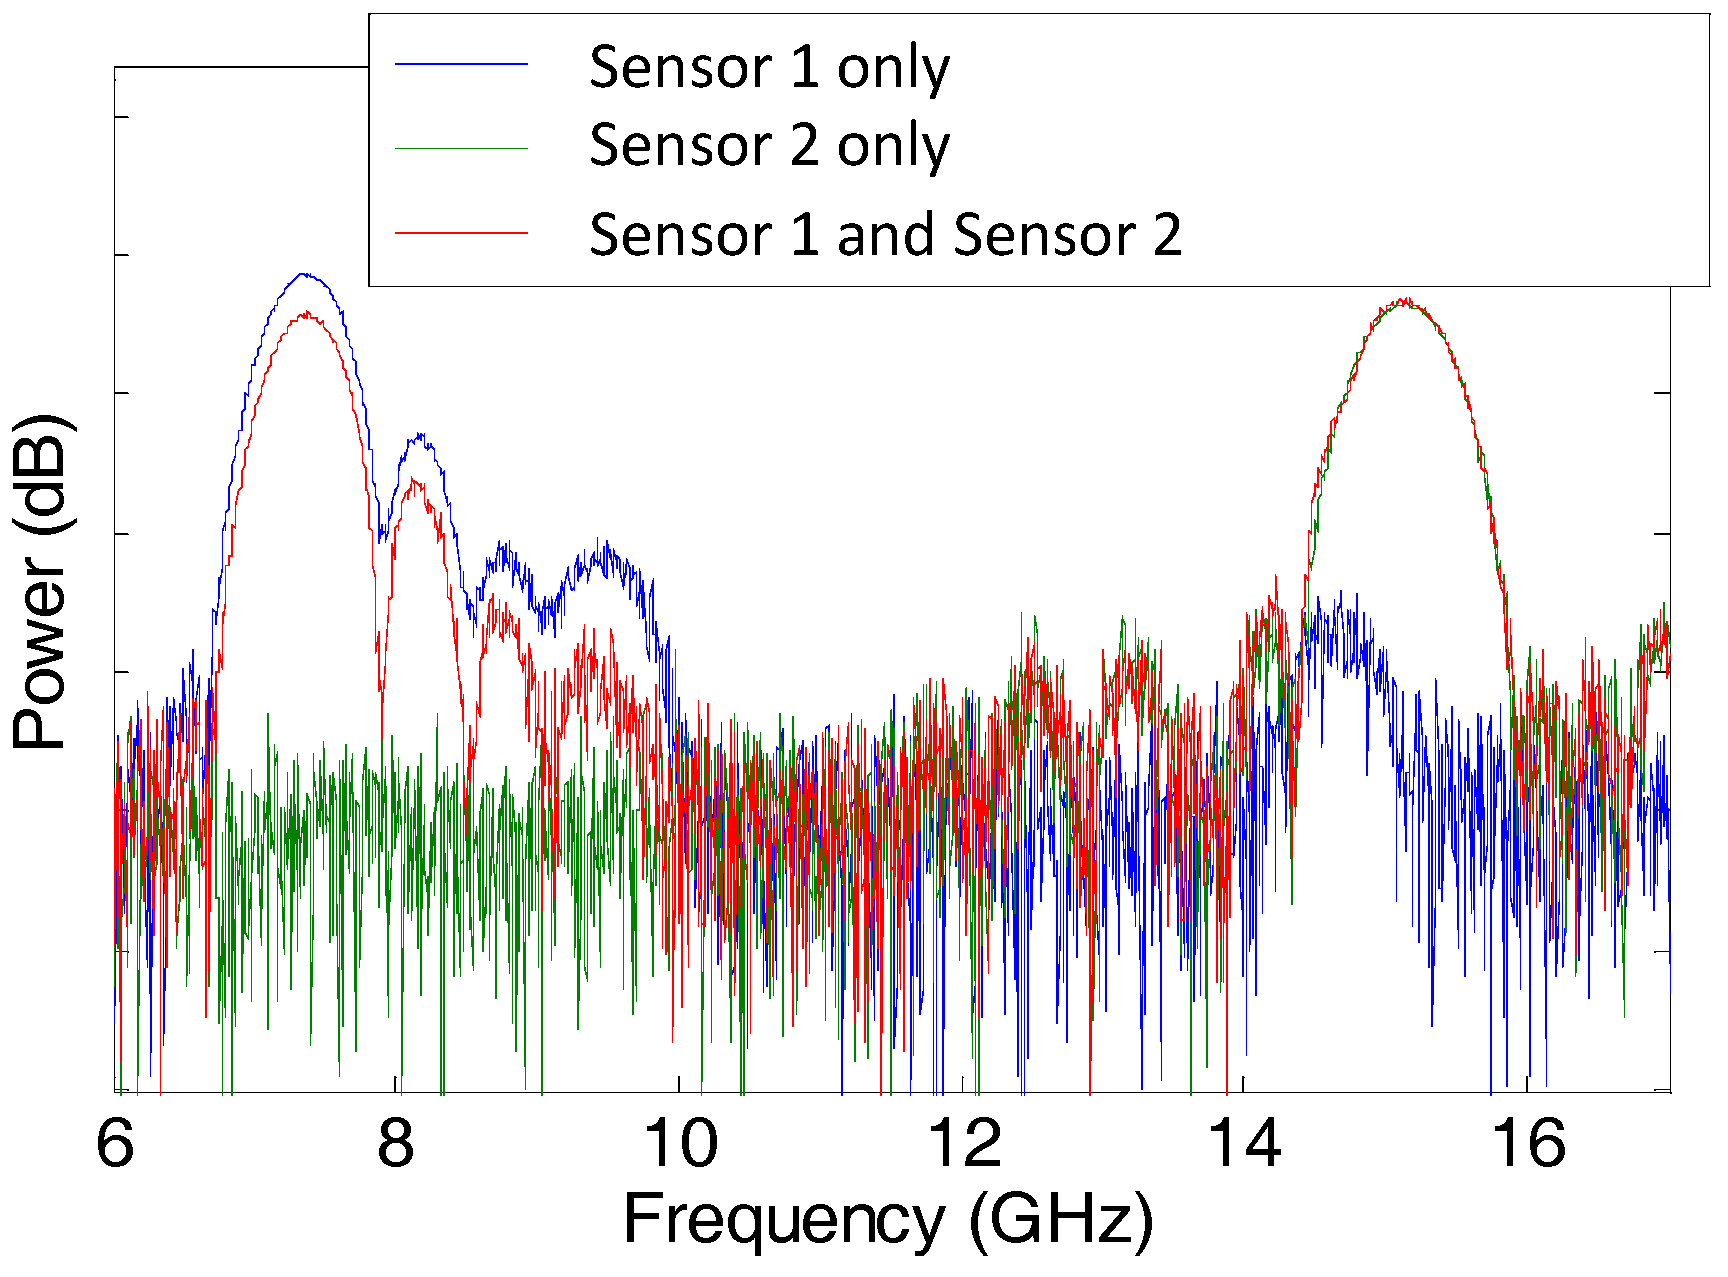
We use an EOM for amplitude modulation and dispersion compensating fiber (DCF) with a dispersion of | D | = 1719 ps/nm (at 1550 nm) as the dispersive medium. The calculated frequencies of the MWP filter passbands are f 0 , 1 = 7.27 GHz and f 0 , 2 = 14.54 GHz for Sensors 1 and 2, respectively. Figure 5 shows the measured MWP filter responses. The measured passband peaks are 7.38 GHz for Sensor 1 and 15.12 GHz for Sensor 2, in good agreement with the calculate values.
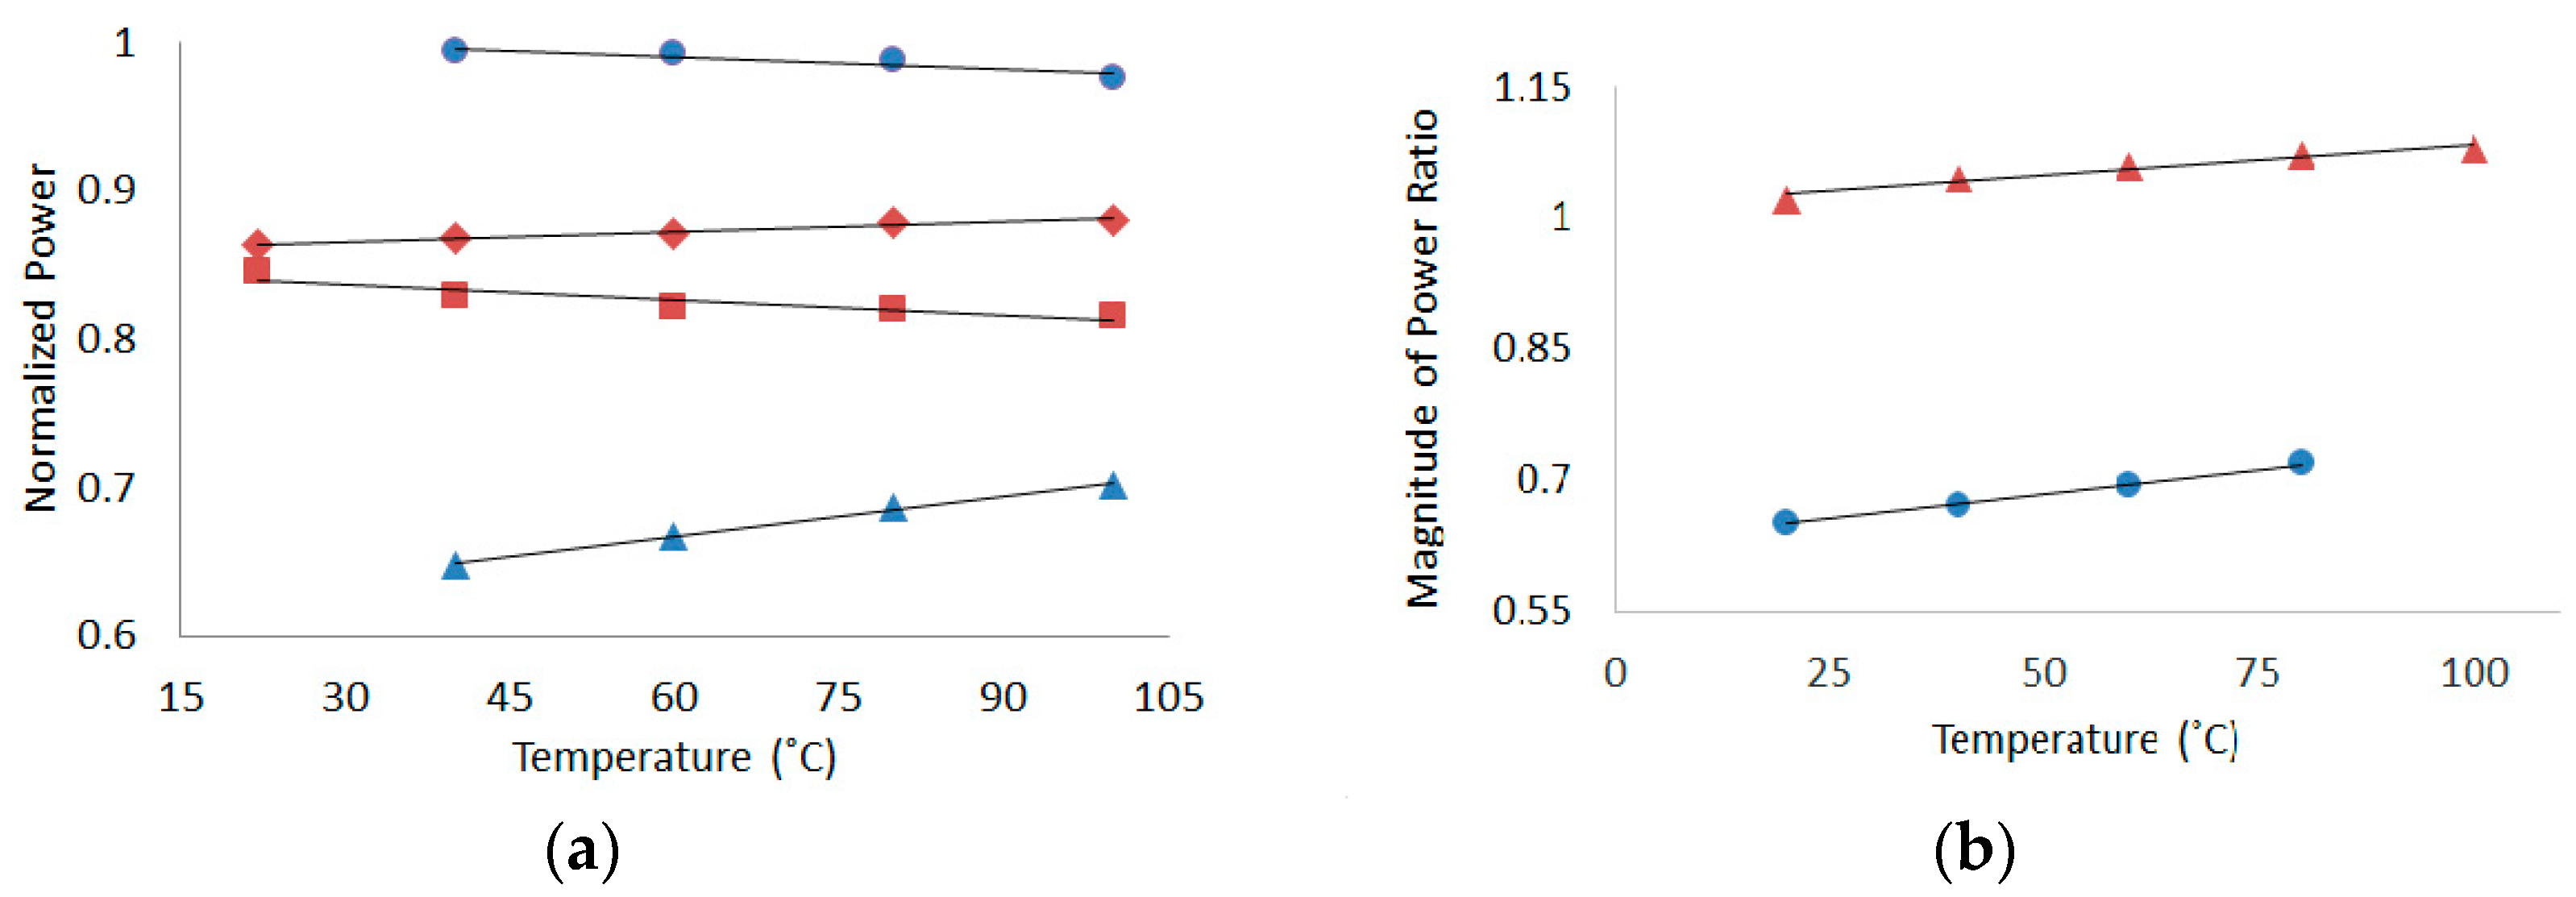
First, we characterize the response of each sensor separately. Figure 6a shows the change in normalized RF power at frequencies f R F of 7.48 GHz and 7.24 GHz, which are at the falling and rising edges of the MWP filter response, respectively, as the temperature of Sensor 1 is increased from room temperature (22 °C) to 100 °C. For these two frequencies, the RF power varies linearly with temperature, and the sensitivities are 2·10−4/°C at 7.48 GHz and −4·10−4/°C at 7.24 GHz. Note that, for the frequency on the falling (rising) edge of | H ( f R F ) | , the slope of the change in RF power with increasing temperature is positive (negative), thereby indicating that MWP filter response shifts to higher frequencies. For Sensor 2, the sensitivities at frequencies of 15.38 GHz and 15.1 GHz are 9·10−4/°C and −3·10−4/°C, respectively. The different sensitivities associated with the two sensors are due to the differences in their corresponding MWP filter responses. In particular, the multiple wavelength optical tap spectra associated with each sensor is different due to differences in the in-fiber FP cavities, and it is known that the shape of the multiple wavelength source will impact the shape of the MWP filter response [15]. Additionally, we monitored the RF power at frequencies located at different points along the MWP filter responses.
When there is no overlap between the MWP filter responses corresponding to each sensor, a ratiometric measurement can be used. We can consider dividing the changes in RF power observed at a frequency located along the rising edge of the MWP filter response by those for a frequency located along the falling edge. Using this ratiometric approach for the frequencies considered previously, the sensitivities for Sensor 1 and Sensor 2 are increased to 7·10−4/°C and 11·10−4/°C, respectively, as highlighted in Figure 6b.
We now consider operating the two temperature sensors simultaneously. Experiments show that, as we apply temperature changes to one sensor, the MWP filter response corresponding to the other sensor does not shift. For example, as depicted in Figure 7, when the temperature applied to Sensor 2 is varied from 40 °C to 80 °C and Sensor 1 is maintained at a constant (room) temperature, the MWP filter response corresponding to the latter does not shift (in particular, the RF power at frequencies 7.48 GHz and 7.24 GHz does not vary).
Figure 8 depicts the shift in the two MWP filter responses when different temperature changes are applied simultaneously to the two sensors. For Sensor 1, when the temperature is increased from 25 °C to 80 °C, the normalized RF power changes from 0.84 °C to 0.8 °C at a frequency of 7.24 GHz. For Sensor 2, when the temperature is increased from 25 °C to 60 °C, the normalized RF power changes from 0.66 °C to 0.67 °C at a frequency of 15.38 GHz. These changes generally agree with the sensitivities shown in Figure 6. However, they are not the same due to crosstalk in the MWP filter responses. In particular, as observed in Figure 5, the MWP filter response from Sensor 1 extends slightly into the frequency range of that for Sensor 2, while the reverse is not true. As such, for simultaneous multiple sensor operation, there is a small impact in the sensitivity for Sensor 2 and negligible impact in the sensitivity for Sensor 1.

2.3. Two Tap MWP Filter Based on a Sagnac Loop Incorporating a Linearly Chirped FBG

A Sagnac interferometer incorporating a linearly chirped FBG (LCFBG) can be used to implement a tunable single wavelength, two tap MWP filter, see Figure 9. Consider a single wavelength which is input to the Sagnac interferometer. There will be two reflected signals, one due to clockwise propagation and one due to counterclockwise propagation, in the interferometer before reflection from the LCFBG. The delay between the two reflected signals, which form the two taps of the MWP filter, depends on the input wavelength and the dispersion of the LCFBG. By tuning the input wavelength, the tap delay Δ T can be varied, causing a change in the FSR of the MWP filter response. In Reference [5], Fu et al. demonstrated interrogation of a single FBG sensor using this MWP filter.
We can extend this approach for simultaneous interrogation of multiple FBG temperature sensors using superimposed LCFBGs in the Sagnac interferometer. The experimental setup is shown in Figure 9. The output from a BBS is spectrally sliced by two FBGs (again, we consider two sensors for a proof-of-principle demonstration) that define the two input wavelengths for the two MWP filters. The FBG temperature sensors have the following characteristics: The center wavelength and 3 dB bandwidth for Sensor 1 (FBG1) are 1543.7 nm and 0.3 nm, respectively, while the corresponding values for Sensor 2 (FBG2) are 1549.5 nm and 0.12 nm. The wavelengths are then amplitude modulated using an EOM before input into the Sagnac interferometer. The two superimposed LCFBGs have similar reflectivity of ~80%; center wavelengths of 1545.4 nm and 1551.1 nm, corresponding 3 dB bandwidths of 4.4 nm and 4.9 nm, and dispersions of 53.3 ps/nm and 47.8 ps/nm. We use an optical bandpass filter to isolate the response from one FBG sensor prior to photodetection.
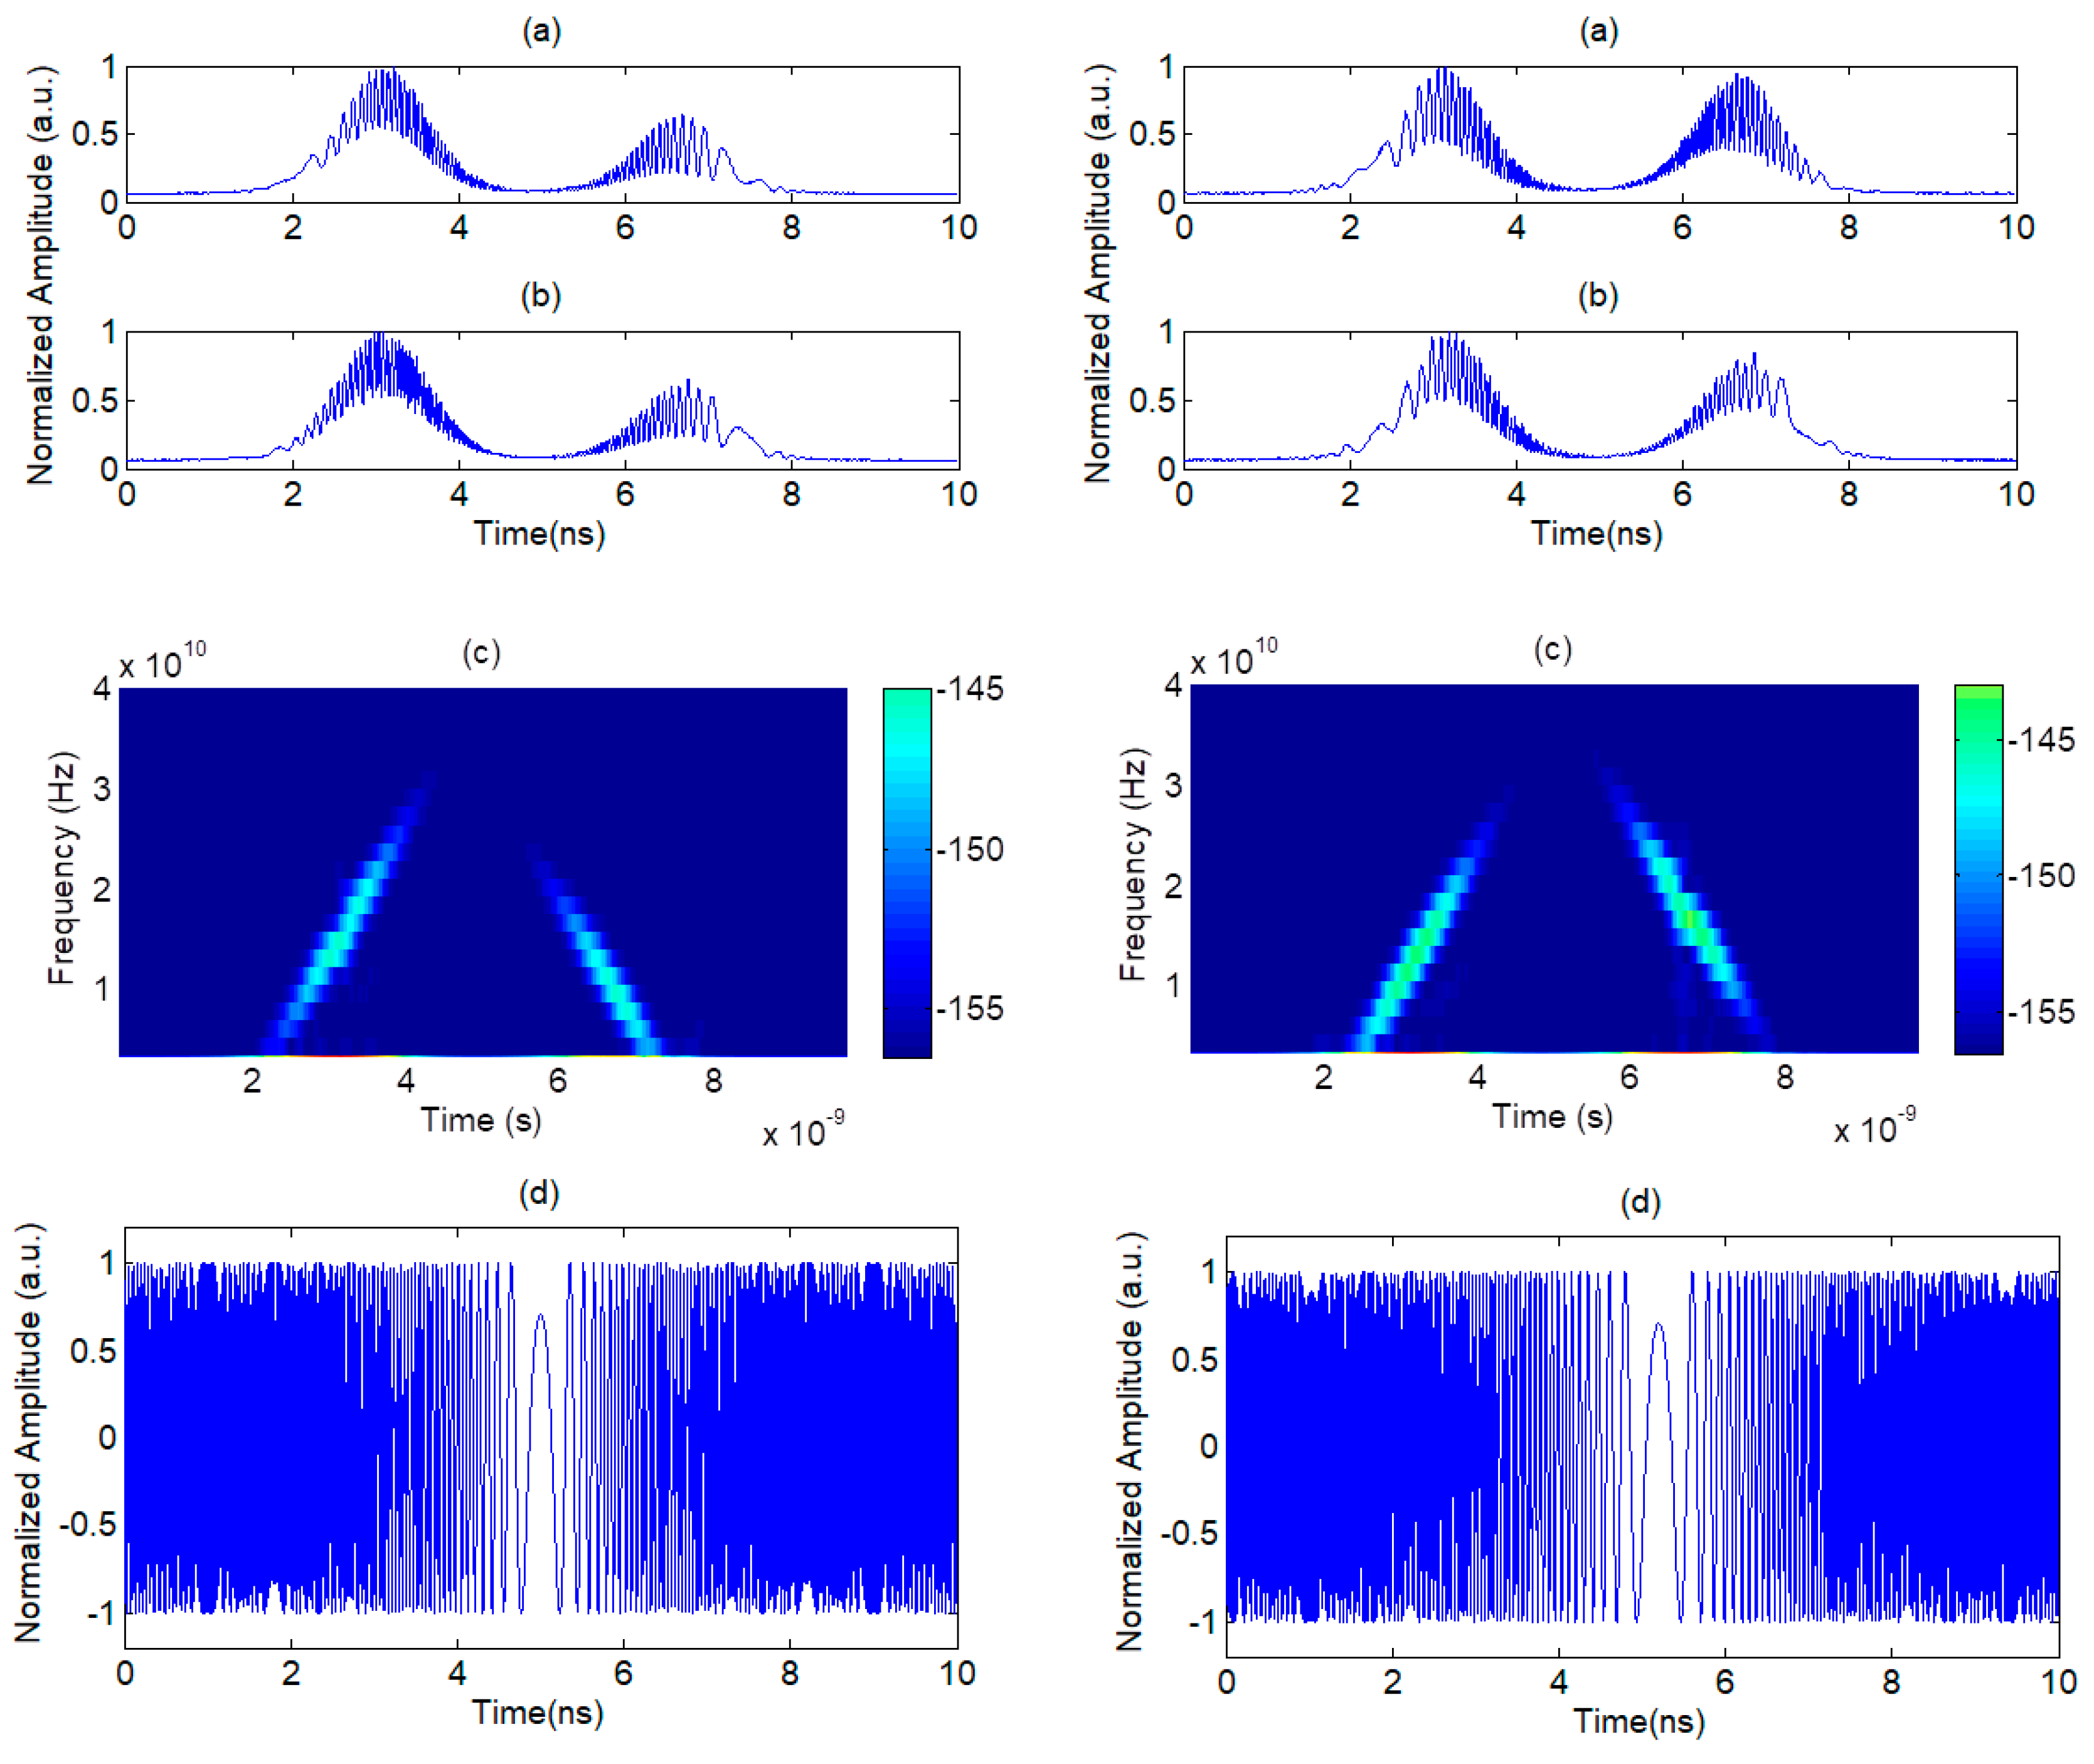
First, we vary the temperature of Sensor 1 from 30 °C to 70 °C, while keeping Sensor 2 at a constant (room) temperature. Figure 10a,c shows the MWP filter responses for Sensor 1 and Sensor 2, respectively, while Figure 10b,d shows the normalized RF power at two different frequencies along the rising and falling edges of the filter responses. For Sensor 1, at frequencies of 3.8 GHz (rising edge) and 6.2 GHz (falling edge), we observe a linear relation between RF power and temperature with corresponding sensitivities of −11·10−3/°C and 12.4·10−3/°C. For Sensor 2, the RF power at frequencies of 3.8 GHz and 6.5 GHz exhibits negligible change. Next, we do the reverse and vary the temperature of Sensor 2 from 30 °C to 70 °C, while keeping Sensor 1 at a constant (room) temperature. The corresponding results are summarized in Figure 11. The sensitivities at frequencies of 4.6 GHz (rising edge) and 6.9 GHz (falling edge) are −12.8·10−3/°C and 19.3·10−3/°C, respectively. The difference in sensitivities between the two sensors arises in part to the difference in the grating dispersions, which causes the amount of shift in the tap delay and hence the variation in FSR of | H ( f R F ) | as a function of temperature of the MWP responses to be different. The results clearly demonstrate that the sensors can be interrogated independently with negligible crosstalk, so that varying the temperature on one sensor does not impact the MWP filter response of the other.

3. Chirped Microwave Pulse Generation and Compression

Chirped microwave waveforms are of interest for applications in instrumentation, imaging, and communications. For example, they can be compressed to increase the detection distance and improve the measurement resolution for radar systems. Recently, Liu et al. demonstrated the use of generating and compressing chirped microwave waveforms as a means for performing high resolution and real-time interrogation of an LCFBG sensor [7]. In this section, we describe how this approach can be extended for simultaneous interrogation of multiple LCFBG temperature sensors.

Chirped Microwave Pulse Generation

Over the years, photonic generation of arbitrary RF waveforms, particularly chirped microwave waveforms, attracted considerable attention. A review of different approaches can be found in Reference [16]. Due to its simplicity, one of the most widespread techniques is based on spectral shaping combined with wavelength-to-time (WTM) mapping: An optical spectral shaper (OSS) is used to tailor the amplitude spectrum of a pulsed BBS (generally, the output from a mode-locked laser) and the shaped amplitude spectrum is then propagated in a dispersive medium to map the spectral content into the time domain. Generating a chirped microwave waveform requires an OSS with a constant free spectral range (FSR) and a nonlinear WTM, or an OSS with a linearly variable FSR and a linear WTM.
OSSs with variable FSR were realized using a variety of fiber and integrated platforms, with reviews in References [16,17]. One implementation uses a Sagnac loop incorporating an LCFBG [18]. By controlling the path misbalance in the loop using an optical delay line (ODL), the sign of the linear variation in the FSR can be tuned from positive to negative, which in turn can tune the sign of the chirp of the generated microwave waveform. We showed that this approach can be scaled to generate simultaneously multiple wavelength-division-multiplexed (WDM) chirped microwave waveforms by incorporating multiple LCFBGs within an arrayed waveguide grating Sagnac interferometer (AWGSI) [19]. We then combined this technique of generating multiple WDM chirped microwave waveforms with the approach for real-time interrogation of LCFBG sensors for simultaneous interrogation of multiple LCFBG temperature sensors.
Figure 12 illustrates the schematic of our system used to generate multiple WDM chirped microwave waveforms. The output from a pulsed broadband source is first propagated through a dispersive medium to perform WTM (note that due to the linearity of the system, the order of performing spectral shaping and WTM does not matter). The signal is then shaped using a two-channel OSS. The OSS is based on an AWGSI, which is implemented using a Sagnac loop and two pairs of optical band-pass filters (OBPFs) that define each channel. In each channel, there is an LCFBG and an optical delay line (ODL), which is used to control the wavelength independent path length difference; adjusting this path length difference allows for tuning the sign of the RF chirp of the generated chirped microwave signal. The transfer function for the ith spectral channel is [16,18]:
T i ( λ ) = 1 2 W i ( λ ) { 1 + c o s [ 4 π n e f f λ C , i 2 λ ( Δ L 0 , i + λ λ C , i C i ) ] }
where Δ L 0 , i represents the wavelength independent path length difference, λ C , i is the center wavelength, C i [nm/cm] is the grating chirp, and i = 1, 2. The term λ λ C , i C i in Equation (3) defines the wavelength dependent path difference for the ith channel. Wi( λ ) includes the amplitude spectrum of the BBS, the spectral response of the pair of OPBFs used to implement each channel in the AWGSI, and the reflection response of the LCFBG. After WTM, the temporal waveform is [16,18]:
y i ( t ) = 1 2 r i ( t ) W i ( t D ) { 1 + c o s [ 4 π n e f f λ C , 1 2 D t ( Δ L 0 , 1 + δ t C i D ) ] }
where ri(t) is the envelope of the ith detected pulse and D [ps/mn] is the dispersion of the dispersive medium. The WTM parameters are given by ( λ λ C , i ) δ t / D , λ t / D , and δ t is the detuning from the center of the temporal waveform.
If a temperature increase is applied to an LCFBG, its reflection spectrum will shift to longer wavelengths as temperature increases. Thus, within the spectral windows of the ASGWSI defined by the spectral response of the OBPFs, the wavelength dependent path length changes. In turn, the frequency components of the chirped microwave signal will change while the chirp rate will remain constant, as given by Equations (3) and (4).
In our experiments, we use a wavelength-tunable mode-locked femtosecond laser generating pulses with a 3 dB bandwidth of ~6 nm at a repetition rate of 16 MHz and centered at ~1540 nm as the pulsed BBS. The dispersive medium is a length of dispersion compensating fiber with a dispersion of −1719 ps/nm. The two LCFBGs, LCFBG1 (for Sensor 1) and LCFBG2 (for Sensor 2), have very similar spectral characteristics: They are centered at 1540 nm with a 3 dB bandwidth of 10 nm, a dispersion of 140 ps/nm, and a peak reflectivity of ~80%. The two pairs of identical OBPFs are used to select a ~1 nm wide spectral slice within the LCFBG reflection spectrum. The two channels in the AWGSI are separated spectrally by 2 nm, which corresponds to a temporal separation of ~3.4 ns between the generated chirped microwave signals. We use an optical sampling module with 65 GHz bandwidth connected to a digital communications analyzer (DCA) with a corresponding impulse response time of ~7 ps to record the temporal waveforms. The recorded waveforms are then processed offline to calculate the spectrograms and correlations with the reference signal to obtain the compressed pulses.
Figure 13a,b shows the chirped microwave waveforms when two different temperatures, 30 °C and 50 °C, are applied to Sensor 1, while Sensor 2 is kept at room temperature. Figure 14a,b shows the corresponding waveforms when temperatures of 21 °C and 50 °C are applied to Sensor 2, while keeping Sensor 1 at room temperature. We calculate the spectrograms of the chirped waveforms and extract an RF chirp of ~±14 GHz/ns, as shown by the slopes of the red lines in Figure 13c and Figure 14c. These values of RF chirp are used to define the reference signals, shown in Figure 13d and Figure 14d, which are used to compress the measured waveforms in Figure 13a,b and Figure 14a,b, respectively. As observed from the plots of the compressed pulses in Figure 15a,b, there is a linear shift in the correlation peak corresponding to the sensor experiencing a temperature change. There are small drifts in the correlation peaks for the sensor that is maintained at room temperature (ideally, the correlation peaks should not vary), the results generally show low cross-talk between the two sensors. These drifts/fluctuations are caused by other environmental perturbations in our experimental setup, such as vibrations. In a practical system, the sensors will need to be properly packaged to avoid such drifts while there is a negligible shift in the correlation peak for the sensor that is kept at a constant temperature.

4. Discussion and Conclusions

In this paper, we reviewed our recent work in References [12,13] on exploiting MWP techniques for interrogating simultaneously multiple FBG-based sensors. We described the use of MWP filtering, whereby the RF power at specific frequencies within an MWP filter response is tracked and correlated to changes applied to the FBG-based sensors that are used in implementing the MWP filter. The approach allows the possibility to monitor changes in power at multiple frequencies, or even to use a ratiometric approach. We also demonstrated the use of FBGs to generate chirped microwave waveforms and correlated shifts in the temporal peak of the compressed pulses to changes applied to the FBGs. The examples detailed in this paper focus on temperature sensing, while the techniques are equally applicable to strain sensing. This is based on the fact that the spectral response of FBGs or linearly chirped FBGs has a well-defined shift toward longer wavelengths as a function of increasing temperature or strain. It should be noted that the approaches support high sensitivity and support high-speed operation.
An important consideration of multiple sensor systems is scaling. For the technique based on MWP filtering with in-fiber FP cavities, the number of sensors that can be interrogated may be increased by tailoring the FBG separation of the sensing structures to obtain MWP filter passbands centered about different frequencies. To avoid crosstalk, it is necessary to ensure that the MWP filter responses corresponding to the sensors do not overlap. The sensitivity can be further improved by using packages of higher thermal expansion so that there are greater changes in FSR as a function of applied temperature. Increasing the optical bandwidth of the sensor results in a narrower MWP filter passband (see Figure 4 and Figure 5), which in turn results in steeper rising and falling edges and thus, greater sensitivities. It can also reduce cross-talk between the MWP filter passbands. The system will require an optimization between the optical bandwidth corresponding to one sensor, the bandwidth of the MWP filter passband, the operating RF frequency range, and the range over which sensing is required. With reference to Figure 4 and Figure 5, using an optical bandwidth (3 dB) of ~0.8 nm for one in-fiber FP cavity sensor (i.e., similar to Sensor 2) will allow for ~10 different minimally overlapping MWP filter passbands operating in the RF frequency range up to 20 GHz; thus, ~10 sensors can be interrogated. For the Sagnac loop, increasing the number of sensors that can be interrogated will depend on the number of LCFBGs that can be superimposed (at least 10 superimposed FBGs were demonstrated in Reference [20]), the bandwidth of the BBS, as well as the number of gratings that a given LCFBG can support, which depends on the bandwidth of the sensing FBG and the wavelength range over which the sensing FBG will operate. For example, if the sensing FBGs have a 3 dB bandwidth of ~0.3 nm and need to be tuned over ~1 nm (e.g., for temperature sensing over 100 °C), an LCFBG with a bandwidth of 4.5 nm can support ~3 sensing FBGs. Superimposing 8 such LCFBGs will result in ~24 sensors, occupying an optical bandwidth of ~36 nm, well within the bandwidth of available BBSs.
For the technique based on generating chirped microwave waveforms, the method can be scaled to a larger number of sensors by increasing the number of channels in the AWGSI. However, scalability will be constrained by the bandwidth of the BBS. Combining multiple bands, such as S, and C, and L, can increase scalability further, but this will require an appropriate pulsed BBS, and dispersive media for WTM.
The proof-of-principle demonstrations described in this paper point to the potential for exploiting MWP for interrogating multiple fiber optic sensors. Moreover, compact interrogation units can be developed. For example, we have demonstrated an integrated multiple channel AWGSI in silicon photonics [21]. These results should stimulate further research and development in MWP for fiber optic sensing.

Author Contributions

L.R.C. supervised the work. M.-I.C., P.A., and J.H. performed the experiments. P.K. developed the in-fiber FP cavity sensors. All authors contributed to data analysis and manuscript writing.

Funding

This research was funded in part by the Natural Sciences and Engineering Research Council of Canada.

Conflicts of Interest

The authors declare no conflict of interest.

References

  1. Kersey, A.D.; David, M.A.; Patrick, H.J.; LeBlanc, M.; Koo, K.P.; Askins, C.G.; Putnam, M.A.; Friebele, E.J. Fiber grating sensors. J. Lightw. Technol. 1997, 15, 1442–1463. [Google Scholar] [CrossRef]
  2. Rao, Y.-J. Fiber Bragg grating sensors: Principles and applications. In Optical Fiber Sensor Technology; Grattan, K.T.V., Meggitt, B.T., Eds.; Chapman Hall: London, UK, 1998; pp. 355–379. ISBN 0412782901. [Google Scholar]
  3. Liu, Z.; Tam, H.-Y. Industrial and medical applications of fiber Bragg gratings. Chin. Opt. Lett. 2016, 14, 120007. [Google Scholar]
  4. Hu, C.; Bai, W. High-speed interrogation for large-scale fiber Bragg grating sensing. Sensors 2018, 18, 665. [Google Scholar] [CrossRef] [PubMed]
  5. Fu, H.; Zhang, W.; Mou, C.; Shu, X.; Zhang, L.; He, S.; Bennion, I. High-frequency fiber Bragg grating sensing interrogation system using a Sagnac-loop-based microwave photonic filtering. IEEE Photonics Technol. Lett. 2009, 21, 519–521. [Google Scholar] [CrossRef]
  6. Fu, H.; Chen, D.; Cai, Z. Fiber sensor systems based on fiber laser and microwave photonic technologies. Sensors 2012, 12, 5395–5419. [Google Scholar] [CrossRef] [PubMed]
  7. Liu, W.; Li, W.; Yao, J.P. Real-time interrogation of a linearly chirped fiber Bragg grating sensor for simultaneous measurement of strain and temperature. IEEE Photonics Technol. Lett. 2011, 23, 1340–1342. [Google Scholar] [CrossRef]
  8. Ricchiuti, A.L.; Barrera, D.; Sales, S.; Thevenaz, L.; Capmany, J. Long fiber Bragg grating sensor interrogation using discrete-time microwave photonic filtering techniques. Opt. Express 2013, 21, 28175–28181. [Google Scholar] [CrossRef] [PubMed]
  9. Yao, J.P. Microwave photonics for high-resolution and high-speed interrogation of fiber Bragg grating sensors. Fiber Integr. Opt. 2015, 34, 230–242. [Google Scholar] [CrossRef]
  10. Chen, H.; Zhang, S.; Fu, H.; Zhou, B.; Chen, N. Sensing interrogation technique for fiber-optic interferometer type of sensors based on a single-passband RF filter. Opt. Express 2016, 24, 2765–2773. [Google Scholar] [CrossRef] [PubMed]
  11. Hervás, J.; Richiutti, A.L.; Li, W.; Zhu, N.H.; Fernández-Pousa, C.R.; Sales, S.; Li, M.; Capmany, J. Microwave photonics for optical sensors. IEEE J. Sel. Top. Quantum Electron. 2017, 23, 5602013. [Google Scholar] [CrossRef]
  12. Comanici, M.I.; Chen, L.R.; Kung, P. Microwave photonic filter-based interrogation system for multiple fiber Bragg grating sensors. Appl. Opt. 2017, 56, 9074–9078. [Google Scholar] [CrossRef]
  13. Comanici, M.-I.; Hu, J.; Moslemi, P.; Chen, L.R. Simultaneous interrogation of multiple fiber Bragg grating temperature sensors using a microwave photonic approach. Appl. Opt. 2018, 57, 8338–8342. [Google Scholar] [CrossRef]
  14. Capmany, J.; Ortega, B.; Pastor, D. A tutorial on microwave photonic filters. J. Lightw. Technol. 2006, 24, 201–229. [Google Scholar] [CrossRef]
  15. Mora, J.; Ortega, B.; Díez, A.; Cruz, J.L.; Andrés, M.V.; Capmany, J.; Pastor, D. Photonic microwave tunable single-bandpass filter based on a Mach-Zehnder interferometer. J. Lightw. Technol. 2006, 24, 2500–2509. [Google Scholar] [CrossRef]
  16. Yao, J. Photonic generation of microwave arbitrary waveforms. Opt. Commun. 2011, 284, 3723–3736. [Google Scholar] [CrossRef]
  17. Chen, L.R. Photonic generation of chirped microwave and millimeter wave pulses based on optical spectral shaping and wavelength-to-time mapping in silicon photonics. Opt. Commun. 2016, 373, 70–81. [Google Scholar] [CrossRef]
  18. Wang, C.; Yao, J. Chirped microwave pulse generation based on optical spectral shaping and wavelength-to-time mapping using a Sagnac loop mirror incorporating a chirped fiber Bragg grating. J. Lightw. Technol. 2009, 27, 3336–3341. [Google Scholar] [CrossRef]
  19. Moslemi, P.; Chen, L.R.; Rochette, M. Simultaneously generating multiple chirped microwave waveforms using an arrayed waveguide Sagnac interferometer. Electron. Lett. 2017, 53, 1534–1535. [Google Scholar] [CrossRef]
  20. Arigiris, A.; Konstantaki, M.; Ikiades, A.; Chronis, D.; Florias, P.; Kallimani, K.; Pagiatakis, P. Fabrication of high-reflectivity superimposed multiple-fiber Bragg gratings with unequal wavelength spacing. Appl. Opt. 2002, 27, 1306–1308. [Google Scholar] [CrossRef]
  21. Moselmi, P.; Rochette, M.; Chen, L.R. Simultaneous generation of WDM chirped microwave waveforms using integrated spectral shapers in silicon photonics. J. Lightw. Technol. 2018, 36, 5498–5504. [Google Scholar] [CrossRef]
Figure 1. Generic implementations of an incoherent finite impulse response microwave photonic (MWP) filter, based on (a) a single wavelength optical source and (b) a multiple wavelength optical source.
Applsci 09 00298 g001aApplsci 09 00298 g001b
Figure 2. Principle of monitoring the radio frequency (RF) power at selected frequencies as the MWP filter response | H ( f R F ) | shifts.
Applsci 09 00298 g002
Figure 3. (a) Structure of an in-fiber FP cavity formed by two near-identical Fiber Bragg gratings (FBGs) and (b) zoom of the spectral fringe pattern of a typical device.
Applsci 09 00298 g003
Figure 4. (a) Experimental setup for interrogating two temperature sensors based on single bandpass MWP filtering and (b) spectral response of the two in-fiber FP cavity sensors.
Applsci 09 00298 g004
Figure 5. Measured MWP filter responses from Sensor 1 only, Sensor 2 only, and from both sensors simultaneously (after Reference [12]).
Applsci 09 00298 g005
Figure 6. (a) Variation in normalized RF power as a function of temperature for Sensor 1 at frequencies of 7.24 GHz (■) and 7.48 GHz (♦) and for Sensor 2 at frequencies of 15.38 GHz (▲) and 15.1 GHz (•). (b) Ratiometric measurement for Sensor 1 (▲, magnitude of the ratio of power at 7.48 GHz to 7.24 GHz) and for Sensor 2 (•), magnitude of the ratio of power at 15.38 GHz to 15.1 GHz) (after Reference [12]).
Applsci 09 00298 g006
Figure 7. MWP filter response for Sensor 1 which is held at constant (room) temperature, while the temperature of Sensor 2 is varied 40 °C to 80 °C (after Reference [12]).
Applsci 09 00298 g007
Figure 8. Illustrating simultaneous operation of the two sensors. MWP filter responses for Sensor 1 when the temperature is increased from 25 °C to 80 °C (a) and Sensor 2 when the temperature is increased from 25 °C to 60 °C (b) (after [12]).
Applsci 09 00298 g008
Figure 9. Experimental setup for implementing multiple two tap MWP filters based on superimposed LCFBGs in a Sagnac loop.
Applsci 09 00298 g009
Figure 10. Characteristics of Sensor 1 as the temperature is increased from 30 °C to 70 °C, while Sensor 2 is maintained at a constant (room) temperature. MWP filter responses for Sensor 1 (a) and Sensor 2 (b) and corresponding normalized RF power vs. temperature at frequencies of 3.8 GHz and 6.2 GHz (for Sensor 1) and 4.6 GHz and 6.5 GHz (for Sensor 2).
Applsci 09 00298 g010
Figure 11. Characteristics of Sensor 2 as the temperature is increased from 30 °C to 70 °C, while Sensor 1 is maintained at a constant (room) temperature. MWP filter responses for Sensor 2 (a) and Sensor 1 (b) and corresponding normalized RF power vs. temperature at frequencies of 4.6 GHz and 6.9 GHz (for Sensor 2) and 3.8 GHz and 5.4 GHz (for Sensor 1).
Applsci 09 00298 g011
Figure 12. Setup for generating two chirped microwave signals using an AWGSI incorporating multiple LCFBGs, followed by WTT mapping. PC: Polarization controller, VOA: Variable optical attenuator, EDFA: Erbium-doped fiber amplifier, PD: Photodetector.
Applsci 09 00298 g012
Figure 13. Measured chirped microwave waveforms when applying a temperature of (a) 30 °C and (b) 50 °C to Sensor 1, while keeping Sensor 2 at constant temperature; (c) Calculated spectrogram for the waveform in (a); (d) Reference signal used to compress the waveforms in (a,b). Measured chirped microwave waveforms when applying a temperature of (a) 21 °C and (b) 50 °C to Sensor 2 while keeping Sensor 1 at constant temperature; (c) Calculated spectrogram for the waveform in (a); (d) Reference signal used to compress the waveforms in (a,b) (after Reference [13]).
Applsci 09 00298 g013
Figure 14. Correlation signals (compressed pulses) for the waveforms measured when LCFBG1 is at 30 °C (Figure 2a) and 50 °C (Figure 2b). Correlation signals (compressed pulses) for the waveforms measured when LCFBG2 is at 21 °C (Figure 4a) and 50 °C (Figure 4b) (after Reference [13]).
Applsci 09 00298 g014
Figure 15. Variations in correlation peak (peak of compressed pulses) for Sensor 1 and Sensor 2 as a function of temperature applied to (a) Sensor 1 only and (b) Sensor 2 only (after Reference [13]).
Applsci 09 00298 g015

