Article

Impact of Aeration on the Removal of Organic Matter and Nitrogen Compounds in Constructed Wetlands Treating the Liquid Fraction of Piggery Manure

1
Department of Green Chemistry and Technology, Ghent University, Coupure Links 653, 9000 Ghent, Belgium, Block B 6th floor
2
Rietland bvba, Van Aertselaerstraat 70, 2322 Minderhout, Belgium
3
Department of Ecological Studies and International Centre for Ecological Engineering, University of Kalyani, Kalyani, Nadia- 741235 West Bengal, India
*
Author to whom correspondence should be addressed.
Appl. Sci. 2019, 9(20), 4310; https://doi.org/10.3390/app9204310
Submission received: 29 August 2019 / Revised: 3 October 2019 / Accepted: 10 October 2019 / Published: 14 October 2019

Abstract

:
The increasing demand for sustainable, robust and cost-efficient wastewater treatment techniques strengthen the implementation of constructed wetlands (CWs) in the agricultural sector. In countries like Belgium (Flanders), the compliance of strict water quality standards and surface area requirements have hindered considerably their application. New wetland designs such as aerated CWs, could help to overcome these challenges. This study evaluated the capacity of artificially aerated mesocosm systems to decrease chemical oxygen demand (COD) concentrations below the 125 mgO2/L limit imposed on installations treating animal manure. The treatment of this high-strength wastewater has been slightly studied via aerated CWs. A three-stage experiment investigated the effect of constant, intermittent and non-aeration regimes on: ammonium volatilisation, the evolution of organic and nitrogen compounds concentrations, and denitrification. The results were assessed through a mixed modelling procedure using SAS 9.4 software. A COD removal between 65% and 58% in constantly and intermittent aerated systems, versus 27% COD removal in the non-aerated system indicated the effectiveness of aeration. However, a dissimilarity was encountered in the removal of nitrogen compounds, resulting in an 82% decrease of nitrate concentrations in the non-aerated system, versus 0.5% and 11% in the aerated ones. Based on the results, this experimental set-up adjusted to field operational conditions can prove that aerated CWs can treat the liquid fraction of piggery manure.

1. Introduction

In Northwest Europe (NWE), several projects regarding waste management and bio-based resource recovery processes have been interlinked and developed based on circular economy principles, in opposition to the traditional linear economy. The aims have been to minimise natural resource needs, the emissions of waste, energy leakage, and promote their practice elsewhere. Flanders in Belgium, being part of the NWE area, is classified as a nitrate vulnerable zone (NVZ), where nutrients resulting from the excess of animal manure should be reduced. The surplus of farm wastes has largely affected the soil, ground and surface water of coastlines and watercourses [1]. Nitrate vulnerable zones are restricted on the use of fertilisers and are obliged to reduce nitrate concentrations in water below the 50 mgNO3/L. Since the 2000s, manure management activities involve the capture, storage, spread on the field, treatment, and its re-use as a source (e.g., as biomass for energy production, growth medium for algal cultivation). Land spreading can be a viable option where there are large areas of available farmland. Alternatively, pig slurry should be treated either for further use (e.g., fertiliser) or proper disposal. One of the available manure management practices consists of a three-stage process. In the primary treatment, pig slurry is separated into a thin/liquid fraction and a thick/solid fraction [2,3]. In secondary treatment, the solid fraction is converted into an exportable product, such as soil enhancers and fertilisers [3]. The liquid fraction can be treated by biological reactors where nitrogen and phosphorus concentrations are depleted, hence, the separation of pig manure into liquid and solid fractions as the primary treatment. The activated sludge treatment and anaerobic digestion (AD) as the secondary treatment are considered the most common and among the best options available amongst manure management techniques [2,4]. Given the high concentrations of nutrients in soil and strict implemented regulations, additional treatments are needed for both fractions of manure [5,6]. One of them is the use of constructed wetlands (CWs) as the tertiary treatment of the liquid fraction of piggery manure. The liquid fraction coming from activated sludge reactors and the liquid digestate from the AD process, can be treated by CWs to reduce the concentrations of remaining nutrients and other pollutants [4,7]. In Flanders, CWs treating wastewater of animal manure can discharge effluents with a maximum of 15 mg/L of total nitrogen (TN), 125 mgO2/L of chemical oxygen demand (COD), and pH between 6.5 to 8.5 units [8]. There are no specified values regarding the microbial parameters. However, to meet the COD discharge limit, CWs sometimes must be over-dimensioned depending on the mass loadings. Consequently, in regions with limited land availability (e.g., Flanders) the implementation of CWs becomes restricted. As described by Donoso et al.[6], regardless of the size a CW, its discharge must meet the standards limits set by the EU Water Framework Directive. These limits were defined on basis of CWs larger than 50 ha and large waterbodies, but not to actual conditions. Therefore, there is a need to investigate the effect of emerging technologies that are adaptable to the treatment process and allow higher COD removal efficiencies to avoid the over dimensioning of CWs, and help meet the standards.
In this regard, this study evaluates the effect of implementing artificial aeration in CWs to reduce COD concentrations. It is hypothesised that aerated systems favour the depletion of slowly biodegradable or non-biodegradable organic compounds and facilitate meeting discharge limits. However, considering that constant or intermittent aeration could also favour ammonium (NH4+) volatilisation and would therefore hinder the denitrification process, the evolution of total nitrogen (TN) and nitrate (NO3) concentrations are also studied.
The different international standardised methods for COD determination do not differentiate between biodegradable and recalcitrant COD fractions [9]. The biological and chemical oxygen demand ratios (BOD/COD), at times used to indicate the biodegradation capacity of organic matter to be broken down, are generally low in influents and effluents of CWs treating the liquid fraction of animal manure [10]. The high influent COD concentrations of approximately 800–1700 mgO2/L and 50–100 mgO2/L of BOD (1:17 BOD/COD ratio) after the biological treatment of the liquid fraction of animal manure indicate the low biodegradability of the remaining COD [10]. The constructed wetlands treating the liquid fraction of piggery manure together with plant litter generate fractions of recalcitrant or non-biodegradable organic matter which increase COD concentrations [11,12,13].
Studies have indicated that CWs have reached BOD and COD removal efficiencies above 80% [2,10,14,15] in Flanders. Several researchers have shown that aerated CWs can potentially enhance the removal of organics and nutrients [4,16,17,18,19]. Mostly synthetic, urban or landfill leachate wastewaters have been considered for testing. S. Wu et al. [19] assessed the effect of aeration and effluent recirculation on: (i) organic matter, and (ii) total nitrogen removal of pig manure liquid digestate generated by anaerobic digestion. In this study, the liquid fraction of piggery manure coming from the biological treatment and discharged into a CW was used for analysis. However, the present experimental set-up only considered the effect of aeration and no recirculation of the wastewater. Water was collected and kept in containers where different aeration regimes were applied. The total nitrogen (TN), ammonium-nitrogen (NH4+-N), nitrate-nitrogen (NO3-N), COD and BOD concentrations were determined to assess the effect of aeration over time. During the experimental process, three aspects were tested: (i) ammonium volatilisation due to aeration; (ii) the evolution of physicochemical parameters of the wastewater (COD, BOD and nitrogen compounds concentrations); iii) the enhancement of the denitrification process by the addition of an external carbon source. The results were treated through a mixed model procedure and discussed, based on the removal efficiency of the different aeration rates.

2. Materials and Methods

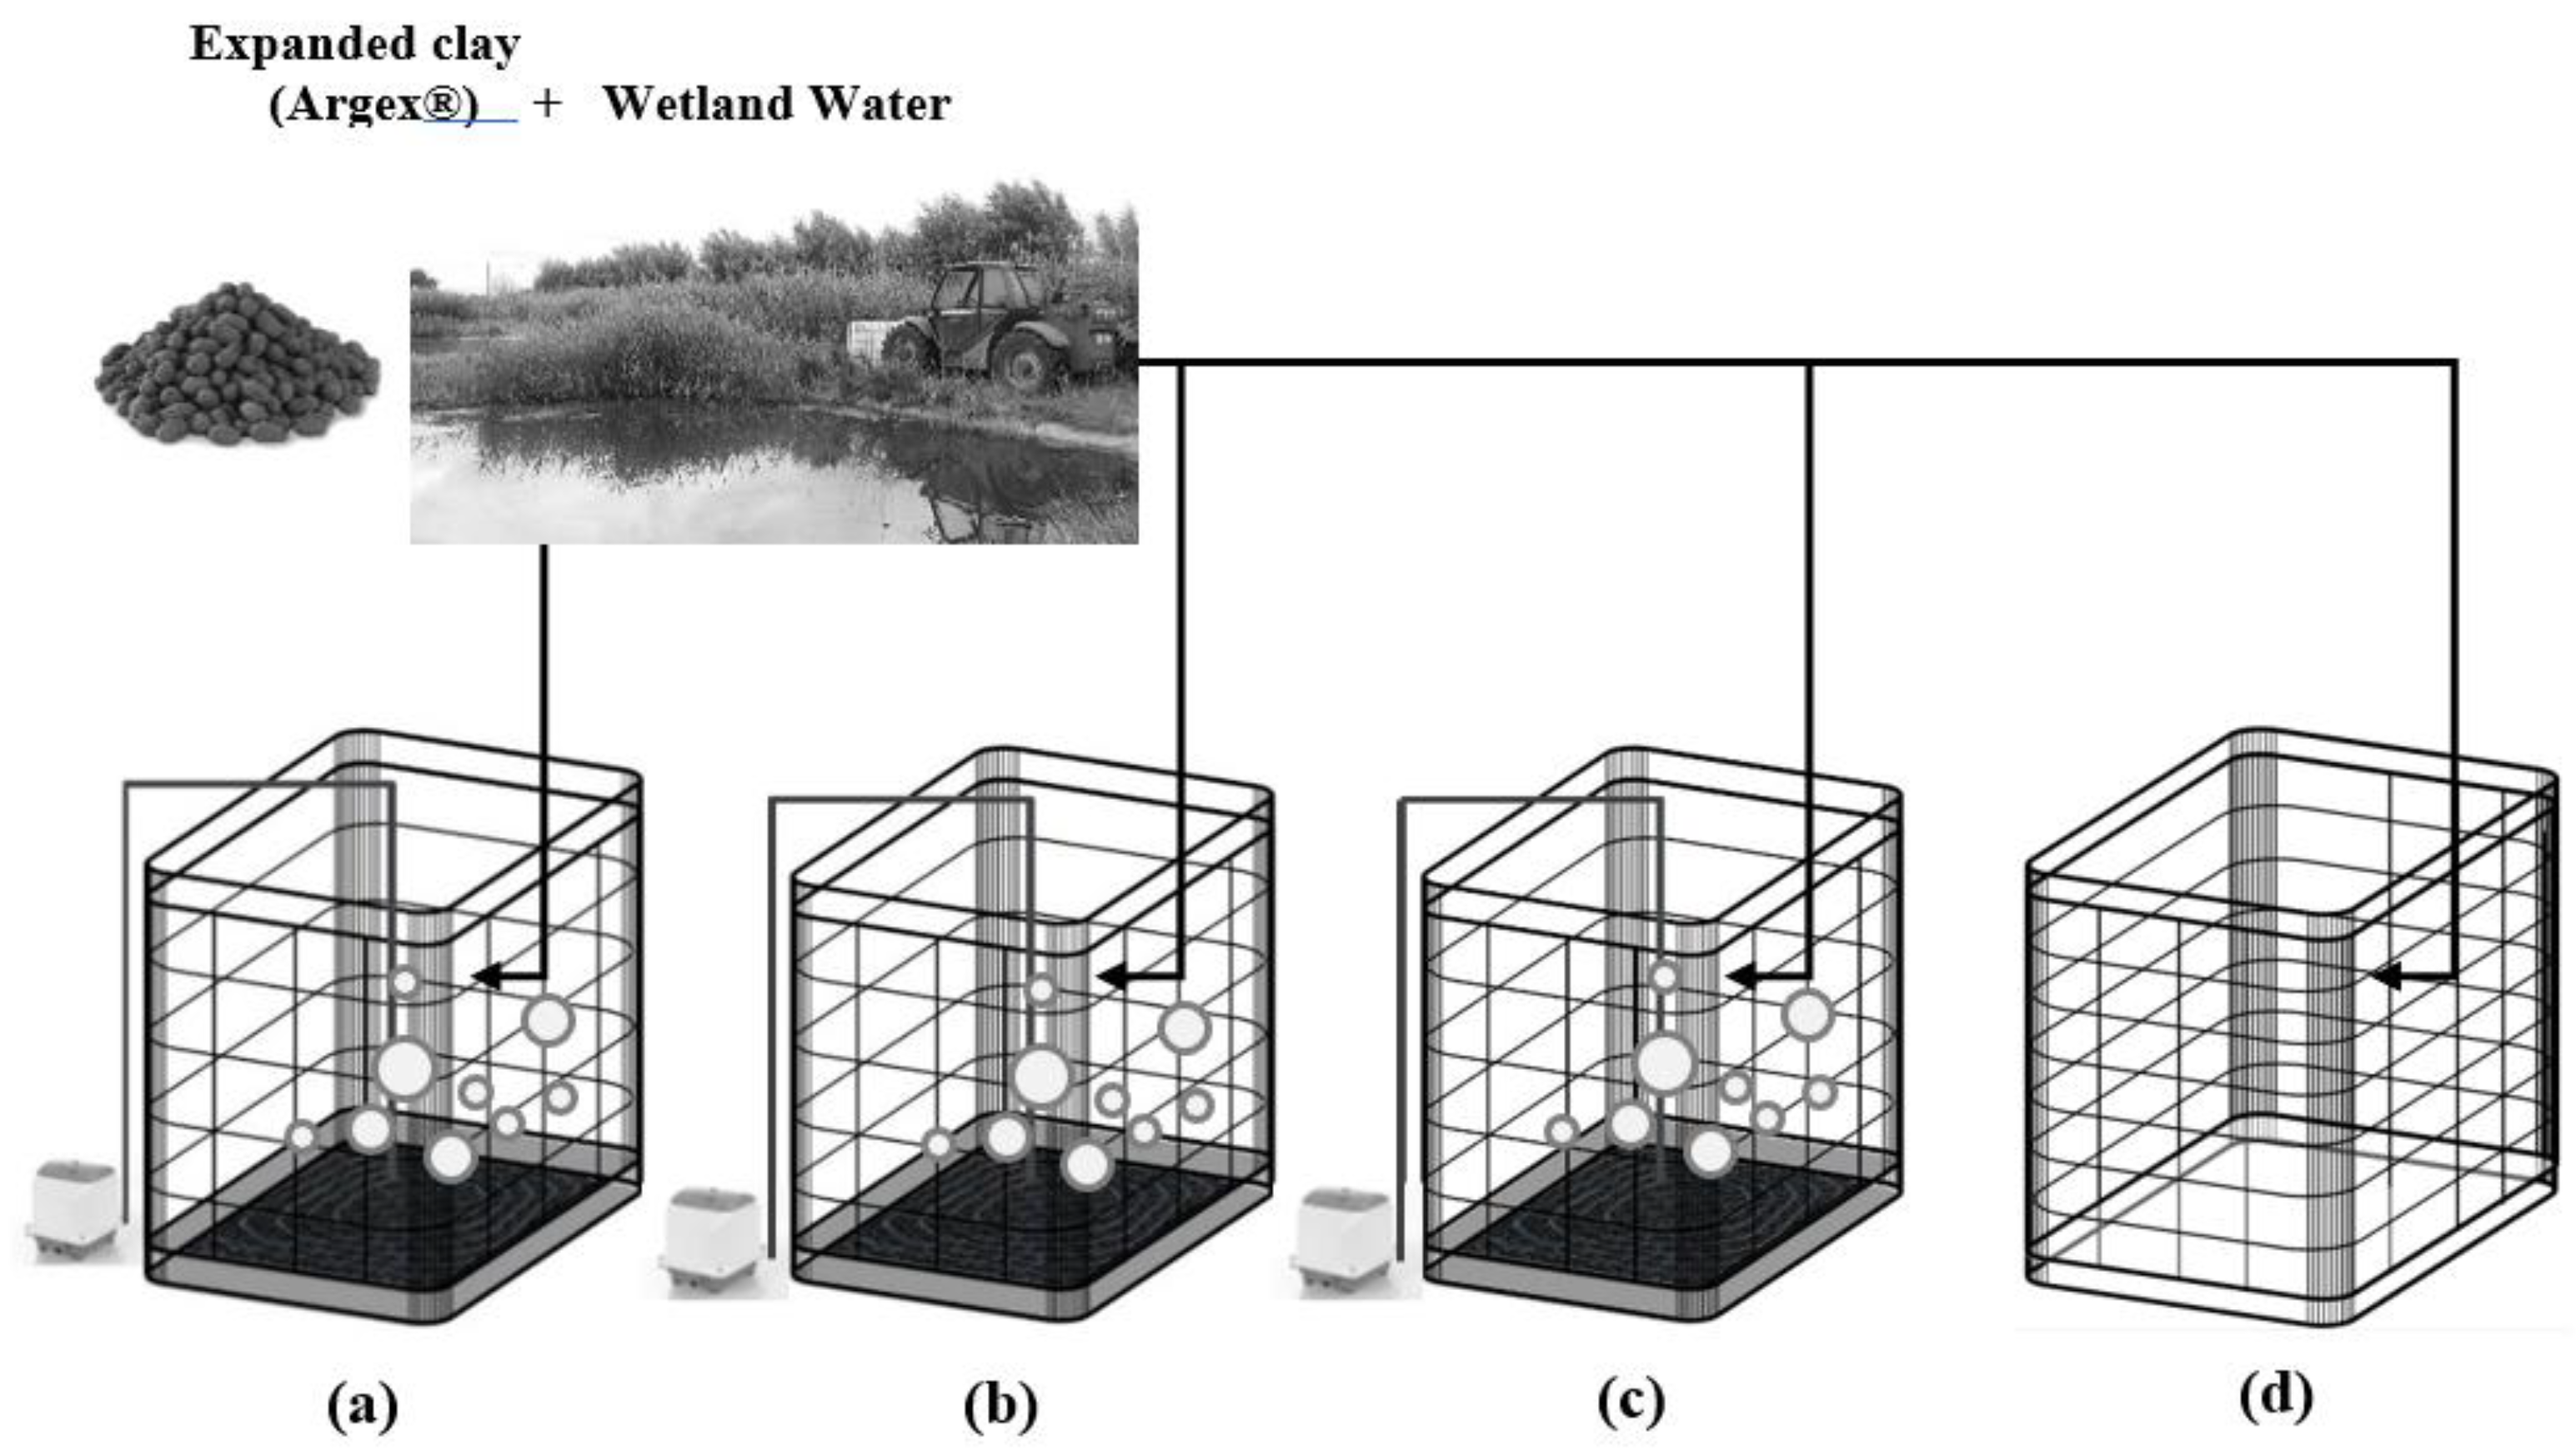
2.1. Experimental Setup

The experiments were performed in four parallel 1 m3 cube-shaped intermediate bulk containers (named IBC A, B, C, and D) made of white translucent polyethylene and held within a tubular iron cage. The IBCs were kept open with an opened surface of 1m2 and placed inside a barn located next to a CW treating the liquid fraction of piggery manure. The aeration pipes were installed at the bottom of three of the four IBCs for air supply. Aeration was provided with a membrane blower, type BibusSecoh JDK20, one for each aerated IBC.
Each of the IBCs was filled up to ninety percent of their capacity with normal round expanded clay aggregates (Argex®). Their particle size was between 8 to 16 mm with a dry-weight density of 340 kg/m3. An approximate volume of 400 L was filled with influent of the CW which was not renewed throughout the whole experiment. The different aeration rates were provided in each of the three IBCs and one was kept without aeration for comparison. When air was provided, the flux was 25 L/min. The aeration cycles were set in a way that IBC A was constantly aerated, whereas IBC B and C represented two intermittent aeration systems with two different aerated/non-aerated cycles every day. For IBC B, the intermittent aeration regime consisted of four hours with aeration followed by four hours without aeration. For IBC C, the intermittent aeration regime consisted of six hours with aeration followed by four hours without aeration. The IBC D served as a not-aerated control. The whole testing period had a duration of four months (June to October 2017).
A schematic representation of the experimental setup is presented in Figure 1.
Three research questions were formulated considering the different aspects to assess during the experimental process. At the beginning or first experimental stage, it was hypothesised that ammonium volatilisation due to active aeration may be substantial. To test this effect, an additional solution of ammonium 15% was added to each IBC to reach an initial concentration of 200 mgNH4+-N/L. TN, NO3 and NH4+ concentrations were determined from the samples collected at the top right and left corners, and from the centre of each container between 40 to 50 cm depth. The daily samples were collected during five consecutive days.
Following this sequence, a six-week stabilisation period of the IBC systems was considered as appropriate to allow biofilm growth prior to proceeding with the second stage of the experiment. The constant and intermittent aeration regimes were kept during this six-week period. While testing a comparable experimental set-up, Gupta et al. [20] and Wu et al. [4] considered a period of two months for the establishment and acclimatisation for microbial communities to populate the substrate particles. In the second stage of the experiment, the effect of aeration was evaluated considering the evolution of COD, BOD, TN, NO3-N and NH4+-N concentrations. The samples were collected at the same spots of each container on a regular basis twice a week during a period of two months.
The third stage of the experiment considered the addition of an external carbon source (glucose) solution in each container. Its influence was tested on the denitrification process which was possibly affected by the continuous and intermittent aeration regimes. Prior the addition of glucose solutions, actual COD and TN concentrations were determined. Based on these concentrations, glucose solutions with a 3:1 COD/N ratio were prepared and added in each container. Then, NO3-N and TN concentrations were determined from the samples collected on a daily basis from each IBC during a five-day period.

2.2. Physicochemical Analyses

At every sampling day, regardless of the testing periods, water samples were collected in triplicate from each IBC and preserved at 4 °C. The collected samples were analysed with a maximum holding time of one to two days. This is in agreement with the EPA-600/4-79-20 methods for chemical analysis of water and wastes [21]. The determination of pH, electrical conductivity (EC) and dissolved oxygen (DO) measurements were performed in the laboratory. pH was measured using an 826-pH mobile meter. EC was determined using a four-electrode conductivity sensor model WTW Cond 315i. DO was determined using a WTW Oximeter, model 330i including a CellOx 325 sensor (probe). BOD concentrations were determined through a respirometric method according to the Standard Methods for the Examination of Water and Wastewater [22]. The initial DO concentrations and after 5 days-incubation period at 20 °C ± 1 °C were measured in the BOD bottles. The COD concentrations were determined through spectrophotometric testing using NANOCOLOR® test kits, range 15–160 mg/L COD [23]. The TN concentrations were determined photometrically. First, a Spectroquant® reagent (Crack Set 20) was used to transform organic and inorganic to nitrate. Later, the TN concentrations were determined via test kits with a measuring range of 0.2–20 mg/L NO3-N [24]. Likewise, this test kit was used to determine NO3 concentrations, with the difference that the initial destruction step was not needed. NH4+-N was determined using a Spectroquant® test kit with a measuring range of 0.05–3 mg/L. After the seventh sampling instance, NO3 and NH4+ were determined by ion chromatography technique using a Methrom 761 Compact Ion Chromatograph.

2.3. Hypotheses Testing Through a Mixed Model Procedure

The removal percentage of each measured variable was estimated in every stage of the experiment. Subsequently, to identify the most efficient aeration frequency in terms of removal, a mixed modelling procedure (PROC MIXED) in SAS 9.4 software was used. Through the development of mixed linear models, the correlation between measurements of the water samples taken at each time point for each IBC system were recorded. The selected statistical analysis was based on its flexibility to model the repeated measurements from the same experimental unit. For the model development, each of the containers (labelled: ”subject”), the different aeration frequencies (labelled: ”treatment”), and sampling days (labelled: ”time”) were considered as categorical variables. pH, EC, DO, COD, TN, NO3 and NH4+ represented the response variables each in turn. Subject was modelled as a random effect while treatment, time and the interaction between treatment and time represented the fixed effects. The degrees of freedom were estimated using the Satterthwaite approximation [25].
Given the fact that the dependent variables in the model each represented a measurement on the same experimental IBC, the “repeated” statement was used to model the variability within treatment over time. A significance level was set at p ≤  0.05. Finally, the compound symmetry (CS) variance covariance structure, which assumes that the correlation between any two measurements from the same treatment is the same, was used. Then, to compare the expected least squares means response between the different treatments, the “lsmeans” statement was used together with the Tukey adjustment method which corrects the p-values for multiple testing. In a general context, the statistically significant estimated effects represent the matching days when the concentrations of treatment (e.g., A and B) significantly change. By assessing the size and the sign (+ or −) of the effects, together with the repeated influence of a specific aeration regime in the concentrations of each variable, overall judgements could be done. Finally, to validate the model estimations and overall findings, the model residuals were plotted against the corresponding fitted values to check for normality.

3. Results

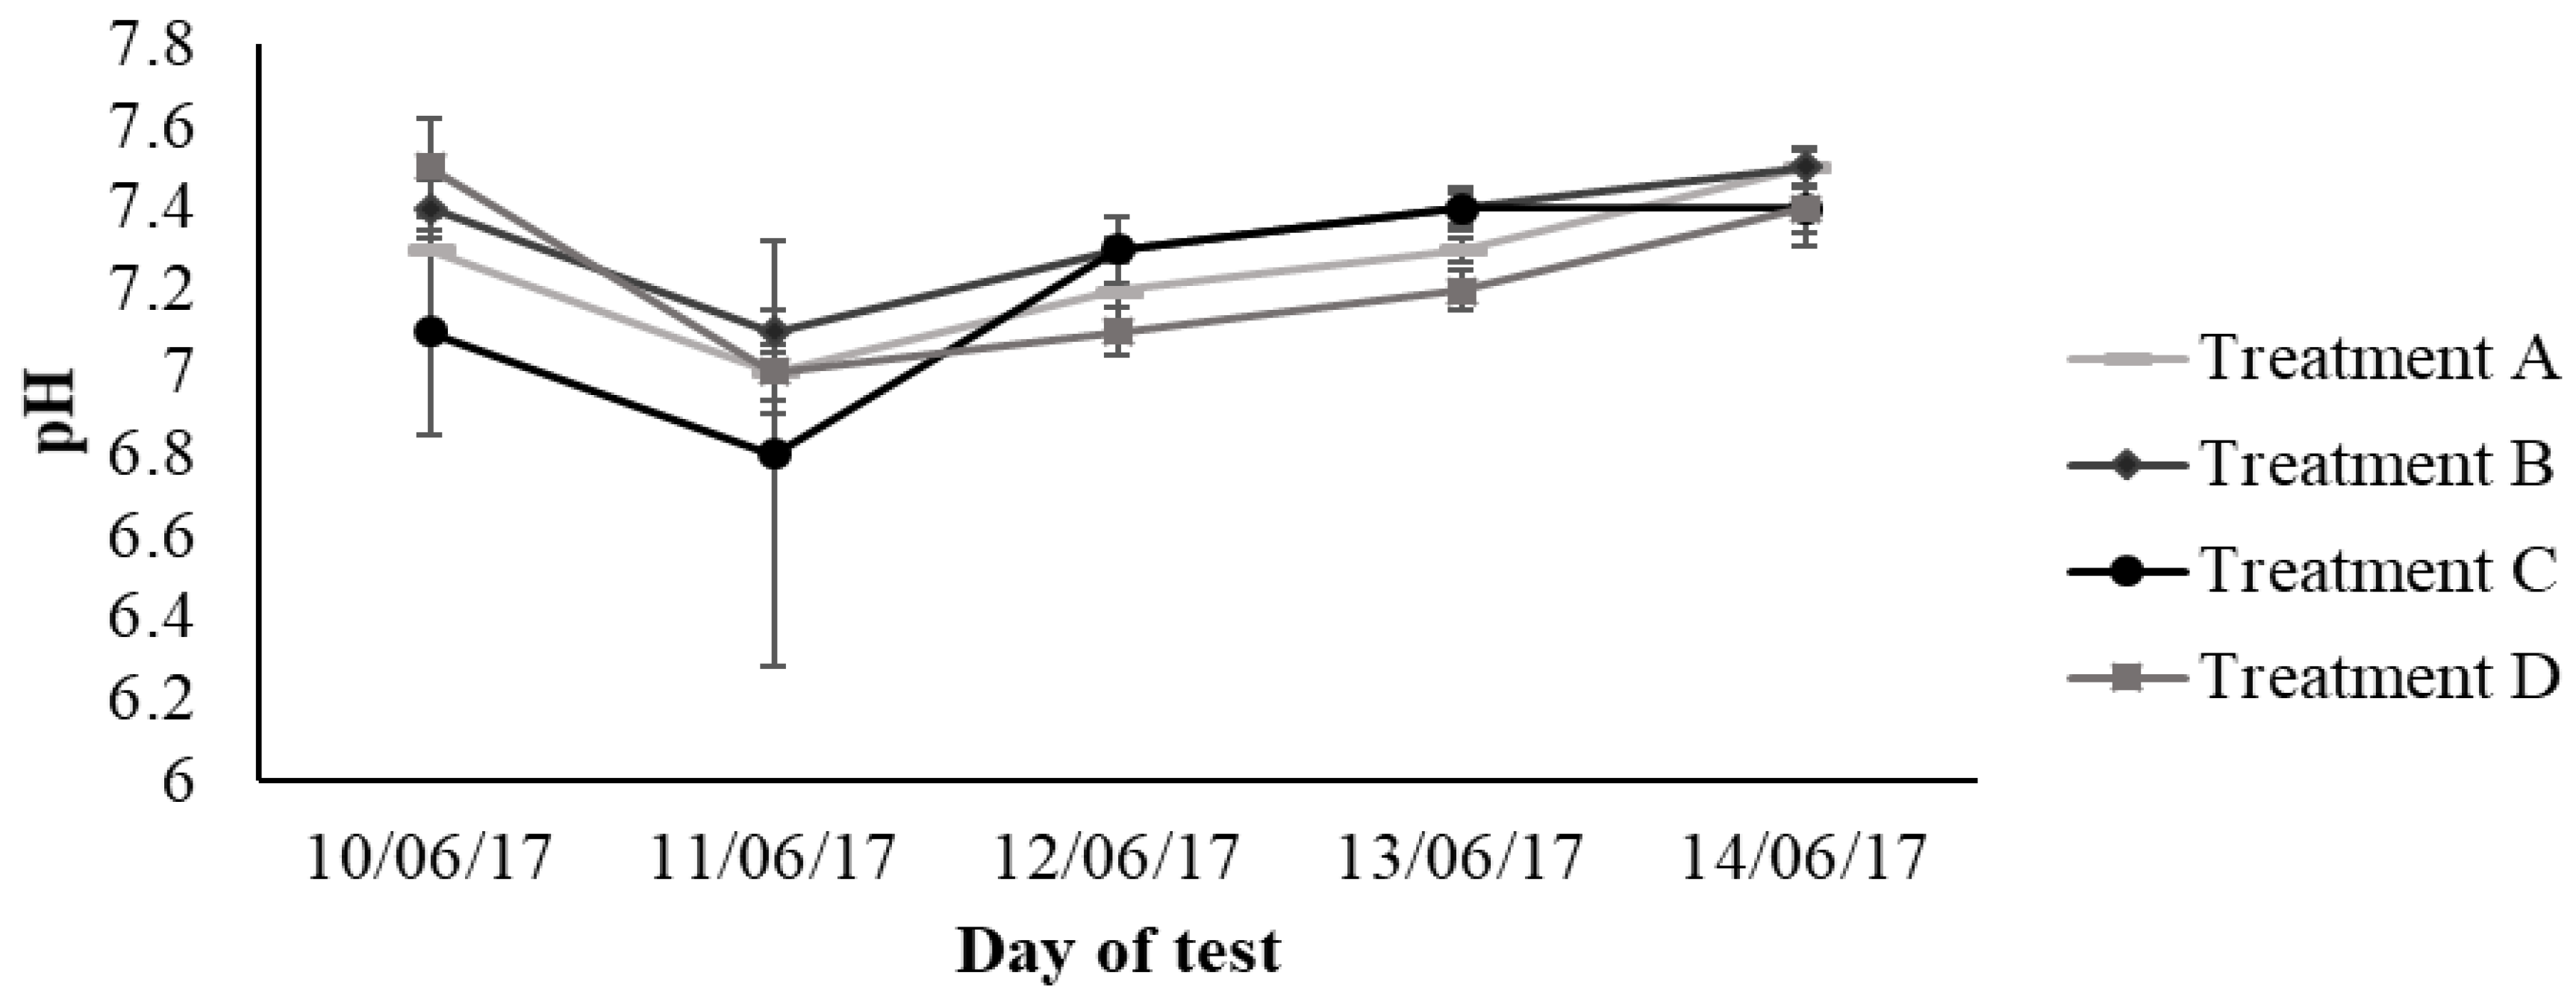
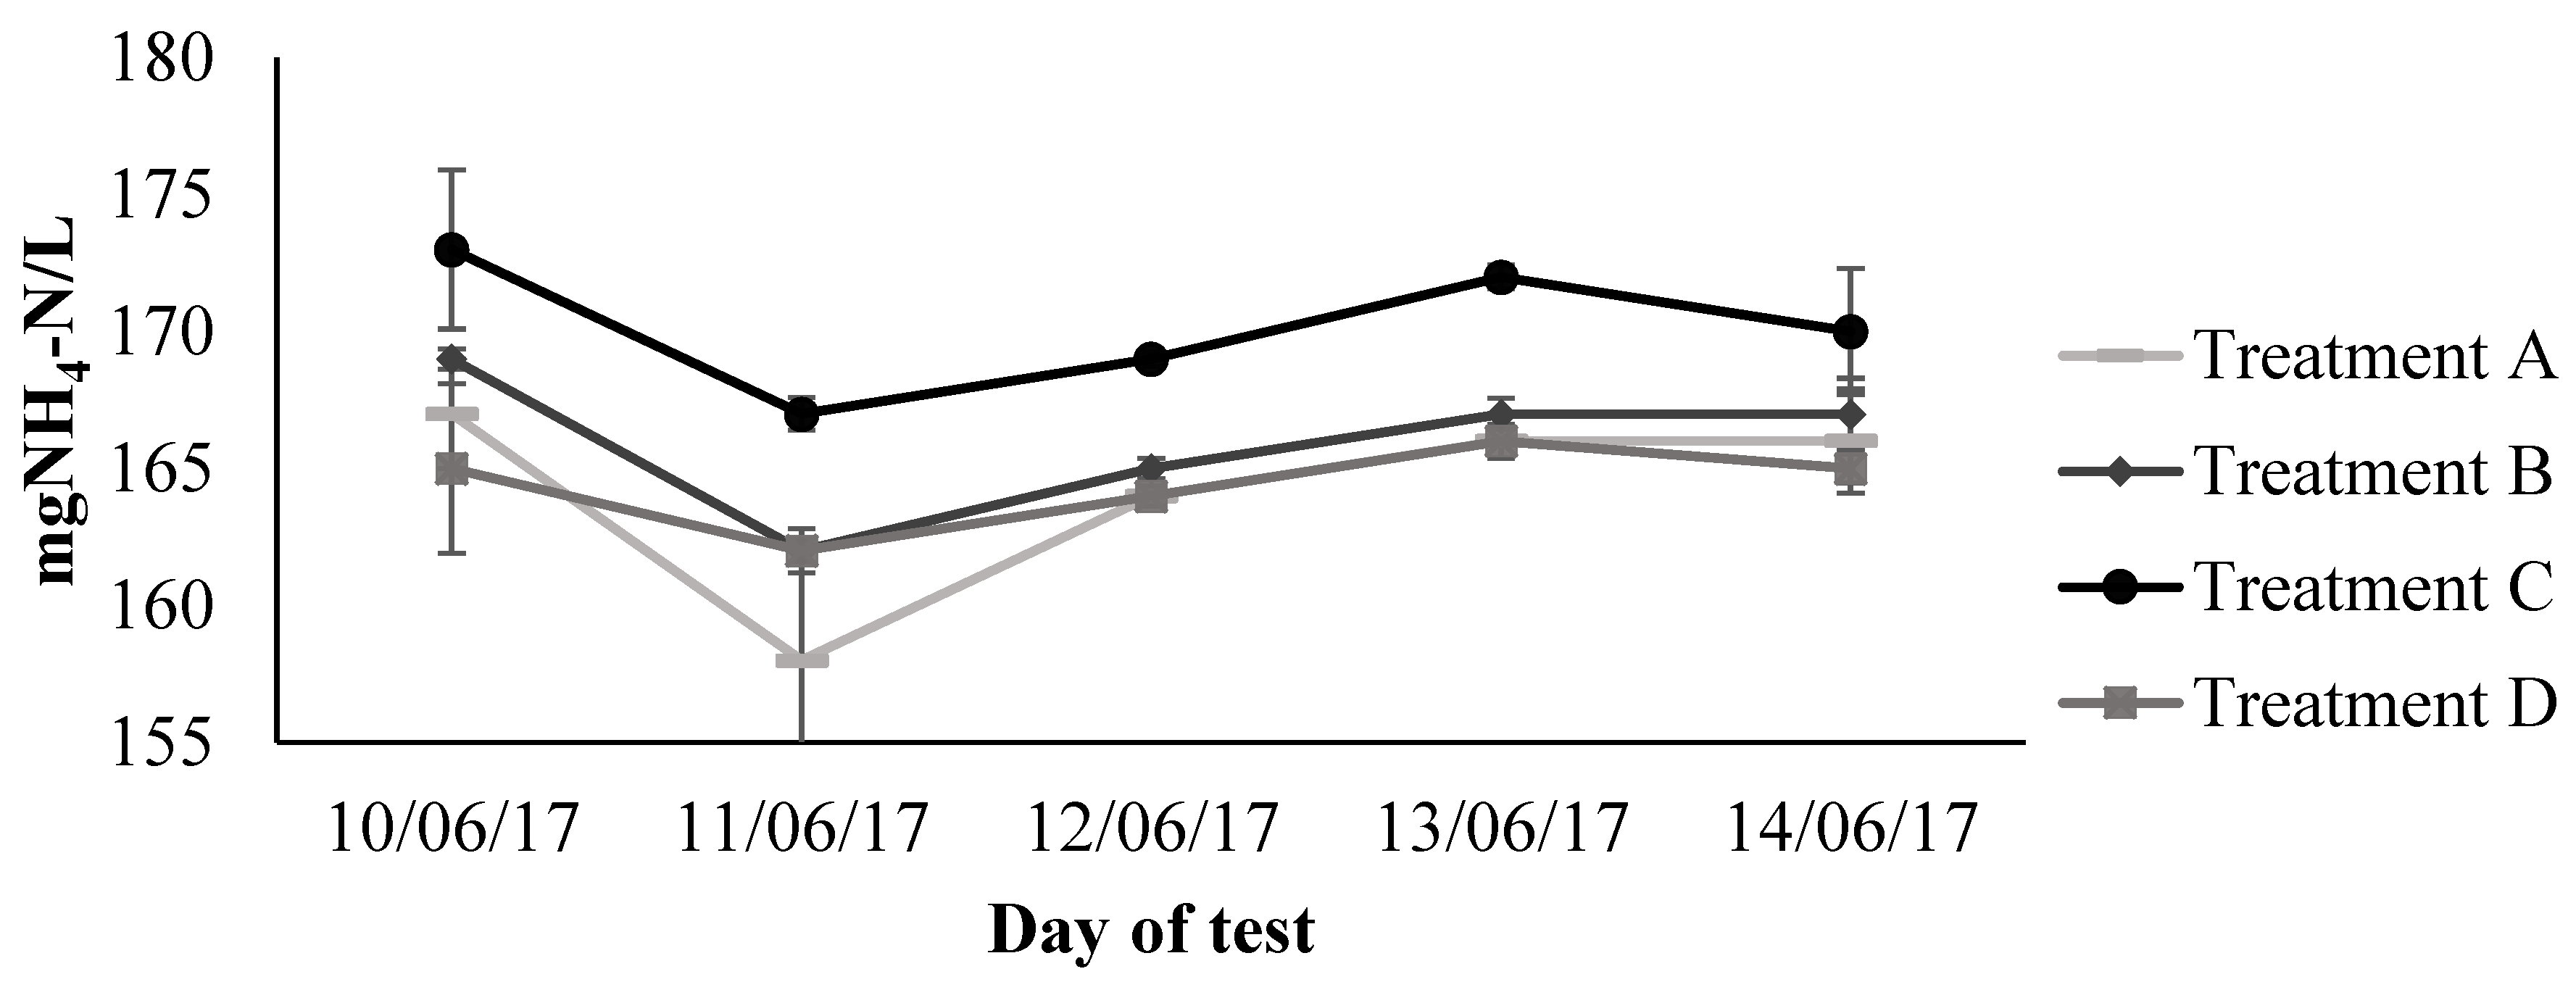
3.1. First Stage: Testing Ammonium Volatilisation

The initial mean concentrations between 165 to 173 mgNH4+-N/L in comparison to the mean concentrations determined on the fifth day of the test between 165 to 168 mgNH4+-/L, indicate that no significant decrease (p > 0.05 based on Wilcoxon rank sum test) was evident in the ammonium concentrations. The ammonium concentrations recorded for treatment A showed more variability than the other treatments, most probably due to the constant aeration in the system. However, the pH values of 6.8–7.5 indicate that only approximately 1% of NH3 is present, thus no significant NH4+ removal could be expected according to pKa (NH4+/NH3) = 9.25 at 25 °C.
Figure 2 and Figure 3 show the mean ammonium concentrations and pH values determined at each IBC during the five-day period of this stage.

3.2. Second Stage: Evolution of Physicochemical Parameters, Organic and Nitrogen Compound Concentrations under Different Aeration Regimes

The initial and final value of each physicochemical parameter, organic and nitrogen compound concentrations are presented in Appendix A Table A1. Based on these records, the removal percentages of organic and nitrogen compounds were estimated considering the different aeration regimes. The evolution of recorded values was assessed based on Figure 4 and Figure 5. Their statistical relevance was evaluated through the estimates derived from the mixed model procedure. For a better graphical interpretation of the results, Figure 4 shows the evolution of pH, EC, DO, BOD, and COD, whereas, Figure 5 indicates the evolution of nitrogen compounds (NH4+-N, NO3-N and TN) set against the sampling date.
The evolution of the three different nitrogen-compounds per treatment was compared in single graphs due to the link in their removal processes. Figure 4a indicates that pH values decreased over time in the IBCs where constant and intermittent aeration was provided. Relatively similar pH values were registered in treatment A (from 7.2 to 5.2), treatment B (from 7.3 to 5.4) and treatment C (from 7.3 to 5.4) after 60 days. An opposite effect was identified in the IBC without aeration where pH increased from 7.1 to 8.1 in the same period. The initial conductivity values 13.6 mS/cm shown in Figure 4b remained relatively stable throughout the whole testing period. On the last testing day of the two-month period, the water samples representing treatment B (13.2 mS/cm), followed by the ones of treatment D (13.6 mS/cm) showed a slight decrease in comparison with the water samples from treatment A and C (14.1 and 14 mS/cm respectively). The DO concentrations (Figure 4c) in treatments A, B, and C increased over time. Again, relatively similar values were recorded among these treatments. Treatment A (from 7.2 to 9.3 mg/L), treatment B (from 7.4 to 9.3 mg/L), treatment C (from 7.5 to 9.3 mg/L) clearly show the effect of aeration provided to each IBC. However, the DO concentrations in treatment D lowered and stayed below the initial 5 mg/L since no air was supplied to the system. It is relevant to state that reported DO concentrations should be considered as an indication that the systems were aerated through the experimental period. However, for quantification purposes and the control of aerated and non-aerated periods, daily and in-situ measurements are recommended.
Figure 4e shows that the COD concentrations decreased gradually over time, but only 27% removal was achieved in the case of treatment D. A removal of 65% was obtained when constant aeration was provided. The concentrations reported from treatment B and C showed that shorter aeration periods resulted in lower removal efficiency (63% and 58% respectively). For the specific case of BOD in Figure 4d, the applied model procedure was not able to estimate the statically significant effects of aeration. Due to fluctuation in the measurements, there was insufficient data to estimate the particular covariance structure [26]. Therefore, the effect of aeration in BOD is considered based on observations and interpreted with caution. The BOD measurements show high variability within the treatments. Only after the 10th sampling day (one-month period), the BOD concentrations in treatments A, B, and C followed a similar pattern and stabilised at approximately 8 mgO2/L. In treatment D, the BOD concentrations remained higher at approximately 33 mgO2/L.
Similar to BOD, NO3-N (Figure 5 Applsci 09 04310 i001
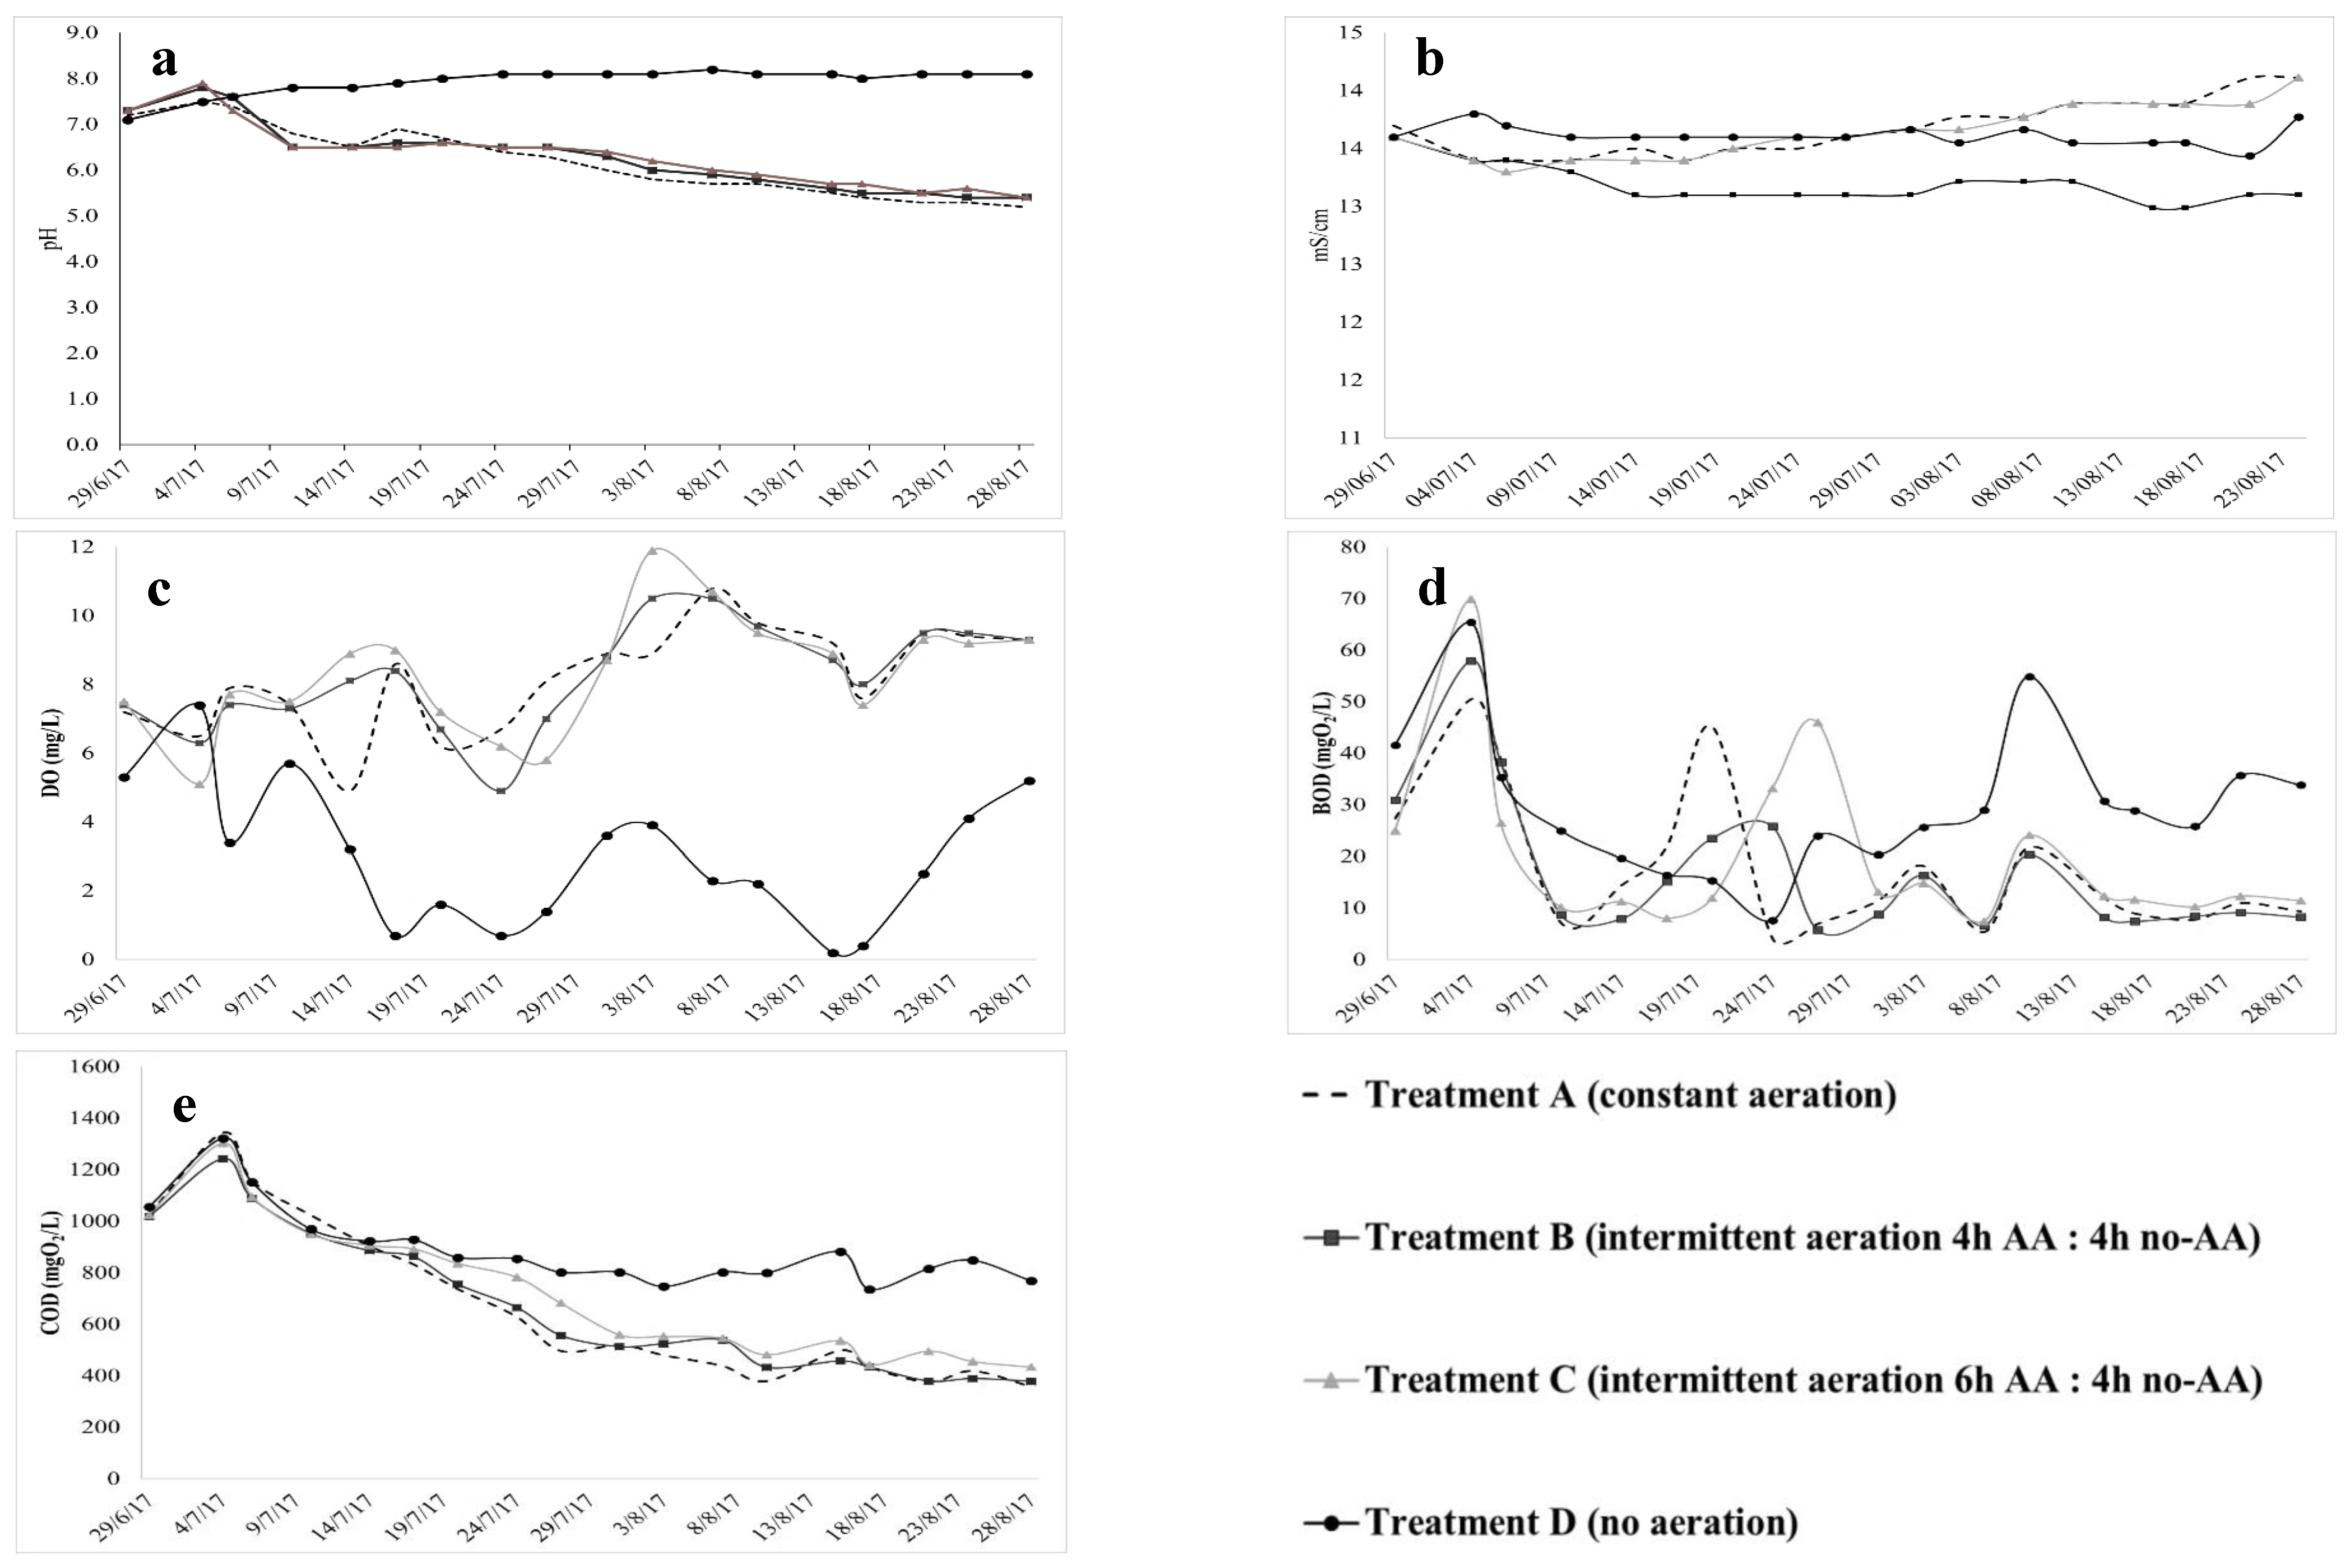
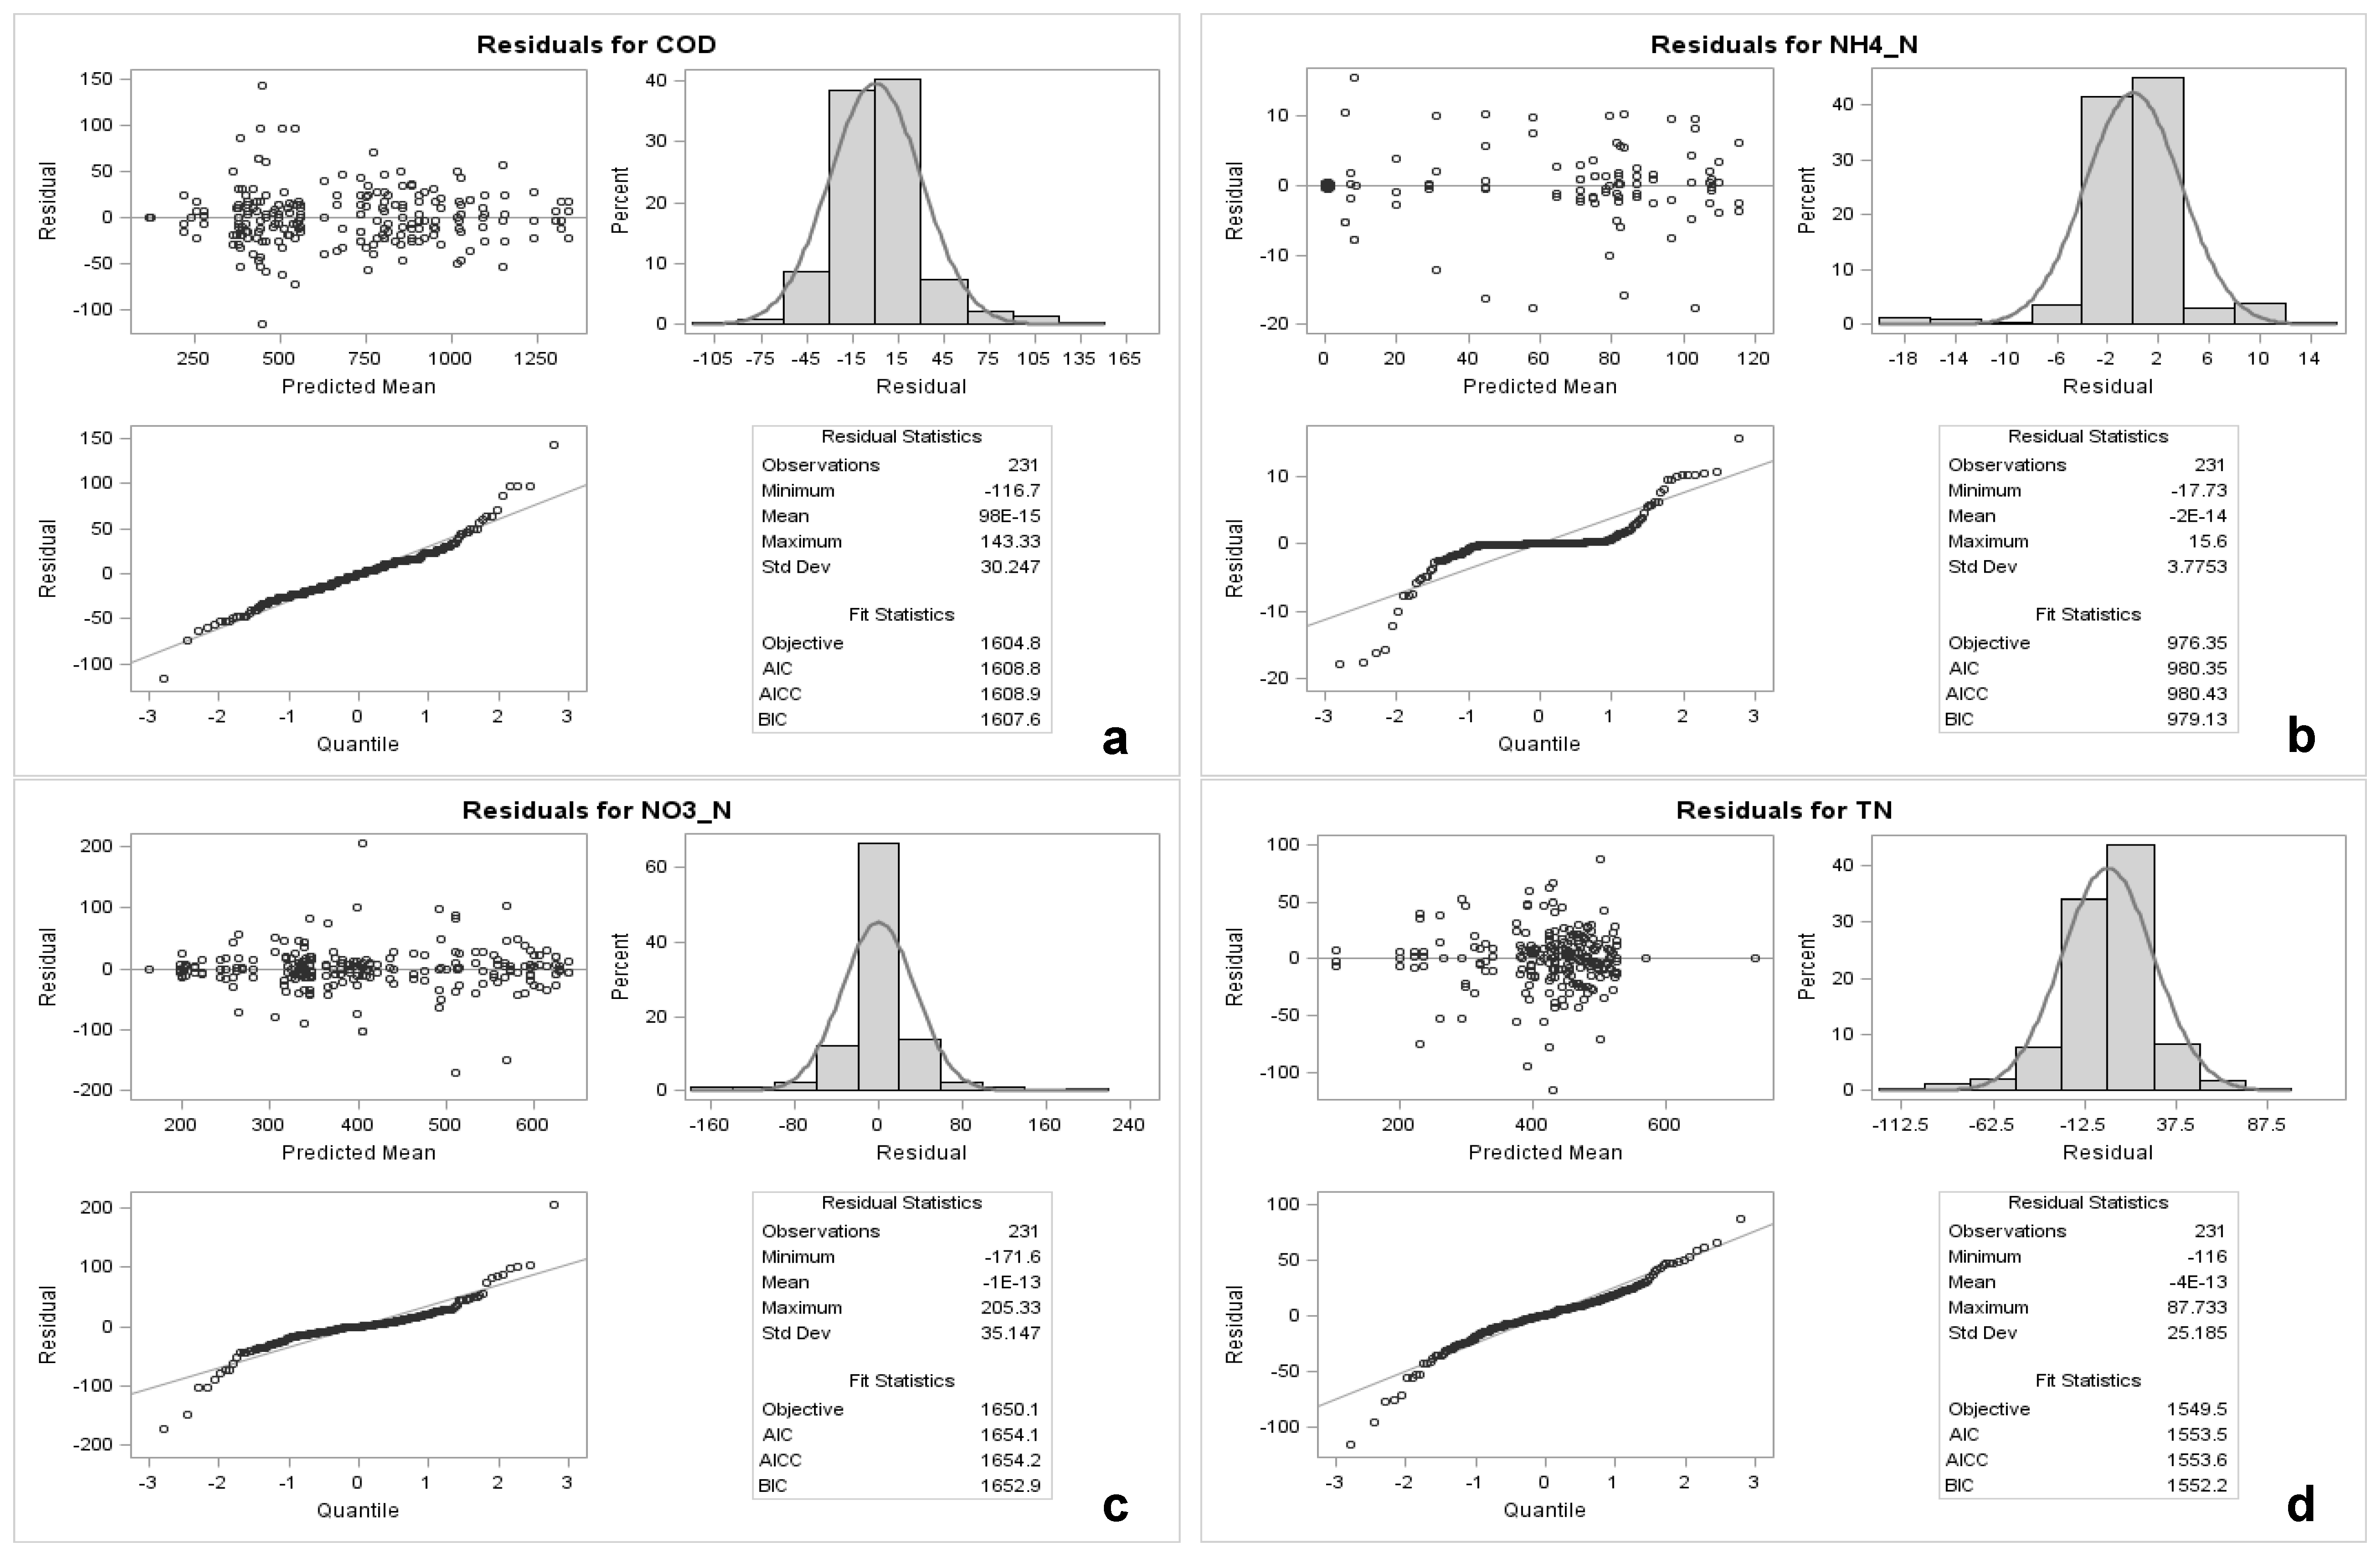
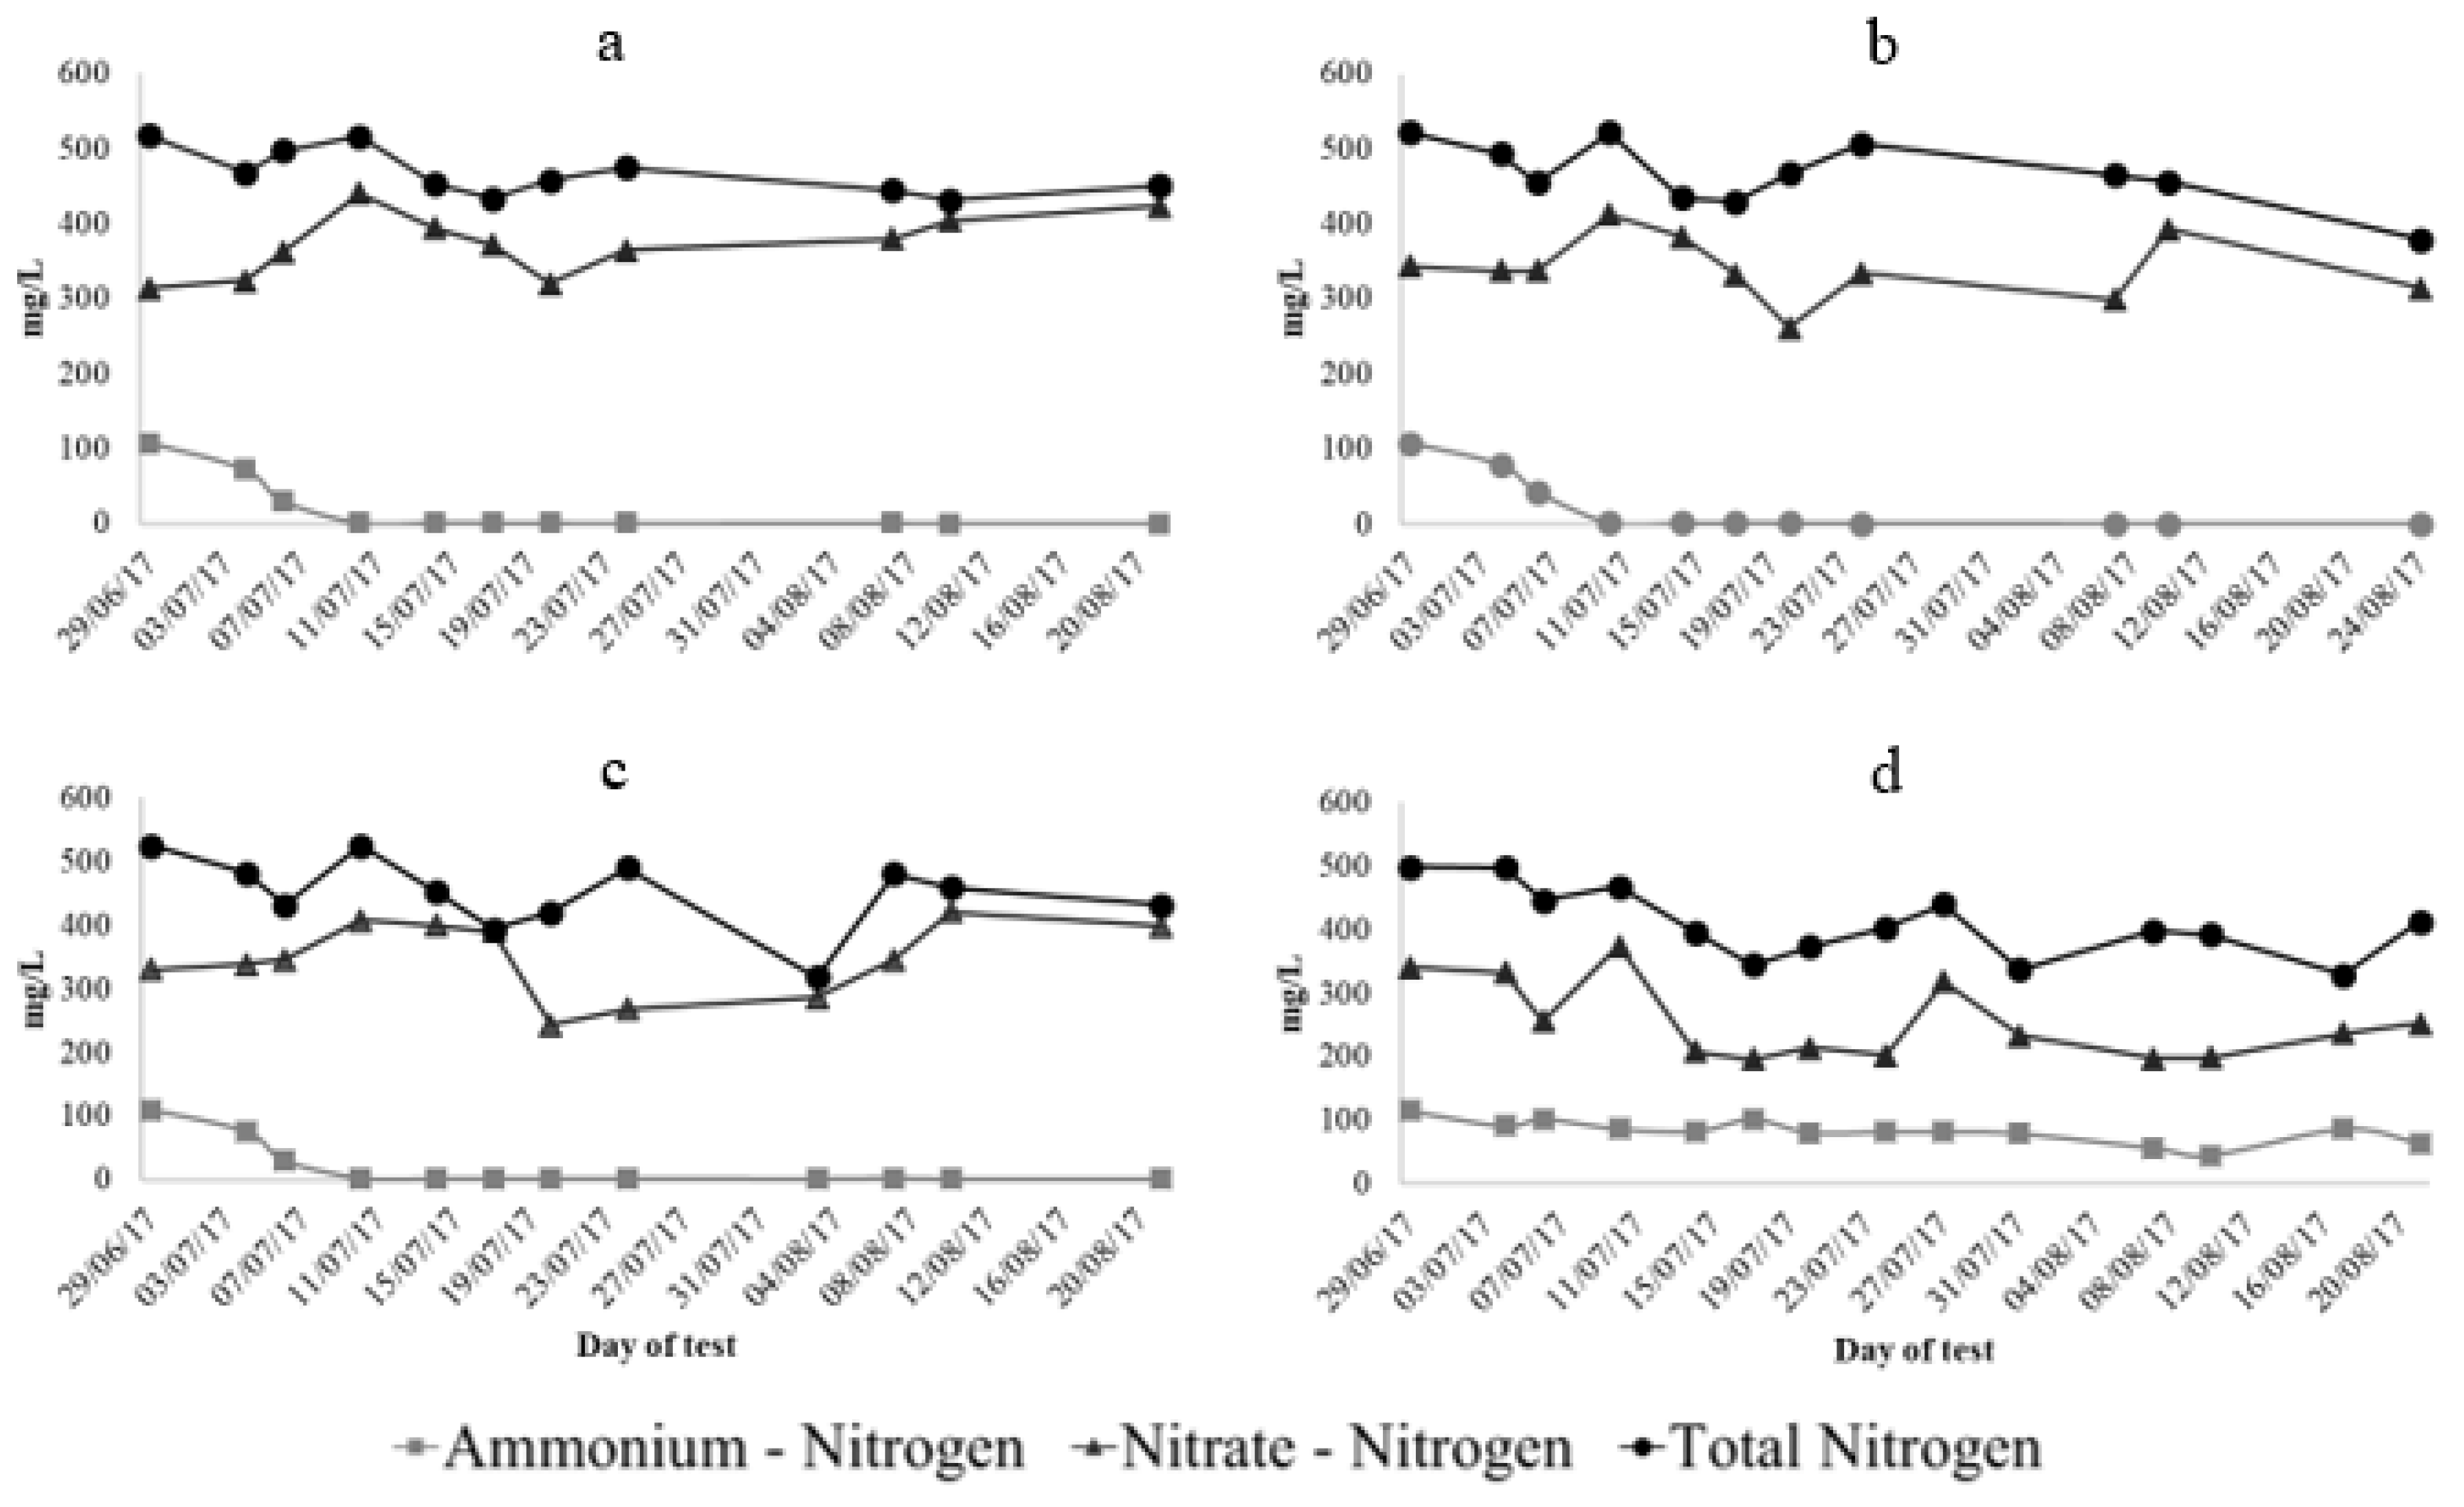
) measurements showed great variability. In the case of NO3-N, the variation amongst the measurements could be attributed to the different analytical methods used. The test kits were used to determine TN, whereas, NO3-N and NH4+-N were determined by ion chromatography. The high dilution factors were needed to analyse the samples by ion chromatography due to high sensitivity and low detection limits of the equipment. Considering that this fact could have increased the error or variation in the analysis, the results were corroborated and some samples re-analysed using quick test kits. The inconsistent NO3-N values evidenced through the comparison with the TN concentration, and after testing similar methodologies, were considered as outliers and removed from the dataset. The overall tendency indicates that NO3-N concentrations decreased only in treatment D from 341 mg/L to 223 mg/L, indicating a removal of 35%. The estimated effects of this treatment supported that nitrate concentrations significantly decreased (p < 0.05) in the non-aerated container. The ammonium concentrations started to decrease significantly after a one-week period of the second stage of the experiment (Figure 5 Applsci 09 04310 i002). A full NH4+-N removal was obtained in treatment A, B and C, whereas, a lower removal efficiency of 35% was achieved in treatment D. Looking at Figure 5 Applsci 09 04310 i003, it can be stated that there is no clear distinction among the effects of aeration on TN concentrations between treatments. However, the 55% of TN removal achieved by treatment D was just slightly above the 50% removal at treatment A. By assessing the whole testing period through the model procedure estimate effects, the results corroborated that statistically significant effects on the reduction of TN concentrations were mostly recorded in the non-aerated container, and a few other occasions when intermittent aeration, as in treatment C, was applied.
In Appendix B, Table A2 presents the mean values of the physicochemical, organic and nitrogen compounds recorded during the second stage of the experiment. Figure A1a–d represent the diagnostic plots of the mixed modelling procedure for COD, NH4+-N, NO3-N and TN, respectively. The plots indicated residuals are normally distributed.

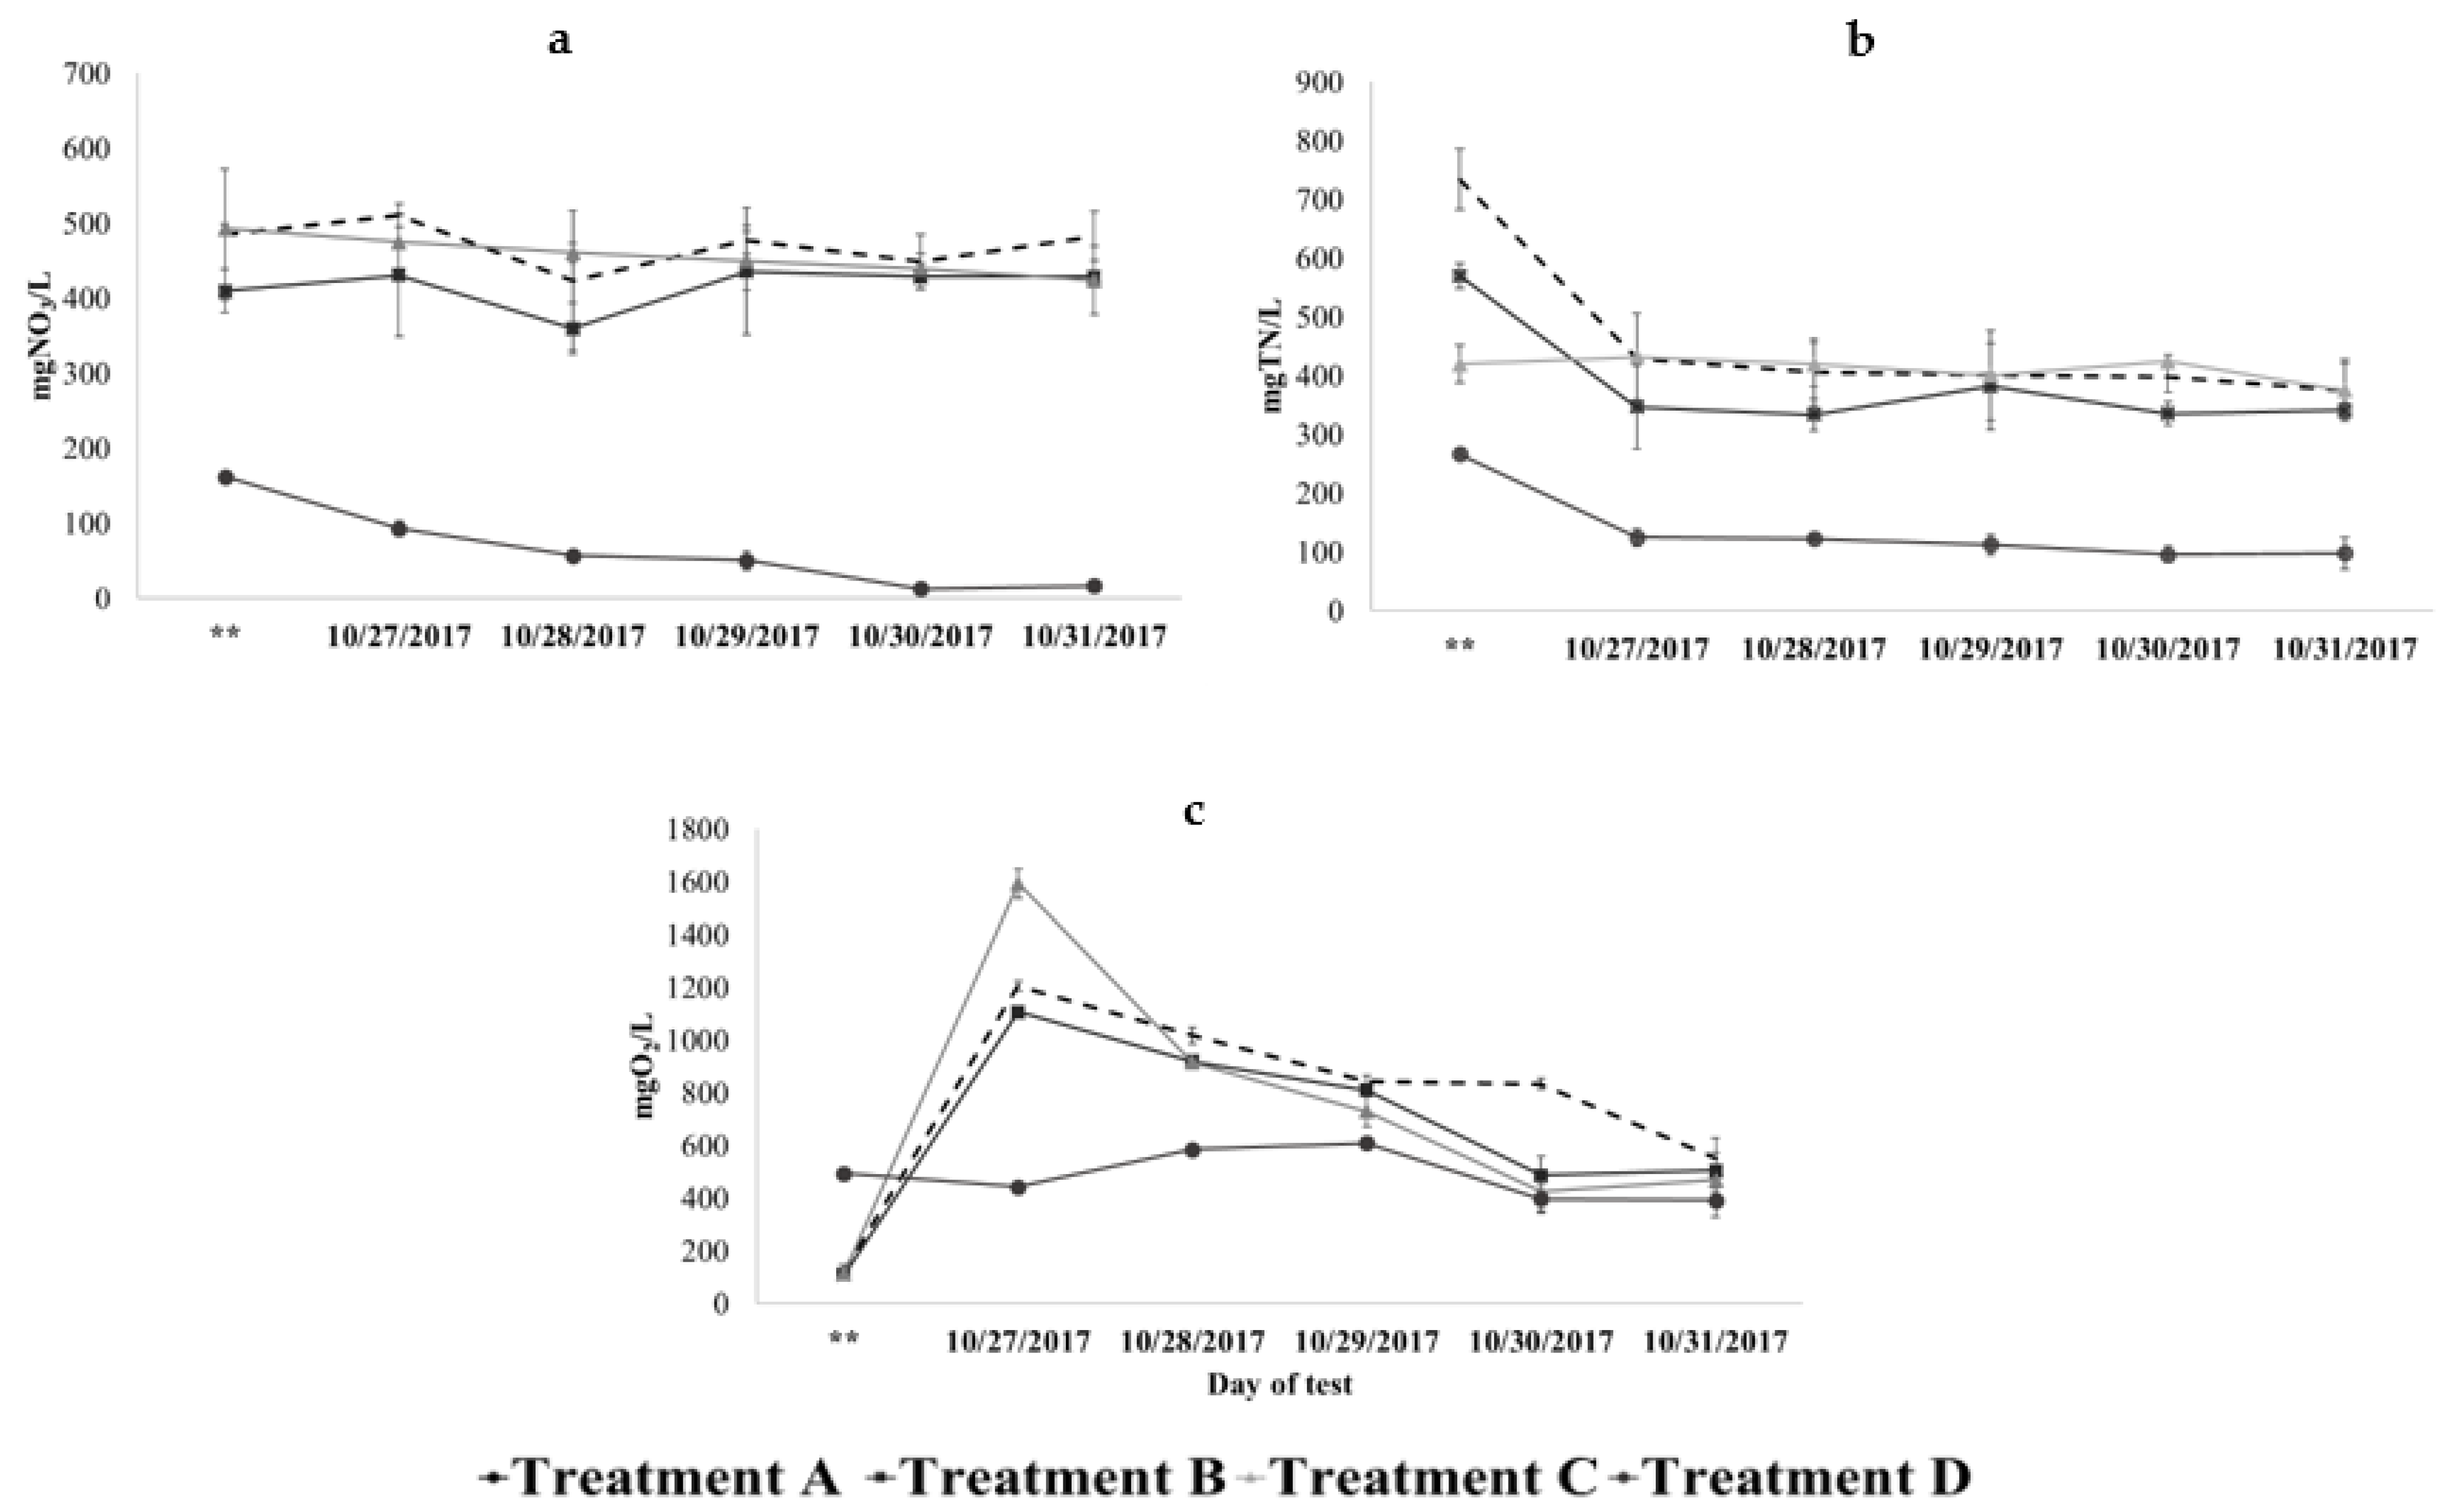
3.3. Third Stage: Intensification of Nitrification and Denitrification Processes by the Addition of a Supplementary Carbon Source

Considering the high nitrate concentrations remaining in the systems at the end of the second stage, it was presumed that the denitrification process did not occur completely due to the lack of available organic carbon. Thus, it was expected that through the addition of a supplementary carbon source, the denitrification process could be promoted and consequently nitrate would be removed.
The results presented in Figure 6 showed that the aim of this stage was not achieved. Although nitrate concentrations fluctuated throughout the testing period, these remained high and no significant nitrate removal was obtained. In treatments A, B and C, nitrate removal was only 6%, 0.5% and 11%, respectively. Conversely, 82% of nitrate was significantly removed in treatment D (p > 0.05 based on Wilcoxon rank sum test). Figure 6 presents the mean concentrations of NO3N in Figure 6a, TN in Figure 6b and COD in Figure 6c, prior (marked as **) and after the addition on the glucose solution.

4. Discussion

4.1. Changes in Physicochemical Profile under Different Aeration Regimes

The liquid fractions of animal manure contain high concentrations of nitrogen, phosphorus, organic compounds and micronutrients, such as copper and zinc [10,27]. The high concentrations of the two later derive from feed additives also containing iron, manganese, molybdenum and selenium [27]. The chemical and biological processes occurring within the wetland (triggered or hindered by biotic and abiotic factors) influence the concentration and/or the state of those compounds. In this study, attention was given to the effect of artificial aeration adapted to IBC systems to enhance the efficiency of COD removal from the effluent of activated sludge systems treating the liquid fraction of piggery manure.
During the presented experiment, great fluctuations in the physicochemical variables were observed. For instance, the decrease of pH values could have been influenced by the presence of organic matter, nitrification, precipitation and buffering reactions or the loss of carbon dioxide. One reason of the decrease of pH can be explained considering aerobic respiration and the corresponding CO2 production. Nitrification is an important factor determining the pH drop. It results in the formation of carbonic acid, potentially occurring in the treatment systems A, B and C which lead to a decrease in pH. The optimal pH range for a nitrification process to occur in suspended-growth systems, such as aerated CWs or lagoons, is between 7.2–9.0 [28]. In non-wetland or conventional treatment systems, optimum nitrification has been achieved even at a pH of 6.6. By comparing the pH values with NO3-N concentrations after 2 weeks of the experiment (sixth sampling instance), it was seen that some of the lowest NO3-N values were determined when pH was approximately 6.6. The low alkalinity levels in the wastewater to resist changes in pH and neutralise acids generated by the active biomass could have also been the reason of the pH drop in treatments A, B and C. This parameter was not measured during the experiment, though it is noteworthy to consider in an optimised system for further research.
In the presence of oxygen, ions are oxidized and form precipitates, which, in consequence, decrease pH. For example, the increased concentrations of iron (Fe3+) dissolved in the slurry reduce the pH if Fe3+ precipitates as iron phosphate (FePO4(s)) or ferric hydroxide (Fe(OH)3) [29]. Other possible occurring precipitates are aluminium phosphate, theoretically precipitating at pH of 6.3, or iron phosphate that ideally precipitates at a pH of 5.3 [30]. Furthermore, the precipitation processes could have been facilitated by the presence of the substrate used (Argex®). Reported studies by Meers et al. [7,10] and van Dyck, M. and van Deun, R. [31] concluded that high levels of phosphorous removal (up to 98%) were achieved at pilot scale CWs filled with Argex®.
The results also suggest that prolonged aeration periods provided to IBC A, B and C inhibited the denitrification process. Therefore, the NO3 concentrations were significantly reduced only in the IBC without aeration. Another reason that could have inhibited the denitrification process is the potential lack of readily degradable organic material serving as electron donors to promote the reduction of NO3 to molecular nitrogen (N2) [4]. Some of the main microbial communities related to nitrogen removal are ammonia-oxidizing, denitrifying, and anammox microbial communities. Their presence, growth and reaction processes are affected by organic matter, redox condition, temperature, pH, the presence of plants and media characteristics. Most denitrifying bacteria require an anaerobic environment and readily available organic compounds for energy and as a carbon source [32]. The fractions of organic nitrogen may eventually become unavailable for microbial processes if incorporated or absorbed in the substrate. Similar results and evaluations when testing nitrogen removal by the application of intermittent aeration in microcosm wetlands were presented by Fan et al. [33] and Wu et al. [4,18]. The ammonium depletion occurred one month after the beginning of the experiment indicating that after this period, ammonia-oxidizing bacteria were readily available to promote the oxidation of ammonium to nitrite and then the oxidation from nitrite to nitrate. In general, it was evidenced that aeration altered the microbial community properties and composition. The biological activity in the aeration systems resulted in a higher decrease of ammonium concentration due to the optimal conditions for nitrification, in contrast to the denitrification process where the nitrate depletion was limited.
The second stage of the experiment targeted a maximal decrease of the COD concentrations. The obtained removal efficiencies were comparable to the ones reported in previous studies [2,10,15,31]. Apart from the aeration provided, the use of Argex® as substrate proved to provide a better influence on COD removal than other types, such as sand or loam [10,31,34]. Nevertheless, the effect of artificial aeration could be considered as the main factor influencing recalcitrant organic matter removal, since the COD concentrations in treatment D remained high until the end of the test. Significant COD removals were obtained in the constant and intermittent aerated systems. Comparing the initial COD concentrations in Figure 4e with the initial values of Figure 6c marked as (**), it is seen that the COD average concentrations in the aerated systems decreased from approximately 1,030 mgO2/L to levels below the discharge standard limit < 125 mgO2/L. In contrast, S. Wu et al. [19] reported no significant COD removals.
Normally, the wetlands need a period of adaptation prior to reaching a relative steady performance. The BOD removal efficiency was comparable to the ones of COD, however, greater variation among the measurements during the experimental period were evidenced in the case of BOD. As BOD removal depends on microorganisms to degrade organic matter, it could be stated that the microbial community was better established at the latter part of this stage, when the constant decreases of the BOD concentrations were recorded in every treatment.

4.2. Hypotheses Testing Through a Mixed Model Procedure

Based on an overall judgement and estimated effects through the mixed modelling procedure, it could be deduced that treatment B and C with intermittent aeration were more efficient in terms of nutrient and organic compound removal. However, it is important to note that the optimisation of the experimental set-up and testing of different aeration rates with longer time spans are needed prior to implementation at a field-scale. Not only organic matter and nutrient removal efficiencies should be considered in this regard, but also the lowest energy consumption and maintenance costs. In this respect, the results support the fact that constant aeration implying extensive energy use would not lead to better removal efficiencies. Thus, the intermittent aerated CWs can be still considered as more sustainable, and an environmentally friendly treatment technique than other energy-intensive treatment technologies such as biological membrane reactors, activated sludge, or ammonia stripping treatment techniques, among others [35]. In addition, the implementation of aerated CWs considering similar principles as presented in this study, is economically efficient since the addition of an external carbon source, such as glucose and even plant materials, are considered low cost and non-toxic materials. To steer future research in this area, the following aspects merit attention: (i) Improving the sampling technique and handling of samples; (ii) working with continuous low flow systems to avoid concentration gradients built up in the containers and better simulations of CWs water flows; (iii) considering the wider ranges of aeration and non-aeration to allow the nitrification and denitrification process to occur in more optimal conditions. In this manner, the effects of aeration could be more effectively estimated. Guo et al. [35] averred that overly long aeration periods limit the denitrification process. However, they also claimed that further studies should be done based on high-strength wastewater types where the treatment is more complex than the existent on domestic water.

4.3. Addition of Carbon Source to Enhance The Denitrification Process

The low removal of nitrate after the addition of an external carbon source proved that aeration was the limiting factor of the denitrification process. The additional influential factors of nitrate removal are the acidic pH values (between 3.9 and 4.3) in wastewater of treatments A, B, and C fluctuated. Reported cases have shown that acidic conditions apart from influencing nitrification rates, can also inhibit denitrification [36,37]. However, it is possible that the added glucose solution was aerobically biodegraded before it could be used by denitrifying bacteria available in the containers. Furthermore, it could be possible that the glucose solution prepared with a 3:1 COD/TN ratio was not enough to provide the necessary carbon source to promote a complete denitrification process. Guo et al. [35] in their study tested the effectiveness of recirculating the effluent, the addition of glucose, and the use of iron activated carbon stimulated with a micro electrolysis process, to decrease nitrate and ammonium concentrations. The use of an effluent with high nitrate concentrations and a controlled addition of organic content would promote the denitrification process. More effective conditions for denitrification were encountered in the non-aerated IBC. The pH values between 7.8 and 8.7, anaerobic conditions and possibly, the sufficient carbon sources, favoured the denitrification process [36,38].

4.4. Moving Towards Sustainable Concepts

The efficient decrease of the COD concentrations through the aerated wetlands could facilitate meeting the COD discharge limit of 125 mgO2/L imposed to CWs treating animal manure. Wu et al. [39] assessing the sustainability of CWs for wastewater treatment, concluded that several tests have resulted in advanced designs, such as hybrid and/or enhanced CWs. In addition, optimal operation settings regarding the hydraulic loading rate, residence time, plant and substrate selection, number of treatment compartments, etc., have been delineated and reviewed. All of them resulted in a great increase of removal efficiencies and the sustainable application of CWs. Nonetheless, they highlighted that among the remaining gaps to meet fully optimized treatment techniques, aerated CWs should be considered for further exploration and development.
In addition, more than a post-treatment of the liquid fraction of animal manure, aerated CWs can also be optimal for the treatment of high-strength digestate, and other types of agro-industrial wastewater.
In addition, the experience and literature, which focused mostly on the treatment of urban wastewater, have shown that aerated wetlands are cheaper than non-aerated wetlands. In most practical cases, relatively low aeration periods and hydraulic retention time (HRT) of two days are general treatment considerations applied for the purification urban wastewater through CWs. Consequently, higher efficiencies and lower sludge production can be reached as compared to non-aerated systems. However, the amount of easily biodegradable organic matter in urban wastewater is higher than in the liquid fraction of pig manure. Thus, to degrade persistent organic matter (recalcitrant COD). longer retention times are required in aerated wetlands treating the liquid fraction of piggery manure.
Considering the overall manure treatment process, first, the manure is separated in solid and liquid fractions. This latter is then treated in an activated sludge system which is mostly an intensive system. Here, high aeration rates and short retention time are needed to reduce a great amount of easily biodegradable COD. In the polishing step, pig manure treatment wetlands become particularly extensive systems. The effluent of the activated sludge system containing high concentrations of non-easily biodegradable COD needs to reach concentrations below 125 mgO2/L. To meet this criteria, longer HRT and larger treatment areas are needed in such systems. Nonetheless, to tackle land availability requirements and constraints to meet discharge limits, as discussed by Donoso et al. [6], aerated wetlands have shown to be an effective solution. Almost half of land required could treat the same amount of wastewater at higher removal efficiencies. Wastewater contains many contaminants that are in fact mixtures. Generally, water quality parameters are measured by procedures that combine individual chemical compounds into an overall or total concentration for that class of materials. Some examples of these parameters are COD, BOD or TSS. When water passes through the wetland, its composition can change as the different fractions of the mixtures can reduce at different rates. As described by Kadlec and Wallace [30], the mixture then becomes weathered. Therefore, the lower persistent COD concentrations that are aimed to be reached, the more difficult it gets to decrease their levels. However, if meeting the discharge limits is the key objective of the treatment, then one should consider that the additional costs of blowers and aeration piping would not exceed the costs of a large treatment area requirement. The use of aerated wetlands results in the reduction of the treatment area which implies that less liner, less substrate and less excavation works are needed. As a result, the overall price of CWs’ installation decreases. Compared to vertical flow wetlands, aerated wetlands are 30–50% cheaper for the same capacity. In this regard, it is suggested that aerated CW’s can be combined with surface flow wetlands in a multi-stage CW, where they can replace vertical flow wetlands.

5. Conclusions

Novel technologies and strategies for wastewater treatment have been developed, tested and applied mostly throughout EU northwest countries. This is the case of enhanced CWs, which can be considered as one low-cost and efficient technology able to provide adequate removal of organics and nutrients. Considering the latter, CWs with artificial aeration were tested to intensify chemical oxygen demand (COD) removal. The results evidenced that COD removal efficiencies were higher when intermittent and continuous aeration were used in comparison than when no aeration was considered. However, the decrease of nitrogen and nitrate concentrations was not significant due to unfavourable conditions for the denitrification process (scarce anoxic conditions and available sources of organic carbon). General judgments derived from this preliminary study could presume that through the implementation of intermittent aeration in CWs, strict discharge limits imposed to CWs treating animal manure can be met. Nonetheless, further enhancement of the experimental set-up and methodologies to refine the selection of the most optimal aeration rate is needed prior to implementing this technology in the field. To conclude, this study supports the implementation of aerated CWs in areas with limited land availability as these lead to enhanced recalcitrant COD removal, reduced treatment area requirements, and lower implementation costs.

Author Contributions

Conceptualization and resources were overseen by E.M. (Erik Meers) and D.v.O. The methodology, software, validation, formal analysis investigation, writing—original draft preparation, review and editing were followed and performed by N.D., E.M. (Erik Meers), D.v.O., J.K.B., E.M. (Evi Michels) supervised, reviewed and edited the present work. E.M. (Erik Meers) and E.M. (Evi Michels) oversaw the project administration and funding acquisition.

Funding

This work was supported by the Interreg North West Europe programme 2014–2020 co-funded by the European Regional Development Fund under the project ALG-AD [NWE 520]. It was also conducted in the frame of the National Secretary of Higher Education, Science, Technology, and Innovation (SENESCYT)—Ecuador. Open Call 2012

Acknowledgments

We would like to thank the support of Gianni Tolpe and Nancy De Saeyer on sample collection.

Conflicts of Interest

“The authors declare no conflict of interest.” “The funders had no role in the design of the study; in the collection, analyses, or interpretation of data; in the writing of the manuscript, or in the decision to publish the results”.

Appendix A

Table A1. Percentage removal based on the initial and final mean values of physicochemical parameters, organic, and nitrogen compounds concentrations. Final concentrations represent the recorded values at the end of the second stage of the experiment (COD depletion test).
pHECDONH4+-NNO3-NTNCODBOD
mS/cmmg/Lmg/Lmg/Lmg/LmgO2/LmgO2/L
Treatment A
Initial conc.7.27.214107314518102727
Std Dev±0.06±0.06-±2.3±40±8.9±15±3.6
Final conc.5.29.3140.34762573589.4
Std Dev ±0.06±0.21±0.060.1±20±47±44±1.2
% Removal 99-52506566
Treatment B
Initial conc.7.37.414108344522101931
Std Dev -±0.06±0.06±0.8±30±25±50±6.1
Final conc.5.49.3130.34352983798.3
Std Dev ±0.26±0.20±0.06±0.2±17±41±76±2.6
% Removal 99-27436373
Treatment C
Initial conc.7.37.514110331525102625
Std Dev -±0.12±0.10±3.7±43±15±45±9.5
Final conc.5.49.3140.346329143412
Std Dev ±0.06±0.20-±0.1±22±53±57±0.8
% Removal 99-49455854
Treatment D
Initial conc.7.15.314116341499105742
Std Dev ±0.06±0.06±0.12±5.4±16±11±32±2.0
Final conc.8.15.2147522322276834
Std Dev ±0.06±1.0±0.06±2.3±13±65±61±8.5
% Removal 3535552719

Appendix B

Table A2. Mean values of physicochemical, organic, and nitrogen compounds concentrations during the second stage of the experiment (COD depletion test).
TreatmentSampling DayTemppHDOECNH4+-NNO3-NTNCODBOD
°C mgO2/LmS/cmmg/Lmg/Lmg/Lmg/Lmg/L
Treatment A29/6/17207.27.214107314518102727
4/7/17207.56.51372324468134351
6/7/17207.47.91330362497115739
10/7/17196.87.4131.344051710237.1
14/7/17226.54.9141.339445290315
17/7/17236.98.6131.037143383222
20/7/17216.76.2140.732045773745
24/7/17216.46.7140.53644756294.1
27/7/17206.38.1140.45894844977.0
31/7/17196.08.9140.653950952012
3/8/17205.88.9140.363948148018
7/8/17205.711140.73794444385.4
10/8/17195.79.8140.240443137922
15/8/17215.59.2140.258042949912
17/8/17235.47.6140.36054544349.0
21/8/17215.39.5140.35584143777.8
24/8/17205.39.4140.349342241911
28/8/17225.29.3140.34762573589.4
Treatment B29/6/17197.37.414108344522101931
4/7/17217.86.31378337493124358
6/7/17197.67.41343338455109038
10/7/17186.57.3131.44135229538.7
14/7/17236.58.1130.83834348868.0
17/7/17236.68.4131.033243086315
20/7/17216.66.7130.926146775624
24/7/17196.54.9130.633450766626
27/7/17196.57.0130.65724895575.8
31/7/17196.38.8130.24954675138.8
3/8/17206.011130.359647152516
7/8/17195.911130.42994665396.7
10/8/17195.89.7130.239345643320
15/8/17205.68.7130.35573814578.2
17/8/17235.58.0130.35324124347.5
21/8/17215.59.5130.35553993808.5
24/8/17205.49.5130.35144443899.2
28/8/17215.49.3130.34352983798.3
Treatment C29/6/17207.37.514110331525102625
4/7/17217.95.11375339482130370
6/7/17207.37.71329346432109726
10/7/17196.57.5131.640852595010
14/7/17236.58.9130.839945290611
17/7/17236.59.0131.03903868938.1
20/7/17216.67.2141.024442083712
24/7/17216.56.2140.926949078333
27/7/17206.55.8140.751351468346
31/7/17196.48.7141.161448756013
3/8/17206.212140.462547355315
7/8/17196.011141.63474815477.5
10/8/17195.99.5140.242146048224
15/8/17205.78.9140.359942353712
17/8/17235.77.4140.334045144312
21/8/17215.59.3140.462542449610
24/8/17205.69.2140.351049745612
28/8/17215.49.3140.346329143412
Treatment D29/6/17207.15.314116341499105642
4/7/17227.57.41491332498132365
6/7/17207.63.414102256446115335
10/7/17197.85.7148737546897025
14/7/17227.83.2148332838792320
17/7/17237.90.71410234638592917
20/7/17218.01.6148121437386015
24/7/17198.10.714822034038567.7
27/7/17208.11.4148231844080324
31/7/17208.13.6147956740480320
3/8/17208.13.9147133539774826
7/8/17198.22.3145719839980329
10/8/17198.12.2144519939280055
15/8/17208.10.2149628134188331
17/8/17248.00.4148738131173629
21/8/17218.12.5136425932281726
24/8/17208.14.1148224832884936
28/8/17228.15.2147522322276834
Figure A1. Diagnostic plots for the linear mixed effect model with (a) COD, (b) NH4+-N, (c) NO3-N and (d) TN as response variable and time and treatment as fixed effects. The compound symmetry covariance structure was used to account for variations in compound concentration across time for each treatment
Applsci 09 04310 g0a1

References

  1. Donoso, N.; Gobeyn, S.; Boets, P.; Goethals, P.L.M.; Wilde, D.D.E.; Meers, E. Assessing the Integration of Wetlands along Small European Waterways to Address Diffuse Nitrate Pollution. Water 2017, 9, 369. [Google Scholar] [CrossRef]
  2. Meers, E.; Tack, F.M.G.; Tolpe, I.; Michels, E. Application of a Full-scale Constructed Wetland for Tertiary Treatment of Piggery Manure: Monitoring Results. Water Air Soil Pollut. 2008, 193, 15–24. [Google Scholar] [CrossRef]
  3. Borin, M.; Politeo, M.; De Stefani, G. Performance of a hybrid constructed wetland treating piggery wastewater. Ecol. Eng. 2013, 51, 229–236. [Google Scholar] [CrossRef]
  4. Wu, H.; Fan, J.; Zhang, J.; Ngo, H.H.; Guo, W.; Liang, S.; Lv, J.; Lu, S.; Wu, W.; Wu, S. Intensified organics and nitrogen removal in the intermittent-aerated constructed wetland using a novel sludge-ceramsite as substrate. Bioresour. Technol. 2016, 210, 101–107. [Google Scholar] [CrossRef] [PubMed] [Green Version]
  5. Donoso, N.; Boets, P.; Michels, E.; Goethals, P.L.M.; Meers, E. Environmental Impact Assessment (EIA) of Effluents from Constructed Wetlands on Water Quality of Receiving Watercourses. Water Air Soil Pollut. 2015, 226, 205. [Google Scholar] [CrossRef]
  6. Donoso, N.; Gobeyn, S.; Villa-Cox, G.; Boets, P.; Meers, E.; Goethals, P. Assessing the Ecological Relevance of Organic Discharge Limits for Constructed Wetlands by Means of a Model-Based Analysis. Water 2018, 10, 63. [Google Scholar] [CrossRef]
  7. Meers, E.; Rousseau, D.P.L.; Lesage, E.; Demeersseman, E.; Tack, F.M.G. Physico-chemical P removal from the liquid fraction of pig manure as an intermediary step in manure processing. Water Air Soil Pollut. 2006, 169, 317–330. [Google Scholar] [CrossRef]
  8. Donoso, N. Environmental Assessment of Constructed Wetlands for Agricultural Wastewater Treatment. Ph.D. Thesis, Ghent University, Ghent, Belgium, 2018. [Google Scholar]
  9. Orhon, D.; Çokgör, E.U. COD Fractionation in Wastewater Characterization—The State of the Art. J. Chem. Technol. Biotechnol. 1997, 68, 283–293. [Google Scholar] [CrossRef]
  10. Meers, E.; Rousseau, D.P.L.; Blomme, N.; Lesage, E.; Du Laing, G.; Tack, F.M.G.; Verloo, M.G. Tertiary treatment of the liquid fraction of pig manure with Phragmites australis. Water Air Soil Pollut. 2005, 160, 15–26. [Google Scholar] [CrossRef]
  11. Dotro, G.; Langergraber, G.; Molle, P.; Nivala, J.; Puigagut, J.; Stein, O.; von Sperling, M. Treatment Wetlands; Nova, T., Ed.; Biological Wastewater Treatment Series; IWA Publishing: Chennai, India, 2017; Volume 7, p. 21. [Google Scholar]
  12. Kadlec, R.H. The inadequacy of first-order treatment wetland models. Ecol. Eng. 2000, 15, 105–119. [Google Scholar] [CrossRef]
  13. Nguyen, L.M. Organic matter composition, microbial biomass and microbial activity in gravel-bed constructed wetlands treating farm dairy wastewaters. Ecol. Eng. 2000, 16, 119–221. [Google Scholar] [CrossRef]
  14. Auvinen, H.; Laing, G.D.; Meers, E.; Rousseau, D.; Vymazal, J. Constructed Wetlands Treating Municipal and Agricultural Wastewater: An Overview for Flanders, Belgium. In Natural and Constructed Wetlands: Nutrients, Heavy Metals and Energy Cycling, and Flow; Vymazal, J., Ed.; Springer: Cham, Switzerland, 2016; pp. 179–207. [Google Scholar]
  15. Rousseau, D.P.; Vanrolleghem, P.A.; De Pauw, N. Constructed wetlands in Flanders: A performance analysis. Ecol. Eng. 2004, 23, 151–163. [Google Scholar] [CrossRef]
  16. Fan, J.; Zhang, B.; Zhang, J.; Ngo, H.H.; Guo, W.; Liu, F.; Guo, Y.; Wu, H. Intermittent aeration strategy to enhance organics and nitrogen removal in subsurface flow constructed wetlands. Bioresour. Technol. 2013, 141, 117–122. [Google Scholar] [CrossRef] [PubMed]
  17. Ouellet-Plamondon, C.; Chazarenc, F.; Comeau, Y.; Brisson, J. Artificial aeration to increase pollutant removal efficiency of constructed wetlands in cold climate. Ecol. Eng. 2006, 27, 258–264. [Google Scholar] [CrossRef]
  18. Wu, H.; Fan, J.; Zhang, J.; Ngo, H.H.; Guo, W.; Hu, Z.; Lv, J. Optimization of organics and nitrogen removal in intermittently aerated vertical flow constructed wetlands: Effects of aeration time and aeration rate. Int. Biodeterior. Biodegrad. 2016, 113, 139–145. [Google Scholar] [CrossRef] [Green Version]
  19. Wu, S.; Lei, M.; Lu, Q.; Guo, L.; Dong, R. Treatment of pig manure liquid digestate in horizontal flow constructed wetlands: Effect of aeration. Eng. Life Sci. 2016, 16, 263–271. [Google Scholar] [CrossRef]
  20. Gupta, P.; Ann, T.; Lee, S.-M. Use of biochar to enhance constructed wetland performance in wastewater reclamation. Environ. Eng. Res. 2016, 21, 36–44. [Google Scholar] [CrossRef] [Green Version]
  21. U.S. Environmental Protection Agency. Recommendation for Sampling and Preservation of Samples, Arranged According to Measurements. In Methods for Chemical Analysis of Water and Wastes; U.S. Environmental Protection Agency: Cincinnati, OH, USA, 1983; p. 5. [Google Scholar]
  22. Eaton, A.D.; Clesceri, L.S.; Greenberg, A.E.; Franson, M.A.H. 5210 B. 5-Day Biochemical Oxygen Demand (BOD) Test. In Standard Methods for the Examination of Water and Wastewater; American Public Health Association, American Water Works Association, Water Environment Federation: Washington, DC, USA, 1998; pp. 1–11. [Google Scholar]
  23. MACHEREY-NAGEL GmbH & Co. Kg Nanocolor Cod 160 Chemical Oxygen Demand. Available online: ftp://ftp.mn-net.com/english/Instruction_leaflets/NANOCOLOR/985026en.pdf (accessed on 18 May 2017).
  24. Merck Millipore. Nitrate Test Method: Photometric 0.2–20.0 mg/L NO₃-N. Available online: http://www.merckmillipore.com/BE/fr/product/Nitrate-Test,MDA_CHEM-114773?ReferrerURL=https%3A%2F%2Fwww.google.be%2F#anchor_TI (accessed on 10 September 2018).
  25. Littell, R.C.; Stroup, W.W.; Freund, R.J. SAS for Linear Models, 4th ed.; SAS Institute Inc.: Cary, NC, USA, 2002. [Google Scholar]
  26. SAS Institute Inc. SAS/STAT(R) 9.22 User’s Guide. Available online: https://support.sas.com/documentation/cdl/en/statug/63347/HTML/default/viewer.htm#statug_mixed_sect031.htm (accessed on 5 March 2018).
  27. Mantovi, P.; Bonazzi, G.; Maestri, E.; Marmiroli, N. Accumulation of copper and zinc from liquid manure in agricultural soils and crop plants. Plant Soil 2003, 250, 249–257. [Google Scholar] [CrossRef]
  28. Metcalf, E.; Eddy, H. Wastewater Engineering, Treatment, Disposal, and Reuse, 3rd ed.; McGraw-Hill: Singapore, 1991. [Google Scholar]
  29. Hjorth, M.; Christensen, K.V.; Christensen, M.L.; Sommer, S.G. Solid-liquid separation of animal slurry in theory and practice. A review. Agron. Sustain. Dev. 2010, 30, 153–180. [Google Scholar] [CrossRef]
  30. Kadlec, R.H.; Wallace, S.D. Treatment Wetlands, 2nd ed.; Taylor & Francis Group/CRC Press: Boca Raton, FL, USA, 2009. [Google Scholar]
  31. van Dyck, M.; van Deun, R. Constructed wetlands for on-site wastewater treatment, experiences in Flanders. Lucr. Științifice 2010, 12, 107–111. [Google Scholar]
  32. Meng, P.; Pei, H.; Hu, W.; Shao, Y.; Li, Z. Bioresource Technology How to increase microbial degradation in constructed wetlands: Influencing factors and improvement measures. Bioresour. Technol. 2014, 157, 316–326. [Google Scholar] [CrossRef] [PubMed]
  33. Fan, J.; Wang, W.; Zhang, B.; Guo, Y.; Ngo, H.H.; Guo, W.; Zhang, J.; Wu, H. Nitrogen removal in intermittently aerated vertical flow constructed wetlands: Impact of influent COD/N ratios. Bioresour. Technol. 2013, 143, 461–466. [Google Scholar] [CrossRef] [PubMed]
  34. Auvinen, H.; Gebhardt, W.; Linnemann, V.; Du Laing, G.; Rousseau, D.P.L. Laboratory- and full-scale studies on the removal of pharmaceuticals in an aerated constructed wetland: Effects of aeration and hydraulic retention time on the removal efficiency and assessment of the aquatic risk. Water Sci. Technol. 2017, 76, 1457–1465. [Google Scholar] [CrossRef] [PubMed]
  35. Guo, L.; He, K.; Wu, S.; Sun, H.; Wang, Y.; Huang, X.; Dong, R. Optimization of high-rate TN removal in a novel constructed wetland integrated with microelectrolysis system treating high-strength digestate supernatant. J. Environ. Manag. 2016, 178, 42–51. [Google Scholar] [CrossRef] [PubMed]
  36. Glass, C.; Silverstein, J. Denitrification kinetics of high nitrate concentration water: pH effect on inhibition and nitrite accumulation. Water Res. 1998, 32, 831–839. [Google Scholar] [CrossRef]
  37. He, Y.; Tao, W.; Wang, Z.; Shayya, W. Effects of pH and seasonal temperature variation on simultaneous partial nitrification and anammox in free-water surface wetlands. J. Environ. Manag. 2012, 110, 103–109. [Google Scholar] [CrossRef] [PubMed]
  38. Kadlec, R.H.; Knight, R.L. Treatment Wetlands; Lewis-CRC Press: Boca Raton, FL, USA, 1996. [Google Scholar]
  39. Wu, S.; Wallace, S.; Brix, H.; Kuschk, P.; Kirui, W.K.; Masi, F.; Dong, R. Treatment of industrial effluents in constructed wetlands: Challenges, operational strategies and overall performance. Environ. Pollut. 2015, 201. [Google Scholar] [CrossRef]
Figure 1. Schematic representation of the operating batch mode intermediate bulk containers (IBCs) used to test the effect on inorganic (TN, NO3, NH4+) and organic (chemical oxygen demand (COD), biological oxygen demand (BOD)) chemical concentrations subjected to different aeration rates: (a) constant aeration, (b) 4 h period with aeration followed by 4 h without aeration, (c) 6 h period with aeration followed by 4 h without aeration, (d) absence of artificial aeration. Approximately 90% of each IBC capacity was filled with expanded clay and 400 L of influent wetland water.
Applsci 09 04310 g001
Figure 2. The mean of NH4+-N concentrations (mgNH4+-N/L) recorded during the ammonium volatilisation test. Treatment A (constant aeration), Treatment B (intermittent aeration 4h AA:4h no-AA), Treatment C (intermittent aeration 6h AA:4h no-AA), Treatment D (no aeration), AA = aeration.
Applsci 09 04310 g002
Figure 3. The mean pH values recorded during the ammonium volatilisation test. Treatment A (constant aeration), Treatment B (intermittent aeration 4h AA:4h no-AA), Treatment C (intermittent aeration 6h AA:4h no-AA), Treatment D (no aeration), AA = aeration.
Applsci 09 04310 g003
Figure 4. Evolution of (a) pH, (b) conductivity, (c) dissolved oxygen, (d) biological oxygen demand, (e) chemical oxygen demand in each IBC exposed to different aeration periods. Treatment A (constant aeration), Treatment B (intermittent aeration 4h AA:4h no-AA), Treatment C (intermittent aeration 6h AA:4h no-AA), Treatment D (no aeration), AA = aeration.
Applsci 09 04310 g004
Figure 5. Evolution of ammonium-nitrogen, nitrate-nitrogen and total nitrogen in each IBC exposed to different aeration periods. (a) Treatment A (constant aeration), (b) Treatment B (intermittent aeration 4h AA:4h no-AA), (c) Treatment C (intermittent aeration 6h AA:4h no-AA), (d) Treatment D (no aeration), AA = aeration.
Applsci 09 04310 g005
Figure 6. The mean (a) nitrate-nitrogen, (b) total nitrogen, (c) chemical oxygen demand concentrations mg/L after the addition of a carbon source by means of a glucose solution. (**) first sampling day controlled prior the addition of glucose solution. Treatment A (constant aeration), Treatment B (intermittent aeration 4h AA:4h no-AA), Treatment C (intermittent aeration 6h AA:4h no-AA), Treatment D (no aeration), AA = aeration.
Applsci 09 04310 g006

