Fatigue Crack Growth in Maraging Steel Obtained by Selective Laser Melting
by
 , ,
, ,
Fernando Antunes
1,*, 
Luís Santos
2,
Carlos Capela
2,
José Ferreira
1,
José Costa
1,
Joel Jesus
1 and
Pedro Prates
1 
1
CEMMPRE, Department of Mechanical Engineering, University of Coimbra, 3030-788 Coimbra, Portugal
2
Department of Mechanical Engineering, Instituto Politécnico de Leiria, ESTG, 2411-901 Leiria, Portugal
*
Author to whom correspondence should be addressed.
Appl. Sci. 2019, 9(20), 4412; https://doi.org/10.3390/app9204412
Submission received: 10 September 2019
/
Revised: 14 October 2019
/
Accepted: 15 October 2019
/
Published: 18 October 2019
(This article belongs to the Special Issue Recent Trends in Advanced High-Strength Steels)
Abstract
:Selective Laser Melting (SLM) is an additive manufacturing technology, ideal for the production of complex-shaped components. Design against fatigue is fundamental in the presence of cyclic loads, particularly for these materials which typically have significant porosity, high surface roughness and residual stresses. The main objective here is to study fatigue crack growth (FCG) in the 18Ni300 steel obtained by SLM. Typical da/dN-ΔK curves were obtained in C(T) specimens, indicating that cyclic plastic deformation may be the controlling mechanism. A complementary analysis, based on plastic CTOD range, showed a relatively low level of crack tip plastic deformation, and consequently a reduced level of plasticity induced crack closure. The curve da/dN versus plastic CTOD range is clearly above the curves for other materials.
1. Introduction
Selective Laser Melting (SLM) is a technology for additive manufacturing consisting of the fusion of a fine metal power layer by layer. It is an iterative procedure consisting of (1) deposition of a thin layer of powder; (2) selective melting with a laser; and (3) descent of the manufacturing platform. The laser moves in the build area with controlled speed and scan pattern. The unmelted powder is collected and therefore there is no waste of material. The geometry is defined in a CAD model which is read by the SLM equipment. This procedure is very interesting to generate components with complex geometry and eventually composed of different materials. Therefore, SLM is becoming prominent in the automotive, aerospace, medical and injection molds industries. Various materials, such as titanium alloys [1], nickel-based alloys, iron, aluminum, bronze, copper, stainless steels [2] and high-speed steels of metal matrix, can be considered in this process.
Several studies, primarily focused on the influence of the selection of metal powder and sintering parameters on the microstructure of the sintered components, state that SLM components can provide static mechanical properties competitive with those of conventional bulk materials. Nevertheless, in service the components are typically dynamically loaded; therefore, the design must include the analyses of fatigue performance. Studies focused on the fatigue behavior of sintered materials are relatively scarce. Most previous studies developed tested smooth specimens under stress control [1,3,4] or strain control [2]. Notched specimens have also been tested under stress control in order to obtain S-N curves [5]. The presence of porosity, high surface roughness and thermal residual stresses, typical of these materials, reduce the fatigue initiation life, increasing the importance of the crack propagation regime. Pores result from powder contaminations, evaporation or local voids after powder-layer deposition. However, few studies on fatigue crack growth can be seen in the literature. Greitemeier et al. [6] obtained da/dN-ΔK curves in compact tension (CT) specimens made of TiAl6V4 (width, W = 40 mm and thickness, t = 10 mm). Wang et al. [7] presented da/dN-ΔK curves obtained in four-point bending specimens and using replica technique to measure the crack length.
The main objective of this work is to study the fatigue crack propagation in AISI 18Ni300 maraging steel obtained by SLM. The mechanisms behind the phenomenon were analyzed using two different approaches. First, the fatigue crack growth rate, da/dN, was obtained using compact tension specimens, in agreement with ASTM E647 standard, and da/dN-ΔK curves are plotted. Second, the crack tip plastic deformation was analyzed, and da/dN is presented versus plastic Crack Tip Opening Displacement (CTOD), predicted numerically for the C(T) specimen. The material plastic behavior was studied using results obtained from low-cycle fatigue tests on smooth specimens under constant amplitude strain range. The stress-strain hysteresis loops were used for fitting the hardening models.
2. Fatigue Crack Growth Analysis Based on ΔK
2.1. Material
Table 1 presents the chemical composition of the AISI 18Ni300 maraging steel. This steel contains nickel as the primary strengthening source rather than carbon, promoting superior strength and toughness. In addition to its high strength, the18Ni300 steel can be easily machined or formed; afterwards it can undergo an aging heat treatment step, which forms intermetallic precipitates involving cobalt, molybdenum and titanium that aid in increasing the tensile strength. Samples were manufactured using Lasercusing® technology, with layers growing in the same direction as the load application in the mechanical tests. The equipment for selective laser melting is of the mark “Concept Laser” and model “M3 Linear”. This apparatus comprises a laser type Nd:YAG with a maximum power of 100 W in continuous wave mode and a wavelength of 1064 nm. The scan speed was 200 mm/s. The material layers were found to have about 40 μm of thickness. The analysis by scanning electron microscope (SEM) showed the presence of a significant amount of small porosities and the formation of martensitic needles [8]. Additionally, the increase of laser speed was found to increase the level of porosity.
2.2. da/dN-ΔK Curves
Fatigue crack growth tests were carried out according to the recommendations outlined in the ASTM E647 standard. Figure 1 shows the geometry of the C(T) specimens, obtained with thicknesses of 3 or 6 mm. The surface finishing of the C(T) specimens was achieved by high-speed mechanical polishing. All fatigue crack growth (FCG) experiments were carried out using a DARTEC servo-hydraulic testing machine, equipped with a 100 kN load cell. The tests were performed at room temperature in ambient air, under load control mode, at a frequency of 25 Hz, using a PC-based data acquisition system. The load cases studied are presented in Table 2. Three stress ratios were considered: R = 0.05, 0.3 and 0.6. The crack length was measured with a travelling microscope, with magnification of 45× and an accuracy of 10 μm. The data was collected and recorded for crack lengths, a, greater than 7 mm, as indicated in Table 2. The fatigue crack growth rates (FCGR) were obtained from the five-point incremental polynomial method.
Figure 2a shows da/dN-ΔK plots for the 18Ni300 steel, in log-log scales. The increase of ΔK increases the FCG rate significantly, as is well known. Paris law regime is evident, and for relatively low values of da/dN, there is a significant reduction of da/dN, typical of regime I of FCGR. There is also a trend for the increase of da/dN with stress ratio, as could be expected. Anyway, the influence of stress ratio is relatively small, which indicates a reduced level of crack closure. The results for thicknesses of 3 and 6 mm are nearly coincident, which also indicates a small level of crack closure. Figure 2b compares FCGR for the 18Ni300 steel with results for other materials. The 7050-T6 aluminum alloy (AA) has the highest crack growth rate, followed by the AA2050-T8. The 304L stainless steel has the lowest values. Finally, the 18Ni300 is between the SS304L and the AA2050-T8. The slopes of da/dN-ΔK curves in the Paris law regime are similar. Please note that only the 18Ni300 steel was obtained by SLM.
2.3. Discussion
In this Paris law regime, cyclic plastic deformation is the mechanism usually used to explain FCG. The model of striation formation by crack tip plastic blunting of Laird [9,10] is widely accepted to generally describe the propagation mechanism of fatigue cracks in regime II of da/dN-ΔK curves. According to this model, plastic deformation at the crack tip is highly concentrated along the 45° direction, producing blunting and creation of a new fracture surface. Compression stresses at the crack tip reverse slipping, the fracture surfaces approach, but the new surface cannot be removed by re-connection of the atomic bonds, which is in accordance with the entropy law of thermodynamics. The results for the SLM steel are very typical in terms of linearity and slope of the Paris law regime; therefore, it can be expected that FCG is controlled by cyclic plastic deformation at the crack tip. The analysis of fracture surface by Scanning Electronic Microscopy (SEM) showed that fatigue crack growth occurs mainly at the interfaces between layers of the SLM material. In some cases where the adhesion between the deposited layers is higher, the failure can occur through the grain itself, in transgranular mode. On the contrary, in many other cases, the failure occurs at the layer boundaries producing steps corresponding to the thickness of one or two grains. Please note that the layer plane is normal to the loading direction, which is expected to have a negative effect. In fact, Edwards and Ramulu [11] showed that a layer plane parallel to the loading direction gives higher fatigue life. The weakness of the interfaces is responsible for a relatively tortuous crack path, and therefore for a relatively high fracture surface roughness.
It is, therefore, questionable whether da/dN is linked to a brittle mechanism or to crack tip plastic deformation. Llanes et al. [12] studied FCG in WC-Co cemented carbides, which are brittle materials. They observed that da/dN strongly depends on the variation of Kmax. A law was proposed for FCGR which was a function of Kmax and ΔK (da/dN = C(ΔK)m(Kmax)n). The values of n were in the range 5–18, while the values of m were in the range 3–5. Intergranular crack growth is also observed in nickel base superalloys [13]. However, in this case the brittle crack growth is associated with oxidation of grain boundaries, which work as highways for the diffusion of oxygen. Tong et al. [14] resorted to the progressive accumulation of tensile strains occurring near the crack tip to predict fatigue crack growth rate in RR1000 nickel base superalloy. They used vacuum in order to remove oxidation, so that viscoplastic deformation controls fatigue crack growth. Figure 3 presents da/dN versus Kmax for the SLM steel. The comparison with Figure 2a indicates that ΔK is the driving force for FCG, instead of Kmax. Therefore, cyclic plastic deformation is expected to be the controlling mechanism instead of a brittle mechanism as observed in cemented carbides and nickel base superalloys. For a better understanding of FCG mechanisms, an analysis based on crack tip plastic deformation was developed, as is described in the next section.
3. FCG Analysis Based on Plastic CTOD Range
A complementary approach was followed to study FCG, making use of the plastic CTOD range, δp, instead of ΔK. This approach follows two assumptions: (i) fatigue crack growth is closely connected with plastic deformation at the crack tip; and (ii) the plastic deformation at the crack tip can be quantified by the plastic CTOD. δp was numerically determined using the finite element method. The quality of numerical predictions is dictated by the adequate modeling of the material behavior. Therefore, cyclic loading was applied to smooth specimens in order to obtain stress-strain response, which was subsequently used to fit the material constants. The capability of analyzing crack closure and fatigue crack growth using CTOD was fully demonstrated in an earlier work by the authors [15].
3.1. Low Cycle Fatigue Test
Experimental tests were performed at room temperature and in laboratory air environment, on a DARTEC servo-hydraulic testing machine equipped with a 100 kN load cell. The tests were conducted under axial total strain-controlled mode, with sinusoidal waves, using a constant strain rate (da/dt) equal to 0.008 s-1, and total strain ratios (Rε) of zero and total strain amplitude (Δε/2) equal to 0.8%. Specimens were produced according to the specifications outlined in ASTM E606 [16], with a gage section measuring 15 mm in length and 8 mm in diameter (Figure 4a).
The final surface finishing was obtained by high-speed mechanical polishing using a sequence of silicon carbide paper grades, P600-grit, P1200-grit, and P2500-grit, followed by 3 μm diamond paste. A 12.5-mm strain-gage extensometer was attached directly to the specimen gage section, using rubber bands, to assess the stress-strain relationship during the test. A total of 41 loading cycles were obtained to failure. 200 samples were collected for each loading cycle, using a PC-based acquisition system. Figure 4b shows the stress-strain curve obtained. The material exhibits a mild cyclic softening behaviour from the beginning of loading until about 80% of total life.
3.2. Identification of Material Parameters
The high precision in the FE simulation results of the plastic CTOD depends on the accurate modeling of the material behavior. In this work, an elastic-plastic model was used: the isotropic elastic behavior is modeled by the generalized Hooke’s law; the plastic behavior is described by the von Mises yield criterion coupled with a mixed isotropic-kinematic hardening law under an associated flow rule. The von Mises yield surface is described as follows:
where Σ represents the effective stress tensor (Σ = σ’- Χ’, where σ’ and Χ’ are the deviatoric components of the Cauchy stress tensor and back-stress tensor, respectively); Y is the yield stress, and its evolution during plastic deformation is modeled by the Voce isotropic hardening law [17]:
where Y0, YSat and CY are material parameters and is the equivalent plastic strain. The non-linear kinematic hardening is modeled by the Armstrong-Frederick law [18], as follows:
where CX and XSat are material parameters and is the equivalent plastic strain rate. An optimization procedure was carried out to obtain the set of material parameters that best model the cyclic plastic behavior of 18Ni300, by minimization of the following least-squares function:
where and are, respectively, the analytically fitted and experimentally measured values of true stress at data point i (that corresponds to an equivalent plastic strain value); N is the number of experimental data points and A is the set of Voce and Armstrong-Frederick parameters to be identified. The fitting procedure was carried out for 33 loading cycles (N = 6600), representing about 80% of total life, using a non-linear gradient-based optimization algorithm available in the Microsoft Excel SOLVER tool [19]. Table 3 shows the fitted material parameters that describe the elastic-plastic behavior of 18Ni300. In this table, the Voce isotropic hardening parameters follow Y0 = YSat, and therefore the hardening is purely kinematic, which leads to a cyclically stable stress-strain fitting. This is acceptable in case of 18Ni300, where mild cyclic softening occurs during the first 33 loading cycles. Accordingly, the fitted material parameters describe adequately the experimental results, as can be seen in Figure 4c. Table 3 also shows material parameters for other five metal alloys, which were characterized by the authors in previous works.
3.3. Numerical Determination of δp
The C(T) specimen (Figure 1) presents geometric, material and loading symmetries; therefore, 1/4 of the specimen was modeled numerically considering adequate boundary conditions, as indicated in Figure 5a,b. A pure plane stress state was simulated by assuming a small thickness equal to 0.1 mm. Several initial crack lengths a0 were considered, equal to 7 mm, 10 mm, 13 mm, 16 mm, 19 mm, 22 mm and 24 mm, to replicate a wide range of experimental crack lengths. The simulations were done under load control, similar to the experimental tests. The maximum and minimum values of the remote load were defined considering the experimental loads listed in Table 2.
The finite element mesh (Figure 5a,c) comprised 7142 linear isoparametric elements and 14,606 nodes, with two main regions: (i) An ultra-refined mesh near the crack tip, composed of elements with 8×8 μm side; and (ii) a coarser mesh in the remaining specimen, to reduce the computational overhead. Only one layer of elements’ through-thickness was used. The crack propagation occurs at the minimum load, by successive debonding of both crack front nodes over the thickness. A total of 159 crack propagations were modeled, each propagation corresponding to the size of one finite element (= 8 μm), with a total crack advance (Δa) of 1272 μm (i.e., Δa = (160 − 1) × 8 μm). Five load cycles were applied between each crack increment.
The numerical simulations were performed using the DD3IMP (Deep-Drawing 3D IMPlicit) in-house code, originally developed to model deep-drawing processes [24]. The evolution of the deformation is modeled by an updated Lagrangian scheme, assuming a hypoelastic-plastic material model. The material plastic behavior was modeled considering the set of elastic-plastic parameters shown in Table 3. The contact between crack flanks is modeled considering a rigid plane surface aligned with the crack symmetry plane. A master–slave algorithm is used; an augmented Lagrangian approach is used for the contact problem treatment.
3.4. Numerical Results
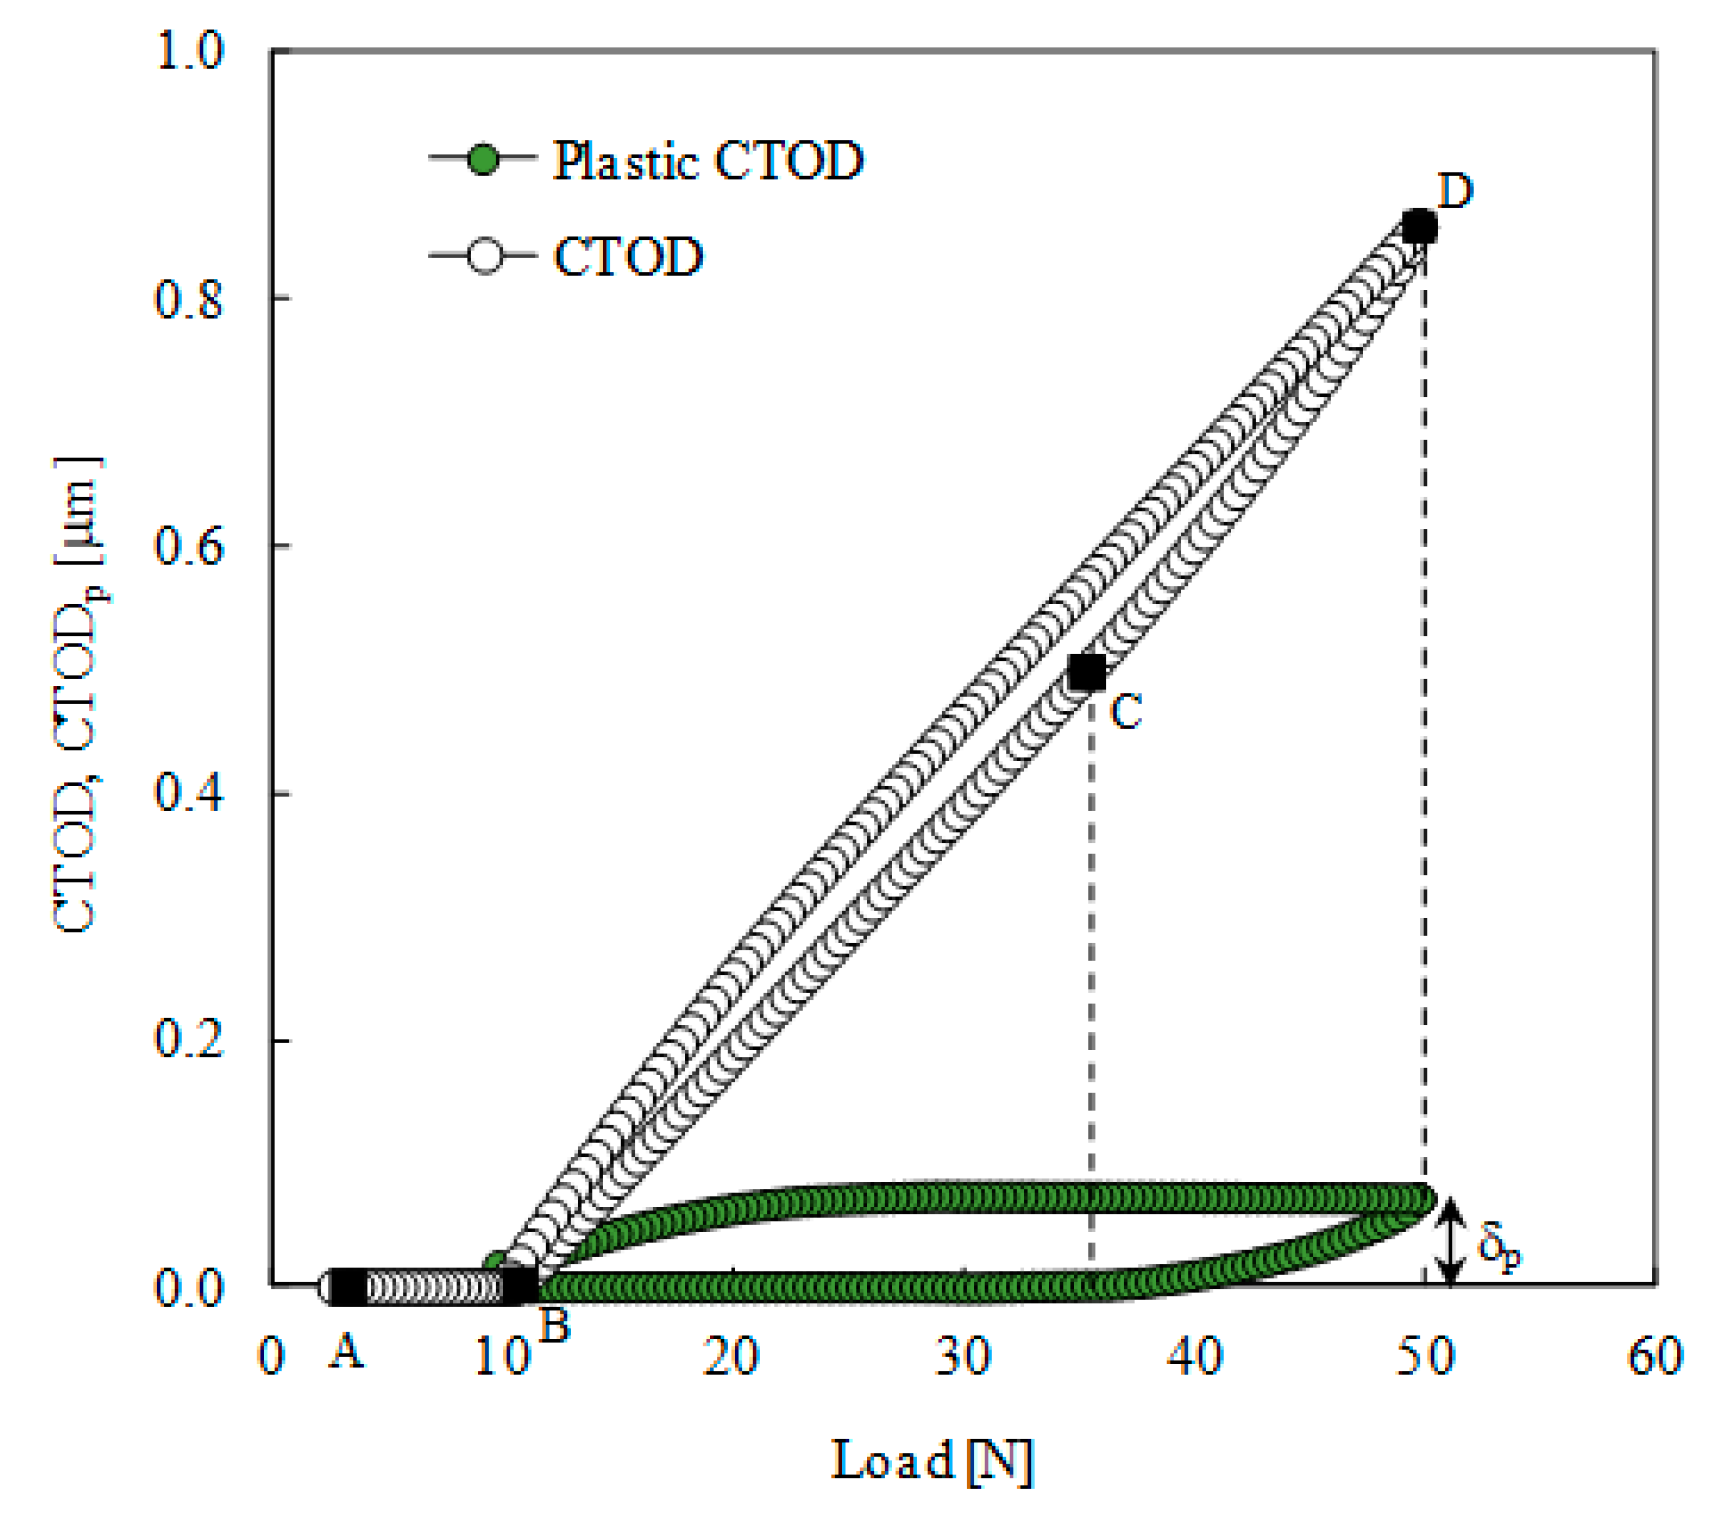
Figure 6 presents a typical numerical result of CTOD as a function of the remote stress, obtained for an initial crack length a0 = 24 mm, followed by 20 crack propagations (Δa = 160 μm); the CTOD was assessed at the first node located behind the crack tip, at a distance of 8 μm from the tip, as is schematically indicated, which presents the most sensitivity to crack tip phenomena. The crack is closed between A and B, for relatively low loads, i.e., the CTOD equals zero. The load increase opens the crack at point B. After point B, the crack opening evolves linearly with load increase up to point C, which is the boundary of the linear elastic regime. The range of loads between the opening load and the onset of plastic deformation was used to predict the fatigue threshold, as will be described later. A progressive increase of plastic deformation is found between points C and D, achieving its maximum value for the maximum load. The load decrease generates reversed elastic deformation with the same rate observed during loading. The subsequent load decrease produces reversed plastic deformation. Figure 6 also plots the variation of plastic CTOD. Plastic deformation initiates at point C, achieving its maximum value at maximum load. The plastic CTOD range, δp, which is correlated with fatigue crack propagation rate, is shown in Figure 6. It should be noted that crack closure is implicit in the value of δp. Increasing the crack closure phenomenon reduces the effective range of stress, also reducing the total CTOD and the plastic CTOD. In the absence of crack closure, the entire load cycle is felt by the crack tip. The plastic CTOD range also excludes the elastic deformation, which is not supposed to affect FCG.
Figure 7 presents the evolution of plastic CTOD range, δp, with load range quantified by ΔKeff (= Kmax − Kopen), i.e., the effective range of stress intensity factor. The remote loads applied were those used in the experimental FCG tests of the SLM material. The numerical tests were repeated for different materials keeping constant the specimen geometry, the crack lengths and loading. The increase in the load level increases δp, as might be expected. However, for the SLM material, the plastic deformation level is relatively low, being about one order of magnitude lower than the values obtained for the other materials. In fact, the values of plastic CTOD range, δp, are lower than 0.1 μm. As can be seen in Table 3, this material has a relatively high yield stress, which explains the low level of plastic deformation. This smallness makes the results very sensitive to errors of material modeling or geometry. Anyway, there is a well-defined variation of δp with load range.
The experimental results showed a relatively low influence of specimen thickness and stress on FCGR, which indicates that the crack closure phenomenon may have a low relevance. Figure 8 presents the evolution of crack closure with the crack length. The crack closure level was quantified by two parameters:
where Fopen is the crack opening load, and
The first parameter quantifies the percentage of load range during which the crack is closed, while the second one is the fraction of crack opening load divided by the maximum load. The crack closure level increases with crack length up to 21% (or 25% for Fopen/Fmax). In literature the crack closure level is usually quantified by Reff, and values of 0.25, the maximum value obtained here for the highest crack length studied, are relatively low. This is explained by the relatively low plastic deformation obtained for this material. Values in the range of 0.2 to 0.3 are typical of plane strain state [25,26,27,28,29]. However, no crack closure was found for the SLM steel in the case of plane strain state.
Figure 9 shows the plastic CTOD range, δp, versus da/dN for different crack lengths and stress ratios. According to this figure, there is a progressive increase of FCGR with δp, as could be expected. The increase of stress ratio, R, moves the curve up. This variation, which should not exist, is relatively small and can be explained by errors of δp and da/dN. In fact, in a previous work of the authors [21] it was shown that the da/dN-δp curves are invariant to the stress ratio. In other words, the approach based on plastic CTOD range is able to remove the effect of R observed when ΔK is being used. This indicates that δp dictates fatigue crack growth. Vasco et al. [30] also observed independence relatively to stress ratio. In that study, δp was measured experimentally using Digital Image Correlation. A 2nd-order polynomial was fitted to the results obtained for R = 0.05:
where the units of da/dN and δp are μm/cycle and μm, respectively. The correlation coefficient is R2 = 0.9842 and its validity is limited to δp in the range 0–0.8 μm. Figure 9 also presents results for other materials. The material models for the 304L stainless steel and the 18Ni300 steel were obtained using C(T) specimens, while the aluminum alloys were studied with M(T) specimens. For the same δp, the fatigue crack growth rate is significantly higher for the laser sintered material (18Ni300) than for the remaining materials.
ASTM E647 standard defines the experimental procedure to obtain fatigue threshold, ΔKth. The load range is gradually reduced until there is no crack propagation. In each loading step, some crack propagation is required to eliminate the influence of crack closure from previous load. The load range reduction can be done setting the stress ratio, R, or the maximum load. In the constant R load reduction method, the maximum and minimum loads are successively reduced such that the stress ratio (R = Kmin/Kmax) remains constant. However, the measured values of ΔKth are affected by stress ratio, being this effect linked to crack closure phenomenon. To overcome the effect of stress ratio, the constant Kmax test procedure is proposed in the ASTM E647 standard. In this case, Kmin is progressively increased in order to eliminate the effect of crack closure. The resulting effective threshold stress intensity, ΔKth,eff is often referred to as an intrinsic measurement of fatigue crack growth resistance. The experimental approach is however laborious and time consuming. Two alternatives to predict ΔKth were proposed here, based on the numerical analysis of plastic CTOD. In the first numerical approach, Kmax was kept constant (= 23.4 MPa.m0.5), while Kmin increased. Figure 10a presents the plastic CTOD range versus ΔK. The decrease of ΔK decreased δp, as expected, and the extrapolation to the horizontal axis gave a threshold value ΔKth = 11.2 MPa.m0.5. It is assumed that fatigue threshold corresponds to the onset of zero plastic deformation. The second numerical approach uses the range of elastic regime to define the fatigue threshold. In Figure 6, the load range between points B and C defines the elastic regime of CTOD. The corresponding ΔKth is obtained from this load range using the K solution for the C(T) specimen. Please note that this is also an effective load range, free of crack closure. Figure 10b presents the results obtained for two different load cases. The reduction of δp to zero defines the fatigue threshold. There is a convergence to a nearly constant value, which is a good indication of the robustness of the approach. The value obtained with the constant Kmax approach is also presented, being slightly higher that the values obtained using the COTD-load curve. However, the experimental value is 5.2 MPa.m0.5 [31] being significantly lower than the numerical predictions. This great difference can be explained by the effect of environment. In fact, the near-threshold FCGR is quite small, giving time for the action of environment.
4. Conclusions
The fatigue crack growth of the AISI 18Ni300 maraging steel made by Selective Laser Melting was studied numerically and experimentally. The experimental study considered ΔK as the crack driving force while the numerical work used the plastic CTOD. The main conclusions are:
The FCG rate, da/dN, plotted versus ΔK showed a classical Paris law regime with a typical value of the slope. This indicates that cyclic plastic deformation is probably the mechanism controlling fatigue crack growth. The influence of stress ratio and specimen thickness was found to be relatively small, indicating a reduced level of crack closure. The analysis of fracture surfaces by SEM showed propagation between deposition layers.
A complementary analysis was developed, based on plastic CTOD range, to better understand crack growth mechanisms. The level of plastic deformation at the crack tip was found to be relatively low, which also explains the relatively low level of crack closure. Consequently, the curve da/dN versus plastic CTOD range is clearly above the curves for other materials.
Author Contributions
Conceptualization, F.A., J.F. and C.C.; formal analysis, F.A. and P.P.; investigation, J.J., J.C. and L.S.; writing—original draft preparation, F.A.; writing—review and editing, F.A.; funding acquisition, J.F.
Funding
The authors acknowledge sponsorship under the project Hibsilaser, funded by the European Regional Development Fund (FEDER), through the Portugal-2020 program (PT2020), under the Regional Operational Program of the Center (CENTRO-01-0145-FEDER-028789) and the Foundation for Science and Technology IP/MCTES through national funds (PIDDAC).
Conflicts of Interest
The authors declare no conflict of interest. The funders had no role in the design of the study; in the collection, analyses, or interpretation of data; in the writing of the manuscript, or in the decision to publish the results.
References
- Walker, K.F.; Liu, Q.; Brandt, M. Evaluation of fatigue crack propagation behaviour in Ti-6Al-4V manufactured by selective laser melting. Int. J. Fatigue 2017, 104, 302–308. [Google Scholar] [CrossRef]
- Yadollahi, A.; Shamsaei, N.; Thompson, S.M.; Elwany, A.; Bian, L. Effects of building orientation and heat treatment on fatigue behavior of selective laser melted 17-4 PH stainless steel. Int. J. Fatigue 2017, 94, 218–235. [Google Scholar] [CrossRef]
- Croccolo, D.; De Agostinis, M.; Fini, S.; Olmi, G.; Bogojevic, N.; Ciric-Kostic, S. Effects of build orientation and thickness of allowance on the fatigue behaviour of 15–5 PH stainless steel. Fatigue Fract. Eng. Mater. Struct. 2017, 41, 1–17. [Google Scholar] [CrossRef]
- Spierings, A.B.; Starr, T.L.; Wegener, K. Fatigue performance of additive manufactured metallic parts. Rapid Prototyp. J. 2013, 19, 88–94. [Google Scholar] [CrossRef]
- Mohammad, S.; Razavi, J.; Ferro, P.; Berto, F. Fatigue Assess-ment of Ti–6Al–4V Circular Notched Specimens Produced by Selective Laser Melting. Metals 2017, 7, 291. [Google Scholar]
- Greitemeier, D.; Palm, F.; Syassen, F.; Melz, T. Fatigue performance of additive manufactured TiAl6V4 using electron and laser beam melting. Int. J. Fatigue 2017, 94, 211–217. [Google Scholar] [CrossRef]
- Wang, Y.; Bergstrom, J.; Burman, C. Four-point bending fatigue behaviour of an iron-based laser sintered material. Int. J. Fatigue 2006, 28, 1705–1715. [Google Scholar] [CrossRef]
- Ferreira, J.A.M.; Santos, L.M.S.; da Silva, J.; Costa, J.M.; Capela, C. Assessment of the fatigue life on functional hybrid laser sintering steel components. Procedia Struct. Integr. 2016, 1, 126–133. [Google Scholar] [CrossRef] [Green Version]
- Laird, C.; Smith, G.L. Initial Stages of Damage in High Stress Fatigue in Some Pure Metals. Phil. Mag. 1963, 95, 1945–1963. [Google Scholar] [CrossRef]
- Laird, C. The Influence of Metallurgical Structure on the Mechanisms of Fatigue Crack Propagation. Fatigue Crack Propag. 1967, 131–180. [Google Scholar]
- Edwards, P.; Ramulu, M. Fatigue performance evaluation of selective laser melted Ti-6Al-4V. Mat. Sci. Eng. A-Struct. 2014, 598, 327–337. [Google Scholar] [CrossRef]
- Lanes, L.; Torres, Y.; Anglada, M. On the fatigue crack growth behaviour of WC-Co cemented carbides: Kinetics descrption, microstructural effects and fatigue sensitivity. Acta Mater. 2002, 50, 2381–2393. [Google Scholar] [CrossRef]
- Antunes, F.V.; Ferreira, J.A.M.; Branco, C.M.; Byrne, J. Influence of stress state on high temperature fatigue crack growth in Inconel 718. Fatigue Fract. Eng. Mat. Struct. 2001, 24, 127–135. [Google Scholar] [CrossRef]
- Tong, J.; Zhao, L.G.; Lin, B. Ratchetting strain as a driving force for fatigue crack growth. Int. J. Fatigue 2013, 46, 49–57. [Google Scholar] [CrossRef]
- Antunes, F.V.; Branco, R.; Prates, P.A.; Borrego, L. Fatigue crack growth modelling based on CTOD for the 7050-T6 alloy. Fatigue Fract. Eng. Mater. Struct. 2017, 40, 1309–1320. [Google Scholar] [CrossRef]
- ASTM E606. Standard Test Method for Strain-Controlled Fatigue Testing; American Society for Testing of Materials: West Conshohocken, PA, USA, 2012. [Google Scholar]
- Voce, E. The relationship between stress and strain for homogeneous deformation. J. Inst. Met. 1948, 74, 537–562. [Google Scholar]
- Chaboche, J.L. A review of some plasticity and viscoplasticity constitutive theories. Int. J. Plast. 2008, 24, 1642–1693. [Google Scholar] [CrossRef]
- Lasdon, L.S.; Waren, A.D.; Jain, A.; Ratner, M.W. Design and Testing of a Generalized Reduced Gradient Code for Non-Linear Optimization; NTIS National Technical Information Service U. S. Department of Commerce: Cleveland, OH, USA, 1975.
- Antunes, F.V.; Serrano, S.; Branco, R.; Prates, P.; Lorenzino, P. Fatigue crack growth in the 2050-T8 aluminium alloy. Int. J. Fatigue 2018, 115, 79–88. [Google Scholar] [CrossRef]
- Antunes, F.V.; Rodrigues, S.M.; Branco, R.; Camas, D. A numerical analysis of CTOD in constant amplitude fatigue crack growth. Theor. Appl. Fract. Mech. 2016, 85, 45–55. [Google Scholar] [CrossRef]
- Antunes, F.V.; Rodrigues, D.M. Numerical simulation of plasticity induced crack closure: Identification and discussion of parameters. Eng. Fract. Mech. 2008, 75, 3101–3120. [Google Scholar] [CrossRef] [Green Version]
- Antunes, F.V.; Ferreira, M.S.C.; Branco, R.; Prates, P.; Gardin, C.; Sarrazin-Baudoux, C. Fatigue crack growth in the 304L stainless steel. Eng. Fract. Mech. 2019, 214, 487–503. [Google Scholar] [CrossRef]
- Oliveira, M.C.; Alves, J.L.; Menezes, L.F. Algorithms and Strategies for Treatment of Large Deformation Frictional Contact in the Numerical Simulation of Deep Drawing Process. Arch. Comput. Methods Eng. 2008, 15, 113–162. [Google Scholar] [CrossRef] [Green Version]
- McClung, R.C.; Thacker, B.H.; Roy, S. Finite element visualization of fatigue crack closure in plane stress and plane strain. Int. J. Fracture 1991, 50, 27–49. [Google Scholar]
- Sehitoglu, H.; Sun, W. Modelling of plane strain fatigue crack closure. ASME J. Eng. Mat. Technol. 1991, 113, 31–40. [Google Scholar] [CrossRef]
- LLorca, J.; Gálvez, V.S. Modelling plasticity-induced fatigue crack closure. Eng. Fracture Mech. 1990, 37, 185–196. [Google Scholar] [CrossRef]
- Solanki, K.; Daniewicz, S.R.; Newman, J.C., Jr. Finite element modelling of plasticity-induced crack closure with emphasis on geometry and mesh refinement effects. Eng. Fract. Mech. 2003, 70, 1475–1489. [Google Scholar] [CrossRef]
- Pokluda, J. Dislocation-based model of plasticity and roughness-induced crack closure. Int. J. Fatigue 2013, 46, 35–40. [Google Scholar] [CrossRef]
- Vasco-Olmo, J.M.; Díaz, F.; Antunes, F.V.; James, M.N. Evaluación Experimental Del CTOD En El Crecimiento De Grieta A Fatiga A Partir De Los Campos De Desplazamientos. In Proceedings of the XXXV Encuentro del Grupo Español de Fractura, Málaga, Spain, 14–16 March 2018. [Google Scholar]
- Santos, L.M.S.; Ferreira, J.A.M.; Jesus, J.S.; Costa, J.M.; Capela, C. Fatigue behaviour of selective laser melting steel components. Appl. Fract. Mech. 2016, 85, 9–15. [Google Scholar] [CrossRef]
Figure 1.
Geometry of C(T) specimen.

Figure 2.
(a) da/dN-ΔK curves (18Ni300 steel; t = 6 mm). (b) Effect of material on da/dN-ΔK plots (R = 0.1; R = 0.05 for the 18Ni300).
Figure 2.
(a) da/dN-ΔK curves (18Ni300 steel; t = 6 mm). (b) Effect of material on da/dN-ΔK plots (R = 0.1; R = 0.05 for the 18Ni300).

Figure 3.
da/dN-Kmax curves (18Ni300 steel; t = 6 mm).

Figure 4.
(a) Low cycle fatigue specimens. (b) Stress-strain plot (Δε = ± 0.8%). (c) Experimental versus fitted curve (18Ni300 steel).
Figure 4.
(a) Low cycle fatigue specimens. (b) Stress-strain plot (Δε = ± 0.8%). (c) Experimental versus fitted curve (18Ni300 steel).

Figure 5.
Model of the C(T) specimen. (a) Load and boundary conditions. (b) Boundary conditions for plane stress state. (c) Detail of finite element mesh.
Figure 5.
Model of the C(T) specimen. (a) Load and boundary conditions. (b) Boundary conditions for plane stress state. (c) Detail of finite element mesh.

Figure 6.
Evolution of Crack Tip Opening Displacement (CTOD) with load (a0 = 24 mm; plane stress).

Figure 7.
Evolution of plastic CTOD range, δp, with effective load range (R = 0.01).

Figure 8.
Crack closure level versus ΔK (18Ni300; R = 0.05).

Figure 9.
FCGR versus plastic CTOD, δp, for different materials.

Figure 10.
Numerical prediction of fatigue threshold. (a) Constant Kmax approach (a = 17.272 mm; Kmax = 23.4 MPa.m0.5). (b) Analysis based on the CTOD versus load plots.
Figure 10.
Numerical prediction of fatigue threshold. (a) Constant Kmax approach (a = 17.272 mm; Kmax = 23.4 MPa.m0.5). (b) Analysis based on the CTOD versus load plots.


Table 1.
Chemical composition of the 18Ni300 steel (weight percentage).
| Element | Percentage |
|---|---|
| C | 0.01 |
| Ni | 18.2 |
| Co | 9.0 |
| Mo | 5.0 |
| Ti | 0.6 |
| Al | 0.05 |
| Cr | 0.3 |
| P | 0.01 |
| Si | 0.1 |
| Mn | 0.04 |
| Fe | Balance |
Table 2.
Load parameters.
| R | Thickness, t [mm] | Fmin [N] | Fmax [N] | A [mm] | ΔK [MPa.m0.5] |
|---|---|---|---|---|---|
| 0.05 | 3 | 74.4 | 1488 | 7.1–27.3 | 8.1–58.1 |
| 0.05 | 6 | 114 | 2284.2 | 7.2–26.6 | 7.6–47.8 |
| 0.3 | 6 | 870 | 2900 | 7.1–24.0 | 7.1–27.6 |
| 0.6 | 6 | 2850 | 4750 | 47.5 | 79.17 |
Table 3.
Elastic-plastic parameters (AA—Aluminum Alloy; SS—Stainless Steel).
| Material | Hooke’s Law Parameters | Isotropic Hardening (Voce) | Kinematic Hardening (Armstrong-Frederick) | ||||
|---|---|---|---|---|---|---|---|
| E [GPa] | Ν [-] | Y0 [MPa] | YSat [MPa] | CY [-] | CX [-] | XSat [MPa] | |
| 18Ni300 | 160 | 0.30 | 683.62 | 683.62 | 0 | 728.34 | 402.06 |
| AA7050-T6 [15] | 71.7 | 0.33 | 420.50 | 420.50 | 0 | 228.91 | 198.35 |
| AA2050-T8 [20] | 77.4 | 0.30 | 383.85 | 383.85 | 0 | 97.38 | 265.41 |
| AA6082-T6 [21] | 70 | 0.29 | 238.15 | 487.52 | 0.01 | 244.44 | 83.18 |
| AA6016-T4 [22] | 70 | 0.29 | 124.00 | 415.00 | 9.5 | 146.50 | 34.90 |
| 304L SS [23] | 196 | 0.3 | 117 | 87 | 9 | 300 | 176 |
© 2019 by the authors. Licensee MDPI, Basel, Switzerland. This article is an open access article distributed under the terms and conditions of the Creative Commons Attribution (CC BY) license (http://creativecommons.org/licenses/by/4.0/).
Share and Cite
MDPI and ACS Style
Antunes, F.; Santos, L.; Capela, C.; Ferreira, J.; Costa, J.; Jesus, J.; Prates, P. Fatigue Crack Growth in Maraging Steel Obtained by Selective Laser Melting. Appl. Sci. 2019, 9, 4412. https://doi.org/10.3390/app9204412
AMA Style
Antunes F, Santos L, Capela C, Ferreira J, Costa J, Jesus J, Prates P. Fatigue Crack Growth in Maraging Steel Obtained by Selective Laser Melting. Applied Sciences. 2019; 9(20):4412. https://doi.org/10.3390/app9204412
Chicago/Turabian StyleAntunes, Fernando, Luís Santos, Carlos Capela, José Ferreira, José Costa, Joel Jesus, and Pedro Prates. 2019. "Fatigue Crack Growth in Maraging Steel Obtained by Selective Laser Melting" Applied Sciences 9, no. 20: 4412. https://doi.org/10.3390/app9204412
Note that from the first issue of 2016, this journal uses article numbers instead of page numbers. See further details here.