Analysis of Coastal Zone Data of Northern Yantai Collected by Remote Sensing from 1990 to 2018


1
School of Resources and Environment Engineering, Ludong University, Yantai 264025, China
2
School of Tourism and Urban-Rural Planning, Chengdu University of Technology, Chengdu 610000, China
3
School of Mathematical Sciences, Ocean University of China, Qingdao 266300, China
*
Author to whom correspondence should be addressed.
Appl. Sci. 2019, 9(20), 4466; https://doi.org/10.3390/app9204466
Submission received: 20 September 2019
/
Revised: 15 October 2019
/
Accepted: 18 October 2019
/
Published: 22 October 2019
(This article belongs to the Section Optics and Lasers)
Abstract
:Using remote sensing images of different time phases from 1990 to 2018, the surface coverage information of northern Yantai (coastline, 2 km from coastline to land) was extracted by means of average high tide line and visual interpretation. The end point change rate (EPR) and linear regression rate were used to study the coastline change rate, the fractal dimension of the coastline in the study area was analyzed, and the change of the type of coastal surface cover was analyzed by the transition matrix. The results show that: (1) Form 1990 to 2018, a significant trend of a continuous increase in the total length of coastline was observed with an increase of 181.08 km (43.18%). In the study area, the coastline of Laizhou had the greatest change rate with an EPR value of 33.67 m/a, whereas the coastline of Laishan had the smallest change rate with an EPR value of 0.30 m/a. (2) Over the past 30 years, with the rapid economic development of Yantai and the ensuant urbanization, the total surface area of the coastal zone in the study area has increased by 144.94 km2, mainly in the areas covered by structures and forests/grasses, by 112.96 km2 and 96.08 km2, respectively, while the areas of desert/bare land and water have decreased by 92.26 km2 and 12.32 km2, respectively. (3) The changes among different types in the study area were clear, mainly from desert/bare land, cultivated land, and building areas to forests/grasses cover and structures. The change areas were mainly concentrated in Laizhou, Longkou, Zhifu, and Penglai. Frequent human activities are an important factor affecting the continuous expansion of the coastal areas of Jiaodong Peninsula to the sea. Aquaculture, coastal construction, construction of artificial islands, and expansion of port terminals have seriously affected the sustainability of ecological resources in the coastal areas. At the same time, the changes in the ecological environment in the coastal zone will have a greater impact on the health of the coastal zone.
1. Introduction
A coastal zone is an interface between land and ocean. Coastal zones are the most densely populated type of area and are experiencing rapid economic development [1]. The economy of coastal zones plays a very important role in promoting the overall economic development of a country, in China, it is an important part of the national economy [2]. However, with the continuous increase in population, intensification of human activities, and acceleration of urbanization in coastal areas, coastal zones are facing tremendous pressure and disruption such as shortage of marine resources, deterioration of the ecological environment, rising sea level, and pollution, which seriously restrict the sustainable development of the coastal zone economy [3,4]. Due to its ability to achieve large-scale, fast and real-time dynamic observation, remote sensing technology plays an important role in monitoring the change process of land cover information in the coastal zone and studying the impact of coastal zone changes on human health, especially in densely populated areas. Therefore, it is of great value to study the changes in the resources and environment along coastlines and coastal zones and their driving factors to understand the changes in the coastal ecological environment and even global changes by means of remote sensing technology [5].
In recent years, the evolution of coastlines and coastal zones has attracted extensive attention from global experts and scholars. Most scholars have focused on monitoring the coastline via remote sensing monitoring and its dynamic changes in areas where human activities are frequent and economic strength is significant [6,7,8,9] or areas where coastal changes are significant [10]. Many scholars have used remote sensing technology to study the characteristics of erosion and accretion changes in natural coastlines [11,12]. Some scholars have studied remote sensing extraction methods for coastlines [13]. Esmail et al. [14] compared and analyzed three methods, iso clustering, threshold, and screen digitization and concluded that iso clustering is the best method of coastline extraction, but traditional methods such as visual interpretation and human-computer interactive visual interpretation are still the more common research methods used by experts and scholars to extract coastal information [15]. For remote sensing monitoring of coastal zones, different scholars have defined the scope of a coastal zone in different ways. Ma et al. [16] analyzed the land use and cover change of coastal zones in different buffer zones around the Bohai Sea, and their results help clarify the current status and changes in the surface coverage of different coastal zones. A coastal zone is representative of a fragile ecological environment, which is vulnerable to human activities. The intensity of human activities is closely related to the diversity of the coastal landscape and the change of the coastline [17]. The health of ecosystems and the marine environment of coastal zone areas are important issues affecting human survival, and studying the change of surface coverage in coastal zones can provide helpful information for solving this problem.
Using remote sensing and geographic information system technology to monitor coastline and coastal zone changes has become the topic of much scholarly research in various countries. In many studies, the combination of the two technologies is seldom discussed. One reason for that is due to the difficulty of acquiring data over a long-time span. Other reasons are that many different extraction rules have been used for extracting remote sensing information extraction rules of the coastline and coastal zone, the extraction process is complex, and the relationship between coastline and coastal zone is not always clear. Most scholars only study the coastline or coastal zone and its driving factors. Therefore, based on seven remote sensing images of Yantai from 1990 to 2018, this study uses a visual interpretation method to extract remote sensing information of the coastline as well as the 2 km coastal zone. Quantitative analysis of the Yantai coastal long time series of different spatio-temporal evolution characteristics and response relationship was conducted, and the correlation between coastline and coastal zone was also studied. The research results can provide basic data for coastal protection and coastal zone development and utilization and are of great significance for solving the health ecosystem problems of coastal zones.
2. Materials and Methods
2.1. Study Area
The city of Yantai is located in the northeastern part of the Shandong Peninsula, China, between 119°34′–121°57′ and 36°16′–38°23′. It has a wide sea-front, bordering the Bohai Sea in the north, the Yellow Sea in the east, and the cities of Weifang, Qingdao, and Weihai. There are many small and medium-sized rivers in the city, including the Wulong, Dagujia, and Xin’an Rivers. Located north of the Tropic of Cancer, this region has a typical temperate monsoon climate. Compared with the inland areas of the same latitude, it is characterized by a mild climate, moderate rainfall, and high humidity. The annual average precipitation is approximately 524.9 mm.
The northern region of Yantai was studied, in which eight counties and municipalities are located, Laizhou, Zhaoyuan, Longkou, Penglai, Fushan, Zhifu, Laishan, and Muping. There are four ports along the coast: Yantai Port (or Zhifuwan Port), Penglai Port, Longkou Port, and Laizhou Port. The area is situated at the confluence of the Yellow Sea and the Bohai Sea, and the length of the coastline is approximately 600.40 km. The area that was studied includes the coastline and a 2-km coastal zone. Therefore, the surface area that was monitored was 795.06 km2. In order to ensure the integrity of the surface features in the sea area, the whole area of islands, aquaculture areas, and structures within 2 km of the coastal waters and extending outwards continuously is included in the monitoring scope (Figure 1). By the end of 2017, the regional population reached 43.917 million, accounting for 67.13% of Yantai’s population. This area had a GDP of 597.7 billion yuan, accounting for 85.11% of Yantai’s GDP. This area is the port area that has the largest population and economic density in Shandong Province. Pervasive human interference from activities such as aquaculture and artificial island construction has had a noticeable impact on the changes of coastline and coastal zone in the past 30 years [18].
2.2. Data
According to the availability of data and the economic development of the research area over the past 30 years, the data used in this study include (1) Three Landsat 5-TM images of Yantai from 1990 to 2010, with a spatial resolution of 30 m, were collected at 10-year intervals. Landsat 5-TM images with good quality covering the study area were obtained through geospatial data cloud (http://www.gscloud.cn/). Then, the tide level data of Yantai city at the corresponding time of each scene image were inquired through the Yantai tide gauge station, from which the relatively high tide level image was selected as the data source for this study. (2) The data from 2015 to 2018 are mainly based on GaoFen-2 (It was successfully launched by China on August 19, 2014) images with an accuracy of 4 m. In the key monitoring area (The key monitoring area refers to the area that can verify the correctness of the extracted information results and the area that is hard to reach by human beings), tilt photography of five-lens unmanned aerial vehicle (DJI M600 UAV) was used as the data source with an accuracy of 0.1 m. (3) The Basic Geographical Information Monitoring Data in Shandong Province in 2018. (4) Topographic maps and administrative boundary maps of the study area and other relevant information.
Seven remote sensing images of Yantai from 1990 to 2018 and UAV images were calibrated and registered in this study. Firstly, the GF-2 images from 2015 to 2018 were geometrically corrected. Then, the image data of other years were corrected according to the GF-2 images in Yantai in 2015. Six typical objects were selected as control points, and the relative geometric accuracy of the images from 1990 to 2010 was corrected and registered respectively to ensure that the error was within one pixel. The key step of UAV image registration was the selection of ground control points. The number of control points depended on the size of monitoring area. In this study, five control points were generally selected for correction. The images taken by UAV were set up in a unified coordinate system, and then the images were corrected and processed according to the space coordinates of different ground control points.
2.3. Coastline Extraction
The coastline is the demarcation line between ocean and land, and it is the link of the average high tide trace [19]. There are many methods to extract coastline data by remote sensing, such as man-machine interactive visual interpretation [20], the normalized water body index [21], and the improved water boundary method [22]. However, considering the large time span, different resolution of image data, and the complex and diverse types of coastline, in this study, we use a visual interpretation method to draw and extract the coastline every 10 years from 1990 to 2018. Due to the decrease of coastal zone variation in recent years, we also extracted the coastline data of the research area from 2015 to 2018, which provides us with high resolution image data for the past four years. The extraction of different types of coastlines is based on defined principles and methods. In order to minimize the human errors in the interpretation of the coastline by different researchers, all of the years of coastline data extraction were completed by the same person. In order to ensure its accuracy, field survey and UAV photography were used to verify the data. First, the coastline types which are difficult to distinguish in remote sensing images are investigated and validated on the spot. Second, a random selection of several areas, using UAV data and remote sensing image data comparative analysis, to verify the accuracy of coastline extraction.
Yantai’s coastline can be divided into three categories: natural, artificial, and estuarine. On the basis of the first class, the second-class types were classified. The interpretation signs and basic norms of different types of coastlines mainly refer to the contents and indicators of basic geographic national conditions monitoring in 2018. Detailed classification information is shown in Table 1.
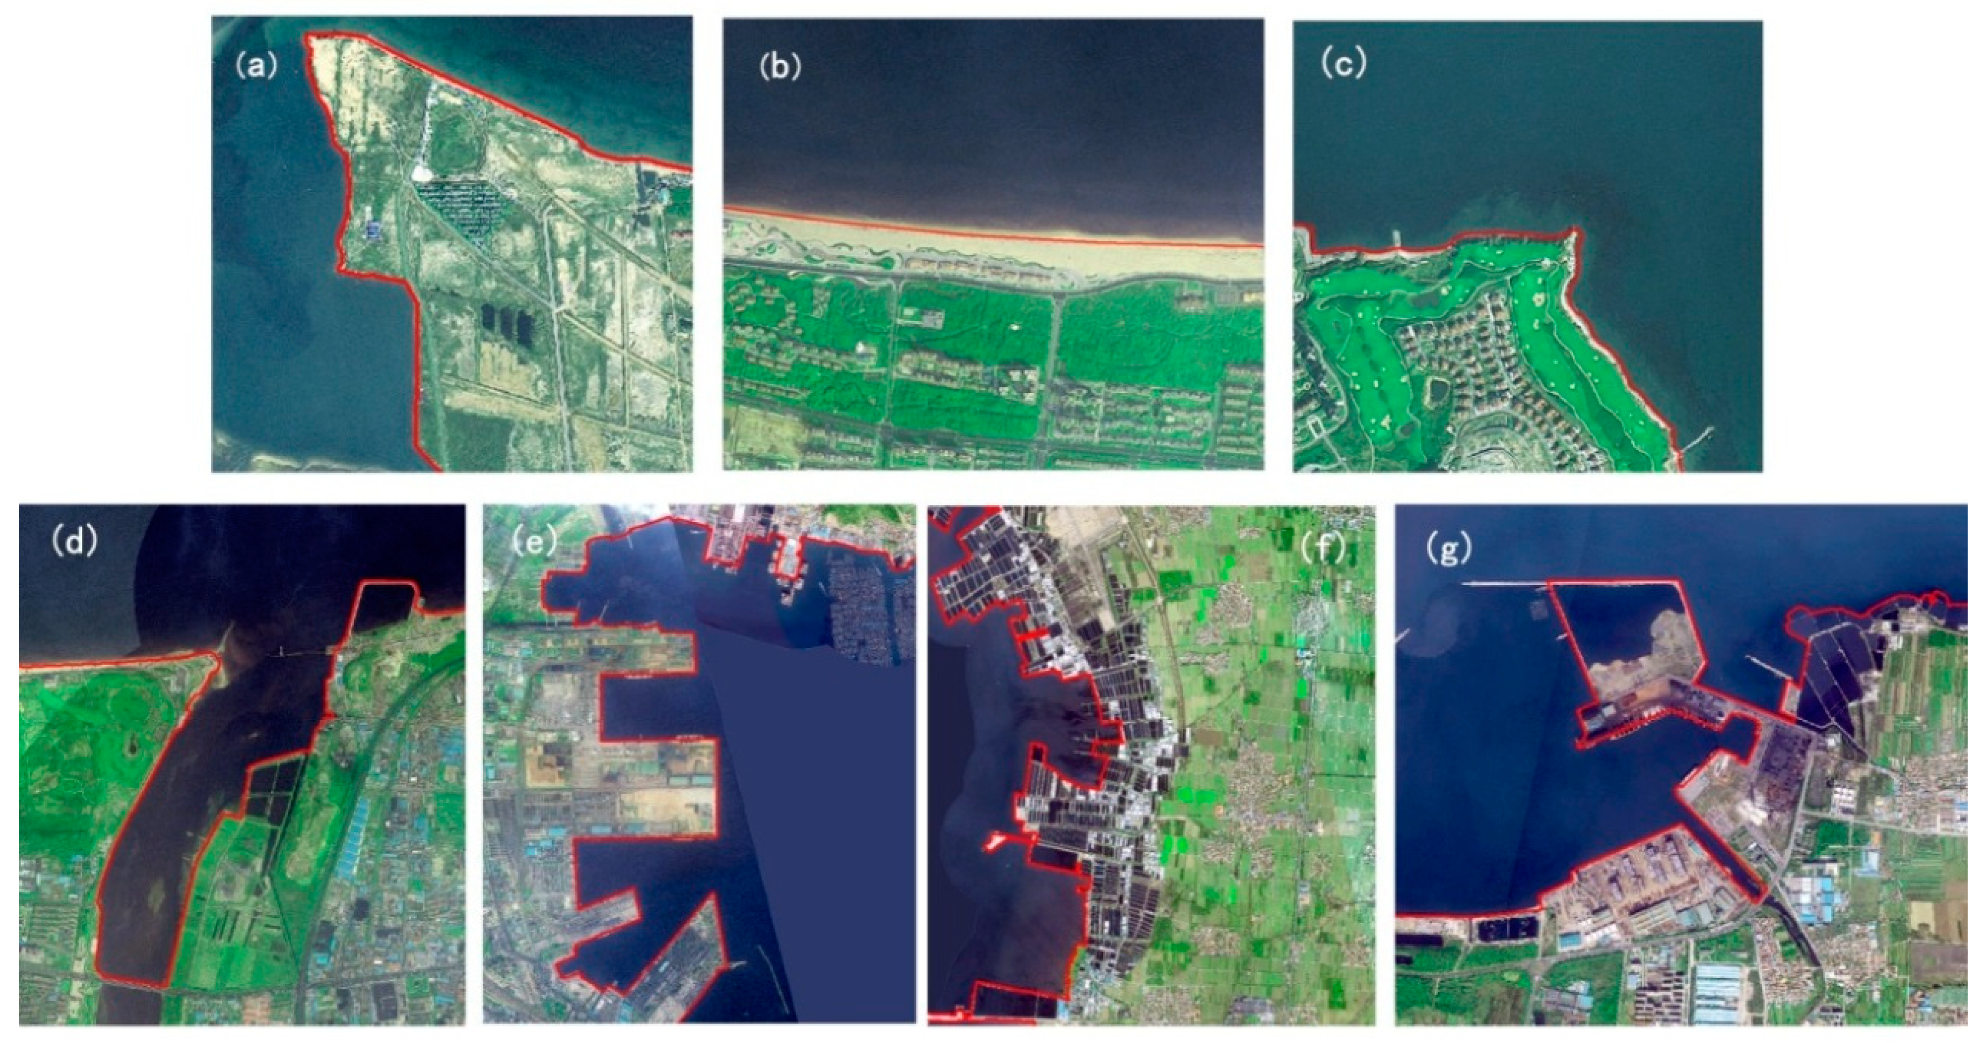
Different types of coastlines are extracted from standard pseudo-color synthetic images taken by satellite remote sensing [23]. Among them, the natural boundary line is the trace line of the average high tide line formed naturally by natural land-sea interaction without human disturbance [24], including the gravel-sandy boundary line, silty boundary line, and bedrock boundary line. The gravel-sandy boundary line is relatively straight, and the boundary line between land and sea is generally located on the top of the ridge to the seaside. Images show a distinct difference between wet and dry due to the influence of tidal water, and the boundary line is located at the dry-wet boundary. The silty boundary line is mainly located on the land-facing side of the broadband where the growth of salt-tolerant plants has changed significantly over the intertidal zone. The acquisition position of the bedrock boundary line is defined at the base of a cliff or at the junction of land and water. The definition of an artificial boundary line is relatively easy, it mainly refers to the sea-land boundary line divided by the periphery of artificial facilities, such as damp-proof dikes, slope protection, wharfs, roads, aquaculture ponds, salt fields, or other water-retaining structures. An estuary boundary line is the demarcation line between an estuary and the ocean. Figure 2 shows the results of various types of coastline extraction methods.
2.4. Calculation of Coastline Change
In this study, the end point change rate (EPR) and linear regression rate (LRR) of the digital coastline analysis system module developed by the U.S. Geological Survey are used to analyze the coastline change rate in northern Yantai [25]. The main steps are as follows. First, based on the coastline data of the past years, a baseline is extracted from the land or seaside by establishing a buffer zone, factor transfer line, and adjustment. Then, all of the annual coastline data is integrated into one factor class, that is, all coastlines. Second, equidistant tangents perpendicular to the above baselines and intersecting with all coastlines are made along the baselines. Then, the DSAS system is used to calculate all sections, and the coastline transition rate can be obtained by calculation. The terminal change rate is used to analyze the change rate of two coastlines and several coastlines in different periods [26]. The formulas are as follows:
where is the rate of change of coastline endpoint from the beginning to the end of the study, namely EPR. is the coastline time at the beginning of the study, is the coastline time at the end of the study, is the time interval between the beginning of the study and the end of the study, are the distance from the vertical direction of the coastline to the baseline when the time is and , respectively.
The linear regression rate (LRR) is better than the terminal change rate in studying the changes in multiple coastlines [27]. In this study, LRR analyses the proportional relationship and changes of multiple coastlines at different times, and its mathematical expression are as follows:
where is a dependent variable, which is the spatial position of the coastline, is the independent variable of the year, is the constant intercept of the fitting, is the regression slope, which represents the y change corresponding to each unit change, namely LRR.
In order to clearly see the variation degree of coastline length for different time periods, the following formula is used to express the annual variation information of coastline length, that is, the coastline variation intensity [28]:
where is the variation intensity of coastline length in the study area from year to year , and and are the coastline lengths in the study area in year and year , respectively.
2.5. Calculation of Fractal Dimension of the Coastline
In this study, the fractal dimension of the coastline is calculated by the grid method [29]. The basic principle of the grid method is to use square grids of different lengths to cover the measured coastline continuously and with no overlap. When the length of square grids r takes different values, the number of grids needed to cover the whole coastline will change accordingly [28]. The formula is as follows:
By taking the natural logarithm of both sides of equation (6), the following results are obtained:
where D is the fractal dimension of the measured coastline, and C is a constant. The fractal dimension D can be calculated by fitting and regression analysis of different R values and corresponding values. The larger the value of the fractal dimension, the more complicated and tortuous the coastline. On the contrary, the smaller the value of the fractal dimension, the smaller the tortuosity and complexity of the coastline [30]. Based on the ArcGIS platform and least squares method, the fractal dimension of the coastline is obtained by calculations followed by fitting as well as regression analysis.
2.6. Extraction of Coastal Zone Coverage Information
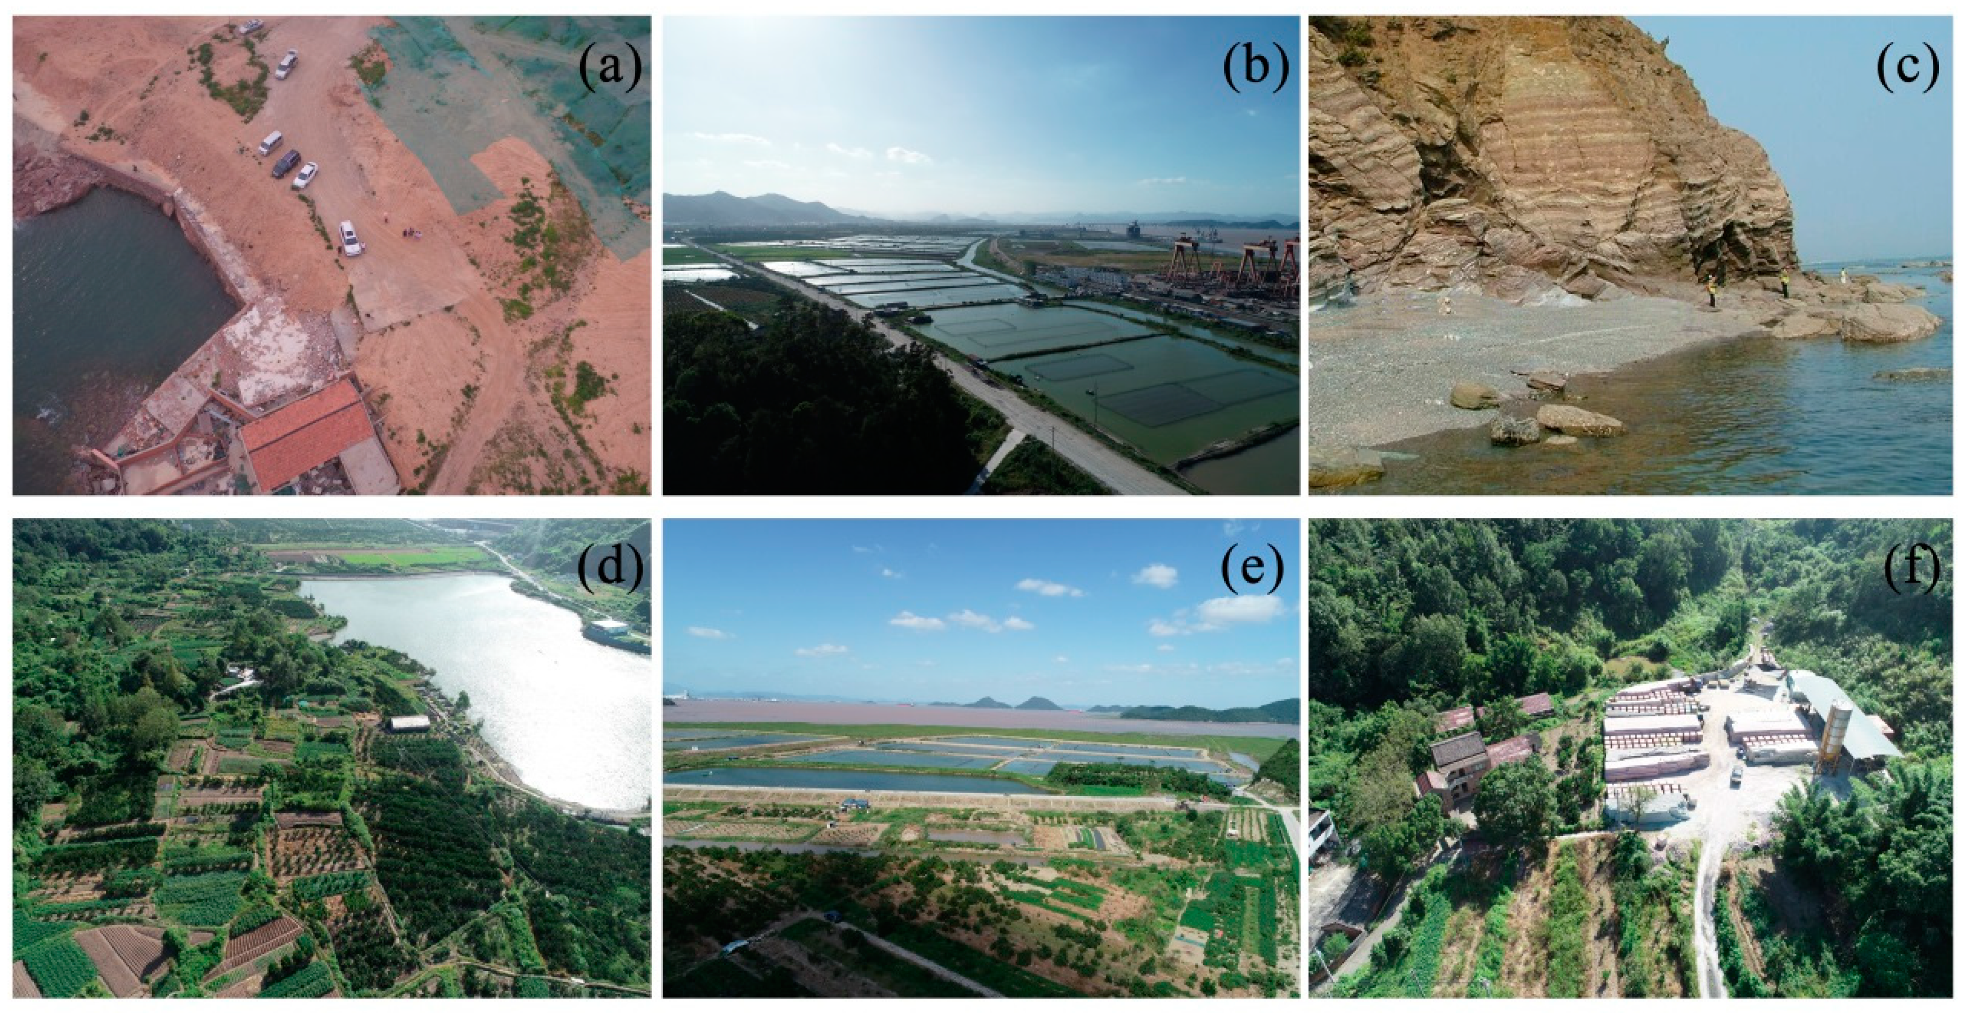
Based on the 2018 coastline, this study defines the coastal zone as the zonal area formed by extending 2 km from coastline to inland and uses the same visual interpretation method as the extraction of the coastline to extract the surface coverage information of the coastal zone. Referring to the content and indicators of China’s geographic survey, this study highlights the types and elements of coastal zone development and utilization and forms a classification system of land cover for coastal zone development and utilization change monitoring. The surface coverage of the coastal zone in the study area includes eight first-class classifications: cultivated land, forests/grasses coverage, building areas, roads, structures, manually excavated land, desert/bare land, water areas [31]. Due to the difference in image resolution and subjective error of visual interpretation in different years, this study only considers the change of the first-class coastal zone in the study area and does not analyze the second-class land cover types. In this paper, UAV is used to verify the correctness of information extraction results, and it can also reach places that are difficult for human beings to reach for monitoring (Figure 3). The classification system of first-class land cover is consistent with the classification standard of Shandong Province’s geographic condition monitoring (Table 2).
3. Results
3.1. Characteristics of Coastline Changes
3.1.1. Variation of Coastline Length
According to the seven remote sensing images of the study area from 1990 to 2018, the total length of the coastline in each period was obtained by visual interpretation (Figure 4). In order to ensure the accuracy of the extracted coastline data, GF-2 images with a resolution of 4 m were used in this study. The results of coastline extraction were verified by UAV photography, and the accuracy of coastline extraction was calculated. The results showed that the typing accuracy of the coastline extracted in this study reached 97.02% and the length accuracy of the coastline reached 94.78%. In the chart, it is clear that 2015 is a time node for the change of coastline length. Before 2015, the port areas headed by Penglai, Longkou, and Zhifu developed rapidly. The coastline length showed a continuous growth trend, that is, it increased by 174.15 km, an increase of 41.53%. In 2015, the relevant departments began to take effective measures to repair the islands and coastlines in view of the excessive exploitation and utilization of the ocean and coastal zones and the impact of natural disasters, such as typhoons and ocean storm surges [32]. The length of the coastline showed a relatively stable small growth trend with a cumulative increase of 6.93 km, an increase of approximately 1.16% in 2015.
According to the trend map of coastline length change in the study area from 1990 to 2018, the coastlines of several periods were selected randomly to calculate the intensity of coastline change (Table 3). In the past 30 years, the changing intensity of coastline length in the study area is approximately 1.54%. The changing intensity of coastline length in the study area was the greatest during 2010–2015 with a value of 3.47%. The changing intensity of coastline length in the study area was the smallest during 2015–2018 with a value of 0.39%.
Figure 5 shows the coastline type and length information in different years of the counties and municipalities in the study area. From 1990 to 2018, the natural, artificial, and estuarine boundary lines in the northern part of Yantai changed significantly. The length of natural boundary lines decreased rapidly from 315.42 km to 202.79 km, then slowly decreased to 201.13 km. On the contrary, the length of the artificial boundary line increased rapidly at first and then increased slowly. Its size increased from 101.94 km in 1990 to 396.47 km in 2018. The length of the estuary boundary line increased, but the overall change is not significant.
From 1990 to 2015, the length of the artificial boundary line in the study area continued to increase. Among the cities studies, Laizhou, Longkou, and Penglai have the largest increase in artificial boundary lines, which are 81.91 km, 58.07 km, and 61.02 km, respectively. The main reason is that the impact of human activities such as the construction of ports, artificial islands, and coastal areas is increasing, which makes the coastline extend towards the sea and thus lengthen. The increase of the artificial boundary line is not only the extension of the artificial boundary line to the sea but also the transformation of the natural boundary line. Many areas, led by Laizhou, have built sunshine ponds and aquaculture ponds on the muddy coast, thus transforming the natural boundary line into the artificial boundary line. The total length of the natural boundary line continuously decreased. Longkou’s natural coastline decreased by 29.13 km, accounting for 48.20%. The natural coastline of Zhaoyuan has been reduced the least with a total decrease of 0.22 km, accounting for approximately 1.72%.
From 2015 to 2018, the natural boundary length of the coastline in the study area decreased from 202.79 km to 21.13 km, a total of 1.66 km. The length of the artificial boundary line increased from 387.53 km to 396.47 km, an increase of 8.94 km. The change of the estuary boundary line is negligible. However, the natural boundary lines of some counties and municipalities had an increasing trend, while the artificial boundary lines had a decreasing trend. Among them, the length of the natural boundary line in Longkou increased by fluctuation, decreasing from 31.32 km to 30.52 km, and then increasing to 31.33 km. The length of artificial boundary lines in Fushan and Mouping decreased by 0.38 km and 0.13 km, respectively. The main reason is that in recent years, with the implementation of the major strategy of the Blue Economic Zone in Shandong Peninsula, in order to make better use of marine resources and develop the marine economy, the relevant departments have strengthened their control over the abuse of marine resources in violation of regulations, and have also strictly examined the approval of the construction and development of various ports and wharfs. The growth rate of the coastline has slowed down, and the quality of the marine environment has improved.
According to the secondary coastline data of the Yantai northern region from 2015 to 2018, it can be seen that the length of the coastal construction boundary line, port and wharf boundary line, road boundary line, protection engineering boundary line, breeding boundary line, gravel, and sand boundary line, and silt boundary line have increased. The increase was 7.45, 5.62, 5.33, 2.71, 0.91, 0.86, and 0.05 km, respectively. The length of the other artificial boundary lines, bedrock boundary lines, estuary boundary lines, and salt field boundary lines decreased by 2.78, 2.45, 0.09, and 0.02 km, respectively. Among them, the coastal construction boundary lines in Zhifu, Penglai, and Fushan increased the most, from 0, 5.43, and 11.42 km in 2015 to 2.37, 7.27, and 13.23 km in 2018, respectively. The other artificial boundary lines in Zhifu, Mouping, and Penglai decreased the most, by 1.32, 0.74, and 0.58 km, respectively. The percentage of reduction was 75.00%, 31.62%, and 9.98%. The length of each boundary line in Zhaoyuan and Laishan changed slightly, among which the other artificial boundary lines in Zhaoyuan changed the most with a decrease of 0.07 km, accounting for 0.57% of the total change of the boundary line. The boundary line of the estuary in Laishan changed the most, and it also decreased by 0.07 km, accounting for 7.53% (Table 4 and Table 5)
3.1.2. Spatial and Temporal Variation Characteristics of the Coastline
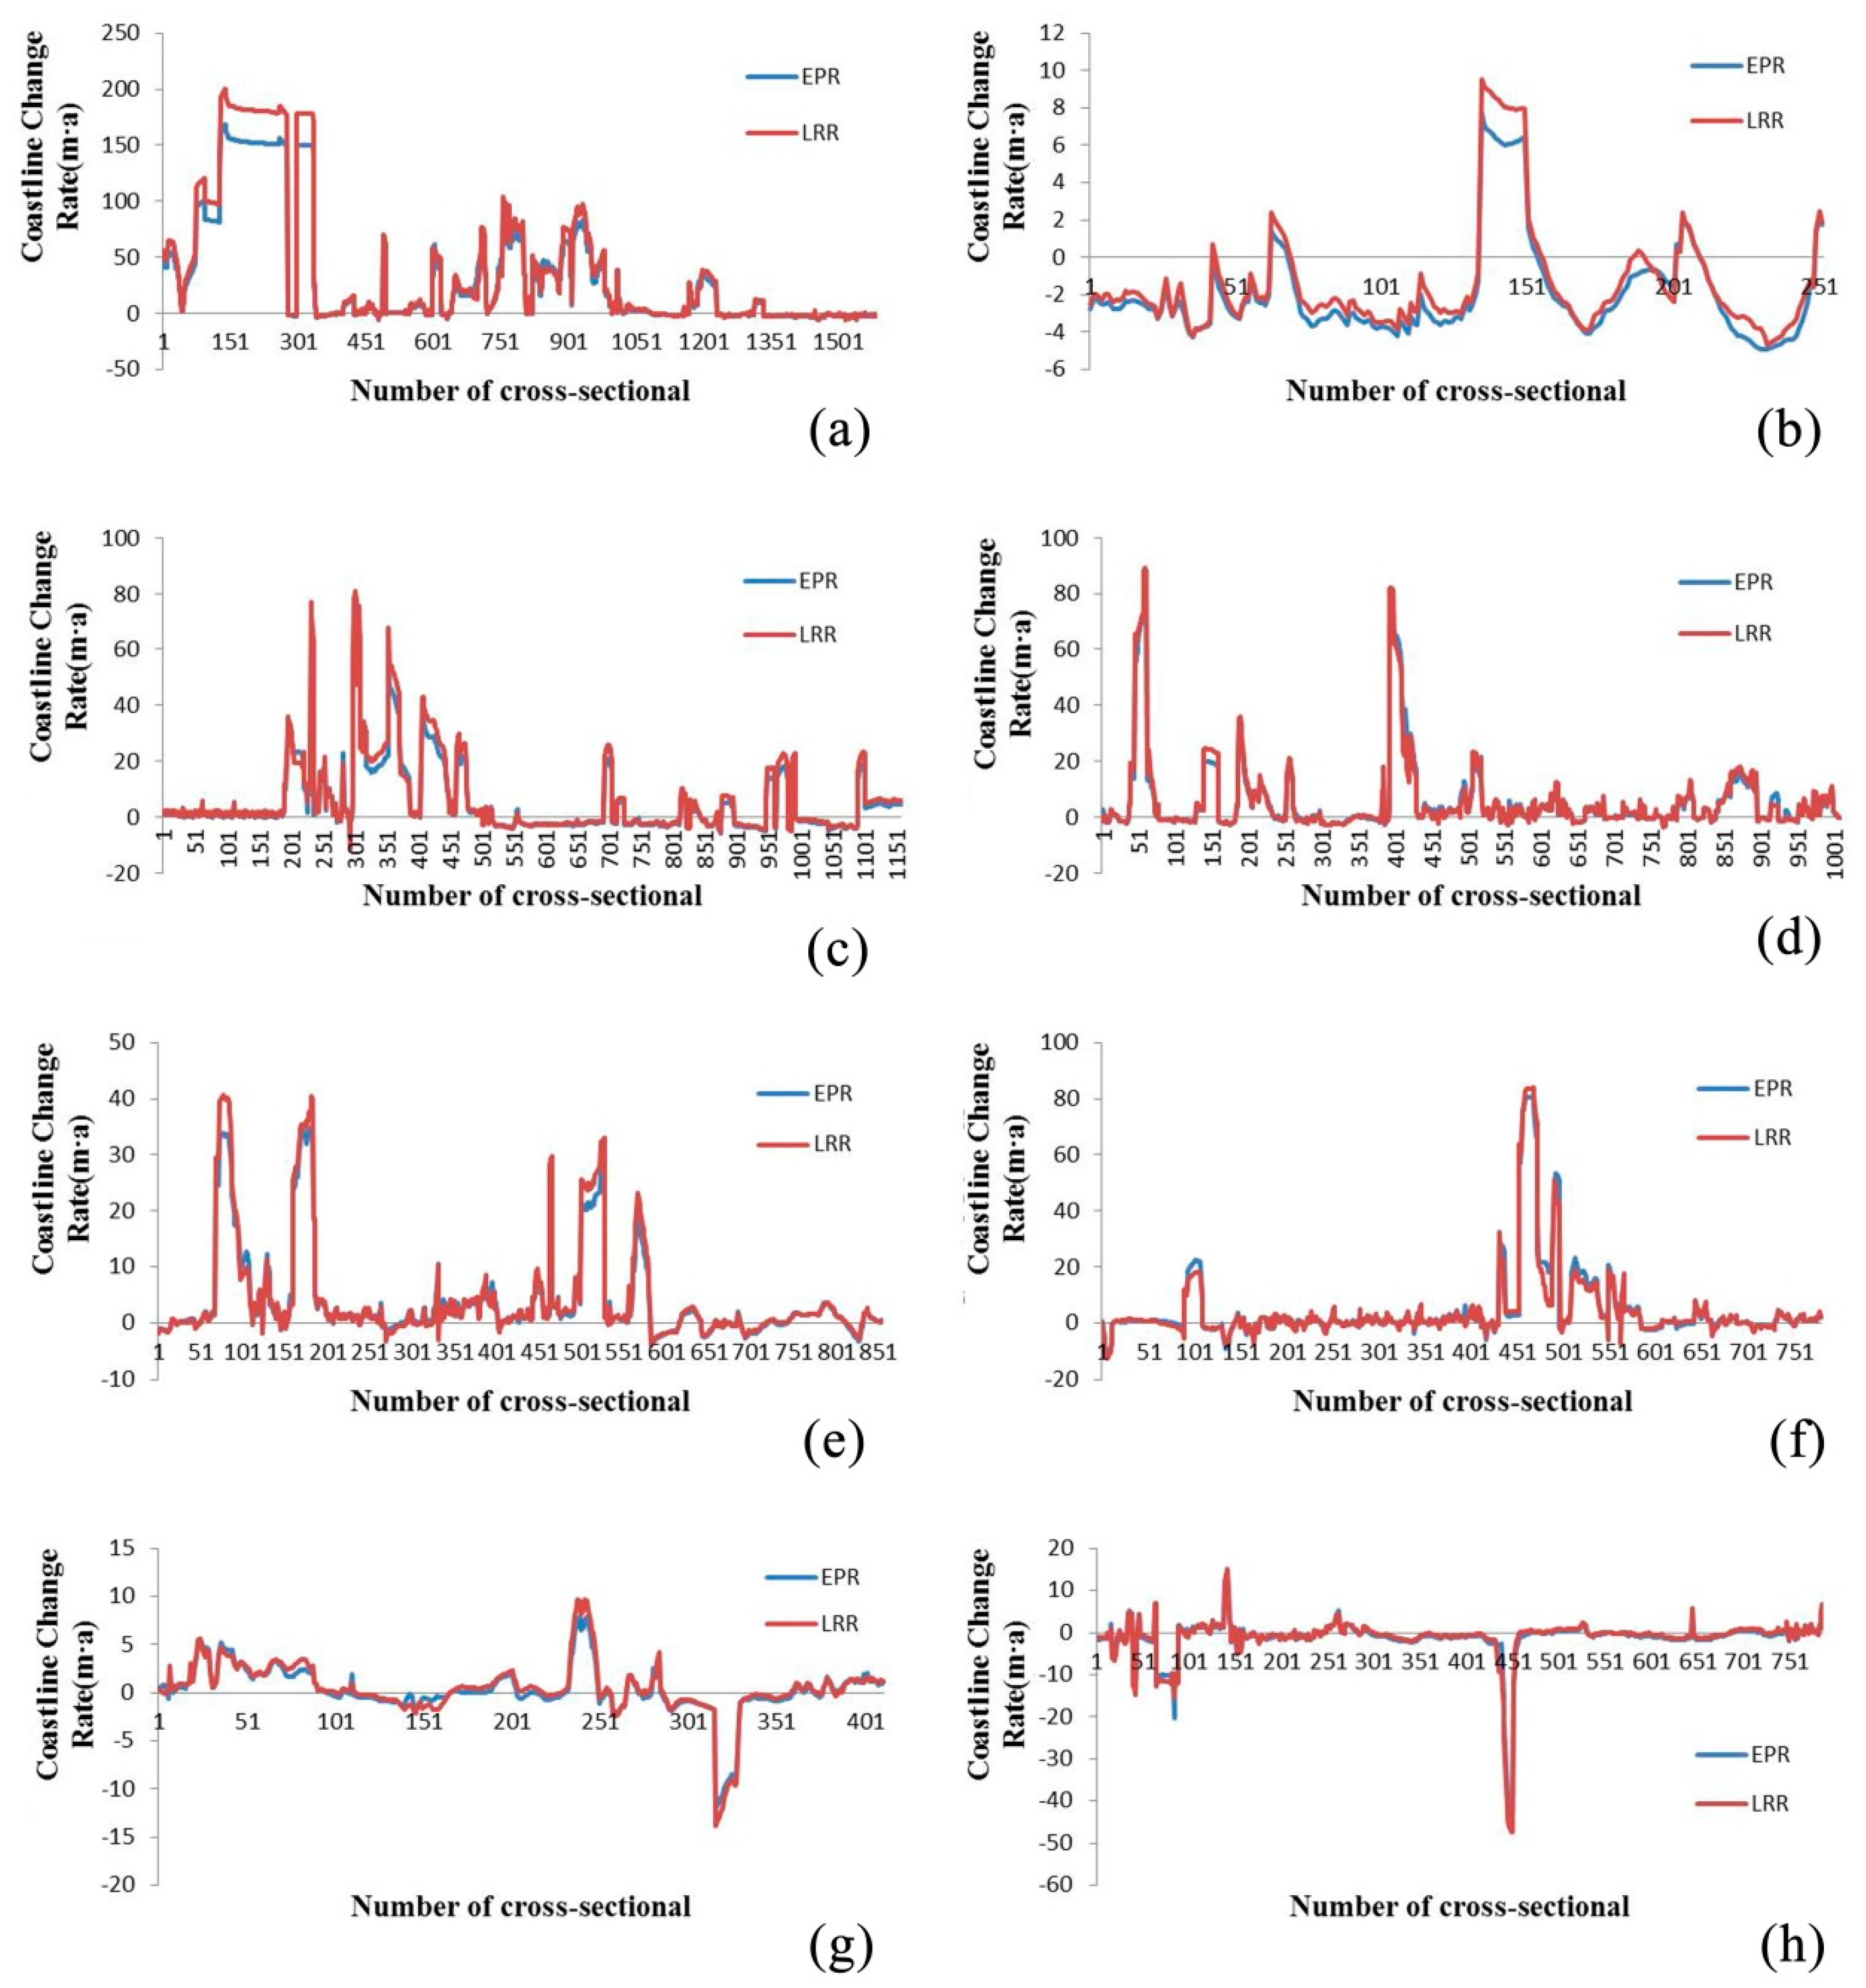
The end point change rate (EPR) and linear regression rate (LRR) were used to study and analyze the coastline changes of counties and municipalities in the northern region of Yantai from 1990 to 2018. Figure 6 and Figure 7 show that the coastline generally shows a trend of growth extending to the sea, but the trend of coastline changes in different counties and municipalities is different. The coastline changes in Laizhou, Longkou, Penglai, and Zhifu are more noticeable.
From 1990 to 2018, the average annual variation EPR and LRR of the coastal areas in northern Yantai were 6.34 m/a and 7.34 m/a, respectively, and the growth of coastal sediment was dominated by seaward siltation. The annual variation rate of the coastline in each county and municipality ranged from large to small in the following order: Laizhou > Penglai > Longkou > Zhifu > Fushan > Laishan > Mouping > Zhaoyuan. Among them, the annual variation rate of the Laizhou coastline was the largest an EPR of 33.67 m/a and an LRR of 39.37 m/a. The maximum deposition rate of the coastline in the study area also appeared in the coastal section and is located around the northern aquaculture area of Tushan Town, Laizhou with an EPR of 168.88 m/a and an LRR of 200.48 m/a, and the maximum erosion rate of the coastal section was −6.37 m/a (EPR) and −5.83 m/a (LRR). The Zhaoyuan coastline had the smallest annual variation rate with an EPR of −1.91 m/a and an LRR of −1.37 m/a. The maximum deposition rate of the Zhaoyuan coastline was 7.73 m/a (EPR) and 9.56 m/a (LRR), and the maximum erosion rate was -4.93 m/a (EPR) and −4.67 m/a (LRR). The maximum erosion rates of the coastline in the study area were −43.27m/a (EPR) and −47.41 m/a (LRR). In the past 30 years, the coastline of Laizhou, Penglai, Longkou, and Zhifu has become the fastest-changing area of the coastline of the Jiaodong Peninsula due to the continuous influence of human activities, such as reclamation, artificial island construction, dam construction, and port construction.
Human activities are irreversible and destructive to coastline changes, and it is difficult to restore the original natural coastline [33]. From the changes in the coastline of different regions, we can see that human activities have the greatest impact on the changes in the coastline. Especially from 2010 to 2015, the flooding of the Laizhou aquaculture area, construction of the Longkou artificial island, coastal construction of Penglai and Zhifu, and expansion of port terminals have made great changes in the coastline. However, since 2015, due to the public’s awareness of a series of problems caused by the destruction of the coastline and reduction of marine resources, various departments have strengthened the control of coastal areas, increasing the control coastline changes and protection of the marine ecological environment.
3.1.3. Characteristics of the Fractal Dimension of Coastline Variation
The shape of the coastline is winding and complex. Therefore, the calculation of the fractal dimension of the coastline is helpful to understand the change of the length and shape of the coastline and can provide an important basis for promoting the protection of the coastline and its manageable development and utilization. Based on the coastline information extracted by visual interpretation from 1990 to 2018, the fractal dimension changes of the coastline in the study area were calculated by ArcMap software and the least squares method. In this study, 10 grid lengths (30, 60, 90, 120, 150, 180, 210, 240, 270, and 300 m) were used to cover the coastline to be analyzed, and the fractal dimension of the coastline was calculated. Finally, the changes in the fractal dimension of the coastline in the study area in the past 30 years were obtained (Figure 8).
The fractal dimension of the study area calculated in this study is close to that of the coastline of Shandong Province studied by Xu Ning [27], and the trend of change is consistent. Generally speaking, the fractal dimension of the coastline in the study area shows an increasing trend with time. However, it can be clearly seen in Figure 7 that before 2015, the coastline fractal dimension increased by 0.0382, but in 2015–2018, the coastline fractal dimension increased by 0.0043. Thus, as people have gradually realized that the destruction of human activities on the oceans has begun to have a serious impact on human survival, the protection of marine resources and careful use of marine resources has become a greater priority [10].
3.2. Analysis of Surface Cover Change in the Coastal Zone
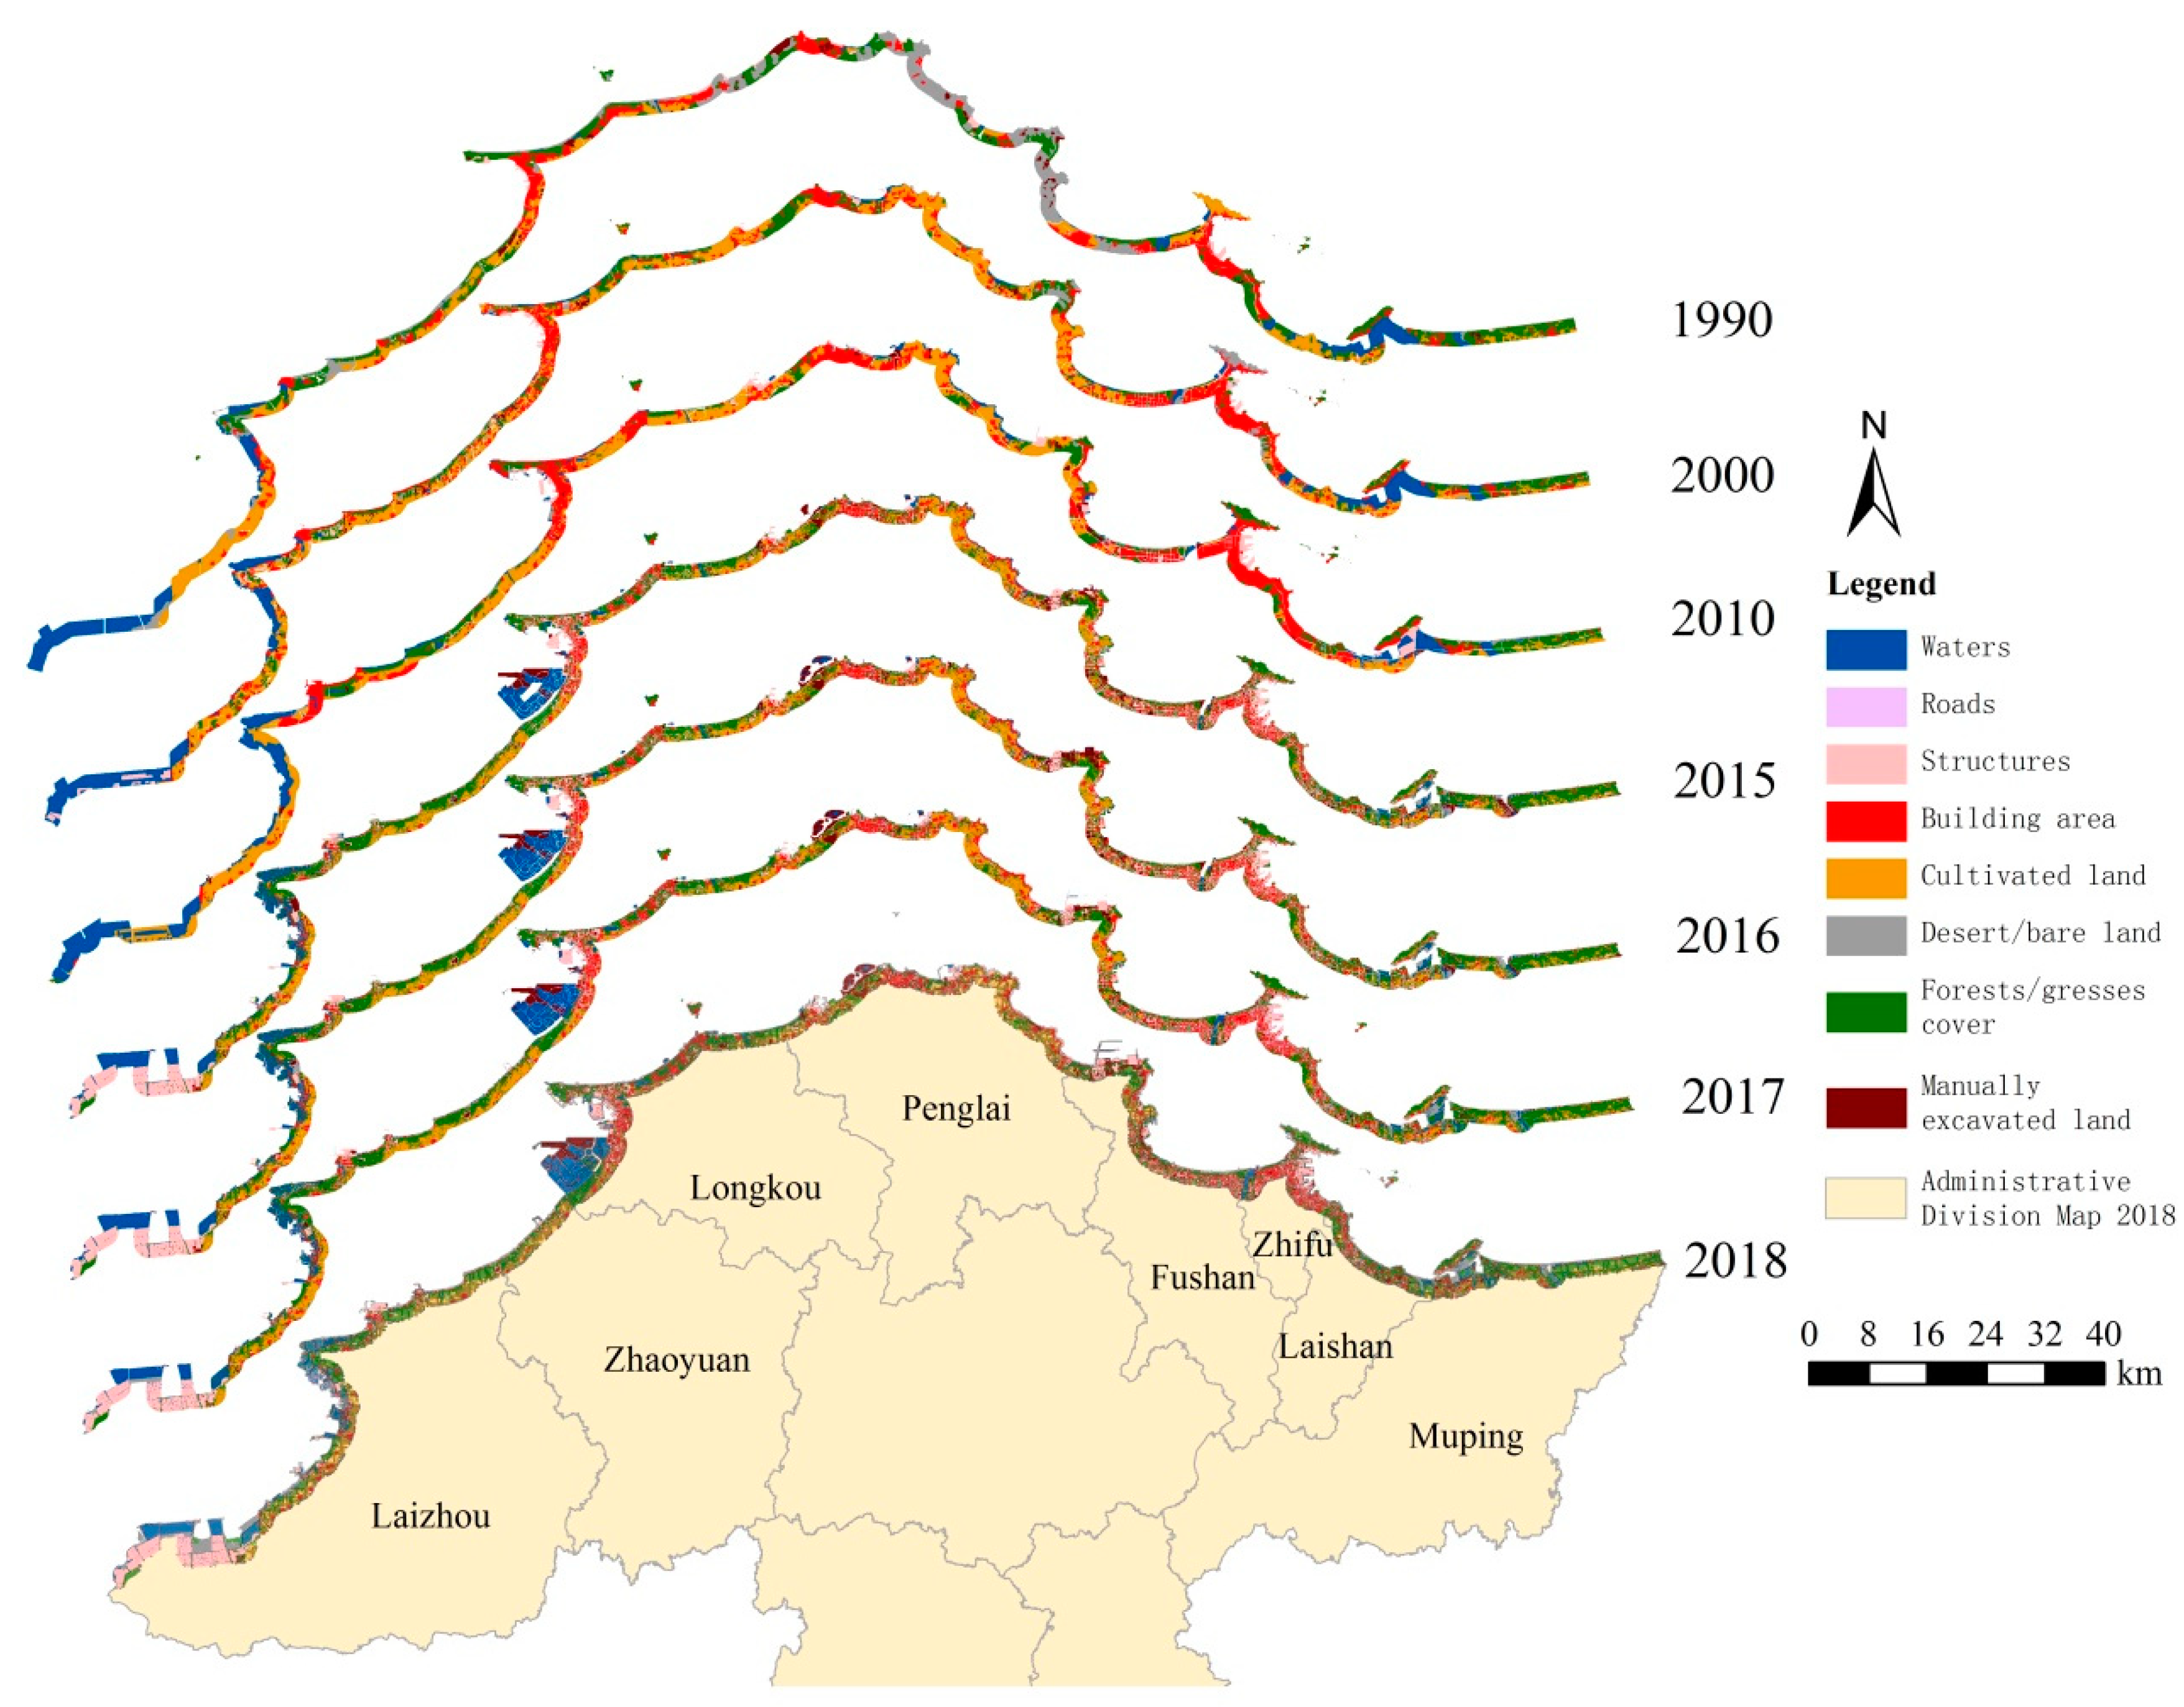
In 2018, the coastal land cover in the northern Yantai coastal area was dominated by forests/ grasses cover and structures, accounting for 31.40% and 15.45% of the study area, respectively, while other land types accounted for a relatively small proportion. From 1990 to 2018, the area of forests/grasses covers, and structures increased, while the area of desert/bare land and water area decreased. Among them, forests/grasses cover area increased from 153.56 km2 to 249.65 km2, structure area increased from 9.88 km2 to 122.84 km2, desert/bare land area decreased from 129.46 km2 to 37.20 km2, and water area decreased from 93.15 km2 to 80.83 km2 (Figure 9)
Hou Xiyong’s research reported that the coastal land area of Shandong Province is continuously increasing [34]. The eight counties and municipalities involved in the northern coastal area of Yantai studied in this study are all located in the northern part of Shandong Province, and the coastal land area has been increasing over the past 30 years. From 1990 to 2018, the coastal areas of Longkou and Laishan increased by 52.54% and 34.63%, while those of Fushan and Mouping increased by 8.05% and 9.04%. Table 6 shows the change of surface coverage of the first-class coastal zones in each county and municipality from 1990 to 2018. The study found that from 1990 to 2018, the area of structures in the study area increased the most, to 112.96 km2, of which the area of structures in Laizhou increased by 50.65 km2, accounting for 44.84%. The area of desert/bare land decreased the most, by 92.26 km2, and Penglai City decreased the most, by 48.46 km2, accounting for 52.53%. In contrast, the changes in building areas and water areas are relatively small, i.e., 5.87 km2 and 12.32 km2, respectively.
Based on the vector data of the coastal zone extracted by remote sensing, the transfer matrix analysis of various types of coastal zone areas in the study area from 2015 to 2018 was carried out to fully understand the land pattern transformation of the coastal zone in the study area in recent years. As can be seen from Table 7, from 1990 to 2018, forests/grasses cover and structure transfer area were the largest, 139.92 km2 and 70.58 km2, respectively. The increased area of forests/grasses cover was mainly transformed from cultivated land and desert/bare land. The increased area of structure was mainly transformed from water area, desert/bare land, and building area. Desert/bare land has the largest area of transfer, of which 35.72 km2 is converted into forests/grasses cover, and then into cultivated land, building areas, and structures. In addition, the change of manually excavated land is not clear, and the increase only accounts for 2.70% of the total change. Generally speaking, the region presents a state of transition from desert/bare land, cultivated land, and building areas to forests/grasses cover and structures, but the overall area of the study area experienced little change and is relatively stable.
3.3. Relationship between coastline change and coastal surface cover change
The change of land cover types in offshore areas will have a certain impact on the change of coastline types and lengths. Through comparative analysis, it was found that the changes of coastal structures, manually excavated land, and roads in the study area are related to the length of the artificial coastline. From 1990 to 2018, the length of the coastline in the study area increased with the use of structures, manually excavated land and roads as the coastline, and the length of the artificial boundary line in the study area also increased. The correlation is shown in Figure 10.
Human activities have brought about significant changes in resources and to the environment of the coastal zone, which have not only shaped many types of artificial coastline landforms, such as harbor and wharf, protection engineering, and coastal construction, but they also have had a great impact on the natural evolution process of the coastal zone. The coastline of Yantai is clearly affected by the change of land use in the coastal zone, especially by structures, manually excavated land, and roads. Through comparative analysis of the impact of structures, manually excavated land, roads, and desert/bare land on the coastline from 1990 to 2018, we determined that the artificial boundary line in the northern coastal area of Yantai is directly proportional to the length of the coastline with roads as the coastline, which was the most significant correlation (R2 = 0.9527, P < 0.01). It can be seen that in the past 30 years, roads have had the greatest impact on the coastline changes in the northern coastal areas of Yantai, and the impact of structures and manually excavated land on the coastline changes is more significant, which is the impact of frequent human activities on the coastline.
Yantai has a superior geographical location and abundant marine resources, and its coastal zone has a long history of development. In recent years, the coastal regional economy of northern Yantai has developed rapidly. The port cities headed by Zhifu, Penglai, and Laizhou have been growing steadily. The construction of the Longkou artificial island group has increased the driving force for the overall economic development of Yantai [18]. However, at the same time, people need to be aware of the series of health problems brought about by the overdevelopment of coastal areas. How to minimize the damage while undergoing developing has become an urgent problem that needs to be solved.
4. Discussion
The northern coastal area of Yantai is the key development area of the Blue Economic Zone in the Shandong Peninsula. The sensible development and utilization of coastal areas and marine resources is of great significance to the economic development of this area [35]. In the past 30 years, the economic development of Yantai City has been very fast, especially in the northern coastal areas. Due to the impact of human activities on the coastal zone, the coastal zone of the study area has undergone significant changes, which can be confirmed by the interpretation and analysis of remote sensing images.
Coastal zone information was extracted every 10 years between 1990 and 2018. The analysis shows that the increase range of coastline length changed in the following order: 1990–2000 < 2000–2010 < 2010–2018. Among them, in the period of 2010–2018, the coastline length experienced the greatest change. With the development of the economy, the exploitation and utilization of the coastal zone have been intensified, and the coastline has shown a rapidly increasing trend. However, the analysis results show that the length of the coastline has not been increasing rapidly during this period. During the period from 2015 to 2018, the growth rate of the coastline decreased significantly. Since 2015, in view of a series of problems in coastal areas, relevant departments have begun to take measures to rectify and repair damaged islands and coastal zones, and the over-exploitation of coastal zones has been alleviated to a certain extent [36].
According to Figure 4 and Figure 8, the change of the fractal dimension of the coastline in the study area is consistent with that of its length, first showing a trend of rapid increase and then slowly increasing. There are two main reasons for this trend. One is because of the low resolution of remote sensing images from 1990 to 2010 and the rough coastal information extracted, the coastline length and fractal dimension values are smaller. The resolution of remote sensing images in 2015 and beyond is higher, which can extract coastal information in more detail, and the length and fractal dimension of the extracted coastline are more accurate. The second reason is that with the rapid development of the social economy, especially the economic development of the coastal zone, people’s utilization of the ocean has been strengthened. The construction of reclamation, artificial islands and port wharfs have increased the length of the coastline and made it more tortuous, and the fractal dimension value of coastline increases with the length. Since 2015, the coastline has changed slightly, which is because various departments began to attach importance to the development of coastal areas and actively take measures to control the development and utilization of coastal areas and effectively protect marine resources. This awareness of coastlines being adversely impacted by multiple driving forces has accelerated our efforts to assess, monitor and mitigate coastal stressors [37]. The coastal environmental quality has been greatly improved.
In recent years, the artificial exploitation of the coastal zone has been increasing, the carrying capacity of coastal area has become fragile, and the environment on which human beings depend has been challenged. Local government should attach importance to the development of coastal areas and actively take measures to control the development and utilization of coastal areas and effectively protect marine resources. Effective planning and management are the preconditions for sustainable coastal development [38]. With Yantai becoming the backbone city of the Blue Economic Zone in Shandong Peninsula, the land use types in northern coastal areas are continuously changing. It is necessary to develop the economy, protect marine ecological resources and the environment, pay attention to the development status of the coastal zone, and rationally develop and plan coastal areas for the sustainable development of the marine economy in the future. It is also an important precondition to solve the problems of the health ecosystem of coastal zones. Therefore, we should not neglect the value of natural resources for human beings in pursuit of personal interests. Economic development should be based on the balance of ecological resources and the environment. Otherwise, when the economy develops to a certain extent, human beings will face greater survival problems.
5. Conclusions
In this study, the coastal zone of the Yantai northern region was extracted by remote sensing every 10 years from 1990 to 2018. The coastal zone information of the study area from 2015 to 2018, which can obtain high resolution image data in the past four years, has been extracted more precisely. Then, the changes in the coastline and coastal zones of eight counties and municipalities were analyzed.
(1) In the past 40 years, the spatial and temporal differences of the coastline in the study area are significant: from 1990 to 2018, the length of coastline increased greatly. The increased areas were mainly concentrated in Laizhou, Longkou, Penglai, and Zhifu. The increased coastline types were mainly artificial boundary lines. The length of the natural boundary line decreased, and a large number of natural boundary lines were transformed into artificial boundary lines. Human activities have seriously affected the development of the coastline. Among them, the range of coastline change in the study area decreased significantly from 2015 to 2018.
(2) Human activities affect not only the coastline changes but also the types and areas of surface coverage in the coastal zone. In recent years, with the rapid development of the regional economy and urbanization in the northern coastal areas of Yantai, the types of land surface coverage in the coastal zone are mainly transferred from desert/bare land and cultivated land to structure and forests/grasses cover. Influenced by human activities, the monitoring area of various types is increasing, especially the area of structures, manually excavated land, and water area, then health problems in coastal zones increase with changes in coastal zones.
(3) The changes of resources and environment in the coastal zone will affect the types and areas of surface coverage, and then affect the types of coastline landforms, so that the types of coastline landforms will change with the changes of the types of surface coverage near the coastline, especially the types of structures and roads constructed to the sea.
Author Contributions
M.Z. and M.W. were responsible for the overall design of the study and contributed to the proofreading of the manuscript. M.Z., G.Z., and L.Z. extracted and processed the data by remote sensing. X.H. and Y.Y. contributed to designing the study and the proofreading of the manuscript. M.Z. and G.Z. analyzed and interpreted the data. M.W. and Y.Z. contributed materials.
Funding
This research was funded by the Shandong Natural Science Foundation (ZR2019MD041), the National Natural Science Foundation of China (41676171), the Shandong Natural Science Foundation (ZR2015DM015), and the Development and Construction Funds Project of National Independent Innovation Demonstration Zone in Shandong Peninsula (ZCQ17117).
Acknowledgments
We gratefully acknowledge the help of the Geographic Information System Group of Ludong University in collecting and extracting the data.
Conflicts of Interest
The authors declare no conflicts of interest.
References
- Sengupta, D.; Chen, R.; Meadows, M.E. Building beyond land: An overview of coastal land reclamation in 16 global megacities. Appl. Geogr. 2018, 90, 229–238. [Google Scholar] [CrossRef]
- Kantamaneni, K.; Phillips, M.; Thomas, T.; Jenkins, R. Assessing coastal vulnerability: Development of a combined physical and economic index. Ocean Coast. Manag. 2018, 158, 164–175. [Google Scholar] [CrossRef]
- Harik, G.; Alameddine, I.; Maroun, R.; Rachid, G.; Bruschi, D.; Garcia, D.A.; El-Fadel, M. Implications of adopting a biodiversity-based vulnerability index versus a shoreline environmental sensitivity index on management and policy planning along coastal areas. J. Environ. Manag. 2017, 187, 187–200. [Google Scholar] [CrossRef] [PubMed]
- Jingping, X.; Fang, L.; Anning, S.; Jianhua, Z.; Xiu, S. Spatio-temporal Change and Carrying Capacity Evaluation of Human Coastal Utilization in Liaodong Bay, China from 1993 to 2015. Chin. Geogr. Sci. 2019, 29, 463–473. [Google Scholar] [CrossRef] [Green Version]
- Hossain, M.S.; Dearing, J.A.; Rahman, M.M.; Salehin, M. Recent changes in ecosystem services and human well-being in the Bangladesh coastal zone. Reg. Environ. Chang. 2016, 16, 429–443. [Google Scholar] [CrossRef]
- Jabaloy-Sánchez, A.; Lobo, F.J.; Azor, A.; Barcenas, P.; Fernández-Salas, L.M.; Del Rio, V.D.; Peña, J.V.P. Human-driven coastline changes in the Adra River deltaic system, southeast Spain. Geomorphology 2010, 119, 9–22. [Google Scholar] [CrossRef]
- Khamis, Z.A.; Kalliola, R.; Käyhkö, N. Geographical characterization of the Zanzibar coastal zone and its management perspectives. Ocean Coast. Manag. 2017, 149, 116–134. [Google Scholar] [CrossRef]
- Moussaid, J.; Fora, A.A.; Zourarah, B.; Maanan, M.; Maanan, M. Using automatic computation to analyze the rate of shoreline change on the Kenitra coast, Morocco. Ocean Eng. 2015, 102, 71–77. [Google Scholar] [CrossRef]
- Xu, N.; Gong, P. Significant coastline changes in China during 1991–2015 tracked by Landsat data. Sci. Bull. 2018, 63, 883–886. [Google Scholar] [CrossRef]
- Ghosh, M.K.; Kumar, L.; Roy, C. Monitoring the coastline change of Hatiya Island in Bangladesh using remote sensing techniques. ISPRS J. Photogramm. Remote Sens. 2015, 101, 137–144. [Google Scholar] [CrossRef]
- Ahmed, A.; Drake, F.; Nawaz, R.; Woulds, C. Where is the coast? Monitoring coastal land dynamics in Bangladesh: An integrated management approach using GIS and remote sensing techniques. Ocean Coast. Manag. 2018, 151, 10–24. [Google Scholar] [CrossRef]
- Kaliraj, S.; Chandrasekar, N.; Magesh, N.S. Evaluation of coastal erosion and accretion processes along the southwest coast of Kanyakumari, Tamil Nadu using geospatial techniques. Arab. J. Geosci. 2015, 8, 239–253. [Google Scholar] [CrossRef]
- Ma, X.F.; Zhao, Z.D.; Zhang, F.S.; Wen, S.Y.; Yang, F. An Overview of Means of Withdrawing Coastline by Remote Sensing. Remote Sens. Technol. Appl. 2007, 22, 575–580. [Google Scholar] [CrossRef]
- Esmail, M.; Mahmod, W.E.; Fath, H. Assessment and prediction of shoreline change using multi-temporal satellite images and statistics: Case study of Damietta coast, Egypt. Appl. Ocean Res. 2019, 82, 274–282. [Google Scholar] [CrossRef]
- Dellepiane, S.; De Laurentiis, R.; Giordano, F. Coastline extraction from SAR images and a method for the evaluation of the coastline precision. Pattern Recognit. Lett. 2004, 25, 1461–1470. [Google Scholar] [CrossRef]
- Zhengang, M.; Lili, L.; Xuegong, X. Study on Land Use Change Patterns in Coastal Zone around Bohai Sea. Mar. Dev. Manag. 2019, 36, 38–43. (In Chinese) [Google Scholar]
- Fuqiang, L.; Tao, W.; Guojun, J.; Meng, X.; Liying, T.; Yong, Z.; Anning, S.; Lidong, Z. Dynamic Response of Coastal Line and Coastal Landscape Patterns to Human Disturbance: A Case Study of the Southern Coast of Yingkou City. Acta Ecol. Sin. 2017, 37, 7427–7437. (In Chinese) [Google Scholar]
- Meng, W.; Hu, B.; He, M.; Liu, B.; Mo, X.; Li, H.; Wang, Z.; Zhang, Y. Temporal-spatial variations and driving factors analysis of coastal reclamation in China. Estuar. Coast. Shelf Sci. 2017, 191, 39–49. [Google Scholar] [CrossRef]
- Sagar, S.; Roberts, D.; Bala, B.; Lymburner, L. Extracting the intertidal extent and topography of the Australian coastline from a 28 year time series of Landsat observations. Remote Sens. Environ. 2017, 195, 153–169. [Google Scholar] [CrossRef]
- Maglione, P. Coastline extraction using high resolution WorldView-2 satellite imagery. Eur. J. Remote Sens. 2014, 47, 685–699. [Google Scholar] [CrossRef]
- Wu, T.; Hou, X.; Xu, X. Spatio-temporal characteristics of the mainland coastline utilization degree over the last 70 years in China. Ocean Coast. Manag. 2014, 98, 150–157. [Google Scholar] [CrossRef]
- Kang, Y.; Ding, X.; Xu, F.; Zhang, C.; Ge, X. Topographic mapping on large-scale tidal flats with an iterative approach on the waterline method. Estuar. Coast. Shelf Sci. 2017, 190, 11–22. [Google Scholar] [CrossRef]
- De Vries, S.; Do, A.T.; Stive, M.J. Stive the Estimation and Evaluation of Shoreline Locations, Shoreline-Change Rates, and Coastal Volume Changes Derived from Landsat Images. J. Coast. Res. 2019, 35, 56. [Google Scholar] [CrossRef]
- White, S.A.; Wang, Y. Utilizing DEMs derived from LIDAR data to analyze morphologic change in the North Carolina coastline. Remote Sens. Environ. 2003, 85, 39–47. [Google Scholar] [CrossRef]
- Basheer Ahammed, K.K.; Pandey, A.C. Shoreline morphology changes along the Eastern Coast of India, Andhra Pradesh by using geospatial technology. J. Coast. Conserv. 2019, 23, 331–353. [Google Scholar] [CrossRef]
- Kuleli, T. Quantitative analysis of shoreline changes at the Mediterranean Coast in Turkey. Environ. Monit. Assess. 2010, 167, 387–397. [Google Scholar] [CrossRef] [PubMed]
- Nassar, K.; Mahmod, W.E.; Fath, H.; Masria, A.; Nadaoka, K.; Negm, A. Shoreline change detection using DSAS technique: Case of North Sinai coast, Egypt. Mar. Georesour. Geotechnol. 2019, 37, 81–95. [Google Scholar] [CrossRef]
- Ning, X.; Zhiqiang, G.; Jicai, N. Coastal Line Change and Cause Analysis in Bohai Rim Area Based on Fractal Dimension. J. Mar. Sci. 2016, 34, 45–51. (In Chinese) [Google Scholar]
- Liu, X.; Ma, J.; Xu, S.; Wang, B. On the generation of coastline-following grids for ocean models—trade-off between orthogonality and alignment to coastlines. Ocean Dyn. 2017, 67, 1095–1104. [Google Scholar] [CrossRef]
- Priya, R.; Sasi, M.; Radhakrishnan, V. Fractal Reflections of Tamil Nadu coast. Commun. Appl. Geom. 2016, 6, 1–9. [Google Scholar]
- Yao, H. Characterizing landuse changes in 1990–2010 in the coastal zone of Nantong, Jiangsu province, China. Ocean Coast. Manag. 2013, 71, 108–115. [Google Scholar] [CrossRef]
- Wu, X.; Liu, C.; Wu, G. Spatial-Temporal Analysis and Stability Investigation of Coastline Changes: A Case Study in Shenzhen, China. IEEE J. Sel. Top. Appl. Earth Obs. Remote Sens. 2017, 11, 45–56. [Google Scholar] [CrossRef]
- Liu, L.; Xu, W.; Yue, Q.; Teng, X.; Hu, H. Problems and countermeasures of coastline protection and utilization in China. Ocean Coast. Manag. 2018, 153, 124–130. [Google Scholar] [CrossRef]
- Hou, X.; Liu, J.; Song, Y.; Li, X. Eco-environmental Impact and Policy Suggestions on the Development and Utilization of Coastal Lines in China Mainland. Bull. Chin. Acad. Sci. 2016, 31, 1143–1150. (In Chinese) [Google Scholar] [CrossRef]
- Kaliraj, S.; Chandrasekar, N.; Ramachandran, K.; Srinivas, Y.; Saravanan, S. Coastal landuse and land cover change and transformations of Kanyakumari coast, India using remote sensing and GIS. Egypt. J. Remote Sens. Space Sci. 2017, 20, 169–185. [Google Scholar] [CrossRef]
- Domínguez-Tejo, E.; Metternicht, G.; Johnston, E.; Hedge, L. Marine Spatial Planning advancing the Ecosystem-Based Approach to coastal zone management: A review. Mar. Policy 2016, 72, 115–130. [Google Scholar] [CrossRef]
- Zhang, Y. Coastal environmental monitoring using remotely sensed data and GIS techniques in the Modern Yellow River delta, China. Environ. Monit. Assess. 2011, 179, 15–29. [Google Scholar] [CrossRef]
- Kumar, L.; Ghosh, M.K. Land cover change detection of Hatiya Island, Bangladesh, using remote sensing techniques. J. Appl. Remote Sens. 2012, 6, 063608. [Google Scholar] [CrossRef]
Figure 1.
Figure in the study area.

Figure 2.
The main coastline types of Yantai. (a) Silty boundary line, (b) Gravelly boundary line, (c) Bedrock boundary line, (d) Estuary boundary line, (e) Construction of coastline near sea. Protective engineering coastline, (f) Breeding boundary line, (g) Port and wharf boundary line.
Figure 2.
The main coastline types of Yantai. (a) Silty boundary line, (b) Gravelly boundary line, (c) Bedrock boundary line, (d) Estuary boundary line, (e) Construction of coastline near sea. Protective engineering coastline, (f) Breeding boundary line, (g) Port and wharf boundary line.

Figure 3.
Different images taken by an unmanned aerial vehicle (UAV).

Figure 4.
Change of coastline length in the study area from 1990 to 2018.

Figure 5.
Variation of first class coastline length in different regions from 1990 to 2018. (a) Change of coastline length in Laizhou, (b) Change of coastline length in Zhaoyuan, (c) Change of coastline length in Longkou, (d) Change of coastline length in Penglai, (e) Change of coastline length in Fushan, (f) Change of coastline length in Zhifu, (g) Change of coastline length in Laishan, (h) Change of coastline length in Muping, (i) Change of total length of coastline in study area.

Figure 6.
Variation of coastline length in different regions from 1990 to 2018.

Figure 7.
Coastline change rate in different regions from 1990 to 2018. (a) Change of coastline in Laizhou from 1990 to 2018, (b) Change of coastline in Zhaoyuan from 1990 to 2018, (c) Change of coastline in Longkou from 1990 to 2018, (d) Change of coastline in Penglai from 1990 to 2018, (e) Change of coastline in Fushan from 1990 to 2018, (f) Change of coastline in Zhifu from 1990 to 2018, (g) Change of coastline in Laishan from 1990 to 2018, (h) Change of coastline in Muping from 1990 to 2018.

Figure 8.
Fractal dimension change of coastline in the research area from 1990 to 2018.

Figure 9.
Surface cover map of coastal zone from 1990 to 2018.

Figure 10.
The relationship between the coastline length of different terrain types and artificial boundary lines. (a) The relationship between the length of the coastline bounded by structures and the length of the artificial boundary. (b) The relationship between the length of the coastline bounded by manually excavated land and the length of the artificial boundary. (c) The relationship between the length of the coastline bounded by roads and the length of the artificial boundary.


Table 1.
The coastline classification system of Yantai.
| The First Type | The Secondary Type | Classification Definition |
|---|---|---|
| Gravelly boundary line | The intertidal sediment of sandy coastline is mainly gravel, which is a relatively straight coastline formed by sediment such as sand and gravel under the long-term action of waves. | |
| Natural boundary line | Silty boundary line | A sea-land boundary consisting of silt or silty mudflat materials. |
| Bedrock boundary line | It is the demarcation line between land and sea on the bedrock coast. | |
| Breeding boundary line | A land-sea boundary constructed artificially for aquaculture. | |
| Salt field boundary | The sea-land dividing line for saline-alkali drying. | |
| Port and wharf boundary line | The demarcation line between land and sea for the functional use of port terminals. | |
| Artificial boundary line | Construction of coastline near the sea | The demarcation line between land and sea for the development of coastal industry and other construction purposes. |
| Road boundary line | The land-sea dividing line of the road constructed artificially. | |
| Protective engineering coastline | It refers to the boundary line formed by the tidal dikes, wave walls and slope protection structures built to prevent the erosion of sea waves and coastal currents and the invasion of natural disasters such as typhoons, cyclones, and cold waves and gales. | |
| Other artificial boundary lines | Artificial boundary lines that do not belong to the above classification. | |
| Estuary boundary line | The boundary between estuary and ocean, and between river and ocean. |
Table 2.
Classification system of coastal surface cover in Yantai.
| The First Type | Classification Definition |
|---|---|
| Cultivated land | Land reclaimed, cultivated and managed regularly. |
| Forests/gresses cover | It mainly includes mangroves, other woodlands, and grasslands. |
| Building areas | Including housing construction area, independent housing construction and abandoned housing construction. |
| Roads | It includes railways, highways, urban roads, and rural roads. |
| Structures | An engineering entity or ancillary building facility built for a purpose of use, in which production and living activities are not carried out directly within it(GB/T 50504-2009). Including hardened surface, industrial facilities, salt ponds, dykes, and other structures. |
| Manually excavated land | Ground surface covered by human waste or exposed by human excavation for a long time. |
| Desert/bare land | Desert and bare surface and low coverage grassland. |
| Waters | It refers to the spatial range of the water body’s growth and declines over a long period of time. |
Table 3.
Strength of coastline length change.
| Time Slot | Coastline Change Intensity/% |
|---|---|
| 1990–2000 | 0.84 |
| 2000–2010 | 1.13 |
| 2010–2015 | 3.47 |
| 2015–2018 | 0.39 |
| 1990–2018 | 1.54 |
Table 4.
The boundary length of the second class in each region in 2015 (km).
| Boundary Type | The Year of 2015 | |||||||
|---|---|---|---|---|---|---|---|---|
| Laizhou | Zhaoyuan | Longkou | Penglai | Fushan | Zhifu | Laishan | Muping | |
| Silty boundary line | 2.55 | - | - | 1.11 | 0.23 | - | - | 1.4 |
| Breeding boundary line | 64.72 | - | 12.17 | 26.11 | 9.16 | 4.56 | 2.48 | 0.6 |
| Other artificial boundary lines | 0.6 | 12.39 | 1.13 | 5.81 | 1.03 | 1.76 | - | 2.34 |
| Construction of coastline near sea | - | - | 48.67 | 13.19 | 11.42 | - | - | 5.06 |
| Gravelly boundary line | 19.6 | - | 30.14 | 15.41 | 17.96 | 16.16 | 9.44 | 28.65 |
| Bedrock boundary line | 3.42 | 1.11 | 1.18 | 2.45 | 2.39 | 24.79 | 2.45 | 11.07 |
| Estuary boundary line | 0.72 | - | 0.26 | 0.11 | 0.54 | - | 0.93 | 0.6 |
| Port and wharf boundary line | 17.51 | - | 15.7 | 9.28 | 5.43 | 22.72 | - | 1.18 |
| Protective engineering coastline | 36 | - | 23.22 | 17.84 | 9.88 | 11.42 | 3.1 | 2.44 |
| Road boundary line | 1 | - | 2.68 | 0.32 | 4.1 | 1.7 | 2.65 | 7.93 |
| Salt field boundary line | 16.07 | - | - | - | - | - | - | - |
| Total | 162.19 | 13.5 | 135.15 | 91.63 | 62.14 | 83.11 | 21.05 | 61.27 |
Table 5.
The boundary length of the second class in each region in 2018 (km).
| Boundary Type | The Year of 2018 | |||||||
|---|---|---|---|---|---|---|---|---|
| Laizhou | Zhaoyuan | Longkou | Penglai | Fushan | Zhifu | Laishan | Muping | |
| Silty boundary line | 2.6 | - | - | 1.11 | 0.23 | - | - | 1.4 |
| Breeding boundary line | 66.05 | - | 12.33 | 25.94 | 7.93 | 4.18 | 2.48 | 1.79 |
| Other artificial boundary lines | 0.48 | 12.32 | 1.14 | 5.23 | 1.08 | 0.43 | - | 1.6 |
| Construction of coastline near sea | - | - | 49 | 25.96 | 13.23 | 2.37 | - | 6.15 |
| Gravelly boundary line | 21.8 | - | 30.15 | 15.39 | 17.15 | 15.59 | 9.5 | 28.64 |
| Bedrock boundary line | 0.87 | 1.15 | 1.18 | 2.41 | 2.21 | 25.07 | 2.46 | 11.07 |
| Estuary boundary line | 0.71 | - | 0.26 | 0.11 | 0.54 | - | 0.86 | 0.57 |
| Port and wharf boundary line | 19.09 | - | 16.37 | 10.62 | 5.91 | 24.15 | - | 1.31 |
| Protective engineering coastline | 37.16 | - | 23.91 | 17.75 | 8.98 | 12.25 | 3.08 | 3.5 |
| Road boundary line | 1.06 | - | 2.34 | 0.32 | 5.35 | 1.71 | 2.81 | 12.14 |
| Salt field boundary line | 16.05 | - | - | - | - | - | - | - |
| Total | 165.87 | 13.47 | 136.68 | 104.84 | 62.61 | 85.75 | 21.19 | 68.17 |
Table 6.
The changes in surface coverage in the first-class coastal zones of different regions from 1990 to 2018.
Table 6.
The changes in surface coverage in the first-class coastal zones of different regions from 1990 to 2018.
| City | Areas Increased or Decreased in 1990-2018 (km2) | |||||||
|---|---|---|---|---|---|---|---|---|
| Roads | Building Areas | Desert/Bare Land | Forests/Gresses Cover | Cultivated Land | Structures | Manually Excavated Land | Waters | |
| Laizhou | 2.38 | −0.57 | −4.78 | 37.71 | −22.63 | 50.65 | 2.02 | −19.18 |
| Zhaoyuan | 0.84 | −1.42 | −3.01 | 1.28 | 1.36 | 1.33 | 0.33 | 0.00 |
| Longkou | 11.08 | −7.43 | −8.74 | 17.32 | −9.22 | 15.98 | 6.23 | 27.42 |
| Penglai | 5.20 | 5.54 | −48.46 | 2.90 | 32.52 | 8.87 | 4.75 | 1.04 |
| Fushan | 6.46 | 1.64 | −38.96 | 13.56 | 2.86 | 16.76 | 5.28 | −1.08 |
| Zhifu | 5.00 | −4.71 | 1.22 | 6.45 | −11.27 | 12.03 | 1.08 | −0.31 |
| Laishan | 4.02 | 2.52 | 2.78 | 8.45 | −9.98 | 3.69 | 1.27 | −2.71 |
| Muping | 4.61 | −1.44 | 7.67 | 8.41 | 0.16 | 3.64 | 1.99 | −17.50 |
| Total | 39.60 | -5.87 | -92.26 | 96.08 | -16.20 | 112.96 | 22.95 | −12.32 |
Table 7.
Transfer matrix of land types in the coastal zone of the research area from 1990 to 2018.
| Types of Objects | Cultivated Land | Waters | Manually Excavated Land | Forests/Grasses Cover | Desert/Bare Land | Structures | Building Areas | Roads |
|---|---|---|---|---|---|---|---|---|
| Cultivated land | - | 0.30 | 0.89 | 20.69 | 33.28 | 1.12 | 11.27 | 0.26 |
| Waters | 1.69 | - | 0.16 | 3.34 | 4.15 | 0.28 | 1.00 | 0.31 |
| Manually excavated land | 2.30 | 2.20 | - | 3.75 | 5.01 | 0.13 | 2.19 | 0.08 |
| Forests/gresses cover | 43.92 | 21.08 | 6.05 | - | 35.72 | 2.24 | 28.34 | 2.57 |
| Desert/bare land | 0.56 | 7.29 | 0.01 | 1.53 | - | 0.30 | 0.29 | 0.12 |
| Structures | 7.74 | 18.14 | 1.22 | 10.11 | 15.98 | - | 16.75 | 0.65 |
| Building areas | 14.88 | 3.98 | 6.04 | 15.59 | 18.44 | 1.96 | - | 0.48 |
| Roads | 6.73 | 2.64 | 1.14 | 7.90 | 6.36 | 0.80 | 9.84 | - |
© 2019 by the authors. Licensee MDPI, Basel, Switzerland. This article is an open access article distributed under the terms and conditions of the Creative Commons Attribution (CC BY) license (http://creativecommons.org/licenses/by/4.0/).
Share and Cite
MDPI and ACS Style
Zhou, M.; Wu, M.; Zhang, G.; Zhao, L.; Hou, X.; Yang, Y. Analysis of Coastal Zone Data of Northern Yantai Collected by Remote Sensing from 1990 to 2018. Appl. Sci. 2019, 9, 4466. https://doi.org/10.3390/app9204466
AMA Style
Zhou M, Wu M, Zhang G, Zhao L, Hou X, Yang Y. Analysis of Coastal Zone Data of Northern Yantai Collected by Remote Sensing from 1990 to 2018. Applied Sciences. 2019; 9(20):4466. https://doi.org/10.3390/app9204466
Chicago/Turabian StyleZhou, Min, Mengquan Wu, Guangzong Zhang, Lianjie Zhao, Xiaoyun Hou, and Yi Yang. 2019. "Analysis of Coastal Zone Data of Northern Yantai Collected by Remote Sensing from 1990 to 2018" Applied Sciences 9, no. 20: 4466. https://doi.org/10.3390/app9204466
Note that from the first issue of 2016, this journal uses article numbers instead of page numbers. See further details here.