Design and Research of a Color Discrimination Method for Polycrystalline Silicon Cells Based on Laser Detection System

1
School of Physics and Optoelectronic Engineering, Xidian University, Xi’An 710071, China
2
New Energy Department, Tianjin Sino-German University of Applied Sciences, Tianjin 300350, China
3
Basic Courses Department, Tianjin Sino-German University of Applied Sciences, Tianjin 300350, China
*
Author to whom correspondence should be addressed.
Appl. Sci. 2019, 9(20), 4468; https://doi.org/10.3390/app9204468
Submission received: 30 May 2019
/
Revised: 26 July 2019
/
Accepted: 2 August 2019
/
Published: 22 October 2019
(This article belongs to the Special Issue Next Generation Solar Cells, Modules and Applications)
Abstract
:Featured Application
The system described in this paper can automatically distinguish polycrystalline silicon cells in the process of color sorting. It can also be used in floor board sorting with similar color, coffee beans sorting with quality judged by color, etc. which need color sorting.
Abstract
In this paper, a method of color discrimination based on sample sensitivity to light wavelength is proposed based on the reflection spectra of a large number of samples and the statistical calculation of the measurement data. A laser detection system is designed to realize the color discrimination. For the color discrimination of polycrystalline silicon cells, the most sensitive wavelength, 434 nm, and the least sensitive wavelength, 645 nm, of polycrystalline silicon cells is obtained according to this method. A laser detection system was built to measure the polycrystalline silicon cells. This system consists of two lasers, optical shutters, collimating beam expanding systems, an optical coaxial system, sample platform, collecting lens, and optical power meter or optical sensor. Two laser beams of different wavelengths are beamed coaxially through the optical coaxial system onto a polycrystalline silicon cell and are reflected or scattered. The reflected or scattered lights are collected through a lens with a high number aperture and received separately by the optical power meter. Then the color value of the polycrystalline silicon cell in this system is characterized by the ratio of light intensity data received. The system measured a large number of previous polycrystalline silicon cells to form the different color categories of polycrystalline silicon cells of this system in the computer database. When a new polycrystalline silicon cell is measured, the color discrimination system can automatically classify the new polycrystalline silicon cell to a certain color category in order to achieve color discrimination.
1. Introduction
1.1. Origin and Development of Color Discrimination
Newton, the great English scientist, was famous for his laws of motion. Newton’s forgotten great feat was to decompose the spectrum of the sun through a prism [1], which opened up the knowledge and recognition of color. Currently, there are three methods for the color discrimination of objects, namely the ocular estimate method, the color discrimination system based on imaging technology, and the color discrimination system based on spectral technology.
The ocular estimate method is a traditional method of color discrimination. The specific method is that standard chromaticity observers visually identify objects under specific lighting conditions and compare them with the CIE (Commission Internationale de L’Eclairage) standard chromaticity diagram to obtain color parameters. The research on the chromaticity diagram dates back to as early as the beginning of the 20th century when W Ostwald [2] proposed the color system of the same name. Subsequently, many color systems were developed, including the CIE standard chromaticity diagram [3] that has been widely used since 1931. But the main problem with the ocular estimate method is that it relies entirely on the human eye to recognize color differences. This is a drain on the human eyes, and recognition results are affected by individual differences and fatigue. In 1839, Gaidar invented the camera, which laid the foundation for color discrimination system based on imaging technology. This method mainly analyzes object color based on imaging photos, and the analysis principle is mainly based on RGB color model. A color image of a number of objects in an unknown light condition that automatically computes a certain transformation in order to obtain the color parameters of each object in the scene under a certain standard or known light. The color discrimination system based on spectral technology obtains the color parameters by analyzing and converting the reflectance spectral information of the object under different wavelengths of illumination.
1.2. Current Color Discrimination System
The research on the color discrimination system has been going on since the beginning of last century. With the continuous demand for color recognition technology in various fields, many scientists reignited the research on this issue at the end of the last century, which involves the improvement of theories and the application of technology in different fields. Gray [4] has proposed a U.S. patent for the invention of sorting samples of different colors using dual frequency optical detectors, but the color characteristics of the samples were not considered. Saranathan et al. [5] proposed that the color of butterfly wings is produced not by pigment but by structural light, which is a new situation for color discrimination. Mirghasemi et al. [6] analyzed sea targets based on RGB color Spaces. The color components of the target and non-target pixels in the RGB color space are used as features to train the classification algorithm. Tsai et al. [7] recognized the locations of the ball and the robot in a robotic soccer competition through a color discrimination method based on HSL space. Perales et al. [8] found that suitable spectral optimization could clearly enhance the vision of color deficient by comparing the Rosch-MacAdam color volume for color-deficient observers rendered by three of these singular spectra. Martínez-Harms et al. [9] revealed the occurrence of peak shift in the color vision of honeybees and indicated that honeybees can learn color stimuli in relational terms based on chromatic perceptual differences. Souza et al. [10] used the Cambridge Color Test (CCT) to investigate the influence on color discrimination thresholds due to the number of luminance levels present in the luminance noise. Jurasevska et al. [11] reported the classification ability for the deficiency type and severity level of human eyes. Madani et al. [12] proposed a technique to recognize the traffic sign based on its border color, shape, and pictogram information. Jansen-Van Vuuren et al. [13] introduced the characteristics and development of organic photodiodes, widely used image sensors for existing imaging technologies. Zhang et al. [14] proposed a novel saliency detection model using both color and texture features and incorporating higher-level priors, and calculated color saliency map and texture saliency map based on the region contrast method and adaptive weight. Pujol et al. [15] proposed a fuzzy system for detecting skin in color images to realize automated face recognition. Hoshino et al. [16] designed a detection algorithm to capture subtle differences in colors through a free iPhone application to identify acholic stools in infants with biliary atresia.
1.3. Brief of the Existing Technology and This Work
Through the analysis of the existing methods, it can be found that the color discrimination systems based on imaging technology and spectral technology is relatively mature. But when the surface color difference is small or the surface condition is complex, such as the surface irregularity, colors too close to each other, or color differences caused by the optical structure, both the color discrimination systems based on imaging technology and spectral technology will appear to be in error. Among them, the color discrimination system based on imaging technology has difficulty detecting the color differences caused by the optical structure. When the light intensity of the lighting source is unstable, the result of color discrimination will be seriously affected. It is difficult to solve the error problem caused by surface irregularity and too close color by the color discrimination system based on spectral technology.
Therefore, it is very promising to construct a modified color discrimination system that can solve complex problems. This paper proposes a color discrimination method based on laser detection system modified by ocular estimate method. The system can solve the problem of color discrimination of the surface irregularity, color too close to each other or color differences caused by optical structure, so as to achieve more accurate color discrimination which is widely used in industrial production and daily life and meets the needs.
The color discrimination system proposed in this paper consists of three parts. Firstly, the sensitive wavelength and insensitive wavelength of the samples are calculated by statistical method according to the reflection spectrum. Then, the corresponding wavelength laser detection system is built according to the calculation results. Finally, the same color interval is demarcated for the tested color information according to the color categories classified by ocular estimate method.
2. Method for Color Analysis of Objects with Complex Surface Conditions
2.1. The Selection of Samples and Their Conditions
When the surface color of the object is too close, it is often necessary to use the ocular estimate method to classify the same surface color of the objects into a category in industrial production. According to different color objects will be classify into several categories of similar color to ensure the overall aesthetics of the same category of objects in subsequent production. For example, the production of a polycrystalline silicon photovoltaic module requires many polycrystalline silicon cells with the same color in the field of photovoltaic manufacturing.
In the production of polycrystalline silicon cells, the surface of a polycrystalline silicon cell is irregular due to its polycrystalline properties. At the same time, due to the continuity of production, the thickness of its anti-reflection film cannot be controlled, which leads to the color differences of the cells surface, and the color differences from light blue to deep blue. This leads to the problem of color differences between cells in the same module in the production of photovoltaic modules, which greatly affects the integrity and aesthetics of polycrystalline silicon photovoltaic modules, and fails to meet the use requirements of landmark photovoltaic facilities, integration of photovoltaic buildings and other systems, and fails to meet the product requirements of high-end customers.
Before making polycrystalline silicon cells into modules, a special production process is generally added, namely, color sorting of polycrystalline silicon cells. This process is done manually, which the workers identify the color difference of polycrystalline silicon cells by ocular estimate method on the basis of the color standard chip. There are four major problems with the existing process. First, different people’s eyes perceive color differently, which may lead to errors in sorting. Second, after a lot of heavy color sorting, workers’ eyes will gradually suffer from fatigue damage, which will aggravate human eye recognition errors. Third, the change of the light source in the workplace and other external factors can also lead to sorting errors. What’s more, the color sorting process itself has no excessive technical requirements on workers and wastes a lot of unnecessary manpower. Therefore, it is very important to analyze the color of polycrystalline silicon cells and find a way to automatically distinguish the color of polycrystalline silicon cells. So polycrystalline silicon cells will be sampled to analyze the color discrimination method in this paper.
Polycrystalline silicon cell production of Yingli Green Energy Holding Co., Ltd. is taken as an example. Polycrystalline silicon cells are classified into five categories roughly according to different colors by workers in the factory. From the lightest blue to the deepest blue, these five categories are generally named as LL, LQ, LZ, LS and R6, as shown in Figure 1. How does this color difference come about? There are two reasons for the difference in principle. First, we know that monocrystalline silicon cells do not have this color difference. The main difference between monocrystalline silicon cell and polycrystalline silicon cell is whether the crystal orientation of the entire cell is consistent. The crystal orientation of monocrystalline silicon cell is completely consistent, while polycrystalline silicon cell is composed of many small monocrystalline silicon grains, which are not consistent. So, the surface of a polycrystalline silicon cell is irregularity, unlike the consistent pyramid structure of a monocrystalline silicon cell (since silicon is a face-centered cubic crystal). The irregular surface of a polycrystalline silicon is one of the reasons for the color difference. Then, the surface of the cell shall be coated with a silicon nitride film by PECVD (plasma enhanced chemical vapor deposition) method, and the thickness of the film will also affect the color difference of the polycrystalline silicon cell. If the thickness of each polycrystalline silicon cell film is the same, the polycrystalline silicon cell color difference will be very small. However, the thickness of each polycrystalline silicon cell film cannot be guaranteed in the practical continuous production. Variations in thickness are the other reason for the color difference. Therefore, it is very significant to realize the color discrimination of polycrystalline silicon cells through a method after the production of cells.
2.2. Method of Samples Color Discrimination
The method of sample color discrimination is to find out how sensitive the sample is to different wavelengths of light based on the reflection spectrum of a large number of samples using statistical principles. Firstly, we classified a large number of samples into n color categories (n = 5 for polycrystalline silicon cell) by ocular estimate method, and there were m samples in each category. The surface reflectance spectra of a large number of samples that have been classified by ocular estimate method are then measured. The measurement is realized by spectrophotometer, and the wavelength recognition of human eyes is selected as the range of the spectral measurement, which is the visible—near infrared band. The surface reflection spectra of a large number of samples will be obtained:
where is the surface reflection spectrum of each sample, which contains the reflectivity of each wavelength in the visible—near infrared band. The sensitivity of all samples to different wavelengths of light can be obtained by analyzing spectral information by the statistical method. Firstly, , the standard deviation of the reflectivity of all samples corresponding to each wavelength can be calculated by comparing the reflectivity of all samples corresponding to each wavelength. Then, by comparing the standard deviations corresponding to different wavelengths, , the maximum value and , the minimum value of the standard deviations of reflectivity corresponding to different wavelengths values can be obtained. Where, means that the reflectivity of all samples is large at wavelength , which these samples are most sensitive to light at wavelength . means that the reflectivity of all samples is small at wavelength , which these samples are the least sensitive to light at wavelength . The color value of any sample in all samples is defined as:
where k represents which sample is in all the samples. is determined by the ratio of the reflectivity of the sample at its most sensitive wavelength to that at its least sensitive wavelength , so as to realize the normalization of the color information of the sample. Then the color normalization value of all samples can be obtained:
where to is the first color category, to is the second color category, and so on, to is the NTH color category. According to the color normalization values of all samples and the color categories recognized by human eyes, the intervals of the color normalization values of all samples and the color categories can be demarcated.
2.3. Concrete Analysis of the Polycrystalline Silicon Cells
According to the above method, the visible near-infrared reflection spectrum of the 400 cells that have been sorted by ocular estimate method of LL, LQ, LZ, LS and R6 is measured, and the wavelength range is from 400 nm to 800 nm. Each of the 80 cells is a color category, and there is a total of 400 cells in five color categories. The corresponding reflection spectra of all the samples are shown in Figure 2. As can be seen from the Figure 2, the five subgraphs from left to right correspond to the reflection spectra of the samples in the five color categories of LL, LQ, LZ, LS and R6, respectively. There are obvious differences in the reflection spectra of different color categories.
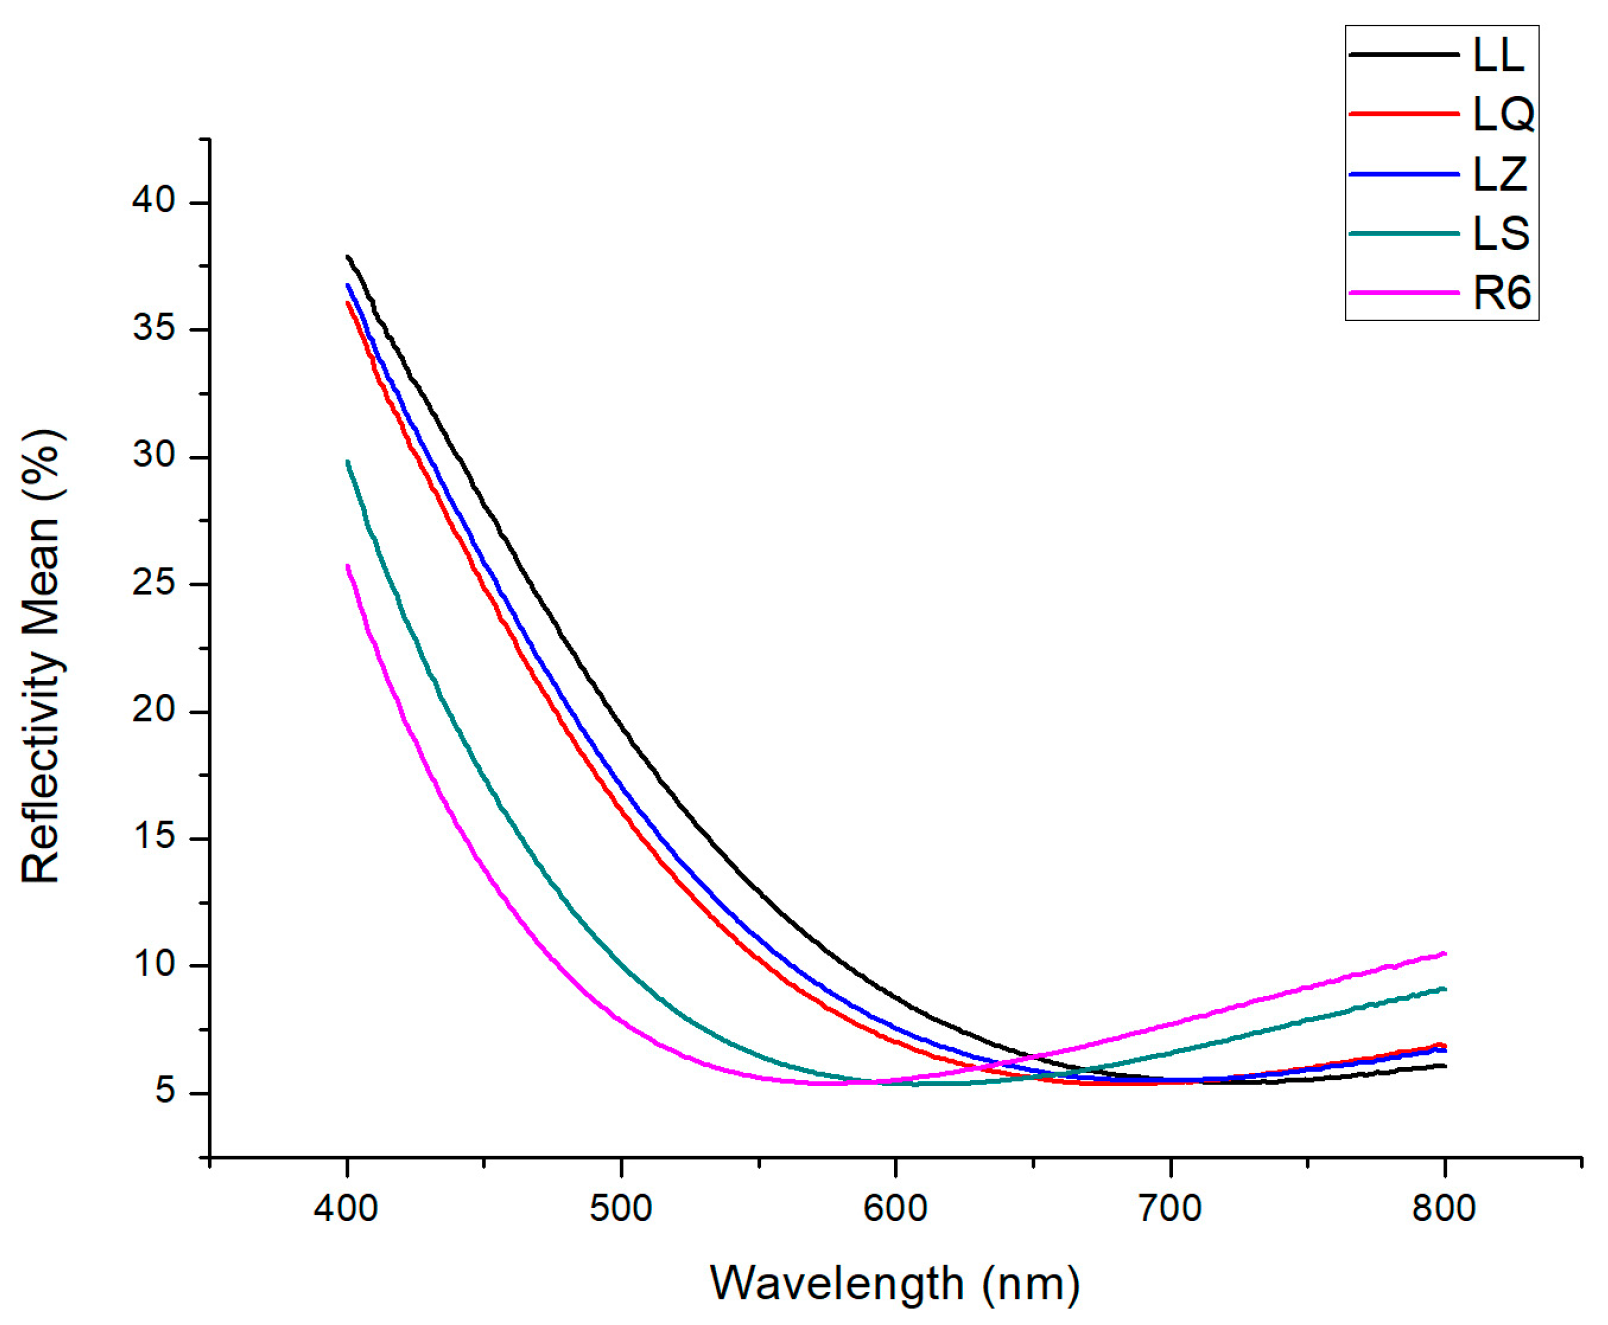
Five curves can be obtained by calculating the average values of the reflection spectra of 80 cells of each color category as shown in Figure 3, which represents the changes of the reflection spectra in five color categories. It can be seen from Figure 3 that the monotony of the reflection spectra is good before the wavelength of 645 nm, and the monotony is unstable after the wavelength of 645 nm. The average value of the reflection spectra of each color category at the wavelength of 645 nm is basically the same, which indicates that the wavelength of 645 nm may be an insensitive band for each color category of cells.
According to the reflection spectra of 400 cells, the standard deviation curve of the reflectivity change of all cells at different wavelengths is calculated using the method described above and shown in Figure 4. Meanwhile, according to the average value of reflection spectra of each color category, the standard deviation curve of five average values are calculated, as shown in Figure 5. It was found that the two curves are almost the same. The points with the smallest standard deviation on the two curves are all at the wavelength of 645 nm, while the points with the largest standard deviation are all at the wavelength of 434 nm. As can be seen from the curve in Figure 4, , the maximum standard deviation of reflectivity of all cells is obtained at the wavelength of 434 nm, and , the minimum standard deviation of reflectivity of all cells is obtained the wavelength of at 645 nm, indicating that the reflectivity of cells with different colors varied greatly at the wavelength of 434 nm, while that of cells with different colors varied little at the wavelength of 645 nm. This means that the light at the wavelength of 645 nm is the least sensitive and the light at the wavelength of 434 nm light is the most sensitive either for the average of each color category or for all cells.
Then, the color value of any cell can be described by the ratio of the reflectivity of the cell at the wavelength 434 nm to the reflectivity of the cell at the wavelength 645 nm wavelength:
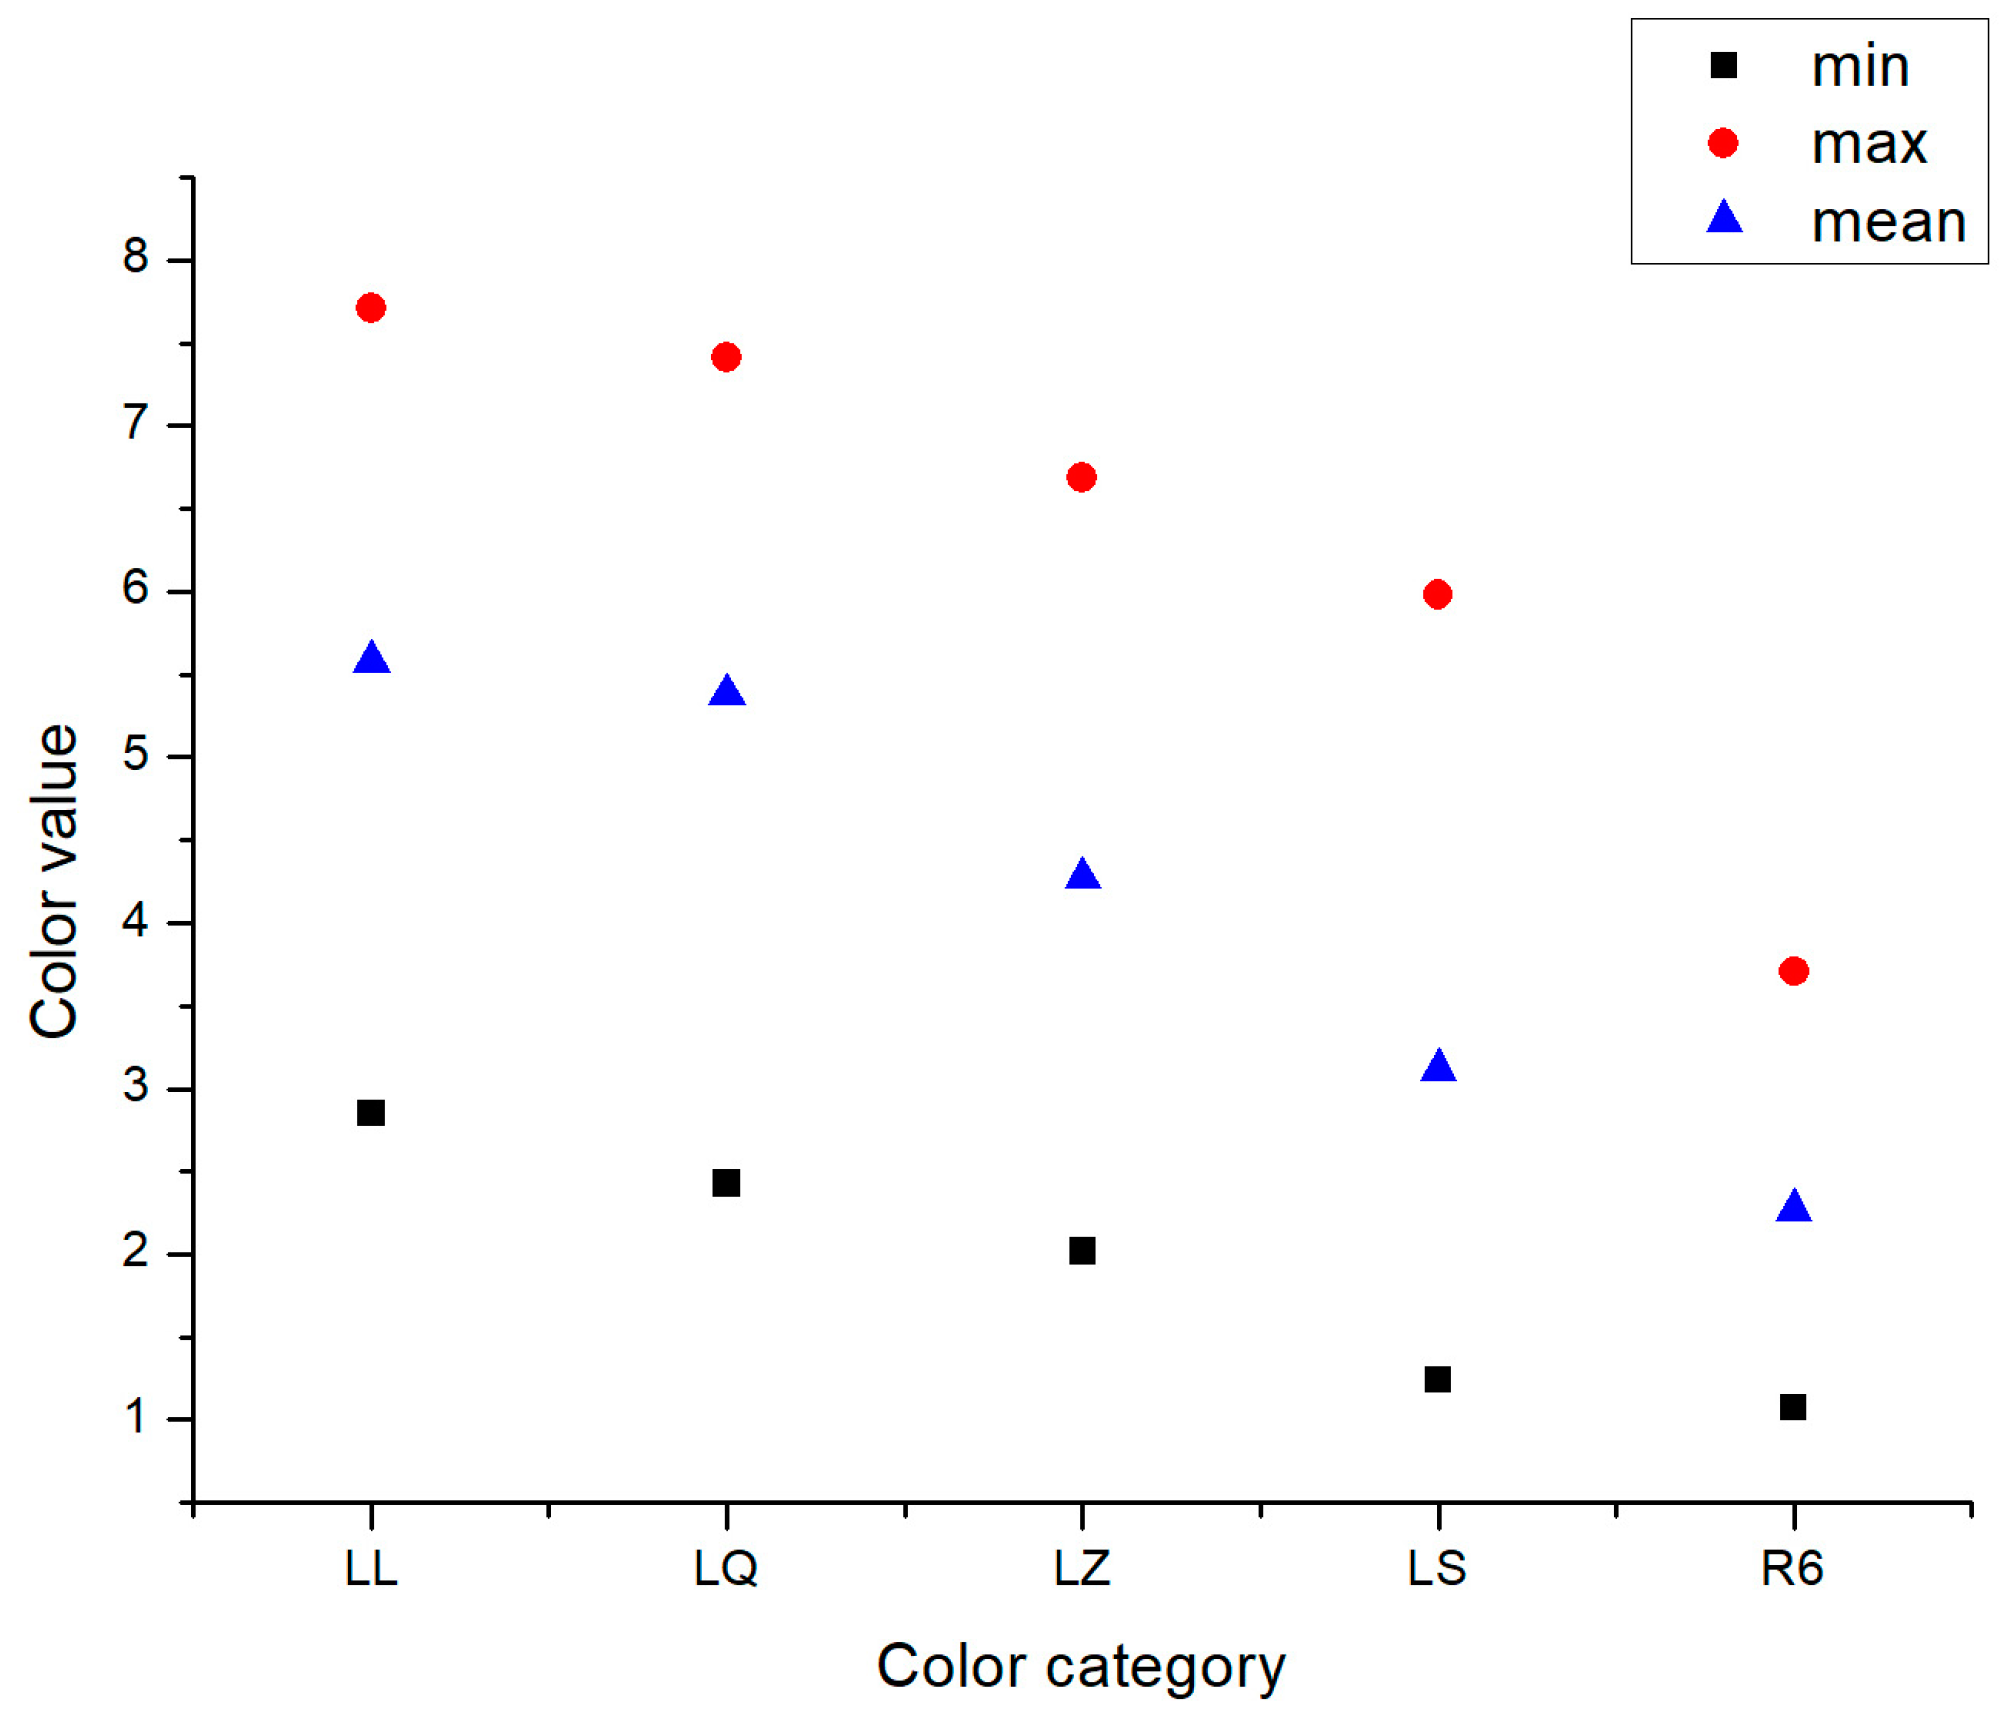
The color value of 400 cells can be obtained from the above formula. The distribution of color values of each cell in each color category is shown in Figure 6. Each of the different little icons in Figure 6 represents the color value of a cell. The difference in these symbols simply means that they are different cell samples, with no other meaning. It can be found that the color value of the cell overlaps in different color categories, but each color category has its own color value range. The maximum, minimum and average color values of each color category of cells are shown in Figure 7, where the square icon represents the minimum value, the circle icon represents the maximum value, and the triangle icon represents the average value. It can be found that the maximum, minimum, and average color values of each color category of cells are completely different in different color categories. The overlap of the color value ranges and the close of the maximum, minimum and average color value in different color categories may be caused by the irregular surface of the cells and the errors using ocular estimate method. Therefore, laser detection systems with higher accuracy can be built based on the most sensitive and least sensitive wavelengths of light corresponding to these cells.
3. Design and Construction of Laser Detection System
According to the measurement experiment of the reflection spectra and statistical analysis of the data, the values of the most sensitive wavelength and least sensitive wavelength of all cells are determined, and then a laser detection system can be built for measure the color of polycrystalline silicon cells. The system is composed of an optical laser for measurement with the central wavelength , an optical laser for reference with the central wavelength , two optical shutters, two collimating beam expanding systems, an optical coaxial system, a sample platform for the polycrystalline silicon cell, a collecting lens, and an optical power meter or optical sensor, as shown in Figure 8.
The generally chosen optical lasers for measurement and for reference of this system are either a solid-state or semiconductor laser with a small volume and easy adjustment. Two laser beams from optical laser for measurement and for reference pass through two optical shutters, two optical filters, and two collimating beam expanding systems respectively to realize the switch control, light filter, aberration correction, collimation and expansion of the beams. The collimating beam expanding system is realized by a pair of convex lenses with different focal lengths. The purpose of beam expanding is to increase the spot size of the laser beams to fit the surface size of the sample. The optical axis coincidence of two laser beams after collimation and expansion is realized in the optical coaxial system. The optical coaxial system is composed of a specially coated reflection mirror, which has full transmission effect on the optical laser for reference and total reflection effect on the optical laser for measurement. By adjusting the positions of the optical elements on the optical path, the optical laser for reference and for measurement can be adjusted to the same optical axis, so as to ensure the incident of two laser beams to the same position of the sample surface, so as to reduce the errors caused by the irregular surface of the sample. Two laser beams on the same optical axis incident on the sample platform are reflected or scattered due to the condition of the sample surface. For the irregular surface of a polycrystalline silicon cell, scattering generally occurs. Reflected or scattered light is collected through a lens with a high numerical aperture and received by optical power meter or optical sensor. The wavelength range of the optical power meter or optical sensor needs to match the wavelengths of the optical beams both for measurement and for the reference. When scattering occurs, the position of collecting lens and optical power meter is placed in the area with strong scattered light according to the scattering situation of the sample surface. When the sample is actually detected, the results of the optical beams for measurement and for reference exposure to the sample can be obtained respectively by controlling the light shutter.
4. Results Prediction, Measurement, Analysis and Determination of Color Interval
4.1. Results Prediction
By receiving the reflected or scattered light through the light power meter, the receiving light intensity of the laser beam for measurement and the receiving light intensity of the laser beam for reference of the sample can be obtained by receiving the reflected or scattered light through the light power meter. The ratio of the receiving light intensity of the laser beam for measurement to the receiving light intensity of the laser beam for reference is defined as the color value of the sample in the laser detection system . The color values of all samples in the system can be obtained:
where to is the first color category, to is the second color category, and so on, to is the NTH color category. According to the classification and color interval of all color categories of the samples sorted by ocular estimate method, the color interval of the different color categories in this system can be determined. All the color values and color intervals of the system are transmitted to the computer to form a database. When measuring a new sample, the computer program can calculate the color value of this system according to the measured receiving light intensity of the laser beam for measurement and the receiving light intensity of the laser beam for reference , and put it into the database for comparison, so as to classified the color value of the new sample into a certain color interval. In this way, the computer can determine which color category the color value of the new sample belongs to, so as to realize the automatic color discrimination of the new sample.
4.2. Results Measurement, Analysis and Determination of Color Interval
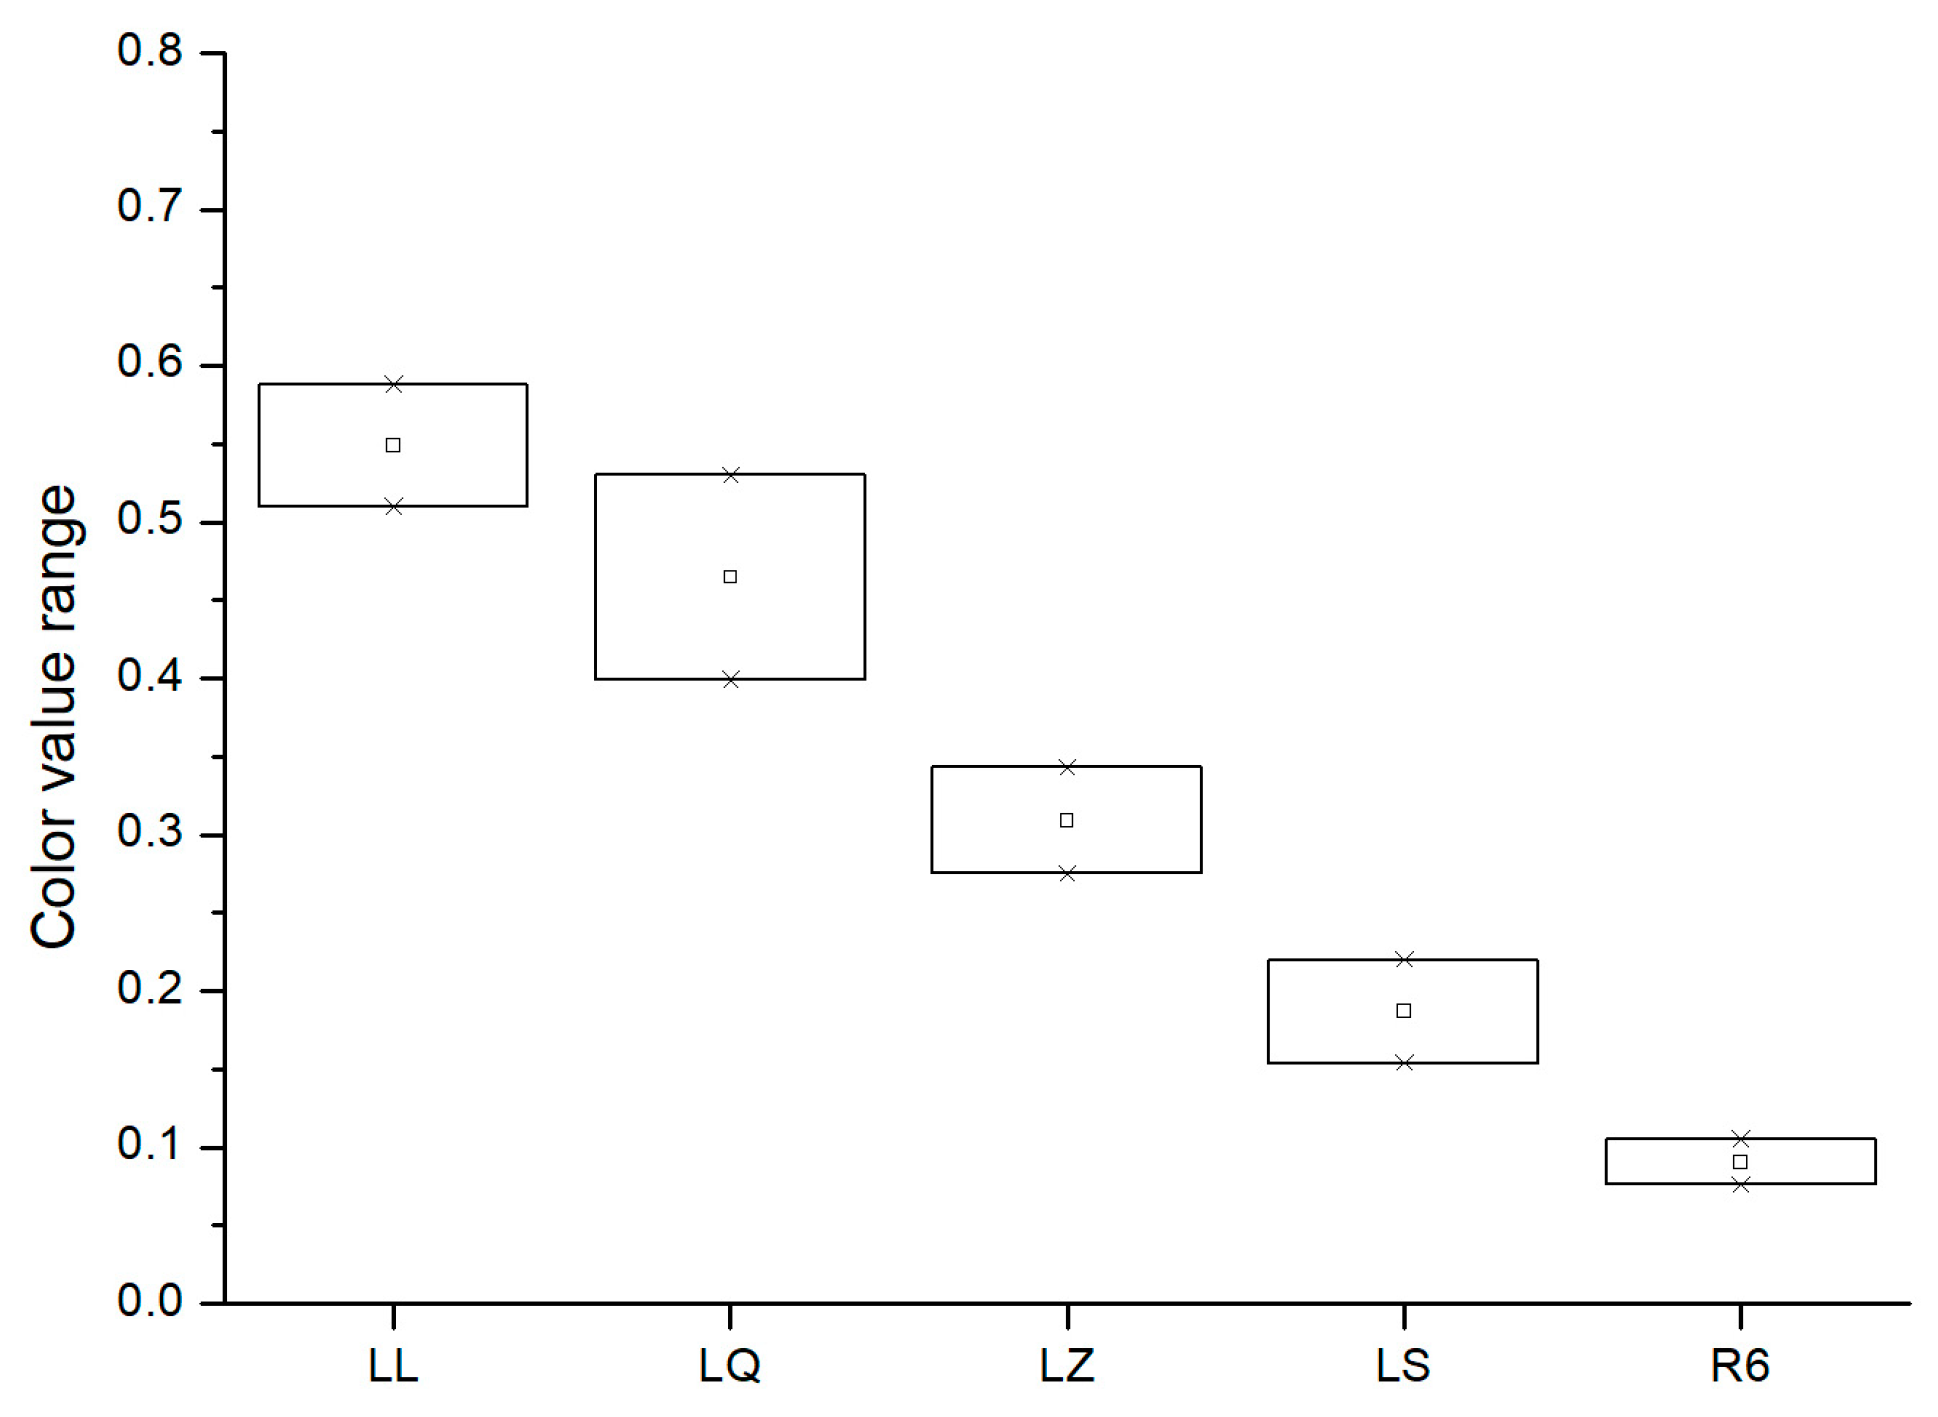
The actual laser detection system uses the blue laser with the central wavelength of 434 nm for measurement according to the most sensitive wavelength of the polycrystalline silicon cell, and the red laser with the central wavelength of 645 nm for reference according to the least sensitive wavelength value of the polycrystalline silicon cell. The actual laser detection system for polycrystalline silicon cells is constructed according to Figure 8. Using this system, the polycrystalline silicon cells which have been classified by ocular estimate method are measured, the receiving light intensities for measurement and for reference of the polycrystalline silicon cells are obtained, and the color values of the polycrystalline silicon cells in this system is calculated. Then, according to the range of the same color determined by the previous color normalization values, the range of the same color of this system is determined to form the color category intervals of the existing color discrimination system. The five color categories intervals of the polycrystalline silicon cells in the existing laser detection system are shown in Figure 9. In Figure 9, the horizontal coordinate represents five color categories, and the vertical coordinate represents the color value in the laser detection system. The top and bottom of the rectangle of each color category correspond to the color value interval of each color category.
When a new polycrystalline silicon cell is measured, the laser detection system can transmit the result to the computer, which can automatically distinguish the color of the polycrystalline silicon cell according to the color categories intervals in Figure 9.
5. Discussion
The possible errors in the measurement of the system come from two aspects. One is that the laser for measurement is not coaxially aligned with the laser for reference, which causes different positions of the polycrystalline silicon cell to be irradiated by two lasers. The scattered light from two lasers collected by the lens is not irradiated to the same position (the position of the optical power meter). This error can be eliminated by adjusting the optical path more accurately to ensure that the laser for measurement is coaxially aligned with the laser for reference. The other is the measurement error caused by vibration of the sample platform. According to the measurement results, it is found that the error caused by the vibration is very low, and the influence can be ignored in the color classification.
On the basis of the system, an automatic sorting link can be added after color discrimination. According to the results of color discrimination, the manipulator or the cylinder can be controlled to complete the automatic color sorting of polycrystalline silicon cells. The sorting system can be connected with the existing automatic polycrystalline silicon cell production line, which can realize the fully automatic process of polycrystalline silicon cell production and sorting.
Since the algorithm of the detection system does not require complex mathematical calculation, the delay of the detection system is mainly determined by two parts: the response time of the optical power meter and the mechanical response time of the optical shutter, both of which are in the order of milliseconds. The selection of these two devices can be determined according to the sorting time after the manipulator obtains the classification results in the sorting process. When the manipulator sorts a sample, the next sample is in the detection system. Because the time of sorting samples by the manipulator is in the order of seconds, the delay of the detection system can be ignored in practical application.
The automatic sorting equipment based on this system can greatly improve the efficiency of color sorting of polycrystalline silicon cells in factories. For a skilled technical worker, he can sort one cell every three seconds during his eight-hour working day. By this calculation, he can finish the color sorting of almost 10,000 cells every day. While the sorting speed of the manipulator is generally 1~1.5 s for one cell. The automatic sorting equipment can work continuously for 24 h per day, completing the color sorting of nearly 60,000 cells. Therefore, the use of this equipment can realize the automatic process of color sorting of polycrystalline silicon cells, greatly improve the work efficiency and reduce the labor cost.
Compared with previous works (such as Ref. [2,3,4,6,7,14]), the method proposed by this research has great advantages. An external light source is needed for the color discrimination system based on the ocular estimate method and imaging technology. Therefore, when used in large factories, the external light source wastes a large amount of electric energy, which represents a burden of energy consumption for factories. Then the production of the factory is unlike the laboratory environment, so the stability of external light source cannot be ensured. The quality of external light source will be affected by the working state of other electrical appliances in the factory, which will lead to errors in color discrimination. These errors cannot be avoided in the factory. The method proposed in this study directly uses two monochromatic laser beams of special wavelengths for detection, without the need of external light source. Moreover, this study uses the difference method of to normalize the color value, which can effectively eliminate the error caused by unstable light sources. For the samples targeted in this study, the surface of polycrystalline silicon cells is irregular. There will be errors in color discrimination of the cells at different angles. The results of irradiation of the cells by non-directional light are random. The system proposed in this study makes use of the directional propagation characteristics of the laser and adopts the coaxial method of two laser beams so that two beams are equally irradiated on the cell in space, which can solve the problem of the irregular surface of a polycrystalline silicon cell. The determination of the color interval of the system proposed in this study is completed before the actual measurement, so there is no delay caused by complex calculations.
6. Conclusions
In this paper, a method of color discrimination based on sample sensitivity to light wavelength is proposed, and a laser detection system is designed to realize the color discrimination. For the color discrimination of polycrystalline silicon cells, according to the measured reflection spectra of a large number of polycrystalline silicon cells and the statistical calculation of the measurement data, the most sensitive wavelength, 434 nm, and the least sensitive wavelength, 645 nm, of polycrystalline silicon cells is obtained.
Then a laser detection system was built to measure the samples. This system consists of two lasers, optical shutters, collimating beam expanding systems, an optical coaxial system, sample platform, collecting lens, and optical power meter or optical sensor. The wavelengths of the two lasers are respectively 434 nm (the most sensitive wavelength of polycrystalline silicon cell) and 645 nm (the least sensitive wavelength of polycrystalline silicon cell). Two laser beams of different wavelengths are beamed coaxially through the optical coaxial system onto a polycrystalline silicon cell and are reflected or scattered. The reflected or scattered light is collected through a lens with a high number aperture and received separately by the optical power meter.
Then, the color value of the polycrystalline silicon cell in this system is characterized by the ratio of light intensity data received. Finally, the system measured a large number of previous polycrystalline silicon cells to form the different color categories intervals of polycrystalline silicon cell of this system in the computer database. When a new polycrystalline silicon cell is measured, the color discrimination system can automatically classify the new polycrystalline silicon cell to a certain color category according to the measured color value of the cell and the color categories intervals of polycrystalline silicon cell, to achieve color discrimination.
Described in this paper, the method and its corresponding system can better solve the problem of complex circumstance of color discrimination. The normalized color value improves the accuracy of the color value, which is not affected by the external light source and the unstable power of the detection laser. The irregularity of sample surface is solved by the coincident axis irradiation of laser. The acquisition of sensitive wavelength and insensitive wavelength makes the similar color can be discrimination problem can be accurately resolved.
The method proposed in this study is a laser detection system based on the spectral information of samples. Similarly, in indoor decoration, the wooden floor boards of the same house often need to be of the same color before being laid. Thus, colour discrimination is necessary between, say, shallow yellow and deep yellow. This problem also can rely on the method proposed in this study for resolution. However, it is necessary to change the wavelength of the light for measurement and for reference, the size of the laser spot, the numerical aperture of the collecting lens, and the spectral range of the optical power meter. For the long floor board, the two-dimensional electronic translation unit can be installed on the back side of the sample platform. The color information can be obtained by scanning the floor board, and the color classification can be carried out according to the above method. Similarly, in the sorting of coffee beans, seeds, and other materials, the quality of coffee beans and seeds is judged by the difference in color. The color classification corresponding to their quality can also be realized by relying on the method proposed in this study, but it also needs to change the wavelength of the light, the size of the laser spot, the numerical aperture of the collecting lens, and the spectral range of the optical power meter.
Therefore, how to apply the method proposed in this paper to color discrimination and color recognition in agriculture, industry, and daily life remain problems to be further studied.
7. Patents
The research content involved in this paper has been applied for China Invention Patent No. 201910429566.9.
Author Contributions
Z.C. covered all the research of this study. Z.C. designed the color discrimination method and laser detection system. Z.C. and S.W. wrote the paper and finished the experimental research. L.Z. collected and analyzed the experimental data. Z.C. and Z.M. revised the paper. All authors have made great efforts in this research work.
Funding
This research was supported by the Research Project of Tianjin Municipal Education Commission 2017KJ043; Tianjin Technical Expert Project under grant 19JCTPJC42700; University-level research project of Tianjin Sino-German University of Applied Sciences under grants zdkt2016-015 and zdkt2018-001; Fundamental Research Funds for the Central Universities and Innovation Fund of Xidian University.
Acknowledgments
The authors acknowledge help from their institutions and much support from Nankai University and Yingli Green Energy Holding Co., Ltd. The measurement of reflection spectra is provided by Nankai University. And the polycrystalline silicon cells are provided by Yingli Green Energy Holding Co., Ltd.
Conflicts of Interest
The authors declare no conflict of interest.
References
- Newton, I. Opticks, 4th ed.; Royal Society: London, UK, 1704. [Google Scholar]
- Foss, C.E.; Nickerson, D.; Granville, W.C. Analysis of the Ostwald Color System. J. Opt. Soc. Am. 1944, 34, 361–381. [Google Scholar] [CrossRef]
- Fairman, H.S.; Brill, M.H.; Hemmendinger, H. How the CIE 1931 color-matching functions were derived from Wright-Guild data. Color Res. Appl. 1997, 22, 11–23. [Google Scholar] [CrossRef]
- Gray, C.G.; Pawley, J.S. Sorting Machine using Dual Frequency Optical Detectors. U.S. Patent 5,631,460, 20 May 1997. [Google Scholar]
- Saranathan, V.; Leggett, A. Structure, function, and self-assembly of single network gyroid (I4132) photonic crystals in butterfly wing scales. Proc. Natl. Acad. Sci. USA 2010, 107, 11676–11681. [Google Scholar] [CrossRef] [PubMed]
- Mirghasemi, S.; Yazdi, H.S.; Lotfizad, M.A. Target-based color space for sea target detection. Appl. Intell. 2012, 36, 960–978. [Google Scholar] [CrossRef]
- Tsai, S.H.; Tseng, Y.H. A novel color detection method based on HSL color space for robotic soccer competition. Comput. Math. Appl. 2012, 64, 1291–1300. [Google Scholar] [CrossRef] [Green Version]
- Perales, E.; Linhares, J.M.; Masuda, O.; Martínez-Verdú, F.M.; Nascimento, S.M. Effects of high-color-discrimination capability spectra on color-deficient vision. J. Opt. Soc. Am. A Opt. Image Sci. Vis. 2013, 30, 1780–1786. [Google Scholar] [CrossRef] [PubMed] [Green Version]
- Martínez-harms, J.; Márquez, N.; Menzel, R.; Vorobyev, M. Visual generalization in honeybees: Evidence of peak shift in color discrimination. J. Comp. Physiol. A 2014, 200, 317–325. [Google Scholar] [CrossRef] [PubMed]
- Souza, G.S.; Malone, F.L.; Crawford, T.L.; Miquilini, L.; Salomão, R.C.; Guimarães, D.L.; Ventura, D.F.; Fitzgerald, M.E.; Silveira, L.C. Low number of luminance levels in the luminance noise increases color discrimination thresholds estimated with pseudoisochromatic stimuli. Front. Psychol. 2014, 5, 1291. [Google Scholar] [CrossRef] [PubMed]
- Jurasevska, K.; Ozolinsh, M.; Fomins, S.; Gutmane, A.; Zutere, B.; Pausus, A.; Karitans, V. Color-discrimination threshold determination using pseudoisochromatic test plates. Front. Psychol. 2014, 5, 1376. [Google Scholar] [CrossRef] [PubMed] [Green Version]
- Madani, A.; Yusof, R. Traffic sign recognition based on color, shape, and pictogram classification using support vector machines. Neural Comput. Appl. 2018, 30, 2807–2817. [Google Scholar] [CrossRef]
- Jansen-Van Vuuren, R.D.; Armin, A.; Pandey, A.K.; Burn, P.L.; Meredith, P. Organic Photodiodes: The Future of Full Color Detection and Image Sensing. Adv. Mater. 2016, 28, 4766–4802. [Google Scholar] [CrossRef] [PubMed]
- Zhang, L.; Yang, L.; Luo, T. Unified Saliency Detection Model Using Color and Texture Features. PLoS ONE 2016, 11, e0149328. [Google Scholar] [CrossRef] [PubMed]
- Pujol, F.A.; Pujol, M.; Jimeno-Morenilla, A.; Pujol, M.J. Face Detection based on Skin Color Segmentation using Fuzzy Entropy. Entropy 2017, 19, 26. [Google Scholar] [CrossRef]
- Hoshino, E.; Hayashi, K.; Suzuki, M.; Obatake, M.; Urayama, K.Y.; Nakano, S.; Taura, Y.; Nio, M.; Takahashi, O. An iPhone application using a novel stool color detection algorithm for biliary atresia screening. Pediatr. Surg. Int. 2017, 33, 1115–1121. [Google Scholar] [CrossRef] [PubMed]
Figure 1.
Polycrystalline silicon cells of different color categories.

Figure 2.
The reflection spectra of Polycrystalline silicon cells of different color categories, from (a) to (e) correspond to LL, LQ, LZ, LS, R6.
Figure 2.
The reflection spectra of Polycrystalline silicon cells of different color categories, from (a) to (e) correspond to LL, LQ, LZ, LS, R6.

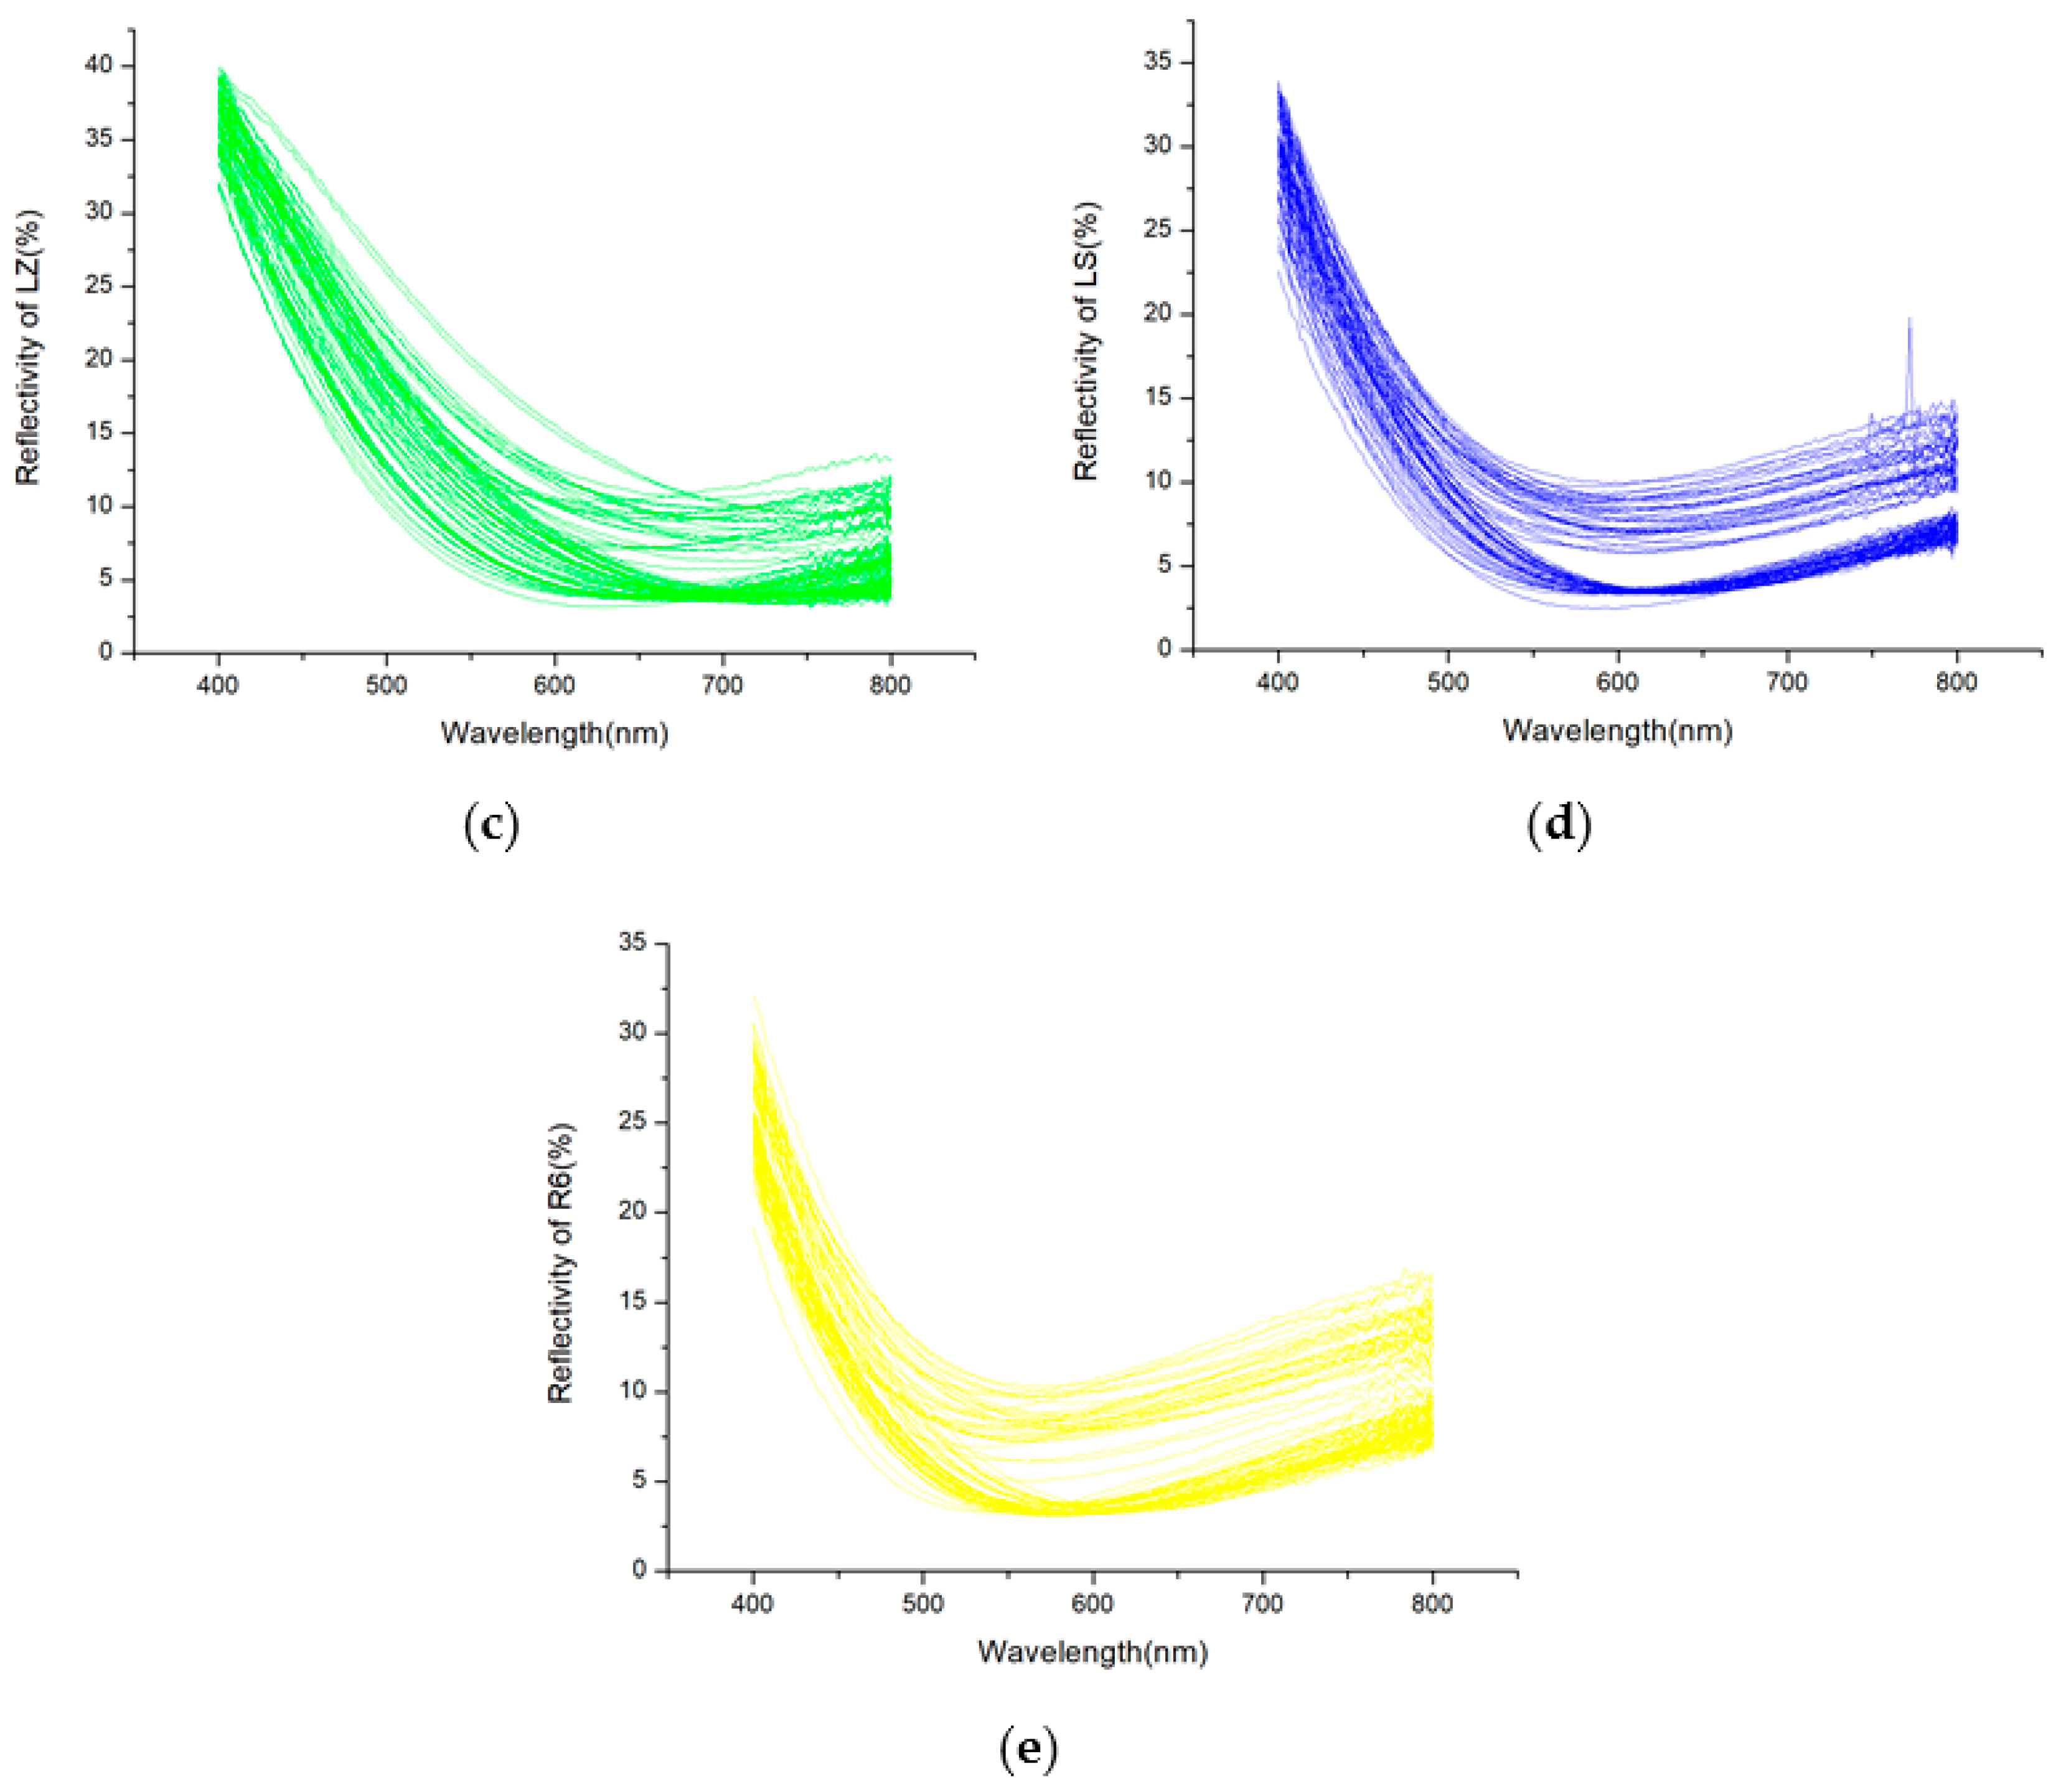
Figure 3.
The average values of the reflection spectra of each color category.

Figure 4.
The standard deviation curve of the reflectivity change of all cells at different wavelengths.
Figure 4.
The standard deviation curve of the reflectivity change of all cells at different wavelengths.
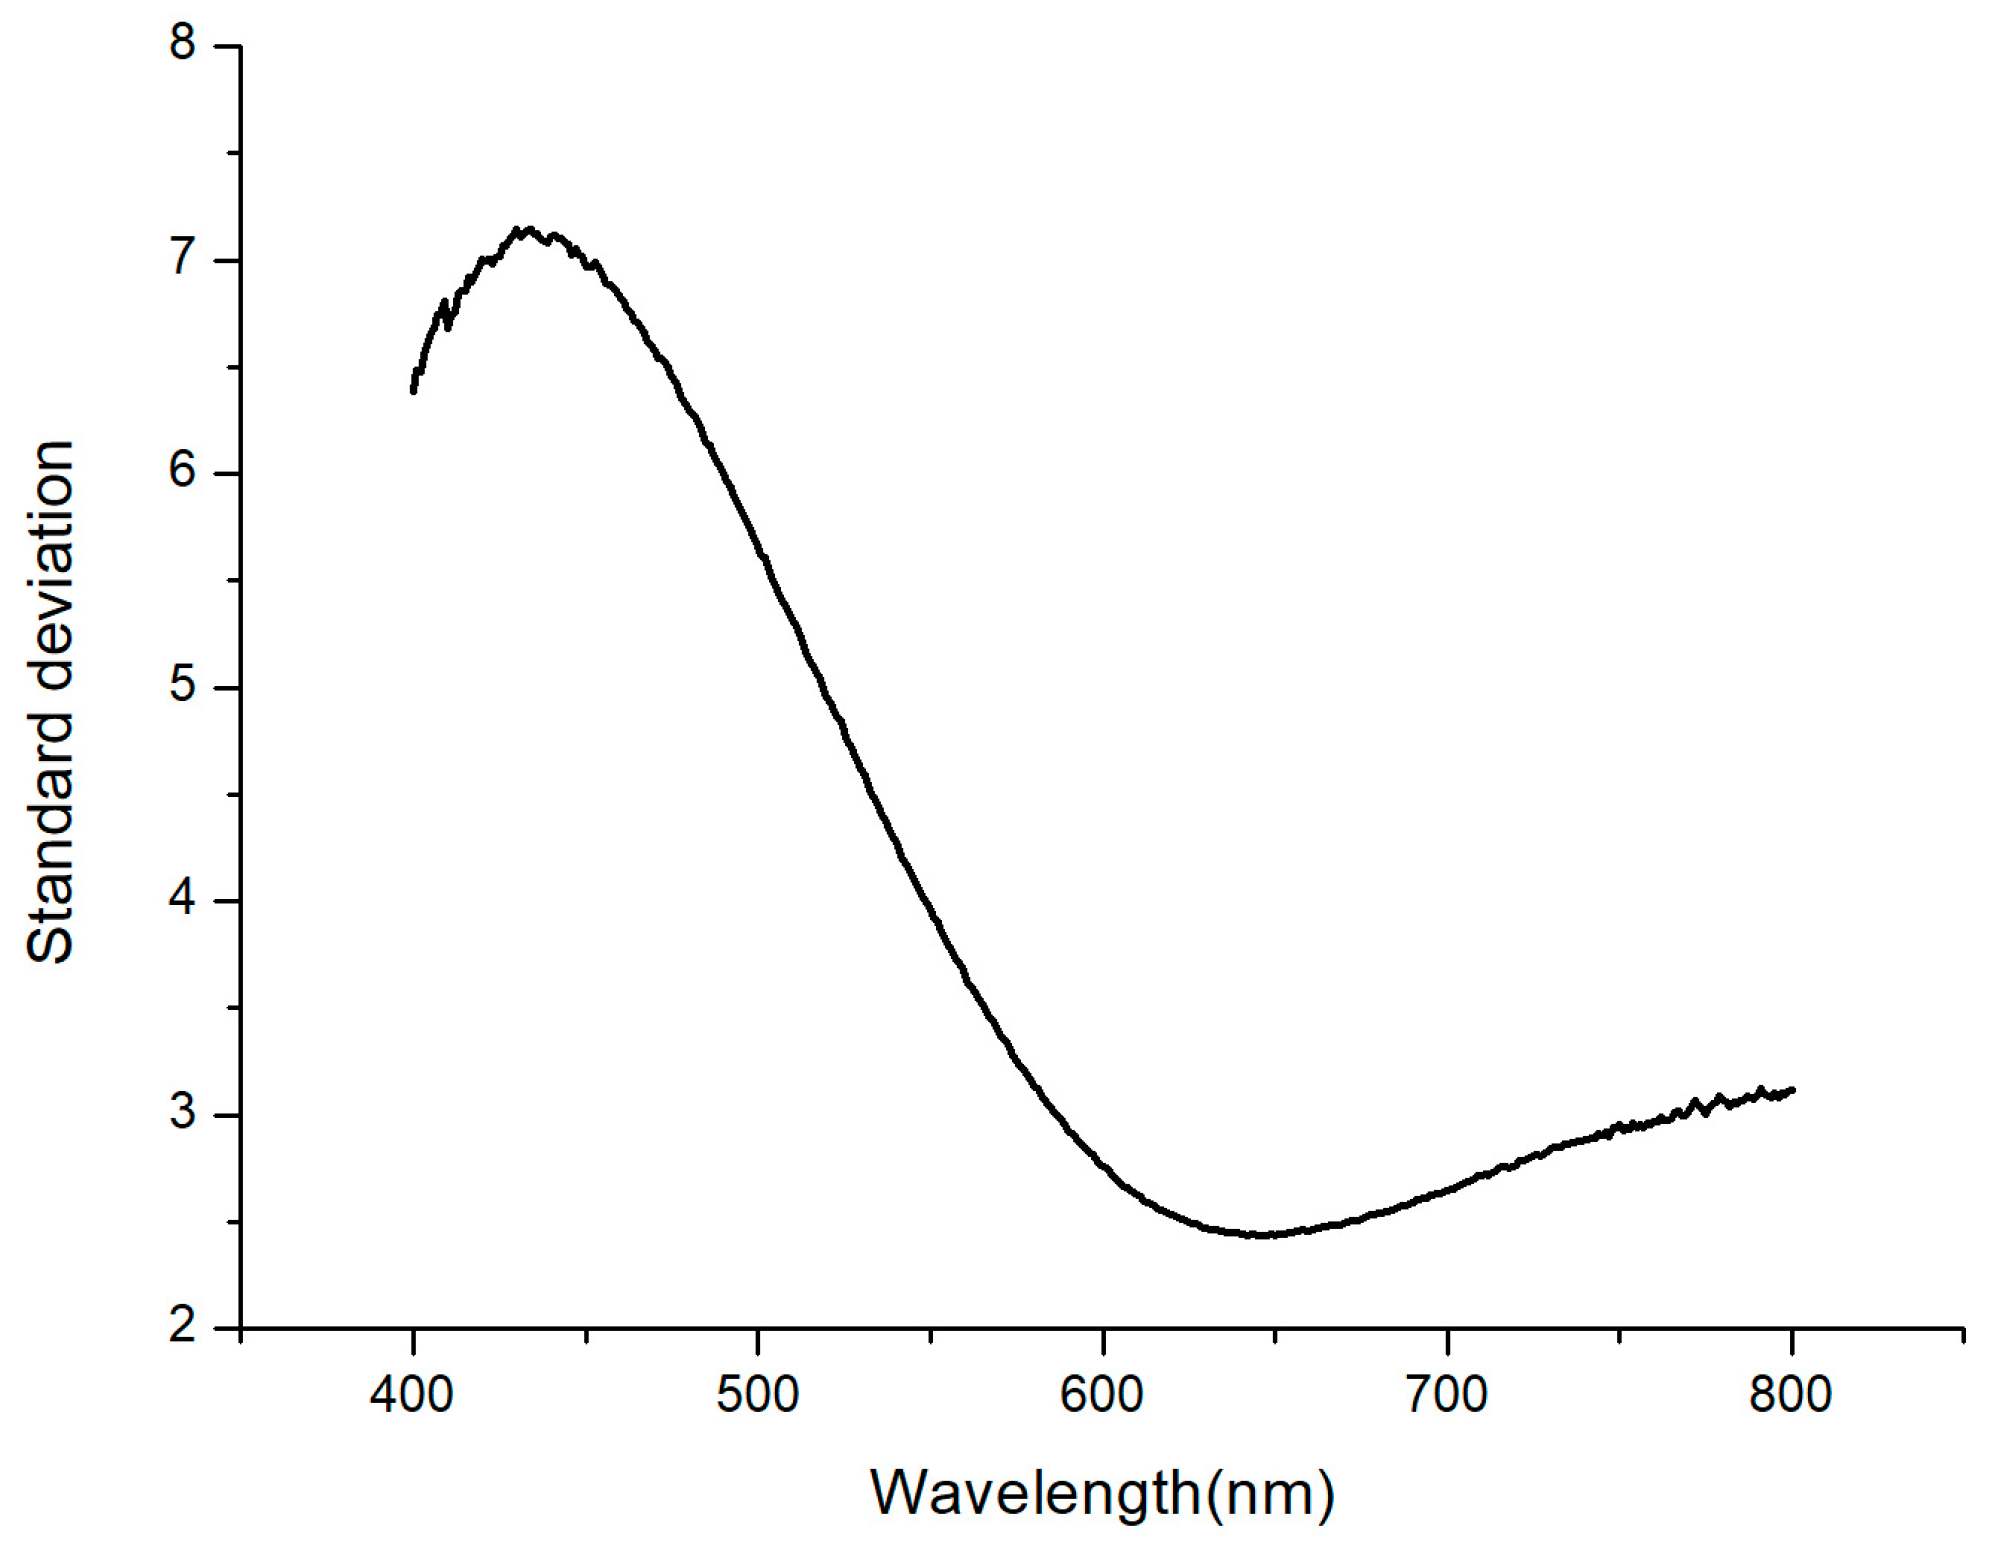
Figure 5.
The standard deviation curve of five average values of color categories at different wavelengths.
Figure 5.
The standard deviation curve of five average values of color categories at different wavelengths.
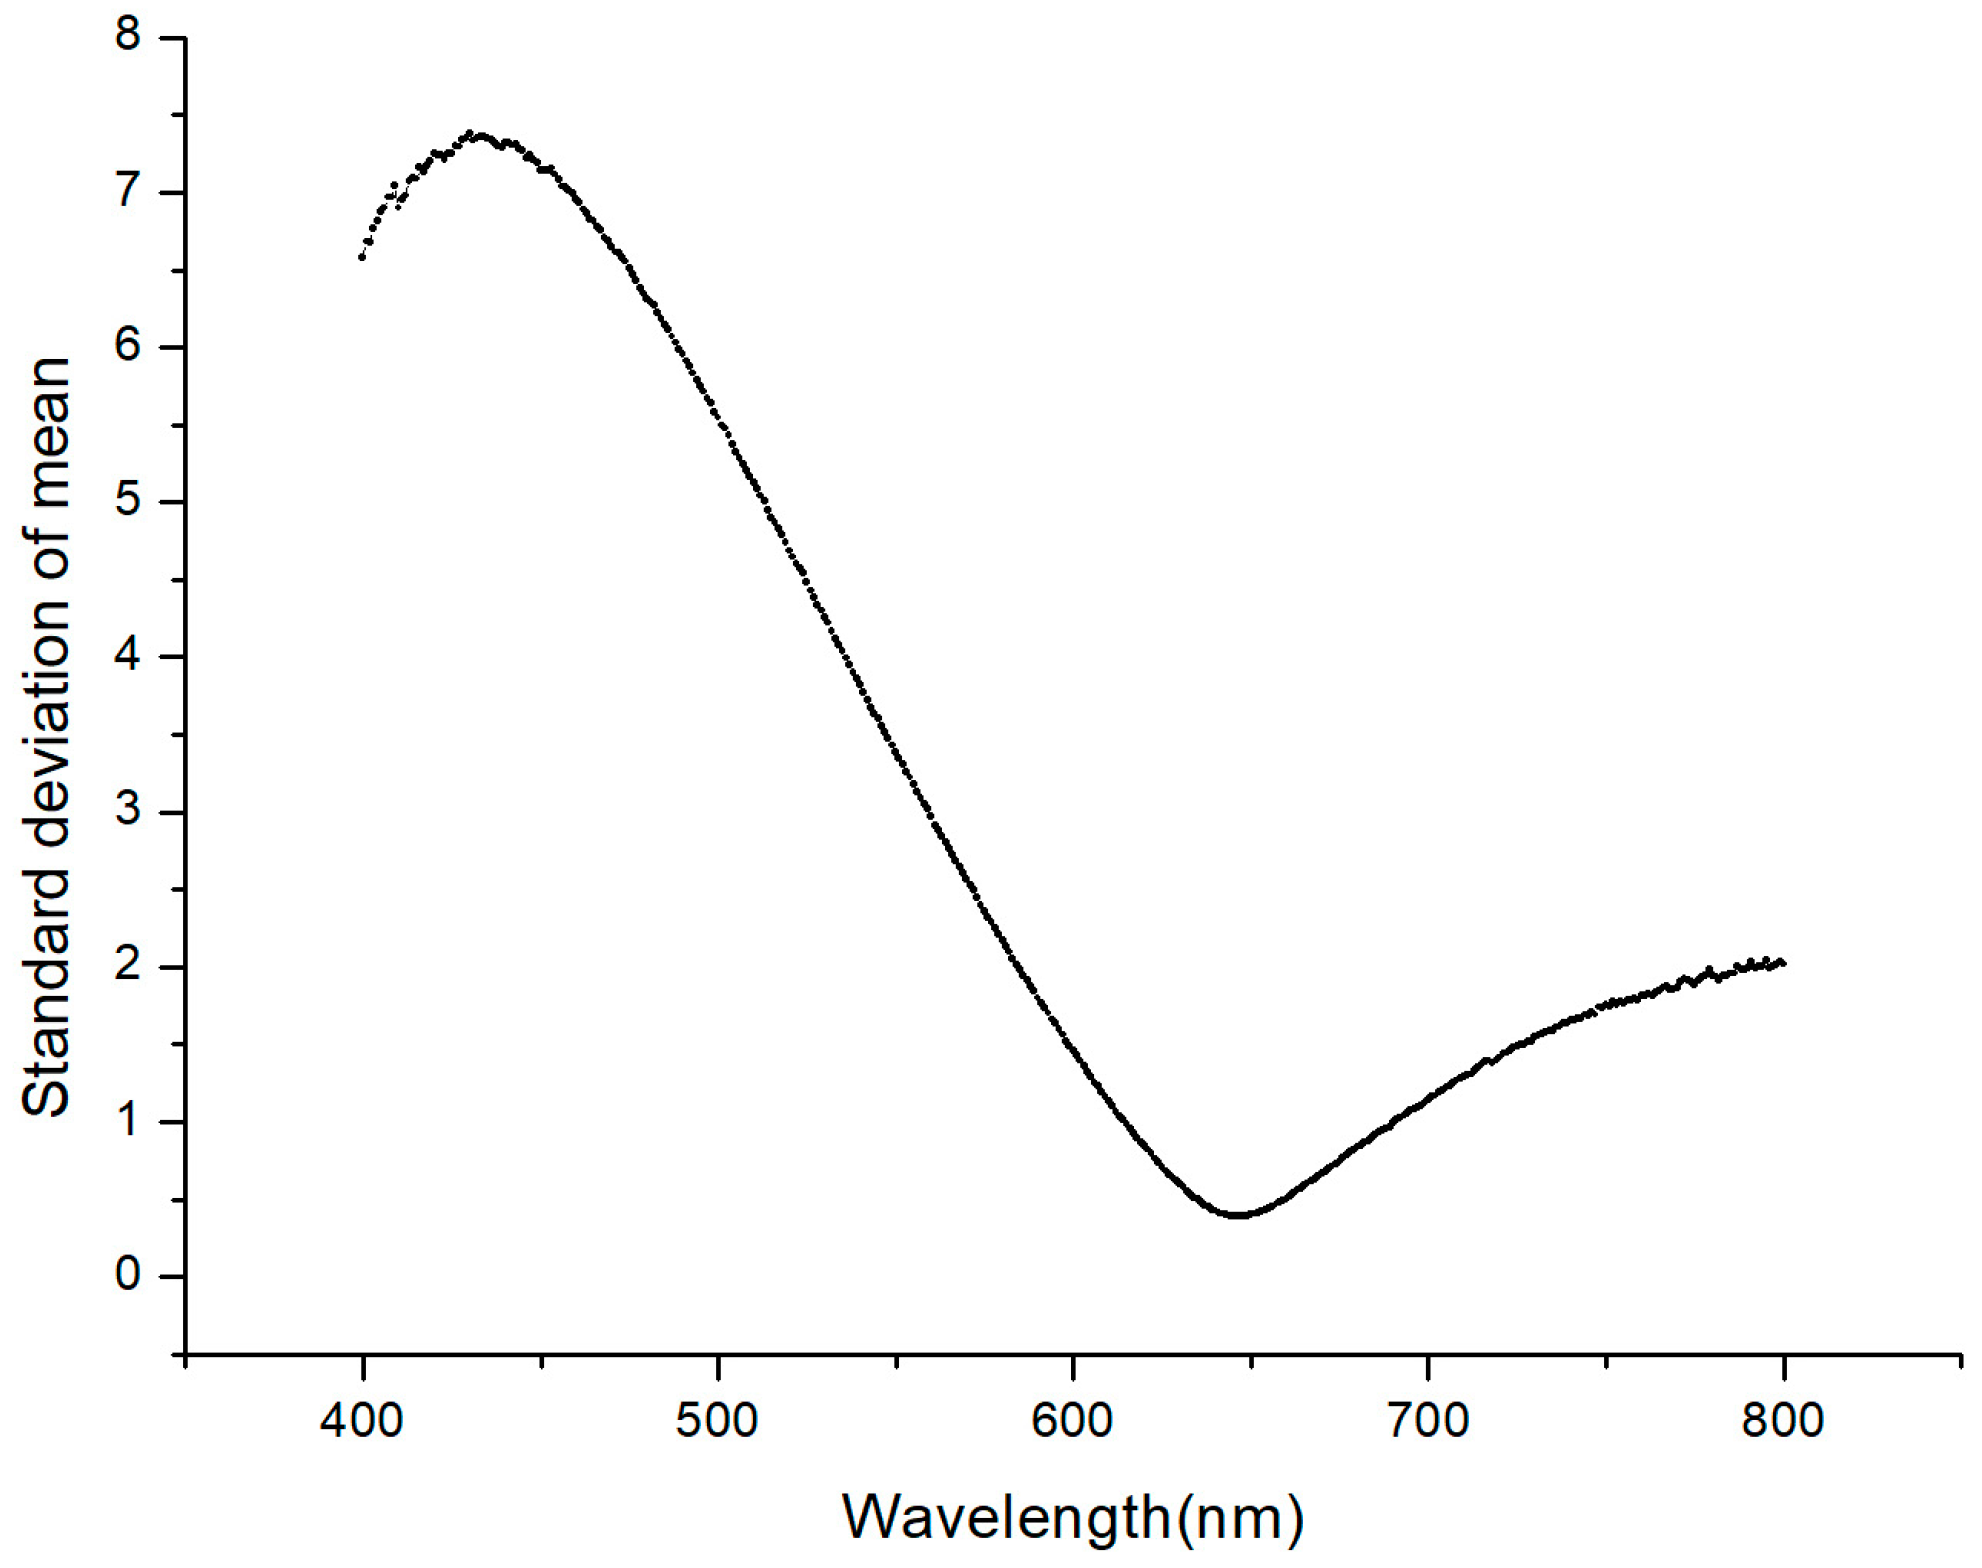
Figure 6.
The distribution of color values of each cell in each color category.

Figure 7.
The maximum, minimum and average color values of each color category of cells.

Figure 8.
The schematic diagram of light path of the laser detection system.
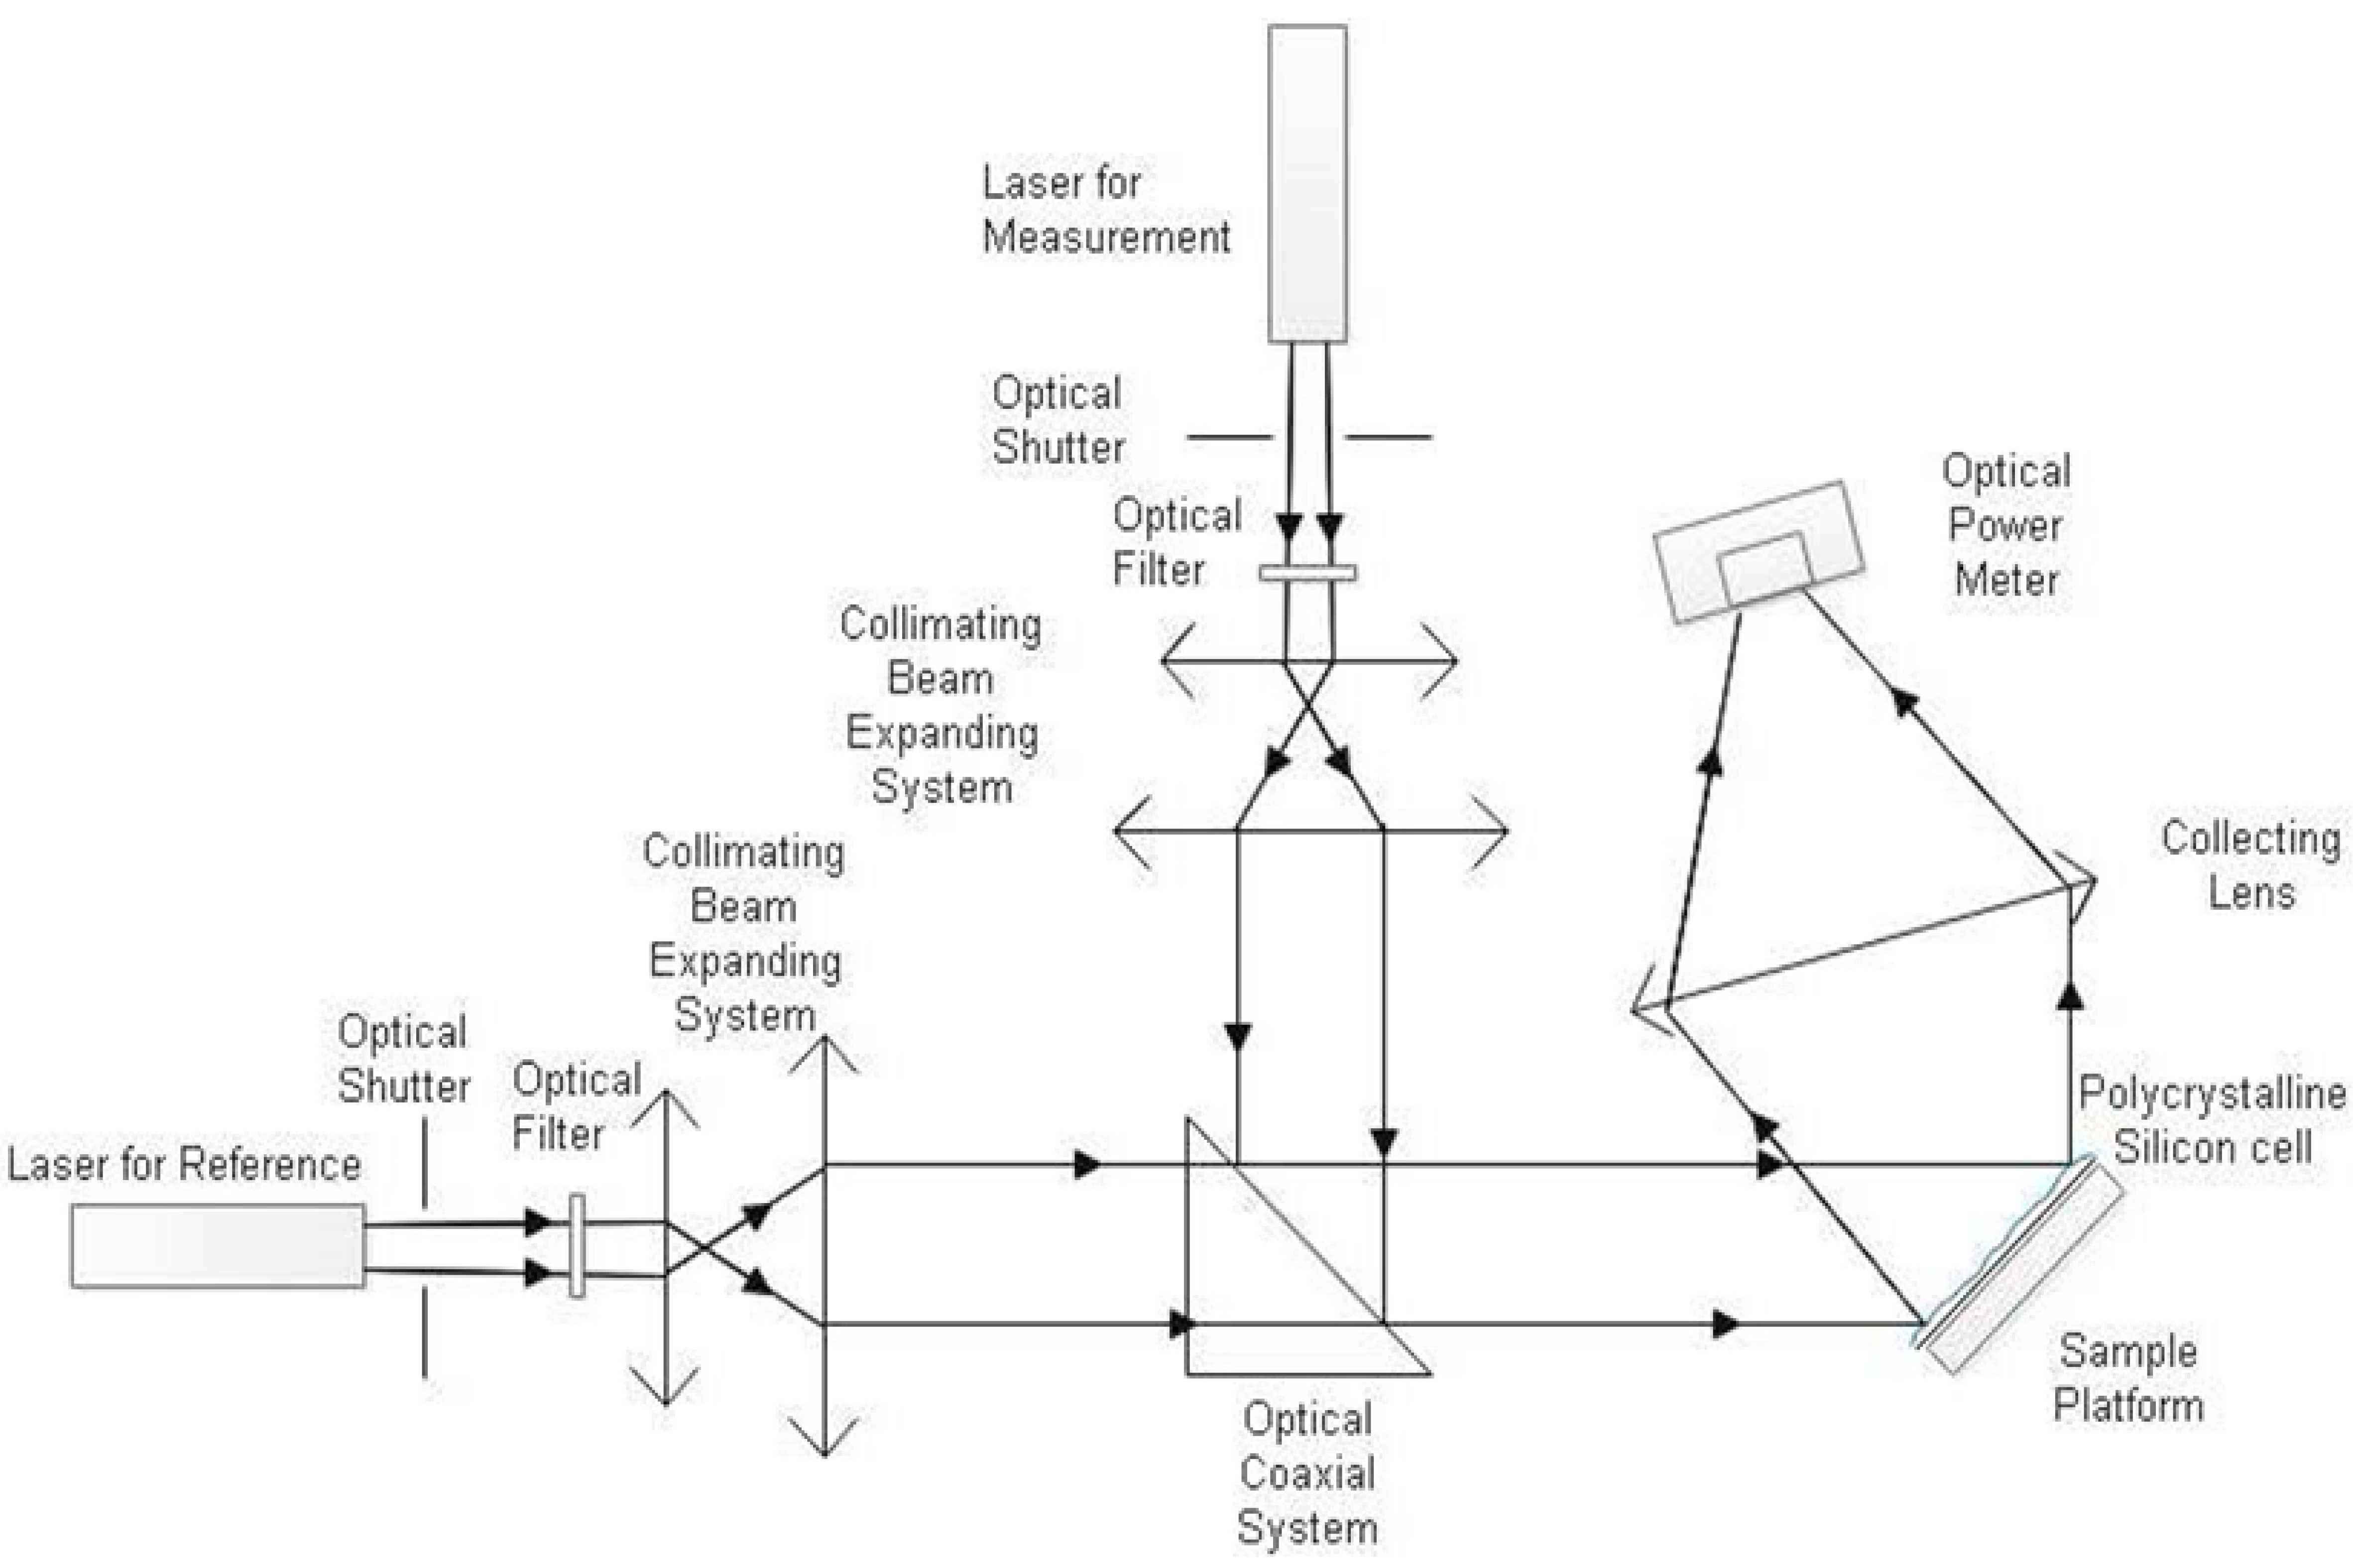
Figure 9.
The five color categories intervals of the cells in the existing laser detection system.

© 2019 by the authors. Licensee MDPI, Basel, Switzerland. This article is an open access article distributed under the terms and conditions of the Creative Commons Attribution (CC BY) license (http://creativecommons.org/licenses/by/4.0/).
Share and Cite
MDPI and ACS Style
Chen, Z.; Wang, S.; Zhang, L.; Ma, Z. Design and Research of a Color Discrimination Method for Polycrystalline Silicon Cells Based on Laser Detection System. Appl. Sci. 2019, 9, 4468. https://doi.org/10.3390/app9204468
AMA Style
Chen Z, Wang S, Zhang L, Ma Z. Design and Research of a Color Discrimination Method for Polycrystalline Silicon Cells Based on Laser Detection System. Applied Sciences. 2019; 9(20):4468. https://doi.org/10.3390/app9204468
Chicago/Turabian StyleChen, Zijian, Shiyu Wang, Lian Zhang, and Zenghong Ma. 2019. "Design and Research of a Color Discrimination Method for Polycrystalline Silicon Cells Based on Laser Detection System" Applied Sciences 9, no. 20: 4468. https://doi.org/10.3390/app9204468
Note that from the first issue of 2016, this journal uses article numbers instead of page numbers. See further details here.