How to Extract Meaningful Insights from UGC: A Knowledge-Based Method Applied to Education


1
Department of Business Economics, Faculty of Social Sciences and Law, Rey Juan Carlos University, Paseo Artilleros s/n, 28032 Madrid, Spain
2
Ehrenberg Centre for Research in Marketing, London South Bank University, 103 Borough Rd., London SE1 0AA, UK
*
Author to whom correspondence should be addressed.
Appl. Sci. 2019, 9(21), 4603; https://doi.org/10.3390/app9214603
Submission received: 3 September 2019
/
Revised: 18 October 2019
/
Accepted: 21 October 2019
/
Published: 29 October 2019
(This article belongs to the Special Issue Advanced Techniques in the Analysis and Prediction of Students' Behaviour in Technology-Enhanced Learning Contexts)
Abstract
:New analysis and visualization techniques are required to glean useful insights from the vast amounts of data generated by new technologies and data sharing platforms. The aim of this article is to lay a foundation for such techniques so that the age of big data may also be the age of knowledge, visualization, and understanding. Education is the keystone area used in this study because it is deeply affected by digital platforms as an educational medium and also because it deals mostly with digital natives who use information and communication technology (ICT) for all manner of purposes. Students and teachers are therefore a rich source of user generated content (UGC) on social networks and digital platforms. This article shows how useful knowledge can be extracted and visualized from samples of readily available UGC, in this case the text published in tweets from the social network Twitter. The first stage employs topic-modeling using LDA (latent dirichlet allocation) to identify topics, which are then subjected to sentiment analysis (SA) using machine-learning (developed in Python). The results take on meaning through an application of data mining techniques and a data visualization algorithm for complex networks. The results obtained show insights related to innovative educational trends that practitioners can use to improve strategies and interventions in the education sector in a short-term future.
1. Introduction
Millions of consumers center their consumption habits and daily activities around mobile technologies, apps, social networks, and digital platforms. These, in turn, generate a bewildering profusion of data about users’ activity in and use of digital devices [1,2] and it is now becoming ever clearer that data, particularly data sharing, is a dominant paradigm in an interconnected world [1]. This sharing is fostered by customer or client-centric platforms that support and encourage user generated content (UGC) [2], defined as content distributed via social networks by users who share publicly their opinions and comments on topics of interest [3].
At the same time, the mass of UGC data overwhelms the means to extract timely, high-quality information-based insights that are meaningful, useful, efficient or applicable to managerial interventions [3,4,5,6]. Nevertheless, the desire to benefit from such data is driving researchers to seek new tools and analysis techniques that focus on identifying knowledge and insight generation [1,7].
Particularly, desirable techniques are those that can be applied to databases that come from social networks and digital platforms where UGC proliferates [8,9]. Previous attempts focused on new technologies and methodological approaches using artificial intelligence, machine learning, topic-modeling, data visualization, sentiment analysis, and business intelligence, among others [10,11], with varying degrees of success. However, extracting useful knowledge from large amounts of data from varied public, private, industrial, and commercial platforms remains an imperfect science with much room for improvement [12,13,14,15]. This is particularly true for some markets such as education that include millions of customers (students, teachers, administrators, schools, education systems, regulatory bodies and commercial networks) huge numbers of providers and interested parties, and baffling varieties of ICT systems and procedures [16,17].
Accordingly, in the present study, we focus on the analysis of UGC in the education sector with the aim of developing and demonstrating reliable and re-usable techniques for understanding the users, issues, and trends in the education [18]. Similar techniques for analyzing social network data have been applied in various research areas and market sectors [2,18] with promising results, especially for improving understanding of how users are grouped into communities [19,20,21]. The refined approach used provides an overview of social media around the education sector, giving us the possibility to focus on key themes, especially around innovation [21,22,23]. The present study therefore aims to improve understanding of innovation in the education sector. Our main source of information is the verbal content published by users on Twitter [24,25].
As indicated above, a contribution of this research is to identify trends related to innovation in the education sector by applying methods to extract knowledge and as importantly, to communicate it effectively through the application of data visualization algorithms [2,26,27,28,29,30]. This objective also includes detecting and systematizing thematics that characterize the education sector, at least in the short-term [30,31,32].
Specifically, this study develops a topic-modeling technique known as LDA (latent Dirichlet allocation) on which SA via machine-learning developed in Python, is applied. The results generated are then tested against Krippendorf’s alpha value (KAV) which sets a meaningful threshold of 0.8 or better [33,34] to be considered as reliable on a sample of n = 9801 tweets [35]. The information analyzed is the text content of tweets that together with the indicators obtained from the applied methods, as well as the study of their groupings in communities, allow us to derive insights related to innovation in education [17,21]. Comparison of findings with the results of other investigations then aid in the verification of these insights and the identification of new knowledge relevant to the education sector [25,26].
Finally, the results are given meaning by applying data mining techniques and a data visualization algorithm for complex networks, developed by Blondel et al. [36] and known as modularity report (MR). This uses the open source software Gephi, with which different image resolutions are applied to visualize and identify communities in the sample as they relate to education innovation [37]. Then, the results of the discovered topics are compared with UGC communities on Twitter concerned with innovation in education. It is important to note that the primary purpose of this study is discovery, and not hypothesis testing [21]. There are no a priori assumptions about variables in this approach. Instead, the intent is to identify variables that will be useful to further research, and that therefore add value to the literature [38].
This article is structured as follows: first, following the introduction, we present methodology and research questions used in the analysis. Next, the results are presented followed by a discussion and then conclusions and references.
2. Methodology and Research Questions
2.1. Research Questions
Shelton et al. [18] demonstrated the importance of studying new trends in education, concluding that progress and quality depend on continuous learning. Likewise, Reyes [19] pointed out the need to apply data-based techniques to Big Data to identify trends in education and to learn new teaching skills by applying learning analytics techniques. Furthermore, Anshari et al. [20] concluded that research focused on the discovery of trends for the improvement of education, can be developed with techniques based on knowledge extraction, data mining, or Big Data. Following these investigations, we propose the following research question.
Is it possible to identify trends in the education sector by analyzing the UGC on Twitter and representing them in topics? (RQ1)
This work is based on the work by Huda et al. [21] who showed that insights can be extracted by analyzing the databases to help improve active agents in the education sector through discovering new online learning resources. In addition, in their review, Sin and Muthu [22] analyzed the use of data mining-based techniques in the learning sector, discovering that the sentiment analysis technique—among others—are a rich source of content for the education sector. Likewise, Pang and Lee [23] used sentiment analysis as a technique to extract insights in education, highlighting the need to study content to extract insights based on the feelings expressed in UGC. Based on these findings, our second research question is.
Is it possible to extract insights related to the education sector by analyzing the sentiment (positive, negative, and neutral) in UGC topics published on Twitter? (RQ2)
Previous studies of UGC and social networks in the education sector include, Kogan [24] who highlighted the identity and quality of content that can be extracted from communities of higher educations. Likewise, Jongbloed et al. [25] analyzed the interconnections within the scope of communities in education, highlighting the influence of social networks. Furthermore, La Velle et al. [26] emphasized that communities of teachers in education are a source of quality content related to education and teaching. Based on these previous studies, the third research question addressed here is as follows:
Is it possible to detect user communities that publish UGC on Twitter in the education sector and extract quality insights relevant to these online communities? (RQ3)
2.2. Data Sampling Extraction and Collection
For the data extraction process the authors connected to the public Twitter API. The time horizon analyzed was from 10–17 June 2019, allowing the download of a total of n = 10,786 tweets under the search term #Education. Following Sherman et al. [39] and Banerjee et al. [40], we used a randomized controlled process to select this term by focusing on the education sector and the proposed research questions. This process allows researchers to systematically select a sample based on the social media content—in this study, in the form of tweets with a specific hashtag. To this end, the authors choose a term for the extraction of the sample that describes the study subject and encompasses each of the proposed research questions, removing any other terms that do not have these characteristics [11,27]. This exploratory process is based on previous study results from other investigations [11,23,25] that groups the sample around the same label—in this case, on Twitter.
Data collection was performed using the MAC version of Python software 3.7.0. [17]. Other investigations have used this same sequence and sample based on the quality of the content and not on the UGC number of samples [11,35,38,41].
After data collection, the tweets were filtered to exclude images and videos which are not part of this study [11]. This was a simple data cleaning exercise to exclude data that was not suitable for analysis using the developed method. Also, the extraneous URLs that contained the tweets were removed. The data cleaning process was performed using Python and Pandas software library. For this filtering we used commands to elect or replace columns and indices to reshape lost or empty values and to debug repeated or unnecessary data. In addition, any retweets, that is, a tweet from one user that is repeated by another user, were treated as independent tweets [42,43]. Repeated tweets from the same user, as well as URLs and references with links to other web pages, were removed with the aim of increasing the quality of the included content and avoiding noise [41]. Also, emojis were not analyzed in this study, as we focused on natural language processing (NLP), rather than on the graphic icons analysis techniques. Our decision to omit emoticons in our analysis was based on the fact that the analysis techniques used in the present study were not meant for the analysis of graphics or graphic icons and were associated with the analysis of feelings in NLP datasets [38]. This filtering process resulted in a final sample of n = 9801 total tweets with direct relevance to the education sector [2,36,37].
2.3. Knowledge-Based Method to Extract Insights from UGC
To make sense of the content generated by users, a methodology proposed by Saura and Bennett [2] was applied to the data. This process uses three different approaches based on data mining and topic modeling.
The first step is the development of a mathematical model to detect topics from a series of inputs on which this algorithm is applied. Pritchard and Stephens [44] created the model, and Blei et al. improved it [45]. The improved model is known as LDA. The model has been successfully used in various studies before [46,47]. The objective of the model is to identify the number of times a word is repeated in a sample. Sometimes this sample can be represented by phrases or by documents [46]. The mathematical model developed in Python applies the observation of variables including the number of documents or databases on which the analysis will be carried out; these are the latent variables [44]. The variables then are used to determine the number of topics that the algorithm will find based on the importance of the total database [46].
Once the algorithm has detected the total number of words and the number of repeated words, the researcher must give names or labels to the topics [41]. This name is specified by the researcher and can be based on a phrase creation using the last words that are repeated in the analysis of a document or a database after applying the LDA model. This is an open coding method which is routinely used in research studies based on grounded theory [42].
On LDA results we apply a sentiment analysis, in this case one developed in Python that works with machine learning and that must be trained through a process in which the different samples are classified [47,48] by the researchers; here, tweets from Twitter are classified as positive, negative, and neutral [49] manually. This sentiment-centered analysis can identify connotations and feelings with respect to the subject of study. The SA methodology aims to classify the feelings expressed in a sample. That is, using SA, researchers can analyze the feelings within a community regarding a specific theme. This analysis is based on studying the set of connotations in texts that compose the sample [50].
To determine the number of iterations required to train this algorithm so that it is ready to be used, we focus on the resulting KAV measurement [50]. This measure indicates what the level of significance is in terms of machine learning success [33,34]. Note that in applying the threshold levels of KAV, the results must be equal to or greater than 0.667 to have an average of success that is minimally reliable [50]. A good measure that allows conclusions to be analyzed with confidence that they are meaningful would be to set the acceptable KAV equal to or greater than 0.800 [34].
In the present study, the KAV value is applied to support vector machine (SVM) algorithms. This type of trainable algorithm has an easy application for other academics, and researchers in the educational sector. The SA algorithms that work with SVMs make it possible to train SVMs with a sample (in this case, a collection of tweets), indicating through a user interface whether the sample is negative, positive, or neutral. This training is performed until the model’s ability to succeed, as indicated by the KAV, is sufficient [2]. As indicated by Krippendorff [51] and replicated by Saura et al. [38], the basic formula for KAV is the relationship characterized by observed disagreement/expected disagreement. The calculation method is computationally very complex, the process involves resampling methods such as bootstrapping [51].
Therefore, the proposed approach is a data analysis technique that should be useful to those who seek to use UGC to improve their communication or marketing strategies. Also, it should be useful to educational institutions that may be able to enhance their offerings by identifying needs and trends based on technologies previously investigated [52,53,54,55].
Figure 1 shows the training process of the SVM algorithm and the classification according to the feelings that (a) represents the training process of a sentiment analysis algorithm with a feature extractor and a machine learning algorithm, and (b) represents the prediction process of a sentiment analysis algorithm with a feature extractor and a classifier model [2].
Finally, a textual analysis also known as data text mining is carried out. In this case, a study of the databases resulting from these processes is outlined. That is, as a result of the two processes executed previously, the databases obtained are divided according to the feelings or sentiments labeled positive, negative, and neutral [56].
These textual databases were analyzed using Nvivo [2]. Following Saura and Bennett [2] each database was filtered into groups of nodes and then classified based on the weight of repetition of words and the metric known as weighted percentage (WP) [51,57,58]. This metric identifies the phrases and words that are repeated the most, classified by sentiment as well as by topic, and allows phrases to be classified so that groups of main indicators can be identified. The equations used for this process can be consulted in detail in Saura and Bennett [2]. Figure 2 details each phase of the TA process which (a) represents input data collection and preprocessing, and (b) represents the output process by text mining and text analysis.
2.4. Data Visualization Algorithms
This technique uses an algorithm for the visualization of complex communities [36,37] developed by Blondel et al. [36] that enables communities to be identified within complex networks called modularity reports (MR) [36,37]. In addition, the technique uses a resolution enhancer to improve visualization of the algorithm created by Lambiotte et al. [37].
Note that the visual representation of communities has been used in previous investigations [58,59,60,61]. In the current research, the objective was to detect communities related to education and also to detect new technologies and future trends that can then be compared to topics identified from the study sample. To allow this analysis, the sample is structured in nodes [62]. A node is a neuron that represents the link between different users or different communications in Twitter [2,35]. The links between these nodes and their weight and relevance determine their relationship with respect to the subject. The nodes therefore indicate both communities and topics of communication. In addition, they can be visually represented to detect the number of people or nodes, or users, who are talking about this issue across social networks [63].
With regard to the resolution of the algorithm and its application, the next step is to identify the number of sub-communities based on their weight [61]. Following Lambiotte et al. [37], a higher visualization resolution when using the algorithm will allow us to obtain fewer, but more specific, communities, while lower resolutions will allow us to identify more communities in which more nodes participate.
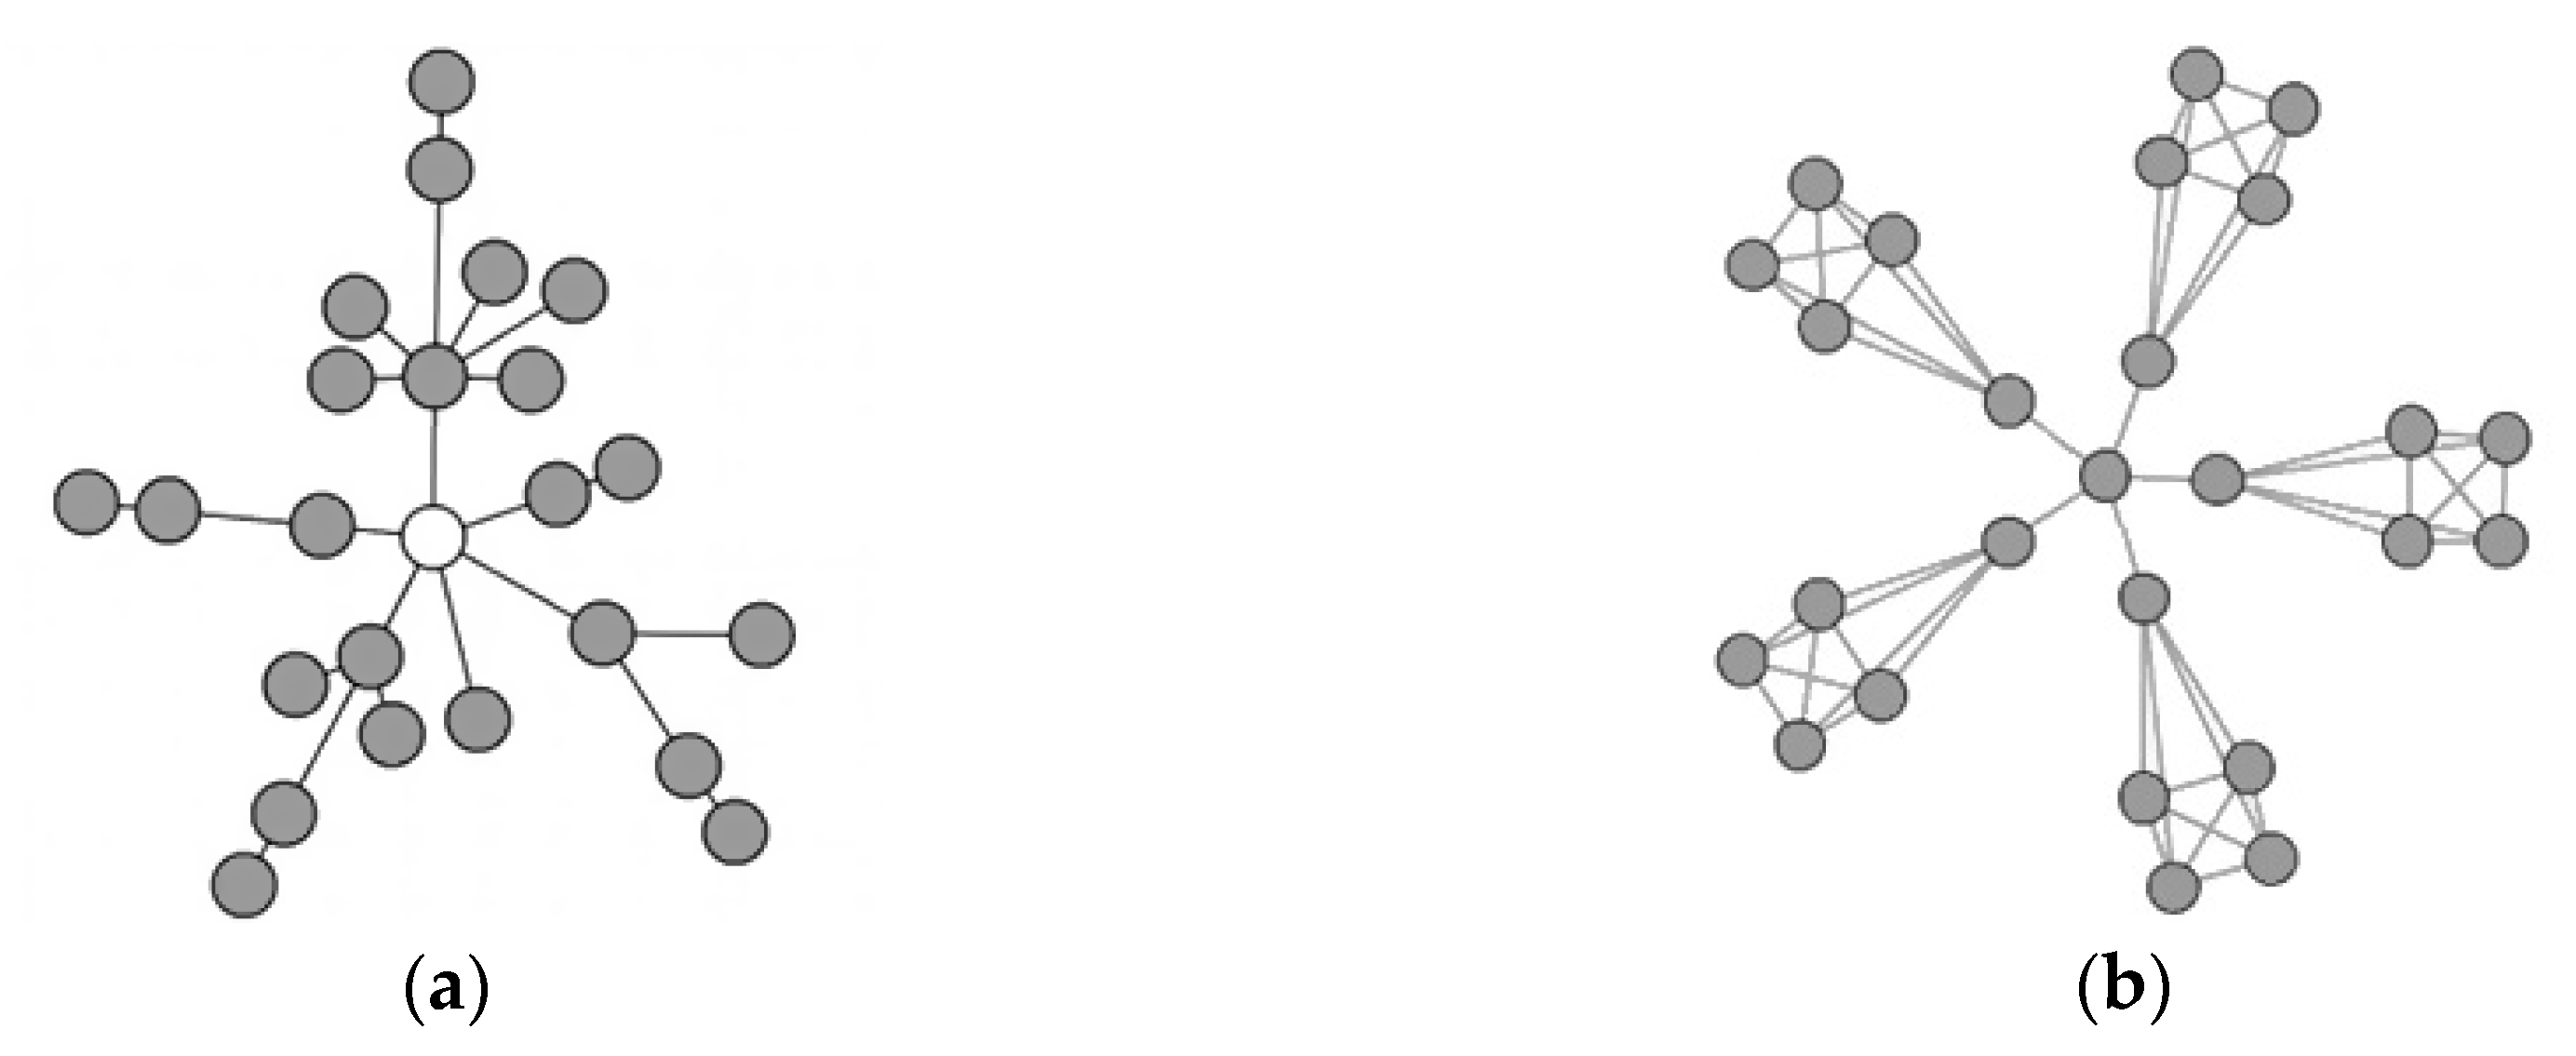
Blondel et al. [36] and Lambiotte et al. [37] explain that node networks can be visually understood as a community with systematically organized unions. The usefulness of this organizational system is illustrated in Figure 3 which shows how nodes may present simple linkages (a) or may present unions in a community (b).
Note that each node is identifiable by various descriptors that enable the researcher to demonstrate that topics on the social network are grouped around communities and how different nodes group with other nodes. These systematic organizations make it possible to visually present understandable communities and connections [36] (see Figure 4a–c).
3. Results
3.1. Knowledge-Based Method Results
With respect to the LDA process the following results were obtained in which five main topics related to education were defined; three of these topics were associated with a positive sentiment, one topic was negative, and another topic was neutral.
Topic descriptions and sentiments are shown in Table 1, which shows that new technologies play a fundamental role, both directly and indirectly, in innovation and education. On the one hand, new teaching processes based on innovation emerge, along with habits for obtaining online information or tools and tutorials that facilitate the understanding of these new processes. Furthermore, there is a two-way communication between communities that comment on the skills that teachers must have to develop new teaching methodologies based on technology and innovation.
The topics were then rated using sentiment analysis and the algorithm trained with machine-learning processes. The results of applying KAV analysis are shown in Table 2, [64,65]. For positive tweets, KAV values were 0.876, (above the reliability threshold of 0.8) [51]. The same was true for negative tweets with 0.882 KAV but neutral tweets had an average KAV of 0.641.
Table 3 makes clear the statements related to education and the trends that have been identified can now be represented as insights [2,25,26]. These insights were identified by simply dividing the nodes (Count) by feelings (positive, negative, neutral) to calculate the WP and then applying data mining analysis [2].
These results show that the main concerns expressed in the UGC sample are related to the skills that teachers should develop. Likewise, enthusiasm for new learning models and teaching methodologies strengthens the teacher′s profile. Furthermore, social networks are being used as channels to share information related to teaching innovation and tutorials or tools that help teachers to develop their educational work. These insights provide an overview of possible motivations or concerns of teaching professionals in the education area.
3.2. Data Visualization MR
After applying the MR algorithm, it was possible to preview the communities with different resolutions [36]. The objective was to obtain the largest number of communities related to education and innovation in the sector so that a comparison of results of different tests enables identification of communities that are most relevant [2,16]. Table 4 shows the results of different tests performed according to the number of communities identified, their modularity, and the resolution applied to detect them.
For the visualization of the neural networks and the corresponding communities, visualization filters were implemented using the open source Gephi software. The filters, following the application of the MR algorithm at selected resolution levels, use Force Atlas and Force Atlas 2 as shown in Table 5 [37]. These are the settings that are generally applicable and are used to enhance results visualizations.
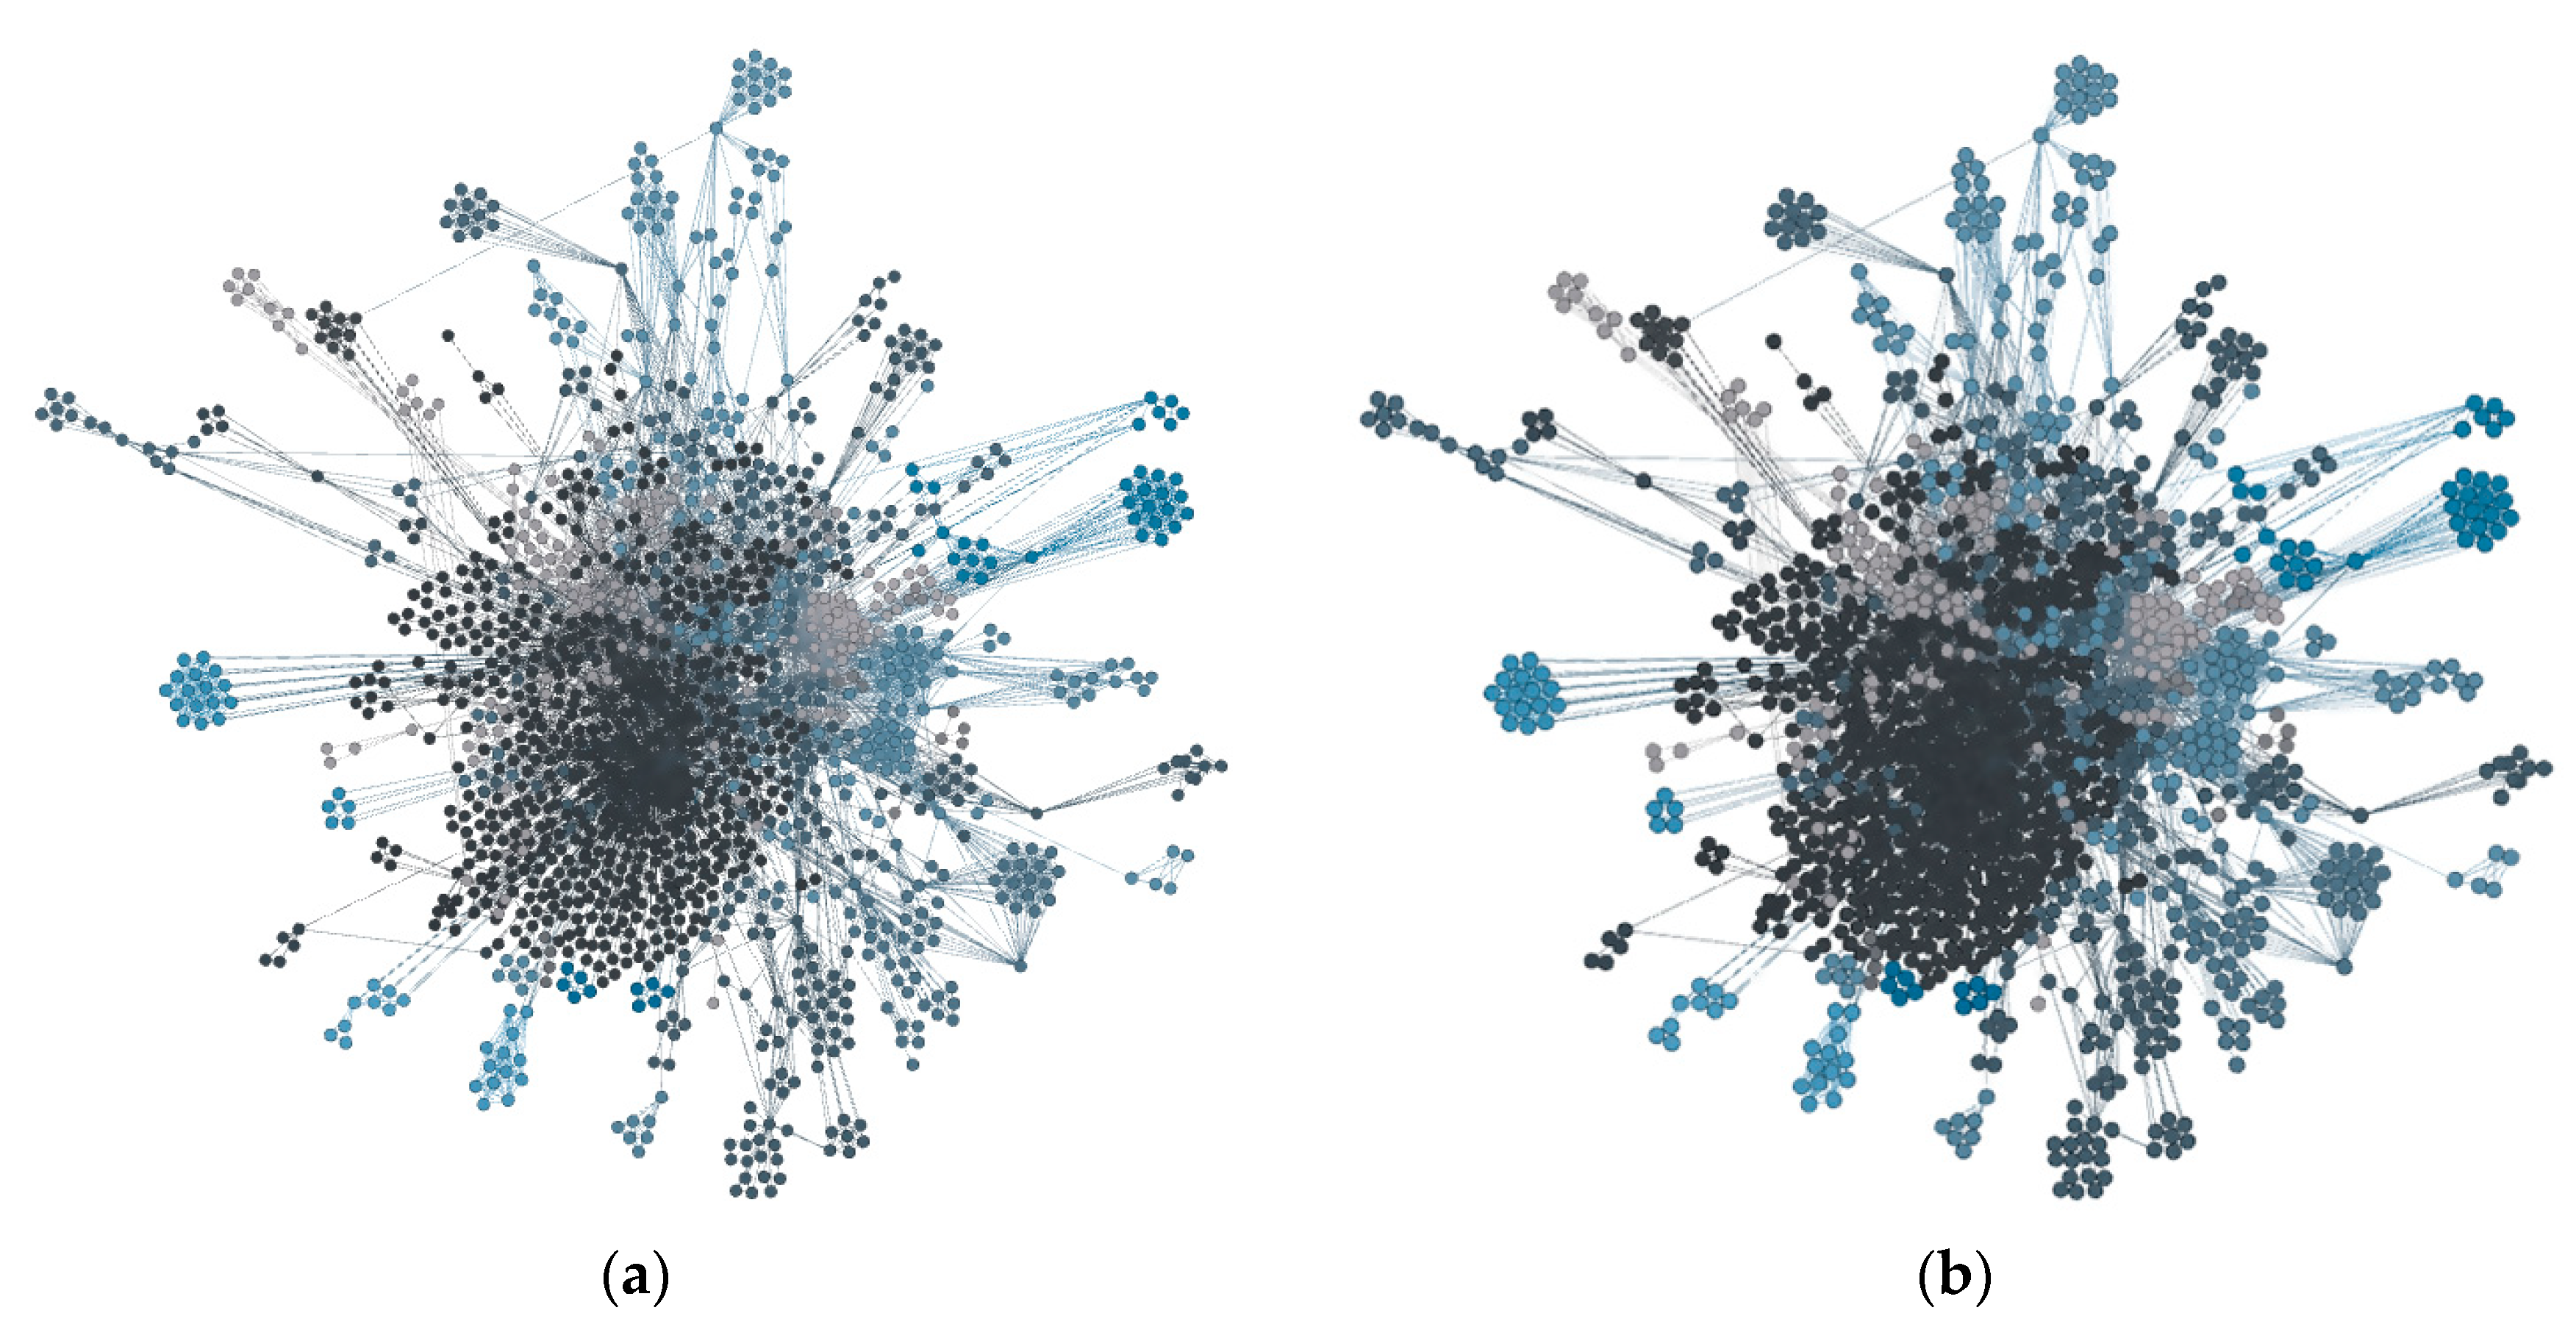
Note that the visualization and resolution regarding the size of each node is 10 and nodes are grouped by communities according to their weight and relation to the main community. In addition, communities are arranged in color scales as shown in Figure 4a–c.
In (a) the results of the communities identified with the filters from Table 5 are presented. In (b) a network contraction filter is applied to help visualize the different modularities. Finally, in (c), the distance between each content community is observed with greater resolution to highlight the communities with the highest MR relative to the chosen subject (i.e., innovation in education), (see also Table 6).
Figure 4a–c shows that the center of all identified communities obtains a high MMC, represented here by dark blue. This highlights the relevance of the communities. In addition, the UGC content published without being grouped in a community is shown in black.
However, some small communities with very high MMC’s are composed of few nodes, as compared with the communities with a high MiMC value and many nodes. This can be interpreted to mean that although there are more nodes around a community, in reality communities with a high MMC, even when they have few node connections, are more relevant to the identified issue. That is, the results of the UGC analysis indicate that in the field of education, there are small communities that are very relevant, while other, sometimes larger communities are of minor importance. In the latter communities, while many users participate, their relevance in Twitter is small and only creates noise around the content so there is little interaction among the communities and no user engagement.
The choice of using a higher or lower resolution for the individual analysis of the UGC communities is up to the researcher [37]. In the present study, the aim is to explain the application of the algorithm of Lambiotte et al. [37] so that it can be understood and applied by other researchers in different industries.
To this end, Figure 4a shows the results of applying the filters from Table 5. Figure 4b shows how the space between the nodes is smaller with a shrink filter that allows us to visually detect or measure the size of communities based on labels, colors, or visual measurement values, as well as to understand whether they are really communities or simply UGC. Unlike Figure 4a,b, Figure 4c uses a different resolution to visualize the node communities.
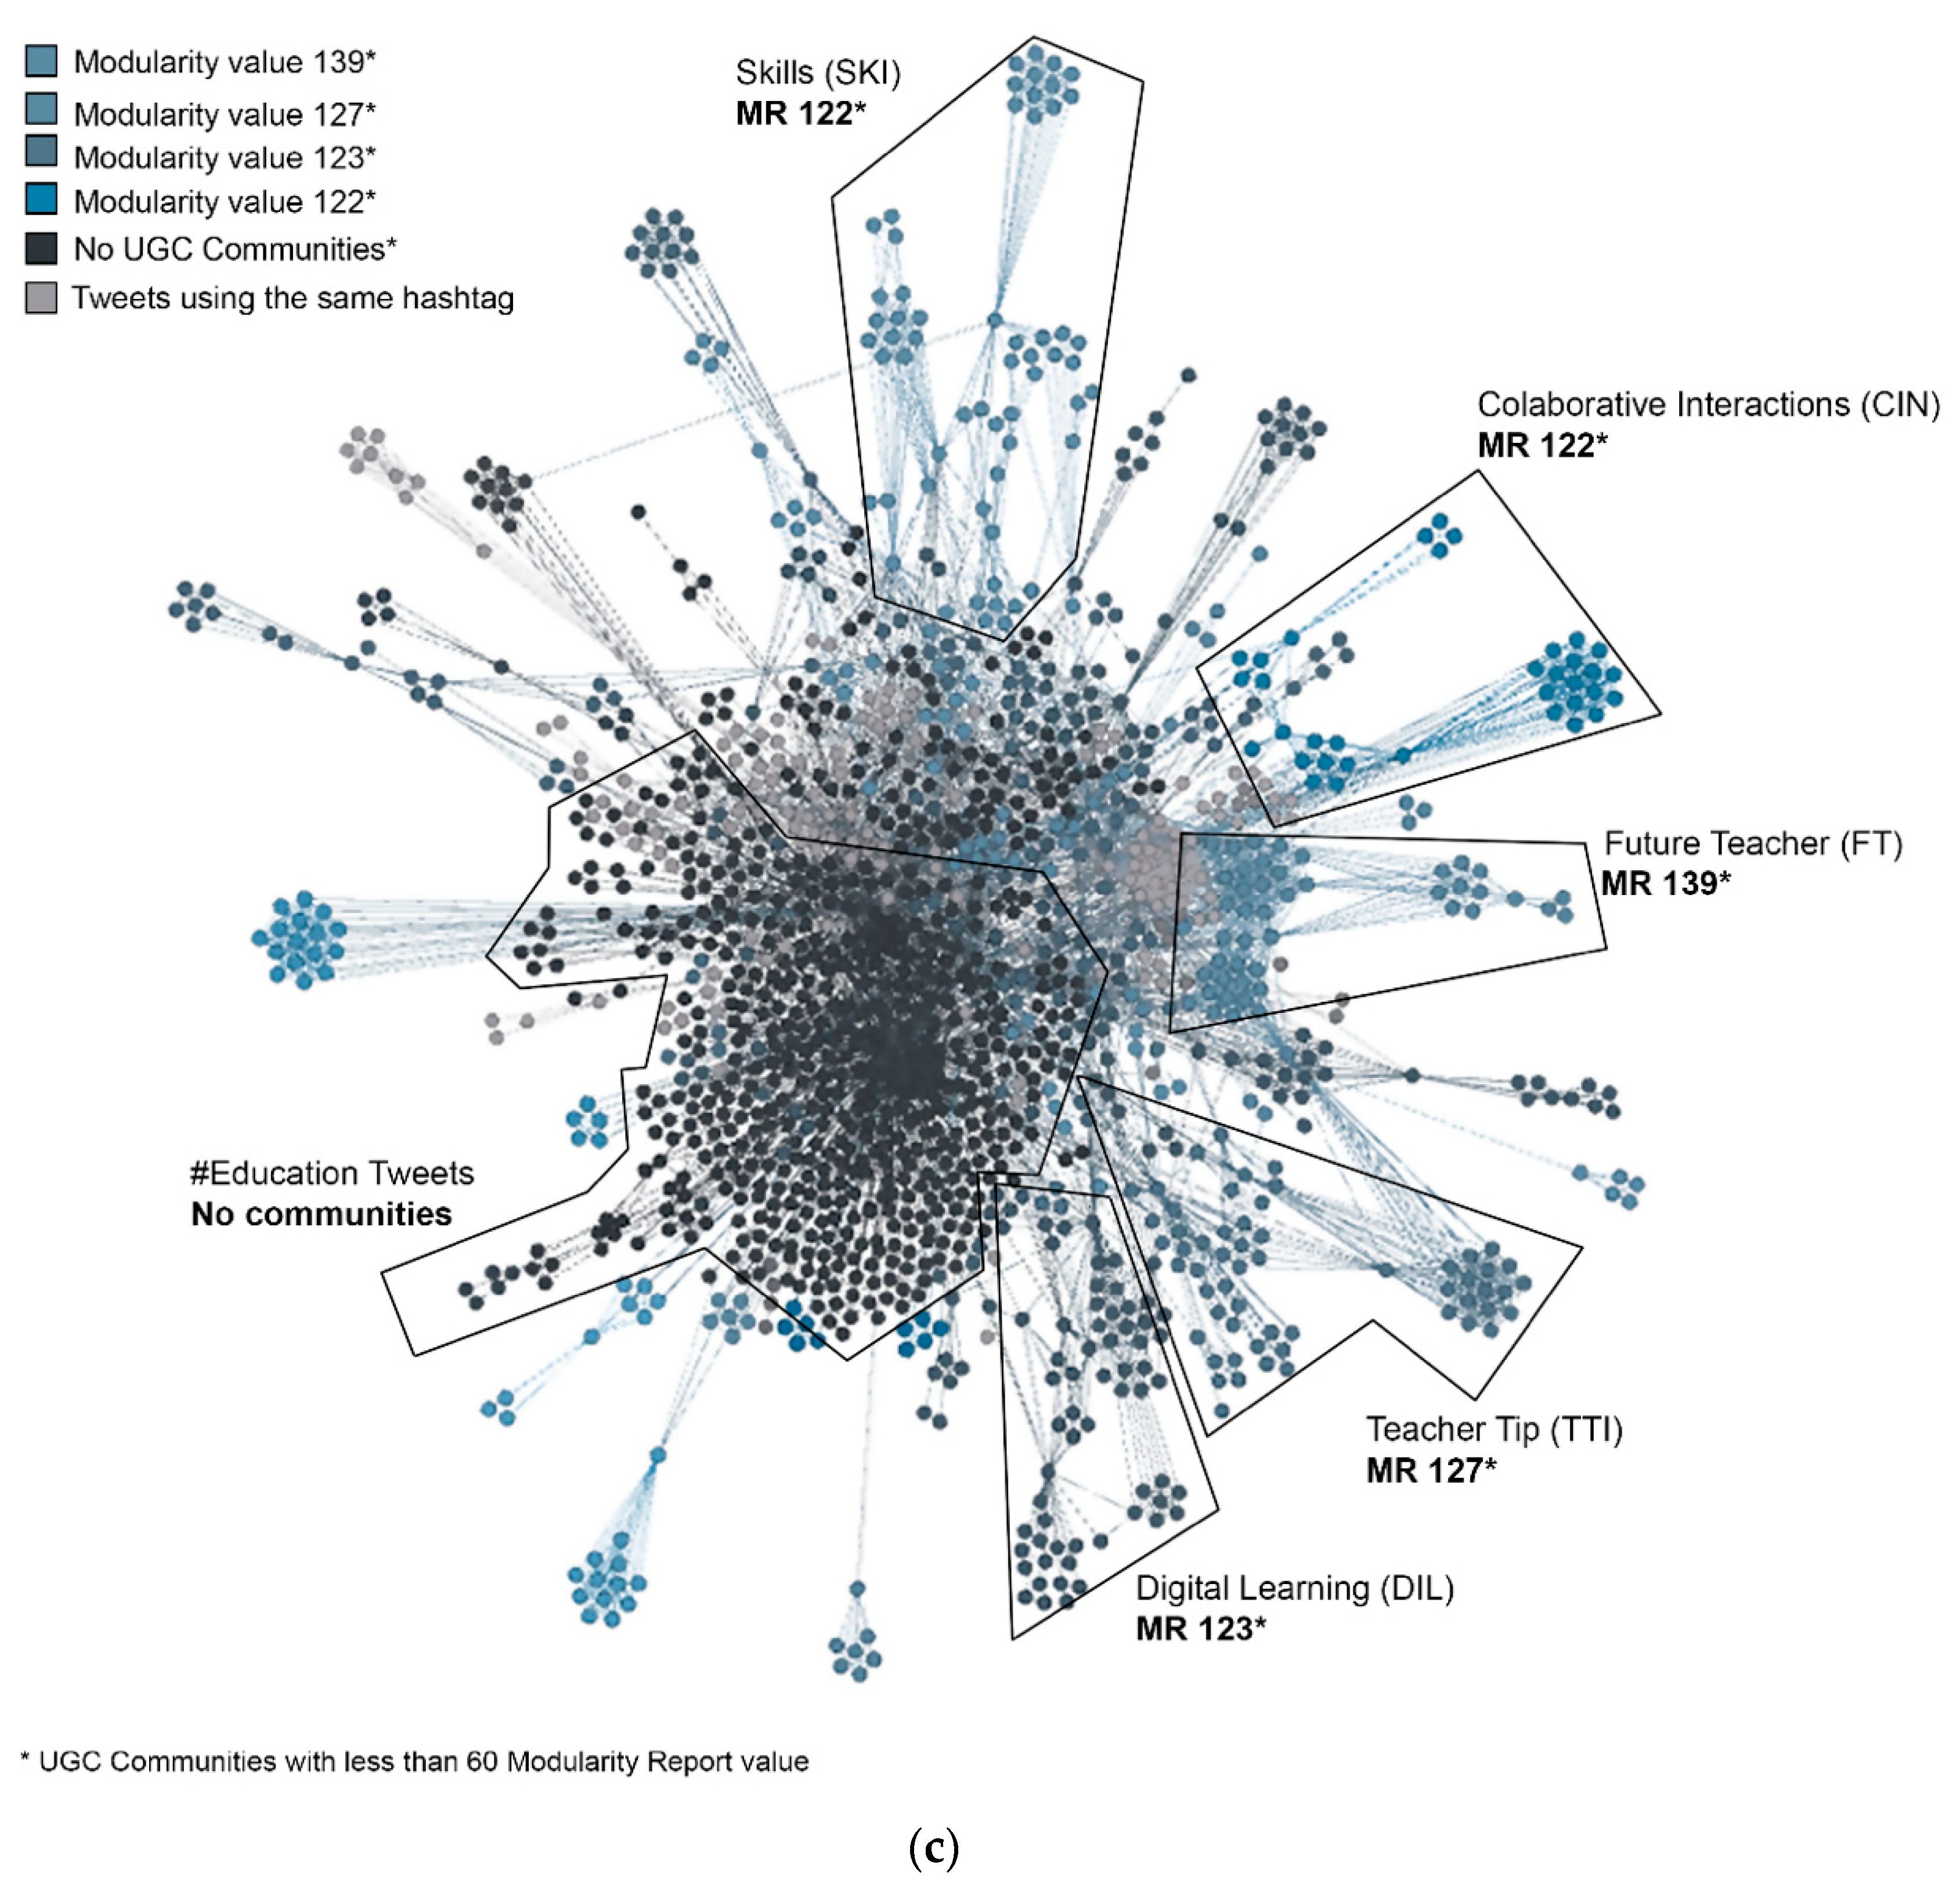
In Figure 4c, it is easier to visually understand what the MMC and MiMC values of each community are, as well as their labeling in colors or names. The idea is that according to objective-specific research aims, the researcher increases the resolution of the algorithm to find the most relevant communities. Once identified, different labels can be added in chronological order, by MR, or engagement level. It is also be possible to visually sort the network of nodes based on the number of nodes (active actors in social networks) that make up each community, regardless of the MR obtained in the analysis.
In this study, while applying the Lambiotte et al. algorithm [37] made it possible to identify a total of 978 UGC communities, in this iteration only those linked to innovation in education were selected, eliminating any that obscure the results by adding noise or that have been mistakenly identified as being related to education but really are not, using the resolution level of 0.1 points.
Once graphs or figures are created, researchers can increase the resolution to label each community one by one and display a specific topic or name in a tag cloud, or make a table showing the most relevant communities (see, e.g., Table 6 [36]).
When a topic goes viral on Twitter, there are usually no communities of UGC [6], as users tend to participate only once or twice. When an opinion or influencer raises a question or requests participation in an initiative, UGC communities may be established around the initiative, where users comment and participate repeatedly, which appears as engagement with that topic. For instance, Figure 4 shows different UGC communities focused on innovation in education. Likewise, the number of nodes within each community can be shown along with values for MR. Researchers can manipulate the graphics to visually show the objectives they want to focus on [37].
Using the same datasets, it is possible to generate contrasting but complementary results. In this study the main communities identified by their connection to innovation in education were selected based on their subject matter and their weight. In this case they are: future teacher (FT), teacher tip (TTI), collaborative interactions (CIN), digital learning (DIL) and skills (SKI). Having identified the communities, it is now possible to compare and analyze them.
4. Discussion
The knowledge extraction process identified five topics, of which three were positive, one negative, and one neutral. The analysis identified a subject related to IT with comments regarding learning models based on new teaching innovation processes (see McLoughlin and Lee [66]). This topic was graded as positive based on the diversity of positive opinions related to the improvement of teaching processes based on innovation.
Likewise, DLE also had a positive sentiment rating from positive comments grouped around new social networks and platforms that aim to teach and improve education through technology in digital environments, as confirmed by other research such as Quercia et al. (2012) [67] and Sluban et al. [68]. DIE was a positive topic characterized by the communication between equal parts through digital environments based on innovation. In summary, such results, and the specific insights, should enable teachers to use these features to improve teaching approaches as in Williamson and Piattoeva et al. [30].
With regard to TTE, a neutral sentiment was obtained for a subject composed mainly of tutorials and tricks for using educational tools on the Internet. The sentiment was neutral because of the diversity of comments regarding the user experience or improvements of the tools themselves (see Saura et al. [38]). A negative sentiment was obtained for STIs, a topic associated with a gap in the teachers’ technological skills, particularly their ability to teach based on learning methods in innovation. This result was generally in line with those of Brush et al. [69]. In sum, the main insights that can be drawn from these themes according to sentiment analysis ranked in order of weight are summarized in Table 3 above [2].
If these results are compared with the visualization approach of communities within the same topics and with the same sample, it is clear that one of the topics with higher modularity is education itself, followed by the communities summarized in Table 6. Note that five of these communities coincide, in part, with the topics identified as a result of the LDA. The first, FT, is a community with interactions related to the future teachers and their future in digital society. Likewise, a community was found with a modularity of 127 points that deals with advice for teachers linked to education and technological tools was labeled TTI.
Another community with a modularity of 123 points was labelled CIN where opinions, experiences, and learning center activities are shared, and feedback communicated. There is also a community based exclusively on digital education, labelled DIL. Finally, a community speaking specifically about teachers′ abilities was identified as SKI.
The communities and issues identified here indicate that future teachers should be proficient in digital communications coinciding with other researchers who propose these lines of research for the future such as Jongbloed et al. [25]. Moreover, as stated by Bonk [70], their communications in collaborative, interactive digital ecosystems should be supported by digital education platforms.
The visualization of data allowed for a detailed understanding of a number of communities on Twitter built around the same topic and that all are linked. Some, however, are more relevant than others and allow the extraction of more industry-specific insights. In addition, visualization of the communities allows for a more granular understanding of their relative importance, their interactions with one another, and how they are related [2].
The visualization of these communities of UGC highlights the importance of social networks for the discovery and extraction of knowledge (see also Goh et al. [71] or Yannopoulou et al. [72]).
Likewise, if we consider the identified communities as topics of users’ interest, educational organizations or institutions can focus their content generation strategies on these topics, since the interest of users has been verified through the communities according to the interactions and communications of users [71,72].
5. Conclusions
This research developed two distinct processes for extracting information-based knowledge from a database composed of Twitter tweets. In conducting this analysis, it became clear that the study of UGC can lead to valuable insight that should make it possible to enhance and improve strategies for any organization involved in this area of enterprise.
This research outlined different study topics for the education sector applying technologies based on data visualization and data mining. First, an LDA was used to organize samples of tweets into topics, then a SA was applied to these results. The sentiment analysis algorithm was trained with machine learning and data mining processes to obtain an adequate KAV that allows for the analysis of reliable results. Then, an approximation was made with data mining to extract insights and to discover knowledge from the dataset. Next, data visualization algorithms were applied to identify communities, which helped to establish themes linked to education and identify those that contribute to knowledge [73]. This research may also improve understanding of how the networks of nodes and communities exist through UGC publication. This analysis shows that communities can be identified and studied in social networks.
With respect to RQ1, we have demonstrated that it is possible to identify short-term trends for the education sector by analyzing UGC on Twitter under the #Education hashtag, thus showing the effective application of knowledge discovery techniques in UGC. Likewise, insights have been obtained regarding the education sector specifically to which an analysis of sentiment has been applied in the discovered topics (RQ2). This fact allows us to better understand positive, negative, and neutral sentiments held by identified UGC communities regarding specific trends in the education sector, such as tools, capacities, skills, or new development perspectives.
Finally, we have successfully detected user communities that publish UGC on Twitter around the same content theme (RQ3). The relevance of such communities and their interconnectedness has been demonstrated through visualization of nodes. Such analysis and visualization techniques can be used by researchers and educational institutions, e.g., in training courses focused on key topics for teachers. There is also scope to improve skill-sets and to highlight the reasons to be active members of online communities.
The important new contribution of the present study is the application of the Blondel et al.’s [36] algorithm to Twitter UGC to generate useful and actionable insights. The education sector is used as an example of how the technique can be used, and the results generate insights related to innovative education trends that practitioners in the industry can use to improve marketing strategies and refine analyses of markets related to education. An important theoretical implication of the processes outlined is the identification of ten topics directly linked to innovation and education.
5.1. Theoretical Implications
As indicated, an important new theoretical implication is the study of the ten topics directly linked to the innovation and education sectors discovered in the UGC. These are specific results of the first process: innovative teaching (IT); tutorials and tips for teaching (TTE); digital teaching and learning (DLE); innovative teaching skills (ITS), and digital interaction and engagement (DIE). The results of the second process include future teacher (FT); teacher tip (TTI); collaborative interactions (CIN); digital learning (DIL), and skills (SKI).
If researchers could take these insights as variables and constructs for their models, they may be able to enhance their understanding of whether positive links exist between them by developing, for example, models based on partial least squares structural equation modeling (PLS-SEM) or SPSS, analysis of moment structures (AMOS) among others, thus contributing to a field of research that emerges from approaches that extract information-based knowledge from large amounts of data. Academics could use these topics in the future in their studies in order to measure the influence they have on teaching innovation, teaching skills, or teaching skills based on new technologies.
Also, academics can use this research to better understand the education sector and to focus on the development of research within the field by focusing on the discovered topics. In addition, they can also focus on content analysis by users of different social networks to better understand what the main habits are when sharing information publicly in digital ecosystems.
5.2. Practical Implications
Companies or centers of higher education such as universities or postgraduate centers can use the results of this research to enhance teacher training in the areas that were identified with a high MR. Likewise, educational institutions can use this research to implement knowledge extraction methodologies and thus understand UGC data generated in their own areas.
Further, practitioners can use the research results to improve those areas of teacher education that were identified as key elements for innovation.
Likewise, non-profit institutions or associations that want to improve the future of education, such as focusing on technology or new generations, can use this research to get ideas for their educational communication and marketing plans.
5.3. Limitations and Future Research
The limitations of the research are related to the size of the sample and the time horizon analyzed, as well as the credibility of the UGC limited to the Twitter social network. This study can be expanded by focusing on the combined study of several social networks in which a GCE is shared, such as Facebook, Instagram, YouTube, TripAdvisor, or Booking.com. In addition, there are also limitations regarding the number of methodologies used and the approximations carried out by researchers according to the number of findings consulted to carry out this study. In the present study, because of the chosen analysis techniques, we analyzed only the text, excluding emoticons. Therefore, in future research, it would be necessary to use mixed analysis methods based on NLP and iconographic methods so as to enrich the results.
In addition, the use of SVM that work with machine learning must be taken into account; a technique that is constantly improving and that may have failures in measuring the results as it improves over time and the number of samples trained. Finally, within the developed processes of LDA and TA there are exploratory steps analyzed manually by the researchers that could have implied some failure in the measurement or analysis.
Author Contributions
Conceptualization, J.R.S., A.R.-M. and D.R.B.; Methodology, J.R.S.; Software J.R.S.; Formal Analysis, A.R.-M. and D.R.B.; Investigation, J.R.S., A.R.-M. and D.R.B; Data Curation, J.R.S. and A.R.-M.; Writing—Original Draft Preparation, J.R.S., A.R.-M. and D.R.B.; Writing—Review & Editing, J.R.S., A.R.-M. and D.R.B.; Visualization, J.R.S.; Supervision, J.R.S., A.R.-M. and D.R.B.
Funding
This research received no external funding.
Acknowledgments
This article is a scientific result of the contract signed under the protection of Article 83 signed between the Rey Juan Carlos University and the Institute of Business Executives (IDE-CESEM) with reference code 2019/00054/001 entitled: “Los nuevos retos e la formación de postgraodo (on line) en el ámbito de la economía de la empresa y el marketing”.
Conflicts of Interest
The authors declare no conflict of interest.
References
- Reyes-Menendez, A.; Saura, J.R.; Martinez-Navalon, J.G. The impact of e-WOM on Hotels Management Reputation: Exploring TripAdvisor Review Credibility with the ELM model. IEEE Access 2019, 8. [Google Scholar] [CrossRef]
- Saura, J.R.; Bennett, D.R. A Three-Stage method for Data Text Mining: Using UGC in Business Intelligence Analysis. Symmetry 2019, 11, 519. [Google Scholar] [CrossRef]
- Matta, J.; Obafemi-Ajayi, T.; Borwey, J.; Sinha, K.; Wunsch, D.; Ercal, G. Node-Based Resilience Measure Clustering with Applications to Noisy and Overlapping Communities in Complex Networks. Appl. Sci. 2018, 8, 1307. [Google Scholar] [CrossRef]
- Wiemer, H.; Drowatzky, L.; Ihlenfeldt, S. Data Mining Methodology for Engineering Applications (DMME)—A Holistic Extension to the CRISP-DM Model. Appl. Sci. 2019, 9, 2407. [Google Scholar] [CrossRef]
- Van den Broek-Altenburg, E.M.; Atherly, A.J. Using Social Media to Identify Consumers’ Sentiments towards Attributes of Health Insurance during Enrollment Season. Appl. Sci. 2019, 9, 2035. [Google Scholar] [CrossRef]
- Herráez, B.; Bustamante, D.; Saura, J.R. Information classification on social networks. Content analysis of e-commerce companies on Twitter. Rev. Espac. 2017, 38, 16. [Google Scholar]
- Saura, J.R.; Rodriguez Herráez, B.; Reyes-Menendez, A. Comparing a traditional approach for financial Brand Communication Analysis with a Big Data Analytics technique. IEEE Access 2019, 7. [Google Scholar] [CrossRef]
- Barbu, M.; Vilanova, R.; Vicario, J.; Pereira, M.J.; Alves, P.; Podpora, M.; Fontana, L. Data mining tool for academic data exploitation: Publication report on engineering students profiles. ESTiG-Relatórios Técnicos/Científicos 2019. [Google Scholar]
- Siemens, G.; Baker, R.S.J. DLearning analytics and educational data mining: Towards communication and collaboration. In Proceedings of the 2nd International Conference on Learning Analytics and Knowledge, Vancouver, BC, Canada, 29 April–2 May 2019; pp. 252–254. [Google Scholar]
- Wang, Y.; Youn, H.Y. Feature Weighting Based on Inter-Category and Intra-Category Strength for Twitter Sentiment Analysis. Appl. Sci. 2019, 9, 92. [Google Scholar] [CrossRef]
- Reyes-Menendez, A.; Saura, J.R.; Alvarez-Alonso, C. Understanding# World Environment Day User Opinions in Twitter: A Topic-Based Sentiment Analysis Approach. Int. J. Environ. Res. Public Health. 2018, 15, 2537. [Google Scholar] [CrossRef]
- Reyes-Menendez, A.; Saura, J.R.; Palos-Sanchez Alvarez, J.M. Understanding User Behavioral Intention to adopt a Search Engine that promotes Sustainable Water Management. Symmetry 2018, 10, 584. [Google Scholar] [CrossRef]
- Romero, C.; Ventura, S. Educational data mining: A review of the state of the art. IEEE Trans. Syst. Man Cybern. Part C 2010, 40, 601–618. [Google Scholar] [CrossRef]
- Glaser, R. Education and thinking: The role of knowledge. Am. Psychol. 1984, 39, 93. [Google Scholar] [CrossRef]
- George, E.S. Positioning higher education for the knowledge based economy. High. Educ. 2006, 52, 589–610. [Google Scholar] [CrossRef]
- Bennett, D.; Yábar, D.P.B.; Saura, J.R. University Incubators May Be Socially Valuable, but How Effective Are They? A Case Study on Business Incubators at Universities. In Entrepreneurial Universities. Innovation, Technology, and Knowledge Management; Peris-Ortiz, M., Gómez, J., Merigó-Lindahl, J., Rueda-Armengot, C., Eds.; Springer: Cham, Switzerland, 2017. [Google Scholar] [CrossRef]
- Shelton, M.W.; Lane, D.R.; Waldhart, E.S. A review and assessment of national educational trends in communication instruction. Commun. Educ. 1999, 48, 228–237. [Google Scholar] [CrossRef]
- Reyes, J.A. The skinny on big data in education: Learning analytics simplified. TechTrends 2015, 59, 75–80. [Google Scholar] [CrossRef]
- Anshari, M.; Alas, Y.; Sabtu, N.P.H.; Hamid, M.S.A. Online Learning: Trends, issues and challenges in the Big Data Era. J. e-Learn. Knowl. Soc. 2016, 12. [Google Scholar]
- Huda, M.; Maseleno, A.; Atmotiyoso, P.; Siregar, M.; Ahmad, R.; Jasmi, K.; Muhamad, N. Big data emerging technology: Insights into innovative environment for online learning resources. Int. J. Emerg. Technol. Learn. 2018, 13, 23–36. [Google Scholar] [CrossRef]
- Sin, K.; Muthu, L. Application of Big Data in Education Data Mining and Learning Analytics—A Literature Review. ICTACT J. Soft Comput. 2015, 5. [Google Scholar] [CrossRef]
- Pang, B.; Lee, L. A sentimental education: Sentiment analysis using subjectivity summarization based on minimum cuts. In Proceedings of the 42nd annual meeting on Association for Computational Linguistics, Barcelona, Spain, 21–26 July 2004; p. 271. [Google Scholar]
- Kogan, M. Higher education communities and academic identity. High. Educ. Q. 2000, 54, 207–216. [Google Scholar] [CrossRef]
- Jongbloed, B.; Enders, J.; Salerno, C. Higher education and its communities: Interconnections, interdependencies and a research agenda. High. Educ. 2008, 56, 303–324. [Google Scholar] [CrossRef]
- La Velle, L.; Kendall, A. Building Research-Informed Teacher Education Communities: A UCET Framework. Profession 2019, 18, 19. [Google Scholar]
- Reyes-Menendez, A.; Saura, J.R.; Filipe, F. The importance of behavioral data to identify online fake reviews for tourism businesses: A systematic review. PeerJ Comput. Sci. 2019, 5, e219. [Google Scholar] [CrossRef]
- Baker, R.S.J.D. Data mining for education. Int. Encycl. Educ. 2010, 7, 112–118. [Google Scholar]
- Alban, M.; Mauricio, D. Predicting University Dropout through Data Mining: A Systematic Literature. Indian J. Sci. Technol. 2019, 12, 4. [Google Scholar] [CrossRef]
- Williamson, B.; Piattoeva, N. Objectivity as standardization in data-scientific education policy, technology and governance. Learn. Media Technol. 2019, 44, 64–76. [Google Scholar] [CrossRef]
- Zou, X.; Zou, S.; Wang, X. New Approach of Big Data and Education: Any Term Must Be in the Characters Chessboard as a Super Matrix. In Proceedings of the 2019 International Conference on Big Data and Education, Bangkok, Thailand, 14–16 September 2019; pp. 129–134. [Google Scholar]
- Daniel, B.K. Big Data and data science: A critical review of issues for educational research. Br. J. Educ. Technol. 2019, 50, 101–113. [Google Scholar] [CrossRef]
- Krippendorff, K. Bivariate Agreement Coefficients for Reliability Data. Sociol. Methodol. 1970, 2, 139–150. [Google Scholar] [CrossRef]
- Krippendorff, K. Measuring the reliability of qualitative text analysis data. Qual. Quant. 2004, 38, 787–800. [Google Scholar] [CrossRef]
- Saura, J.R.; Reyes-Menendez, A.; Alvarez-Alonso, C. Do online comments affect environmental management? Identifying factors related to environmental management and sustainability of hotels. Sustainability 2018, 10, 3016. [Google Scholar] [CrossRef]
- Blondel, V.D.; Guillaume, J.; Lambiotte, R.; Lefebvre, E. Fast unfolding of communities in large networks. J. Stat. Mech. 2008, 2008. [Google Scholar] [CrossRef]
- Lambiotte, R.; Delvenne, J.C.; Barahona, M. Random walks, Markov processes and the multiscale modular organization of complex networks. IEEE Trans. Netw. Sci. Eng. 2014, 1, 76–90. [Google Scholar] [CrossRef]
- Saura, J.R.; Reyes-Menendez, A.; Palos-Sanchez, P. Are Black Friday Deals Worth It? Mining Twitter Users’ Sentiment and Behavior Response. J. Open Innov. 2019, 5, 58. [Google Scholar]
- Sherman, K.J.; Cherkin, D.C.; Erro, J.; Miglioretti, D.L.; Deyo, R.A. Comparing yoga, exercise, and a self-care book for chronic low back pain: A randomized, controlled trial. Ann. Intern. Med. 2005, 143, 849–856. [Google Scholar] [CrossRef] [PubMed]
- Banerjee, S.; Chua, A.Y.; Kim, J. Using supervised learning to classify authentic and fake online reviews. In Proceedings of the 9th International Conference on Ubiquitous Information Management and Communication—IMCOM, Bali, Indonesia, 8–10 January 2015. [Google Scholar]
- Saura, J.R.; Palos-Sanchez, P.R.; Grilo, A. Detecting Indicators for Startup Business Success: Sentiment Analysis using Text Data Mining. Sustainability 2019, 15, 553. [Google Scholar] [CrossRef]
- Bifet, A.; Frank, E. Sentiment knowledge discovery in twitter streaming data. In Proceedings of the International Conference on Discovery Science, Canberra, Australia, 6–8 October 2010. [Google Scholar]
- Lai, L.S.; To, W.M. Content analysis of social media: A grounded theory approach. J. Electron. Commer. Res. 2015, 16, 138. [Google Scholar]
- Pritchard, J.K.; Stephens, M.; Donnelly, P. Inference of population structure using multilocus genotype data. Genetics 2000, 155, 945–959. [Google Scholar]
- Blei, D.M.; Ng, A.Y.; Jordan, M.I.; Lafferty, J. Latent Dirichlet Allocation. J. Mach. Learn. Res. 2003, 3, 993–1022. [Google Scholar]
- Jia, S. Leisure Motivation and Satisfaction: A Text Mining of Yoga Centres, Yoga Consumers, and Their Interactions. Sustainability 2018, 10, 4458. [Google Scholar] [CrossRef]
- Saif, H.; Fernandez, M.; He, Y.; Alani, H. Evaluation datasets for Twitter sentiment analysis: A survey and a new dataset, the STS-Gold. In Proceedings of the 1st Interantional Workshop on Emotion and Sentiment in Social and Expressive Media: Approaches and Perspectives from AI (ESSEM 2013), Turin, Italy, 3 December 2013. [Google Scholar]
- Pang, B.; Lee, L. Opinion mining and sentiment analysis. Found. Trends® Inf. Retr. 2008, 2, 1–135. [Google Scholar] [CrossRef]
- Saura, J.R.; Reyes-Menendez, A.; Filipe, F. Comparing Data-Driven Methods for Extracting Knowledge from User Generated Content. J. Open Innov. Technol. Mark. Complex. 2019, 5, 74. [Google Scholar] [CrossRef]
- Krippendorff, K. (Ed.) Reliability Chapter 11. In Content Analysis; An Introduction to its Methodology, 2nd ed.; Sage Publications: Thousand Oaks, CA, USA, 2004; pp. 211–256. [Google Scholar]
- Krippendorff, K. Content Analysis: An Introduction to Its Methodology, 3rd ed.; Sage: Thousand Oaks, CA, USA, 2013; pp. 221–250. [Google Scholar]
- Gil, M.; El Sherif, R.; Pluye, M.; Fung, B.C.; Grad, R.; Pluye, P. Towards a Knowledge-Based Recommender System for Linking Electronic Patient Records with Continuing Medical Education Information at the Point of Care. IEEE Access 2019, 7, 15955–15966. [Google Scholar] [CrossRef]
- Al-Rahmi, W.M.; Yahaya, N.; Aldraiweesh, A.A.; Alturki, U.; Alamri, M.M.; Saud, M.S.B.; Alhamed, O.A. Big Data Adoption and Knowledge Management Sharing: An Empirical Investigation on Their Adoption and Sustainability as a Purpose of Education. IEEE Access 2019, 7, 47245–47258. [Google Scholar] [CrossRef]
- Fernandes, E.; Holanda, M.; Victorino, M.; Borges, V.; Carvalho, R.; Van Erven, G. Educational data mining: Predictive analysis of academic performance of public school students in the capital of Brazil. J. Bus. Res. 2019, 94, 335–343. [Google Scholar] [CrossRef]
- West, D.M. Big data for education: Data mining, data analytics, and web dashboards. Gov. Stud. Brook. 2012, 4. [Google Scholar]
- Jabreel, M.; Moreno, A. A Deep Learning-Based Approach for Multi-Label Emotion Classification in Tweets. Appl. Sci. 2019, 9, 1123. [Google Scholar] [CrossRef]
- Saura, J.R.; Palos-Sanchez, P.; Blanco-González, A. The importance of information service offerings of collaborative CRMs on decision-making in B2B marketing. J. Bus. Ind. Mark. 2019. ahead-of-print(ahead-of-print). [Google Scholar] [CrossRef]
- Vassileva, J. Toward social learning environments. IEEE Trans. Learn. Technol. 2008, 1, 199–214. [Google Scholar] [CrossRef]
- Novak, J.; Wurst, M. Collaborative knowledge visualization for cross-community learning. In Knowledge and Information Visualization; Springer: Berlin/Heidelberg, Germany, 2005; pp. 95–116. [Google Scholar]
- Chen, B.J.; Ting, I.H. Applying social networks analysis methods to discover key users in an interest-oriented virtual community. In 7th International Conference on Knowledge Management in Organizations: Service and Cloud Computing; Springer: Berlin/Heidelberg, Germany, 2013; pp. 333–344. [Google Scholar]
- Tsvetovat, M.; Kouznetsov, A. Social Network Analysis for Startups: Finding Connections on the Social Web; O’Reilly Media, Inc.: Sevastopol, CA, USA, 2011. [Google Scholar]
- Wilson, T.; Wiebe, J.; Hoffmann, P. Recognizing contextual polarity in phrase-level sentiment analysis. In Proceedings of the Human Language Technology Conference and Conference on Empirical Methods in Natural Language Processing, Lisboa, Portugal, 17 September 2005. [Google Scholar]
- Mazzoni, E. Social Network Analysis to support interactions in virtual communities for the construction of knowledge. Ital. J. Educ. Technol. 2005, 13, 54. [Google Scholar]
- Liu, B. Sentiment Analysis and Subjectivity. Handb. Nat. Lang. Process. 2010, 2, 627–666. [Google Scholar]
- Liu, B.; Zhang, L. A survey of opinion mining and sentiment analysis. In Mining Text Data; Springer: Boston, MA, USA, 2012; pp. 415–463. [Google Scholar]
- McLoughlin, C.; Lee, M. Mapping the digital terrain: New media and social software as catalysts for pedagogical change. Ascilite Melb. 2008, 12, 641–652. [Google Scholar]
- Quercia, D.; Ellis, J.; Capra, L.; Crowcroft, J. Tracking gross community happiness from tweets. In Proceedings of the ACM 2012 Conference on Computer Supported Cooperative Work, Washington, DC, USA, 11–15 February 2012. [Google Scholar]
- Sluban, B.; Smailović, J.; Battiston, S.; Mozetič, I. Sentiment leaning of influential communities in social networks. Comput. Soc. Netw. 2015, 2, 9. [Google Scholar] [CrossRef] [Green Version]
- Brush, T.; Glazewski, K.D.; Hew, K.F. Development of an instrument to measure preservice teachers’ technology skills, technology beliefs, and technology barriers. Comput. Sch. 2008, 25, 112–125. [Google Scholar] [CrossRef]
- Bonk, C.J. The World is Open: How Web Technology is Revolutionizing Education; Association for the Advancement of Computing in Education (AACE): Morgantown, WV, USA, 2009; pp. 3371–3380. [Google Scholar]
- Goh, K.Y.; Heng, C.S.; Lin, Z. Social media brand community and consumer behavior: Quantifying the relative impact of user-and marketer-generated content. Inf. Syst. Res. 2013, 24, 88–107. [Google Scholar] [CrossRef]
- Yannopoulou, N.; Moufahim, M.; Bian, X. User-generated brands and social media: Couchsurfing and AirBnb. Contemp. Manag. Res. 2013, 9. [Google Scholar] [CrossRef]
- Christensen, C.M.; Eyring, H.J. The Innovative University: Changing the DNA of Higher Education from the Inside Out; John Wiley & Sons: Hoboken, NJ, USA, 2011. [Google Scholar]
- Pereira, E.T.; Villas-Boas, M.; Rebelo, C.C. Does Entrepreneurship and Innovative Education Matter to Increase Employability Skills?: A Framework Based on the Evidence From Five European Countries. In Global Considerations in Entrepreneurship Education and Training; IGI Global: Hershey, PA, USA, 2019; pp. 218–231. [Google Scholar]
Figure 1.
Process of sentiment analysis (SA). Source: Reproduced with permission from Saura and Bennett [2], Symmetry; published by MDPI, 2019.
Figure 1.
Process of sentiment analysis (SA). Source: Reproduced with permission from Saura and Bennett [2], Symmetry; published by MDPI, 2019.

Figure 2.
Text mining process. Source: Reproduced with permission from Saura and Bennett [2], Symmetry; published by MDPI, 2019.
Figure 2.
Text mining process. Source: Reproduced with permission from Saura and Bennett [2], Symmetry; published by MDPI, 2019.

Figure 3.
Community visual identification. Source: Reproduced with permission from Matta et al. [3], Applied Sciences; published by MDPI, 2018.
Figure 3.
Community visual identification. Source: Reproduced with permission from Matta et al. [3], Applied Sciences; published by MDPI, 2018.

Figure 4.
(a) Communities visualization resolution 1 (b) Modularity report communities visualization resolution 2 (c) Modularity report communities visualization. Source: The authors.
Figure 4.
(a) Communities visualization resolution 1 (b) Modularity report communities visualization resolution 2 (c) Modularity report communities visualization. Source: The authors.


Table 1.
Mean latent Dirichlet allocation (LDA) topics results description.
| Nº | Name | Description | Sentiment |
|---|---|---|---|
| 1 | Innovative teaching (IT) | Learning models based on new teaching innovation processes. | Positive |
| 2 | Tutorials and tips for teaching (TTE) | Tutorials and tips for new tools for teaching. | Neutral |
| 3 | Digital teaching and learning (DLE) | New platforms related to education in digital environments. | Positive |
| 4 | Innovative teaching skills (ITS) | Skills related to new information technologies for teaching and tutoring. | Negative |
| 5 | Digital interaction and engagement (DIE) | Thematic linked to engagement and the reciprocal connection of communication through digital environments in the field of education. | Positive |
Table 2.
LDA topics results description.
| Conclusion Reliability | Krippendorff’s Alpha Value | This Research Study | Average KAV |
|---|---|---|---|
| High | α ≥ 0.800 | Positive Sentiment | 0.876 |
| Tentative | α ≥ 0.667 | Negative Sentiment | 0.882 |
| Low | α < 0.667 | Neutral Sentiment | 0.641 |
Table 3.
LDA topics insight descriptions.
| Nº | Topic | Insight | Count | WP |
|---|---|---|---|---|
| 1 | IT | Innovative learning processes increase positive results in teaching. | 273 | 0.302 |
| 2 | TTE | Tutorials and tips on new teaching tools are a useful internet resource for teachers | 213 | 0.291 |
| 3 | DLE | The platforms for online education are an efficient resource for teachers. | 209 | 0.283 |
| 4 | ITS | There is a gap in the digital skills of teachers regarding the use of digital tools for teaching. | 179 | 0.209 |
| 5 | DIE | The communication between teachers on social networks is enriching and attracts new ideas and teaching tools. | 141 | 0.199 |
Table 4.
Modularity report (MR) communities’ measurements.
| Test | Communities | Modularity | MR * | Resolution | MMC * | MiMC * |
|---|---|---|---|---|---|---|
| 1 | 42 | 0.213 | 0.175 | 1.0 | 140 | 0 |
| 3 | 153 | 0.098 | −0.012 | 0.1 | 136 | 0 |
| 3 | 978 | 0.007 | −0.011 | 0.001 | 124 | 0 |
* MR—modularity resolution. * MMC—maximum modularity class. * MiMC—minimum modularity class.
Table 5.
Communities definition.
| Data Visualization Filters | Value |
|---|---|
| Threads number | 1 |
| Tolerance | 1.0 |
| Approximation | 0.1 |
| Scaling | 0.2 |
| Gravity | 1.0 |
| Prevent Overlap | True |
| Edge Weight Influence | 4.0 |
Table 6.
Outstanding communities around education and innovation according to MR results.
| Nº | Community | Modularity |
|---|---|---|
| 1 | GradStudent | 140 |
| 2 | Future Teacher (FT) | 139 * |
| 3 | School Reform | 139 |
| 4 | Wanna Be Teacher | 139 |
| 5 | Scholarships | 135 |
| 6 | Special Education | 131 |
| 7 | Teacher Tip (TTI) | 127 * |
| 8 | Teacher Hack | 125 |
| 9 | Education Spaces | 125 |
| 10 | Collaborative Interactions (CIN) | 122 * |
| 11 | Digital Learning (DIL) | 123 * |
| 12 | Education Reform | 123 |
| 13 | Skills (SKI) | 122 * |
* Communities highlighted for their links to education in innovation.
© 2019 by the authors. Licensee MDPI, Basel, Switzerland. This article is an open access article distributed under the terms and conditions of the Creative Commons Attribution (CC BY) license (http://creativecommons.org/licenses/by/4.0/).
Share and Cite
MDPI and ACS Style
Saura, J.R.; Reyes-Menendez, A.; Bennett, D.R. How to Extract Meaningful Insights from UGC: A Knowledge-Based Method Applied to Education. Appl. Sci. 2019, 9, 4603. https://doi.org/10.3390/app9214603
AMA Style
Saura JR, Reyes-Menendez A, Bennett DR. How to Extract Meaningful Insights from UGC: A Knowledge-Based Method Applied to Education. Applied Sciences. 2019; 9(21):4603. https://doi.org/10.3390/app9214603
Chicago/Turabian StyleSaura, Jose Ramon, Ana Reyes-Menendez, and Dag R. Bennett. 2019. "How to Extract Meaningful Insights from UGC: A Knowledge-Based Method Applied to Education" Applied Sciences 9, no. 21: 4603. https://doi.org/10.3390/app9214603
Note that from the first issue of 2016, this journal uses article numbers instead of page numbers. See further details here.