Time-Varying Reliability Evaluation of Concrete Based on Carbonation Depth


1
School of Civil Engineering, Guangzhou University, Guangzhou 510006, China
2
Department of Architecture and Building Engineering, Kanagawa University, Yokohama 2218686, Japan
3
College of Civil Engineering, Shenzhen University, Shenzhen 518060, China
*
Author to whom correspondence should be addressed.
Appl. Sci. 2019, 9(23), 5116; https://doi.org/10.3390/app9235116
Submission received: 31 October 2019
/
Revised: 14 November 2019
/
Accepted: 16 November 2019
/
Published: 26 November 2019
Abstract
:When studying concrete impairment, the carbonation depth of concrete is regarded to be variable. Therefore, a time-varying reliability evaluation is important to perform a structural safety assessment. By analyzing 13,198 data on the carbonation depth of concrete, we propose a time-varying reliability evaluation based on the third-moment (TM) method to predict the service life of concrete. Validated by Monte Carlo (MC) simulation, the errors of the calculated results using time-varying reliability evaluation were within 4%. It is shown that the TM method proposed in this paper is more practical than traditional approaches such as MC simulation and second-moment (SM) methods in probability analysis. In this paper, exponential distribution was used to characterize the distribution of carbonation depths. Since paint was present on the concrete surface, numerous uncarbonized concrete components were found in the experiments; to develop a time-varying model considering the uncarbonized components, a function for evaluating the ratio of carbonized concretes is proposed. Overall, the time-varying TM method provided in this paper can act as a foundation for other investigations on probabilistic analysis, e.g., of compressive strength, deflection, and crack of concrete, which can be used to evaluate the reliability of concrete.
1. Introduction
Reinforced concretes have been widely applied in structural engineering as building components, tunnel lining, retaining walls, etc. [1,2,3,4,5]. However, structure anomalies overwhelmingly increase under aggressive exposure conditions, and carbonation is one of the most fundamental triggers of steel corrosion in concrete [6,7].
Scientific experiments have been carried out to investigate the carbonation characteristics of concrete [8,9,10]. The multi-physics process of carbonation is complex [11,12,13,14,15], involving chemical reactions of CO2, gas–liquid two-phase flow, dispersion and diffusion of CO2 in water, and temperature propagation. Carbonation is mainly about the reaction of Ca(OH)2 with CO2 in the surrounding environment, which would reduce the pH of concrete, therefore exacerbating the corrosion of the reinforcing steel. Thus, the durability of most reinforced concrete structures is mainly governed by the carbonation rate.
Carbonation depth is a fundamental characteristic that is used to analyze the extent of carbonation-induced corrosion, which is employed to predict concrete service life. Therefore, some prediction models of carbonation depth are proposed [16,17,18,19,20]. In some existing prediction models, carbonation depth is deemed to be a function of the square root of time when carbonation-based corrosion reaches the reinforced steel bars and triggers their impairment [21]. For instance, Zhang proposed a mathematical model of carbonation depth for natural aggregate concrete (NAC) [19]. In order to predict carbonation depth of recycled aggregate concrete (RAC), Xiao investigated predicting functions based on Zhang’s model [22]. To evaluate the carbonation depth of concrete incorporating recycled aggregates, Silva developed a model in which several factors (mixture proportion of the specimen and environmental conditions) are considered [23]. However, most theoretical models are based on the analysis of accelerated carbonation experiments, which seldom consider the variations of material properties and climatic factors.
Due to variations associated with climatic factors (e.g., temperature and humidity), concrete materials properties and geometric configuration [24,25], it is physically impossible to evaluate carbonation depths precisely. Several studies have demonstrated that carbonation depth is characterized by significant dispersion [26,27]. Thus, probabilistic analyses are useful to quantify these unavoidable uncertainties. Hao proposed that the probability density functions of carbonation depth agree well with the lognormal distribution [26]. Meanwhile, Hao found that the average and variance augment with the increase of time. However, paint on the surface of concrete can protect a structure from carbonation-induced deterioration, which is seldom considered in the existing reliability models. Additionally, to acquire accurate results, the Monte Carlo (MC) simulation method is generally applied in probabilistic assessments. Nevertheless, this method has several obvious shortcomings, including the large sample sizes required for obtaining accurate results and the unwieldy size of the resulting data sets [28].
In this paper, most experimental components were found to be uncarbonized because of the presence of paint, and the number of uncarbonized concrete decreased over time. Besides, on the basis of the tested data (excluding uncarbonized concretes) with the service time ranging from 37 to 48 years, it was observed that the probability density function agreed well with the exponential distribution. Then, a model to compute the average of carbonation depth at different service years was developed, with the purpose of obtaining an effective time-varying reliability model. Since the carbonation depth is regarded as variable, a maintenance plan based on time-varying reliability (including the computation of failure probability and reliability index) is reasonable and practical.
To carry out a structural reliability analysis, the most fundamental step is to calculate the failure probability. Difficulty in calculating this probability has resulted in the development of diverse approximations, among which the moment methods [28]. Second-moment (SM) methods have universal applications in reliability assessments, but only the mean value and the standard of deviation are considered, producing inaccurate results. In addition, for some complicated performance functions, SM methods may not be generally used [29]. This paper proposes a more explicit model for computing the reliability index based on a third-moment (TM) method, which reflects the skew of a random variable effectively [28,30,31]. In MC tests, we confirmed that the TM method more accurately evaluates the reliability than an SM method.
Although reliability analyses have been well developed in recent years, few studies have predicted the concrete failure time from a reliability assessment. We suggest that the concrete failure time can be based on the concrete guaranteed rate which can be used to determine concrete quality.
2. Test Specimens and Experimental Result
Most of structural concretes are exposed to environmental factors that cause corrosion. In order to guarantee structural safety, regular testing of structural components are conducted in every three years. In this paper, all data were obtained from these testing and all tested components were NAC, taken from several constructions in Yokohama, Japan, where the average temperature and humidity were 15.208 °C and 69%, respectively. In this experiment, the specimens were cast into cement mortar cylinders 80 mm in diameter and 100 mm in height to measure the material properties. To investigate the carbonation depths of the components, the cylinders were cut into two halves, and the fresh cuts were polished and cleaned. Then, 1% phenolphthalein solution was sprinkled on the cuts to observe the non-carbonated area, identified by pink color, which also reflected the boundaries of carbonated and non-carbonated zones. The carbonation depths of the specimens were obtained by measuring the carbonated area. Each specimen was tested repeatedly 10 times, and the resulting test data were averaged together to improve the measurement precision, which resulted in an accuracy of 0.1 mm.
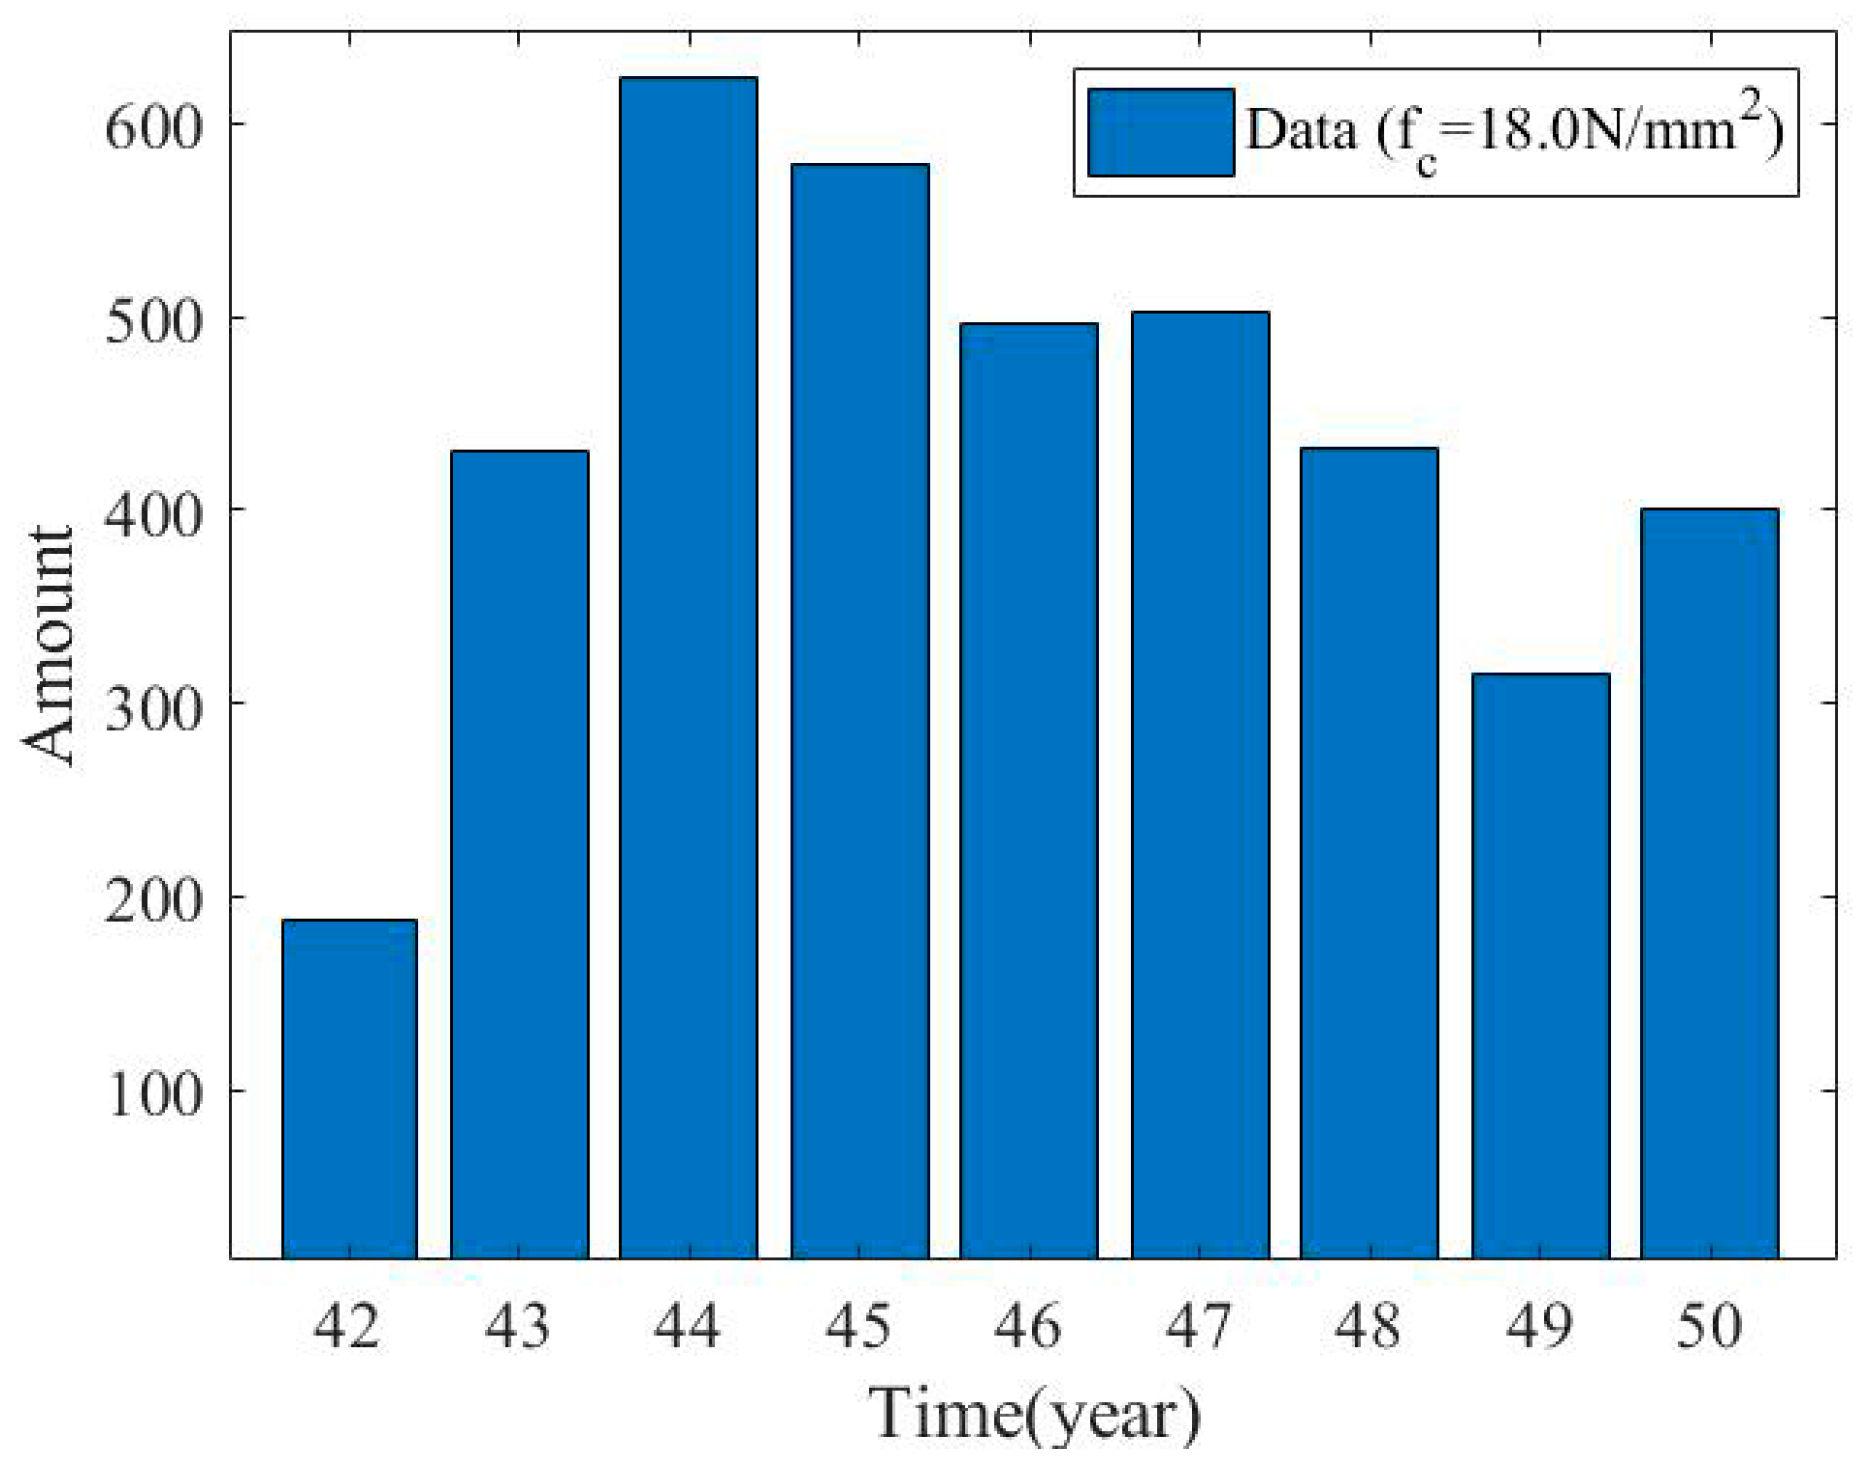
We obtained 13,198 tested data of carbonation depth from this experiment. Different from the investigations carried out in accelerated experiments, the specimens were taken from the natural environment. Therefore, the experimental results are more convincing, because the environmental factors were considered. In this paper, the data were divided into several groups according to different design values of concrete strength () and service ages, as shown in Figure 1 and Figure 2.
According to the experimental results, it was observed that a large number of specimens were uncarbonized. To investigate the initial carbonation rate, the data were divided into several groups according to and to whether the concrete was carbonized. Then, the ratio of carbonized concrete to uncarbonized concrete at different service ages was determined, as shown in Figure 3.
According to Figure 3, had a negligible effect on the carbonation rate, and the carbonation ratio increased over time. The relationship between carbonation rate (CR) and time (t) is expressed as:
where is the service age in years.
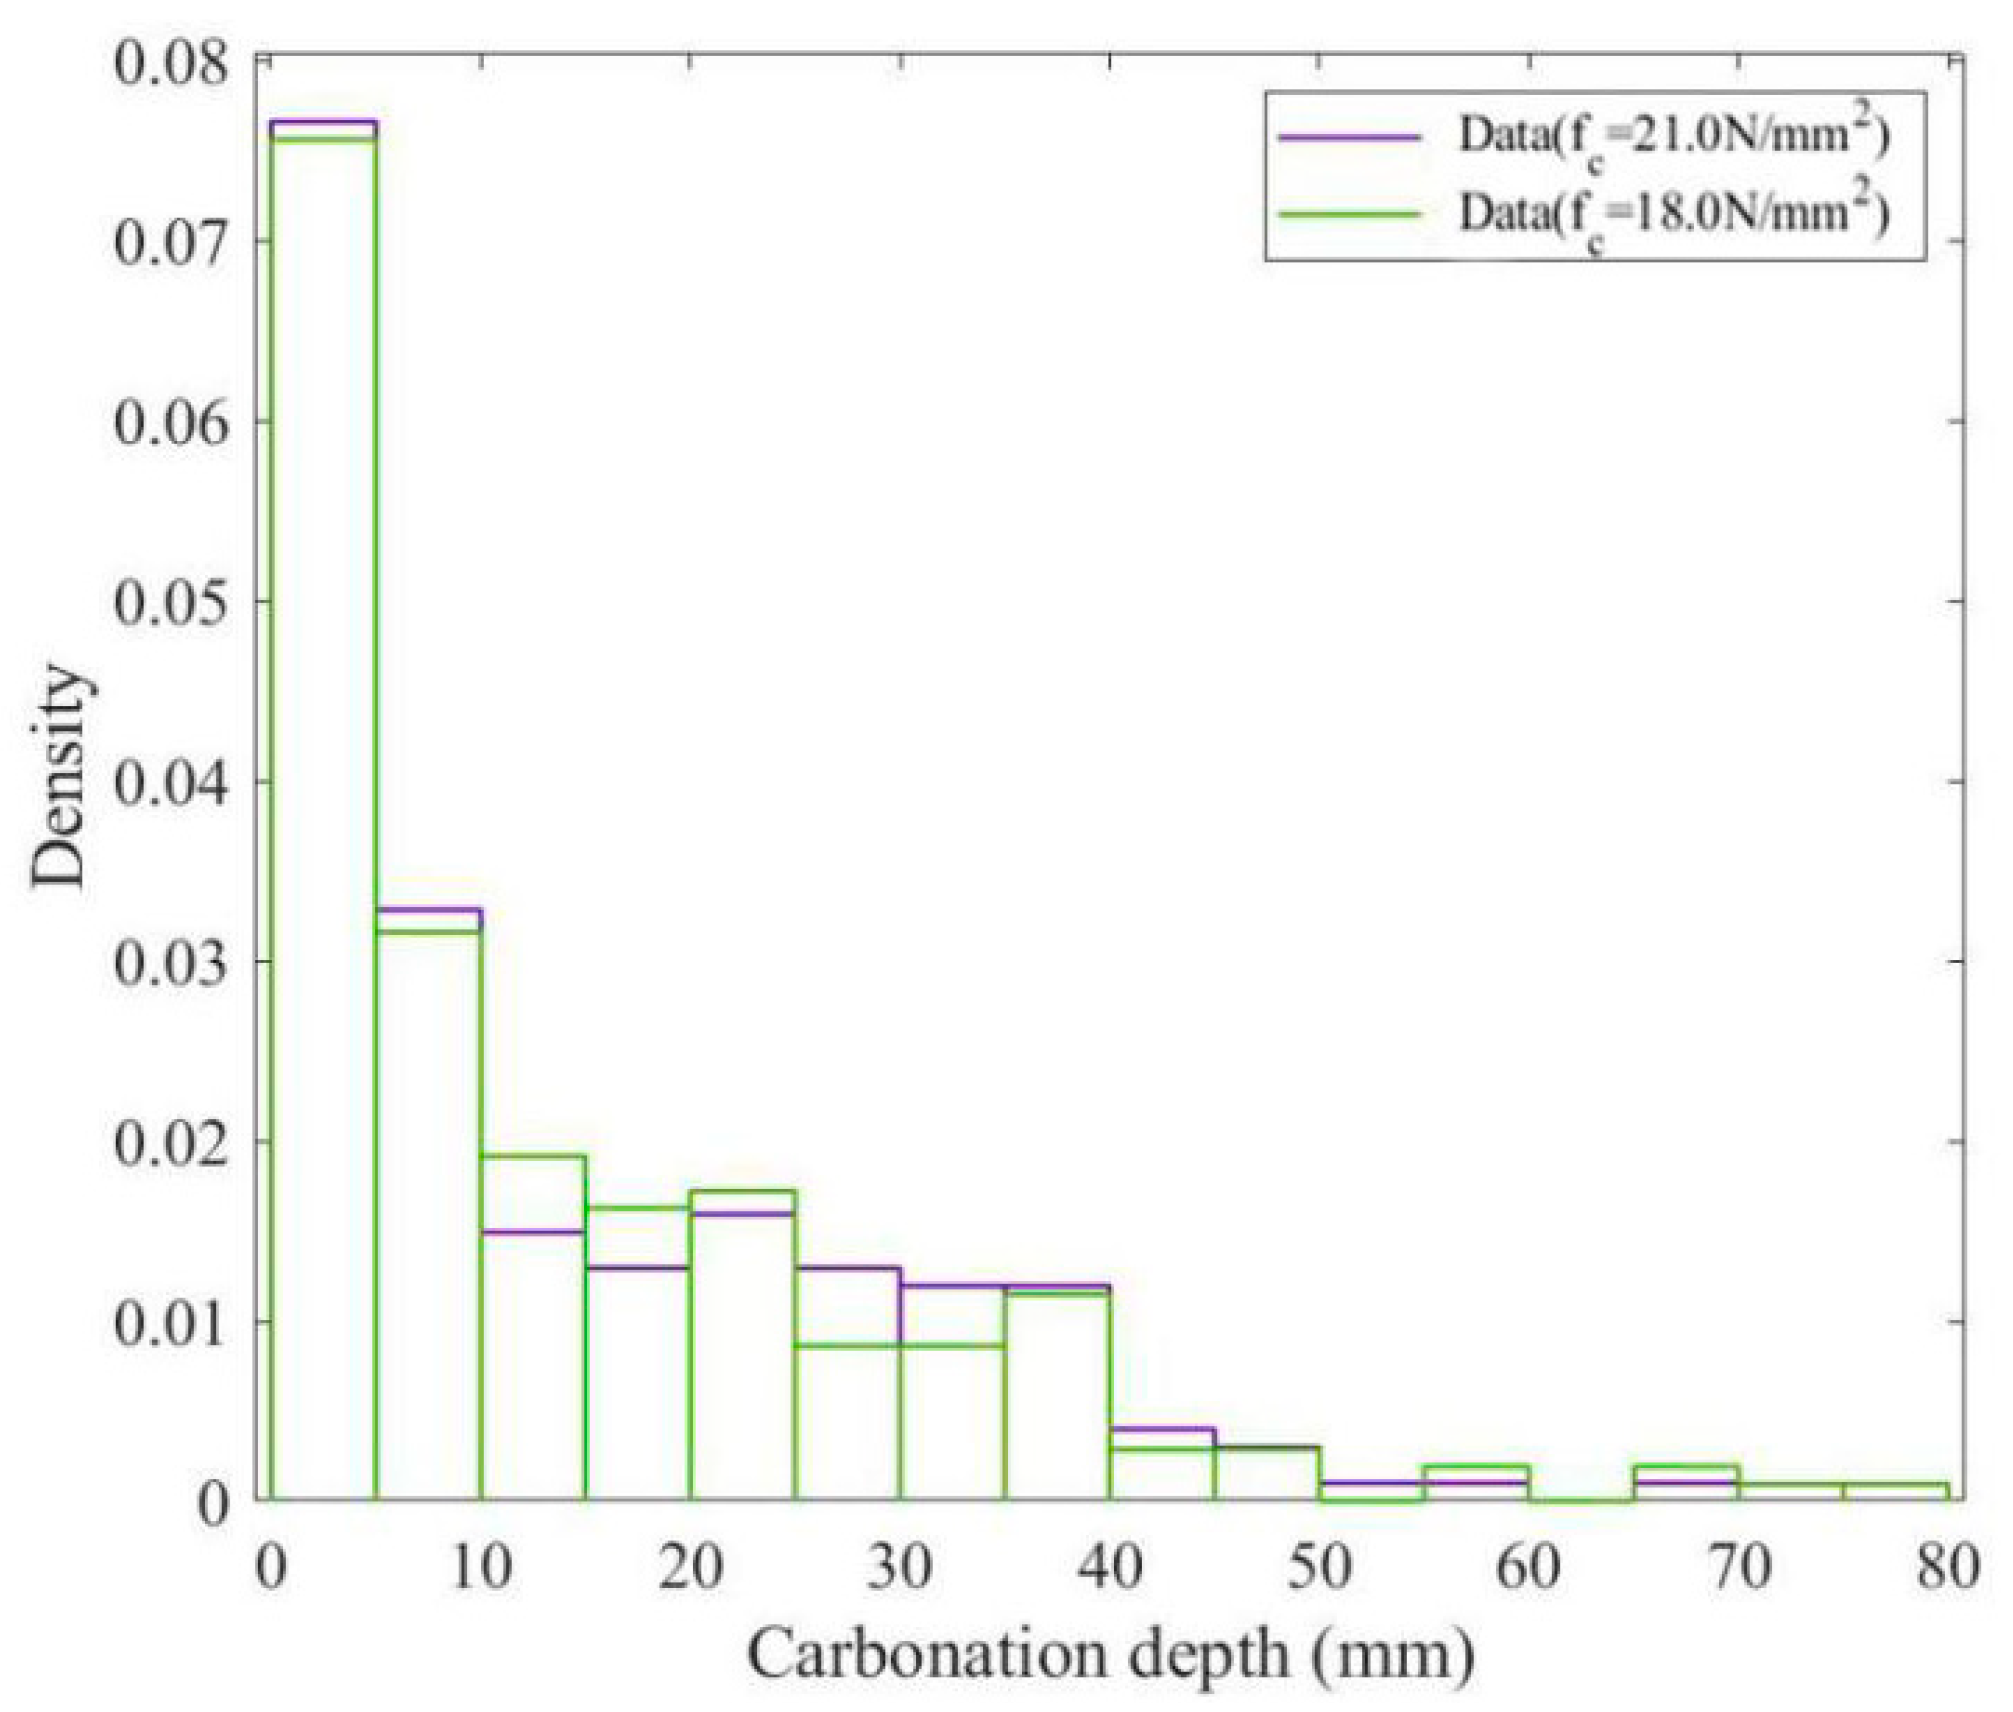
To carry out a further analysis of the effect of , the data of carbonation depth with respect to the service years varying from 42 to 46 years were used to plot the probability density distribution. As shown in Figure 4, the distributions of and were in good agreement, showing that the deterioration rates of these two groups were similar.
3. Effect of Carbonation on Concrete Compressive Strength
Carbonation might have positive and negative effects on the compressive strength of concrete. Since the carbonation product, calcium carbonate, occupies numerous concrete pores, the compressive strength and the hardness of concrete may increase [32]. However, carbonation might produce excessive calcium carbonate that exceeds the number of pores, resulting in additional internal pressure and micro-crack [33]. Junior figured out that the longer the carbonation-induced corrosion is, the greater the reduction of compressive strength is [34]. In this paper, to investigate the effect of carbonation depth on compressive strength, 949 data (except data of uncarbonized components) were analyzed, as shown in Figure 5. It was observed that the discreteness of compressive strength decreased with the increase of carbonation depth.
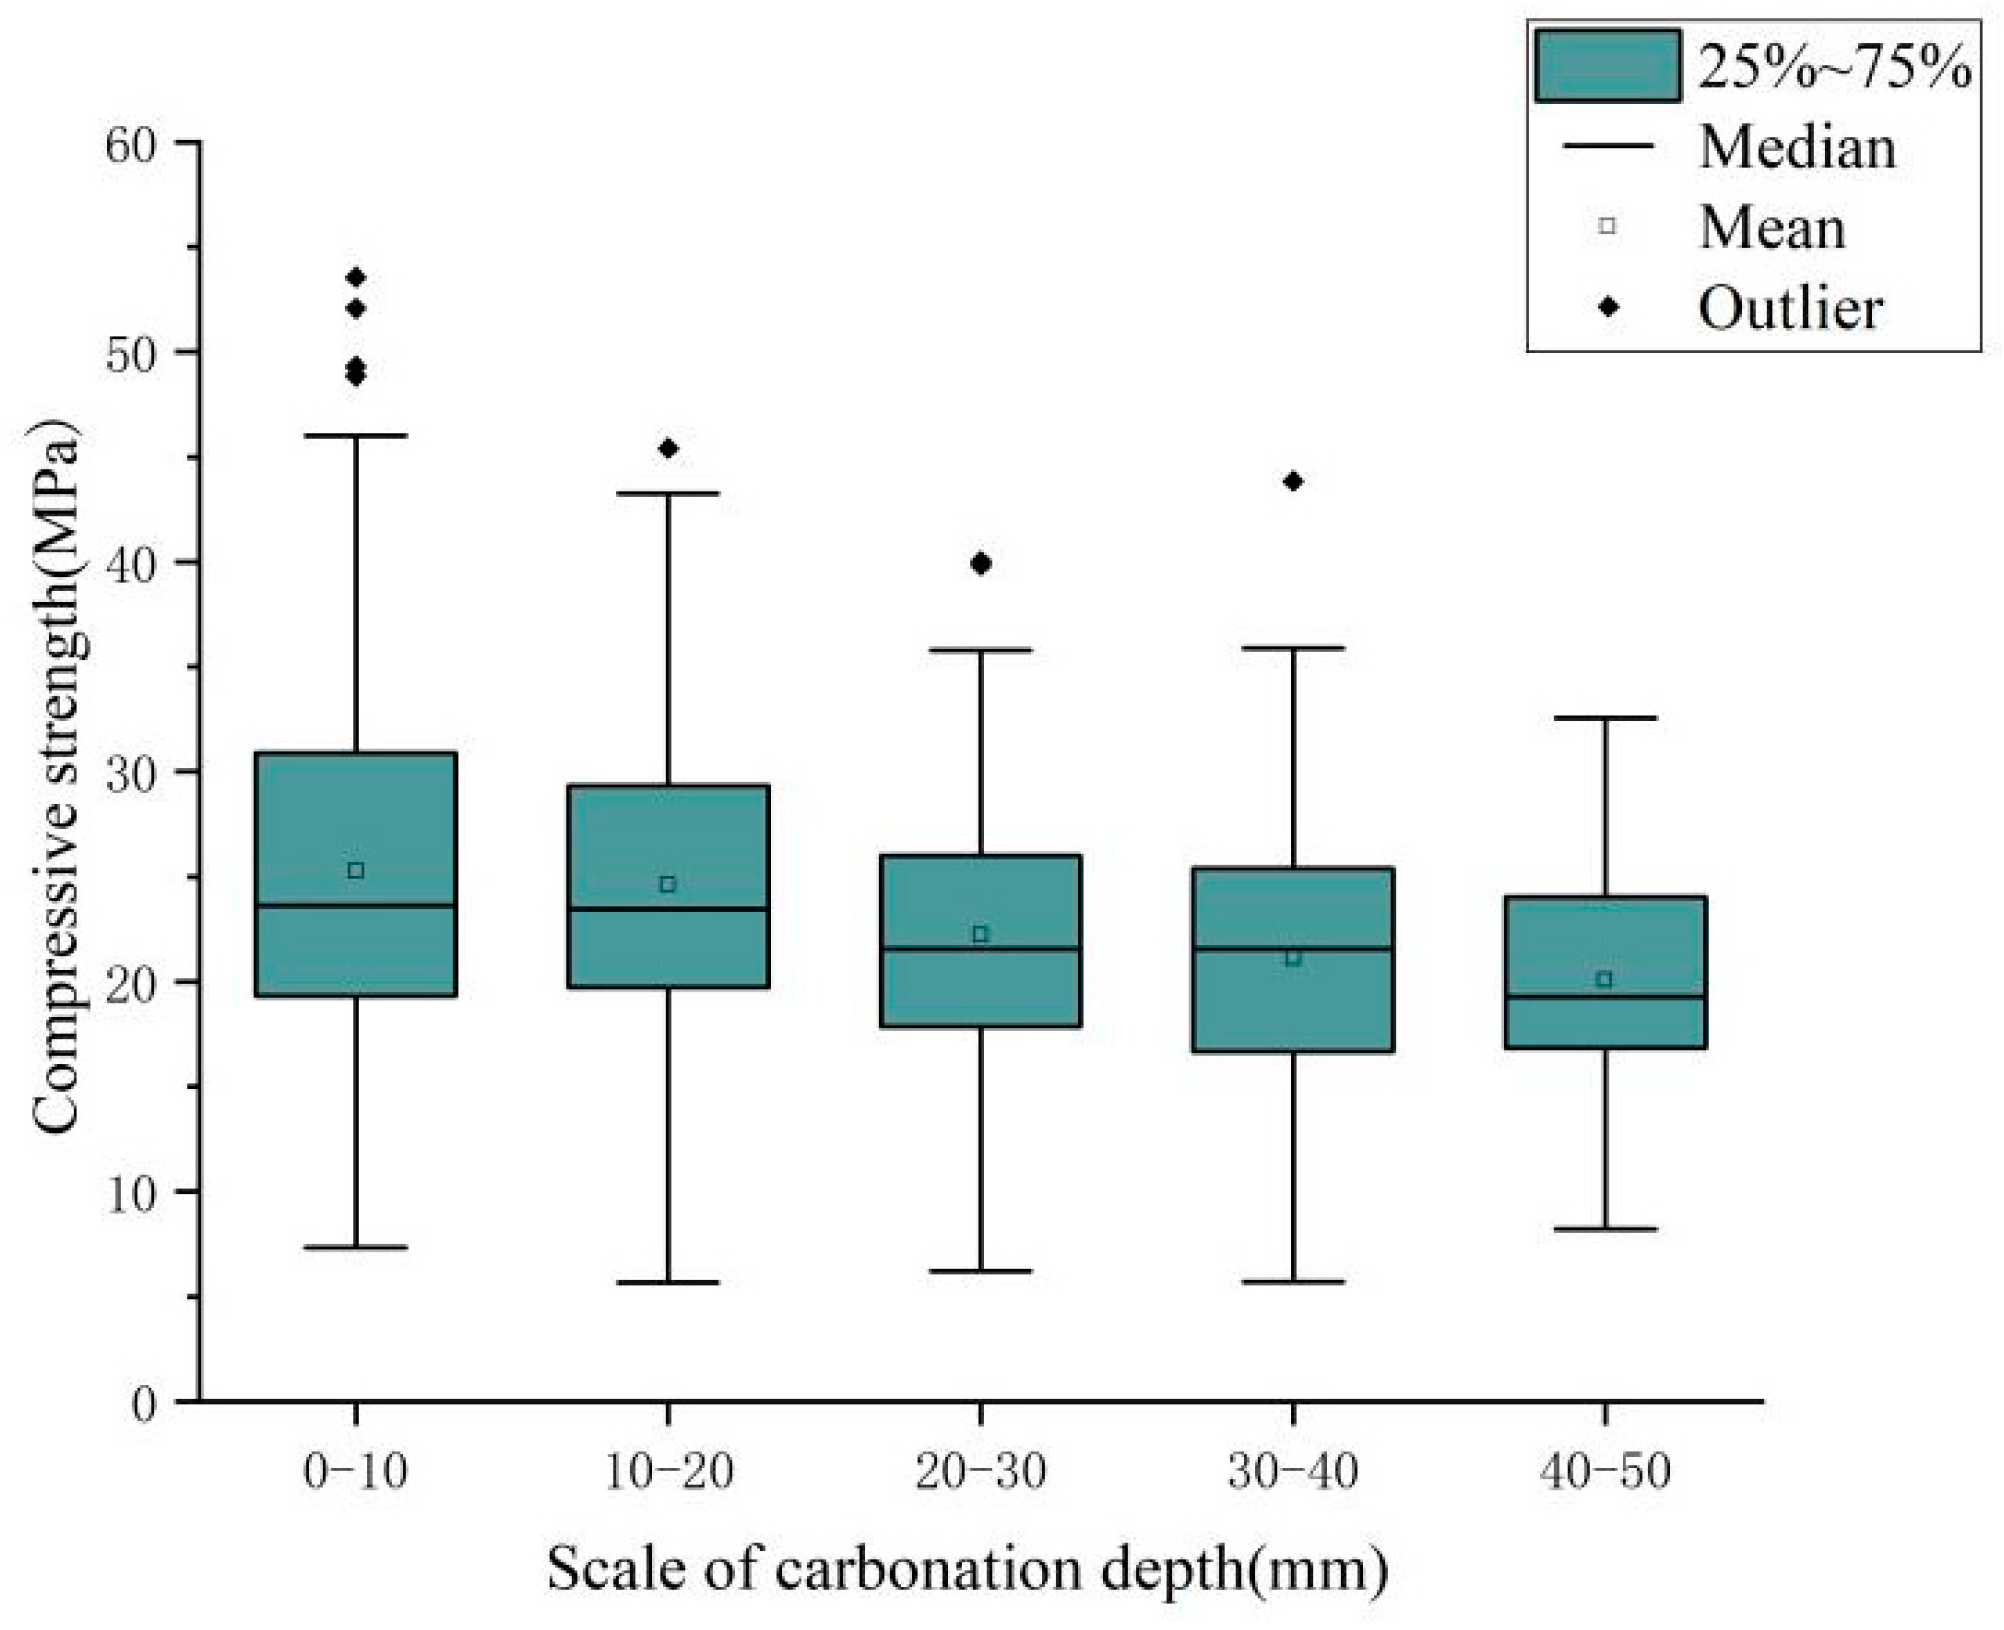
For a further analysis, the data were classified into five groups according to the carbonation depth (the groups were defined at depths of 10 mm from each other) and were employed to obtain a box plot, as shown in Figure 6. Quantity, mean value, and standard deviation of the five data groups are presented in Table 1.
According to Figure 6 and Table 1, the mean value and standard deviation of compressive strength decreased with the increase of carbonation depth. Moreover, it was found that the box dimension declined when the carbonation depth increased, indicating that the data of compressive strength were increasingly centralized. Therefore, it was concluded that carbonation-induced corrosion can result in the decrease of compressive strength of concrete, in agreement with conclusion Zha [35].
4. Distribution Fitting of the Carbonation Depth
To develop a prediction model for the carbonation depth, the probability distribution of the carbonation depth considering service age should be determined. In this paper, the data of carbonized concrete were used to investigate the probability distribution. Since the prediction models based on large data are more accurate than those based on limited data [36], 732 data (carbonated specimen) were divided into 7 groups corresponding to 2 years according to service ages to increase the accuracy of the prediction, as presented in Table 2.
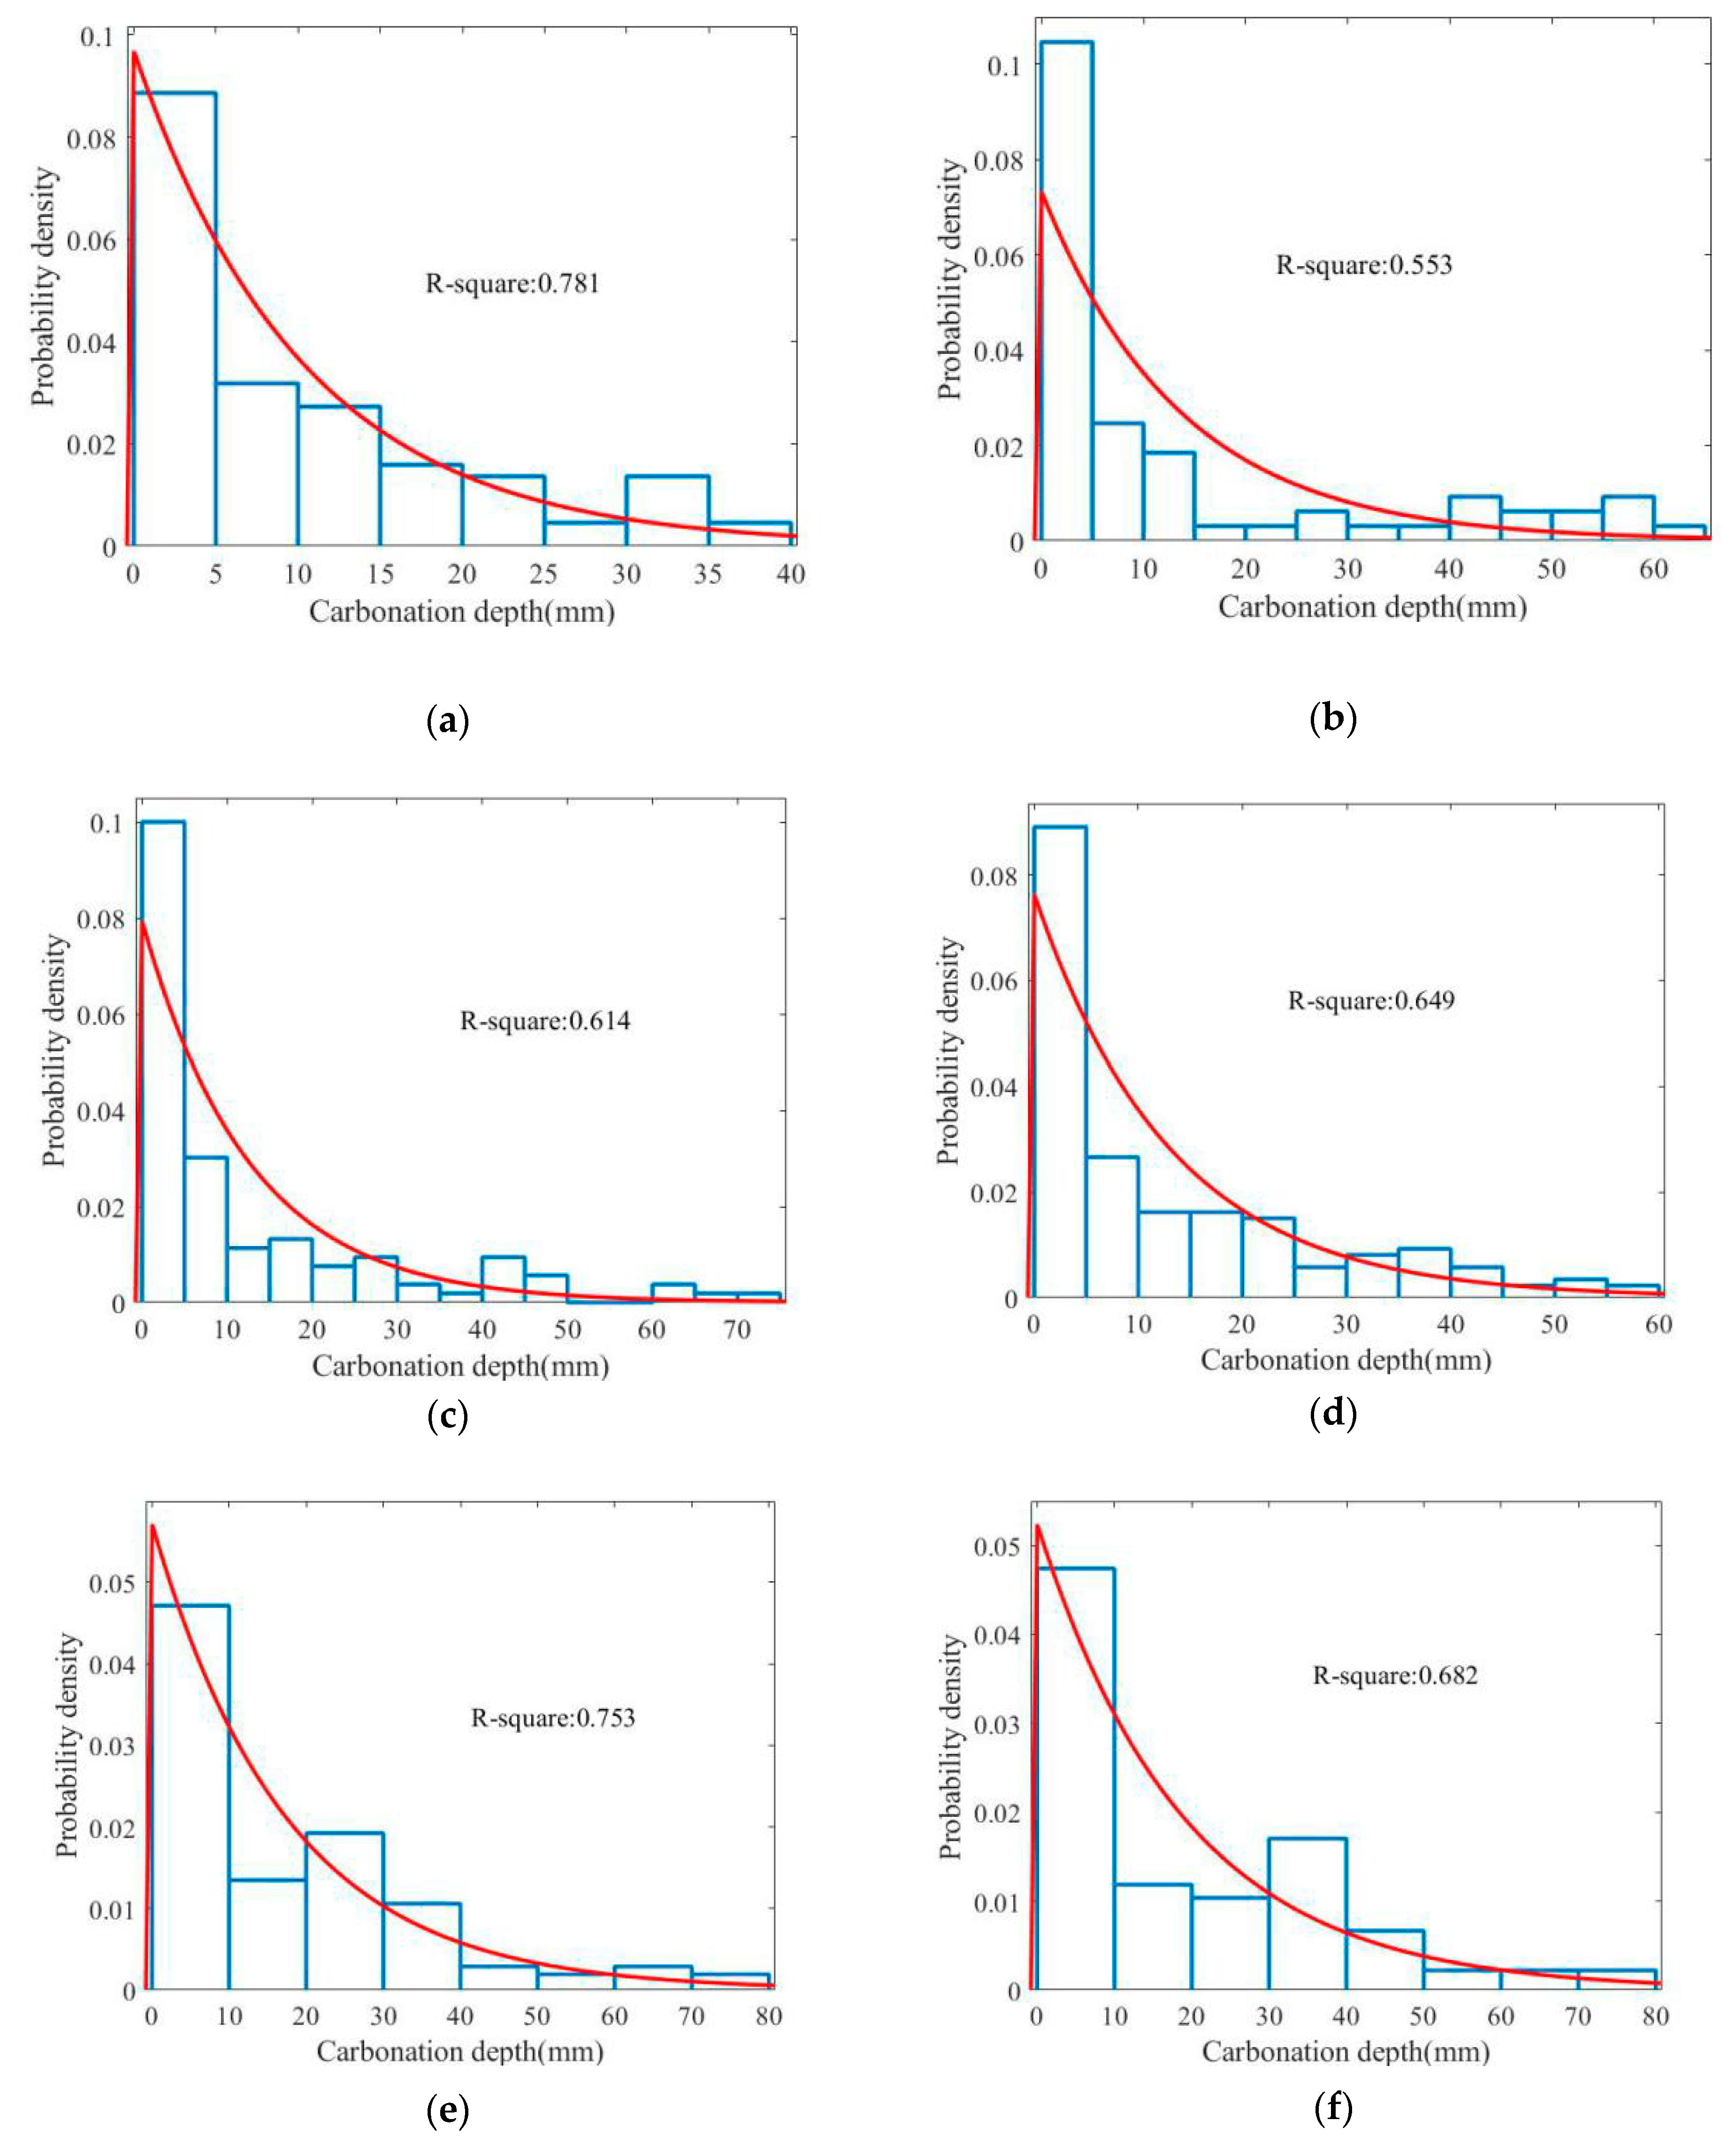
The MATLAB software was used for the analysis of the fitting distributions of data with the sample significance level a = 0.05. Gamma distribution, lognormal distribution, exponential distribution, and normal distribution were used to describe the probability distribution. It was found that the exponential distribution had the best agreement with the probability density distribution, as shown in Figure 7.
The probability distributions of carbonation depth at different service ages are plotted in Figure 8.
Different from what determined by the existing prediction models, the distribution of carbonation depth was found to be represented by an exponential distribution function. This is because numerous existing studies have been carried out using the statistical analysis of accelerated experiments, in which the variables represented by environmental factors are not considered. Additionally, the tested component in this experiment had the characteristic of long service life. Furthermore, the specimens in accelerated experiments are all carbonized, but, actually, numerous concretes are uncarbonized, as shown by the experiment in this paper in natural environment.
5. Assessment of the Mean Value and Variance of Carbonation Depth
In previous studies, the carbonation depth was regarded as a function of the square root of time [36]. However, most models using this function were developed on the basis of accelerated experiments, where the carbonation depth and climatic factors were not regarded as variables, and the methodologies were very complex. To realistically capture the irregularity of carbonation depth, the mean values and variance of the data were analyzed in details. According to the distribution fittings from Figure 8, the mean values and variances of the data were obtained, as presented in Table 3.
From Table 3, it was observed that the mean values and the variance increased with the increase of service time. Figure 9 presents the time-varying model for calculating the mean value of carbonation depth (), which is expressed as:
On the basis of Figure 9, if the concrete cover is assumed to be 20 mm, it can be predicted that after about 47.6 years (concrete failure time), the carbonation depth of the concrete will probably reach the concrete cover. Therefore, this concrete is suggested to be retrofitted. However, only the mean value was considered in this model, leading to inaccurate prediction of the concrete failure time. To consider both mean value and variance, a reliability method and guaranteed rate were applied in this paper.
6. Time-Varying Failure Probability and Concrete Guaranteed Rate
On the basis of the analysis of the distribution fitting, the exponential distribution describes the data distribution of carbonation depth. To develop a time-varying reliability for the assessment of structural safety, the eigenvalue of the exponential distribution function at different service ages was investigated. The eigenvalue could be determined from Figure 10 and was utilized to develop a function expressed by Equation (3):
To propose a time-varying reliability model regarding the carbonation depth, the concrete failure mode was defined as the carbonation depth reaching the concrete cover. The proposed model is presented in the following section.
The exponential distribution function is expressed as:
where x is the random variable.
By integrating Equation (4), the time-varying failure probability is revealed as:
where is the thickness of the concrete cover (mm).
However, only the data of carbonized concrete are considered in Equation (5). To have a more accurate evaluation of concrete safety, Equation (1) was considered to determine the failure probability. The formula of time-varying failure probability is:
where is the time-varying failure probability considering both carbonized and uncarbonized concrete.
On the basis of the building code calibration, concrete quality is determined by the guaranteed rate of above 95% [37]. Therefore, to observe the concrete failure time based on the time-varying failure probability, the guaranteed rate was evaluated in this paper. Concrete failure time can be observed when the qualified rate () is equal to the guaranteed rate (). As shown in Figure 11, is represented by the dimension of the shaded area.
Figure 12 presents the time-varying failure probability of concrete with concrete cover assumed to be 25 mm. Tested by MC simulation, the errors of the calculated results were within 4%. It was found that was far less than , because the carbonation rate was considered in . If concrete guaranteed rate was presumed to be 95%, the observed limit failure probability was 5%. Therefore, the concrete failure time was easily obtained as 44.3 years.
Figure 13 shows the time-varying failure probabilities with different concrete covers. It indicates that the failure probability decreases with the increase of concrete cover. Moreover, the concrete cover has an effect on the changing rate of failure probability. The concrete failure time of other concrete covers can be predicted on the basis of the methodology applied in this paper.
7. Time-Varying Reliability Index Based on the TM Method
One of the most important steps to calculate the failure probability is to analyze the integral of probability density function (PDF), leading to the difficulty in probability computation [28]; thus, approximation methods such as the moment methods are generally applied in reliability analysis. In this paper, the TM method was used to predict the time-varying reliability index. The proposed formula for calculating TM reliability is presented in this paper [38].
The calculation steps of the time-varying TM methods are:
where G(x) is the performance function, c is the concrete cover, x is the random variable of carbonation depth, is the second-moment reliability index, is the mean value of of G(x), is the standard deviation of G(x), is the skewness observed by MC simulation, is the expression of the TM method.
Figure 14 presents the time-varying TM reliability index calculated by Equations (7)–(12). The calculated results were tested by MC simulation. The calculated errors are shown in Table 4. In this example, the concrete cover was presumed to be 35 mm. Meanwhile, all skewness values were close to −2. Other TM reliability values with different concrete covers can be computed using the same method.
On the basis of Figure 14 and Table 4, and MC simulation are in good agreement and therefore this formula was used for calculating the TM reliability in this paper. Obviously, from Figure 14, has a better agreement than because skewness was taken into consideration in . Figure 15 shows the different TM reliability indices with a concrete cover presumed to be 25 mm. On the basis of Figure 14 and Figure 15, can be used to precisely determine time-varying TM reliability with different presumed concrete covers.
Since the failure probability and reliability index are equivalent methods to carry out the assessment of structural safety, the concrete failure time obtained by time-varying failure probability can be combined with the time-varying reliability index, aiming to obtain the limit reliability index of a certain concrete cover. According to Figure 13, the concrete failure time of concrete covers with thicknesses c = 20 mm, c = 25 mm, c = 30 mm, and c = 35 mm were observed to be 41.2 years, 44.1 years, 46.8 years, 49.1 years, respectively. Then, the corresponding limit reliability indices were calculated as 0.756, 0.838, 0.886, and 0.926, respectively, as shown in Figure 16. The limit reliability indices of other concrete covers can be computed using this method.
8. Example
In order to appraise the structural safety and carry out an optimum maintenance plan, several concrete beams from a building in Yokohama, Japan, were tested. Table 5 shows detailed information for these tested components.
On the basis of the analysis in this paper, the effect of on carbonation depth was negligible. Therefore, the concrete failure time of the beams was determined by the service age and concrete cover. The failure mode of concrete beam is defined as the predicted carbonation depth reaching the corresponding concrete cover. The analysis of structural safety is presented below.
Calculation I:
Using Equation (2), the mean values of carbonation depth of six concrete beams were predicted as:
According to the failure mode, when the carbonation depth was determined only by its mean value, all concrete beams were still in service.
Calculation II:
On the basis of the analysis in this paper, exponential distribution was applied to describe the distribution of the carbonation depth. Using Equations (1), (3), and (6), the corresponding failure probabilities were calculated as:
According to the concrete guaranteed rate of 95% obtained in the building code calibration, the limit failure probability was considered 0.05. Hence, beam III and beam VI were in service, while the other beams had been destroyed.
Calculation III:
Using Equations (3), (7)–(12), the corresponding reliability indices were calculated as:
According to the corresponding limit reliability indices, the results of the safety evaluation coincided with those obtained in Calculation II.
9. Conclusions
- (1)
- On the basis of the statistics (13,198) carried out from existing buildings, the concrete failure time was obtained by employing time-varying reliability.
- (2)
- Compared with the SM method, we recommend the TM method for its higher accuracy, in which skewness, the third dimensionless central moment, is involved.
- (3)
- Tested by MC simulation, the prediction model of time-varying reliability based on the TM method was accurate, and the errors were within 4%.
- (4)
- Different from accelerated experiments, the carbonation depths analyzed in this paper were obtained considering the effects of the natural environment. Therefore, the environmental factors were considered, leading to more persuasive results.
- (5)
- In this study, the relation between carbonation depth and compressive strength was investigated, indicating that carbonation-induced corrosion might cause the decline of the compressive strength of concrete.
- (6)
- In light of the probability density distribution of carbonation depth, exponential distribution, compared with gamma distribution, normal distribution, and lognormal distribution, is more appropriate to describe the distribution of carbonation depth.
Author Contributions
Conceptualization, Y.Z. and J.W.; methodology, J.W.; software, W.Z.; validation, J.W. and W.Z.; formal analysis, W.Z.; investigation, W.Z.; resources, X.Z.; data curation, J.W. and Y.Z.; writing—original draft preparation, W.Z.; writing—review and editing, W.Z.; visualization, W.Z.; supervision, J.W.; project administration, Y.Z. and X.Z.; funding acquisition, Y.Z. and X.Z.
Funding
This research work was supported by the Natural Science Foundation of China (Grant No. 51878413).
Conflicts of Interest
The authors declare no conflict of interest.
Data Availability Statement
The data used to support the findings of this study are available from the corresponding author upon request.
References
- Wahid, F.; Yu, B.; Tuan, D.N.; Allan, M.; Priyan, N. New advancements, challenges and opportunities of multi-storey modular buildings—A state-of-the-art review. Eng. Struct. 2019, 183, 883–893. [Google Scholar]
- Lantsoght, E.O.; van der Veen, C.; de Boer, A.; Hordijk, D.A. State-of-the-art on load testing of concrete bridges. Eng. Struct. 2017, 150, 231–241. [Google Scholar] [CrossRef]
- Bernardino, C.; Alessandro, P.F.; Paolo, V. Combining fiber-reinforced concrete with traditional reinforcement in tunnel linings. Eng. Struct. 2009, 31, 1600–1606. [Google Scholar]
- Wahid, F.; Yu, B.; Ahmed, D.A.; Sindu, S.; Juri, J. Modular assembly of water-retaining walls using GFRP hollow profiles: Components and connection performance. Compos. Struct. 2018, 194, 1–11. [Google Scholar]
- Wahid, F.; Ahmed, D.A.; Yuan, H.; Yu, B. Short-term flexural behaviour of concrete filled pultruded GFRP cellular and tubular sections with pin-eye connections for modular retaining wall construction. Compos. Struct. 2018, 206, 1–10. [Google Scholar]
- Parrott, L.J. Some effects of cement and curing upon carbonation and reinforcement corrosion in concrete. Mater. Struct. 1996, 29, 164–173. [Google Scholar] [CrossRef]
- Jones, M.R.; Dhir, R.K.; Newlands, M.D.; Abbas, A.M.O. A study of the CEN test method for measurement of the carbonation depth of hardened concrete. Mater. Struct. 2000, 33, 135–142. [Google Scholar] [CrossRef]
- Hills, T.P.; Gordon, F.; Florin, N.H.; Fennell, P.S. Statistical analysis of the carbonation rate of concrete. Cem. Concr. Res. 2015, 72, 98–107. [Google Scholar] [CrossRef]
- Nguyen, T.T.H.; Bary, B.; De Larrard, T. Coupled carbonation-rust formation-damage modeling and simulation of steel corrosion in 3D mesoscale reinforced concrete. Cem. Concr. Res. 2015, 74, 95–107. [Google Scholar] [CrossRef]
- Jiang, L.H.; Lin, B.Y.; Cai, Y.B. A model for predicting carbonation of high-volume fly ash concrete. Cem. Concr. Res. 2000, 30, 699–702. [Google Scholar] [CrossRef]
- Shen, J.; Dangla, P.; Thiery, M. Reactive transport modeling of CO2 through cememtitious materials under CO2 geological storage conditions. Int. J. Greenh. Gas Control 2013, 18, 75–87. [Google Scholar] [CrossRef]
- Maekawa, K.; Ishida, T.; Kishi, T. Multi-Scale Modeling of Structural Concrete; Taylor & Francis: New York, NY, USA, 2009. [Google Scholar]
- Zha, X.X.; Yu, M.; Ye, J.Q.; Feng, G.L. Numerical modeling of supercritical carbonation process in cement-based materials. Cem. Concr. Res. 2015, 72, 10–20. [Google Scholar] [CrossRef]
- Phung, Q.T.; Maes, N.; Jacques, D.; De Schutter, G.; Ye, G.; Perko, J. Modelling the carbonation of cement pastes under a CO2 pressure gradient considering both diffusive and convective transport. Constr. Build. Mater. 2016, 114, 333–351. [Google Scholar] [CrossRef]
- Saetta, A.V.; Schrefler, B.A.; Vitaliani, R.V. The carbonation of concrete and the mechanism of moisture, heat and carbon-dioxide flow-through porous materials. Cem. Concr. Res. 1993, 23, 761–772. [Google Scholar] [CrossRef]
- Papadakis, V.G.; Vayenas, C.G.; Fardis, M.N. Fundamental modeling and experimental investigation of concrete carbonation. ACI Mater. J. 1991, 88, 363–373. [Google Scholar]
- Bulletin, C.F. Model Code for Service Life Design; Task Group 5.6; The International Federation for Structural Concrete: Lausanne, Switzerland, 2006. [Google Scholar]
- CECS. Standard for Durability Assessment of Concrete Structures; China Architecture and Building Press: Beijing, China, 2007. (In Chinese) [Google Scholar]
- Zhang, Y.; Jiang, L.X. A practical mathematical model of concrete carbonation depth based on the mechanism. Ind. Constr. 1998, 28, 16–19. (In Chinese) [Google Scholar]
- Kari, O.P.; Puttonen, J.; Skantz, E. Reactive transport modelling of long-term carbonation. Cem. Concr. Compos. 2014, 52, 42–53. [Google Scholar] [CrossRef]
- Philip, V.D.H.; Belie, N.D. A service life based global warming potential for high-volume fly ash concrete exposed to carbonation. Constr. Build. Mater. 2014, 55, 183–193. [Google Scholar]
- Xiao, J.Z.; Lei, B. Carbonation model and structural durability design for recycled concrete. J. Architect. Civ. Eng. 2008, 25, 66–72. (In Chinese) [Google Scholar]
- Silva, R.V.; Silva, A.; Neves, R.; Brito, J.D. Statistical modeling of carbonation in concrete incorporating recycled aggregates. J. Mater. Civ. Eng. 2016, 28, 040150821. [Google Scholar] [CrossRef]
- Zhao, H.; Sun, W.; Wu, W.; Gao, B. The effect of the material factors on the concrete resistance against carbonation. KSCE J. Civ. Eng. 2018, 22, 1265–1274. [Google Scholar] [CrossRef]
- Li, G.; Yuan, Y.S.; Liu, X.; Du, J.M.; Li, F.M. Influences of environment climate conditions on concrete carbonation rate. Advan. Eng. Mater. 2011, 194–196, 904–908. [Google Scholar] [CrossRef]
- Bao, H.; Yu, M.; Liu, Y.; Ye, J. Experimental and statistical study on the irregularity of carbonation depth of cement mortar under supercritical condition. Cons. Build. Mater. 2018, 174, 47–59. [Google Scholar] [CrossRef]
- Zhang, K.J.; Xiao, J.Z. Time-dependent reliability analysis on carbonation behavior of recycled aggregate concrete based on gamma process. Constr. Build. Mater. 2018, 158, 378–388. [Google Scholar] [CrossRef]
- Wang, J.; Lu, Z.H.; Saito, T.; Zhang, X.G.; Zhao, Y.G. A simple third-moment reliability index. Asia Archit. Build. Eng. 2017, 16, 171–178. [Google Scholar] [CrossRef]
- Zhao, Y.G.; Ono, T. Moment methods for structural reliability. Struct. Saf. 2001, 23, 47–75. [Google Scholar] [CrossRef]
- Zhang, X.G.; Wang, J.; Zhao, Y.G.; Tang, L.P.; Xing, F. Time-dependent probability assessment for chloride induced corrosion of RC structures using the third-moment method. Constr. Build. Mater. 2015, 76, 232–244. [Google Scholar] [CrossRef]
- Zhao, Y.G.; Lu, Z.H.; Ono, T. First Third Moments of Some Commonly Used Performance Functions. Archit. Inst. Jpn. 2017, 617, 31–37. [Google Scholar]
- Kim, J.K.; Kim, C.Y.; Yi, S.T.; Lee, Y. Effect of carbonation on the rebound number and compressive strength of concrete. Cem. Concr. Compos. 2009, 31, 139–144. [Google Scholar] [CrossRef]
- Richardson, M.G. Carbonation of Reinforced Concrete: Its Causes and Management; University College Dublin: Dublin, Ireland, 1988. [Google Scholar]
- Junior, A.N.; Filho, R.D.T.; Fairbairn, E.D.M.R.; Dweck, J. A study of the carbonation profile of cement pastes by thermogravimetry and its effect on the compressive strength. Therm. Anal. Calorim. 2014, 116, 69–76. [Google Scholar] [CrossRef]
- Zha, X.X.; Ning, J.Q.; Saafi, M.; Dong, L.J.; Dassekpo, J.B.M.; Ye, J.Q. Effect of supercritical carbonation on the strength and heavy metal retention of cement-solidified fly ash. Cem. Concr. Res. 2019, 120, 36–45. [Google Scholar] [CrossRef]
- Zhang, K.J.; Xiao, J.Z. prediction model of carbonation depth for recycled aggregate concrete. Cem. Concr. Compos. 2018, 88, 86–99. [Google Scholar] [CrossRef]
- Ministry of Housing and Urban-Rural Development of the People’s Republic of China. National Standard of the Peoples Republic of China, Code for Design of Concrete Structures: GB 50010-2010[S]; China Architecture & Building Press: Beijing, China, 2015. [Google Scholar]
- Zhao, Y.G.; Lu, Z.H. Estimation of load and resistance factors using the third-moment method based on the 3P-lognormal distribution. Front. Archit. Civ. Eng. China 2011, 5, 315–322. [Google Scholar] [CrossRef]
Figure 1.
Statistics of carbonation depth ().

Figure 2.
Statistics of carbonation depth ().

Figure 3.
Rate of carbonized concrete to uncarbonized concrete.

Figure 4.
Probability distribution of the carbonation depth.

Figure 5.
Relation between carbonation depth and compressive strength (scatter plot).

Figure 6.
Relation between carbonation depth and compressive strength (box plot).

Figure 7.
Distribution fitting of carbonation depth.

Figure 8.
Exponential distribution fitting with the acceptable R-square: (a) t = 37; (b) t = 39; (c) t = 41; (d) t = 43; (e) t = 45; (f) t = 47; (g) t = 49. Note: t is the service age of the buildings in years.
Figure 8.
Exponential distribution fitting with the acceptable R-square: (a) t = 37; (b) t = 39; (c) t = 41; (d) t = 43; (e) t = 45; (f) t = 47; (g) t = 49. Note: t is the service age of the buildings in years.


Figure 9.
Time-varying model of the mean value of carbonation depth.

Figure 10.
Fitting of the eigenvalue of the exponential distribution function.

Figure 11.
Exponential distribution of .

Figure 12.
Time-varying failure probability, Monte-Carlo simulation, and concrete guaranteed rate.

Figure 13.
Time-varying failure probabilities of different concrete covers.

Figure 14.
Time-varying reliability indices with concrete cover thickness c = 35 mm.

Figure 15.
Time-varying reliability indices with concrete cover thickness c = 25 mm.

Figure 16.
Time-varying reliability indices with different concrete covers.


Table 1.
Quantity, mean value, and standard deviation of the five data groups.
| Range of Carbonation Depth (MPa) | Quantity | Mean Value (MPa) | Standard Deviation |
|---|---|---|---|
| 0–10 | 534 | 25.6 | 8.37 |
| 10–20 | 146 | 24.6 | 7.39 |
| 20–30 | 107 | 22.2 | 6.56 |
| 30–40 | 85 | 21.1 | 7.18 |
| 40–50 | 40 | 20.1 | 5.35 |
Table 2.
Service age, representative age, and sample size.
| Service Age (Year) | Representative Service Age (Year) | Total Sample Size |
|---|---|---|
| 37–38 | 37 | 88 |
| 39–40 | 39 | 65 |
| 41–42 | 41 | 106 |
| 43–44 | 43 | 173 |
| 45–46 | 45 | 104 |
| 47–48 | 47 | 135 |
| 49–50 | 49 | 61 |
Table 3.
Service age, mean value, and variance.
| Service Age (Year) | Mean Value (mm) | Variance |
|---|---|---|
| 37 | 10.81 | 116.84 |
| 39 | 13.61 | 185.38 |
| 41 | 12.44 | 154.57 |
| 43 | 13.05 | 170.43 |
| 45 | 16.21 | 262.82 |
| 47 | 19.07 | 363.84 |
| 49 | 22.93 | 525.79 |
Table 4.
Different time-varying reliability indices with concrete cover thickness c = 35 mm.
| Service Age | Skewness | |
|---|---|---|
| 37 | 31.8% | 2.01 |
| 39 | 1.80% | 1.99 |
| 41 | 1.15% | 1.96 |
| 43 | 1.10% | 2.02 |
| 45 | 0.23% | 2.01 |
| 47 | 0.60% | 2.00 |
| 49 | 1.23% | 1.97 |
Table 5.
Detail information for the tested components.
| Beam Number | Service Age (Year) | Concrete Cover (mm) | |
|---|---|---|---|
| I | 46 | 18.8 | 25 mm |
| II | 45 | 21.0 | 20 mm |
| III | 44 | 23.1 | 30 mm |
| IV | 45 | 27.5 | 25 mm |
| V | 46 | 25.3 | 20 mm |
| VI | 46 | 31.8 | 35mm |
© 2019 by the authors. Licensee MDPI, Basel, Switzerland. This article is an open access article distributed under the terms and conditions of the Creative Commons Attribution (CC BY) license (http://creativecommons.org/licenses/by/4.0/).
Share and Cite
MDPI and ACS Style
Wang, J.; Zheng, W.; Zhao, Y.; Zhang, X. Time-Varying Reliability Evaluation of Concrete Based on Carbonation Depth. Appl. Sci. 2019, 9, 5116. https://doi.org/10.3390/app9235116
AMA Style
Wang J, Zheng W, Zhao Y, Zhang X. Time-Varying Reliability Evaluation of Concrete Based on Carbonation Depth. Applied Sciences. 2019; 9(23):5116. https://doi.org/10.3390/app9235116
Chicago/Turabian StyleWang, Jiao, Weiji Zheng, Yangang Zhao, and Xiaogang Zhang. 2019. "Time-Varying Reliability Evaluation of Concrete Based on Carbonation Depth" Applied Sciences 9, no. 23: 5116. https://doi.org/10.3390/app9235116
Note that from the first issue of 2016, this journal uses article numbers instead of page numbers. See further details here.