Featured Application
In the aerospace and tool and die industries, this technology has great potential to enable fabrication of near-net shape components with a high production rate and low material waste. This simulation work potentially applies to the prediction of distortion and residual stresses for large and complex Ti-6Al-4V aerospace components fabricated by a laser metal deposition with wire process. Furthermore, it can be extended to structural components, such as the excavator arm that has been reported in the literature.
Abstract
Laser metal deposition with wire (LMD-w) is a developing additive manufacturing (AM) technology that has a high deposition material rate and efficiency and is suitable for fabrication of large aerospace components. However, control of material properties, geometry, and residual stresses is needed before LMD-w technology can be widely adopted for the construction of critical structural components. In this study, we investigated the effect of interlayer cooling time, clamp constraints, and tool path strategy on part distortion and residual stresses in large-scale laser additive manufactured Ti-6Al-4V components using finite element method (FEM). The simulations were validated with the temperature and the distortion measurements obtained from a real LMD-w process. We found that a shorter interlayer cooling time, full clamping constraints on the build plates, and a bidirectional tool path with 180° rotation minimized part distortion and residual stresses and resulted in symmetric stress distribution.
1. Introduction
In the past decade, metal additive manufacturing (AM) has evolved from rapid prototyping and low volume production to mass production of various metallic components [1]. This trend has triggered a need for manufacturing processes that have high deposition rates, such as metal big area AM (mBAAM) or laser metal deposition with wire (LMD-w) AM [1,2,3,4,5]. However, high deposition rates often result in undesired defects, an inhomogeneous microstructure, and poorer, anisotropic mechanical properties compared to their wrought counterparts. Therefore, process control and optimization is important for attaining defect-free parts that have performance-critical applications [2].
The laser metal deposition with wire (LMD-w) system consists of a laser heat source mounted on a robotic arm, a wire feeder, tables, and tools for process conditions (e.g., cameras and thermocouples). The motion of the laser and wire feeder is controlled via a robotic arm and computer program. The laser melts the wire as it is being fed by the wire feeder, repeating in a layer-by-layer fashion until the part is completed, with each layer being deposited on a substrate which is the previous layer. As a result of this layer-by-layer deposition, every deposited layer except for the last one undergoes multiple heating and cooling cycles, which typically produces non-uniform thermal stress and distortion in the final parts [6].
There are several remedies reported in the literature to address this problem. Since the interlayer cooling time, i.e., the dwell time between depositing subsequent layers along the build direction, changes the thermal history and heat build-up during deposition, Delinger et al. [7] investigated the effect of interlayer cooling time on distortion and residual stress using laser direct energy deposition with a blown powder of Ti-6Al-4V. They reported that a shorter interlayer cooling time produces lower distortion and residual stresses. Zhao et al. [8] also presented that the residual stress can be reduced by controlling the interlayer cooling time. Aggarangsi and Beuth [9] studied the effect of preheating on the residual stresses using a laser engineered net shaping (LENS) process. They reported that the uniform preheating alters temperature distributions and consequently reduces residual stress by up to 18%. Nevertheless, the interlayer cooling time and preheating temperature should be carefully controlled because shortening the cooling time and increasing preheating temperature can excessively increase the energy input into the system, particularly during continuous printing. Overheating can consequently lead to undesirable remelting, poor surface finish and poor dimensional tolerances in the final part.
Tool path optimization is an alternative way to control part distortion, residual stress, and mechanical properties. Many types of tool path strategies have been developed in various AM processes such as raster, spot melting, zigzag, contour, spiral, fractal and modular path, etc. [5,10,11,12]. These studies showed that the tool path strategies have a strong influence on spatial and temporal thermal signatures, which affects the solidification, solid-state transformation, distortion, and residual stress evolution. Particularly, distortion and residual stress seriously limit the wide application of large-scale metal AM [6].
Numerical simulations have been used to understand part distortion and residual stress evolution in various AM processes [13]. They have been limited to mostly experimental scale AM processes (i.e., powder bed fusion or direct energy deposition with blown powder), such that few large-scale simulations have been reported in the literature of wire-arc AM (WAAM), mBAAM and LMD-w. Ding et al. [11] developed a computationally efficient finite element method (FEM) for a large-scale metal AM process and investigated the stress evolution during the thermal cycle of the AM process. The modeling results showed that the stress was higher at the top of the deposited wall because of the bending distortion. They also observed a significant stress redistribution after unclamping. Cao et al. [14] developed a 3D thermo-mechanical simulation on a single pass build with eleven layers for the Sciaky large-scale wire feed electron beam AM system. They reported that preheating effectively reduced the distortion and residual stress in a Ti-6Al-4V part manufactured by electron beam additive manufactured. Simunovic et al. [4] demonstrated the feasibility of a large-scale simulation of a wall with 124 layers and a large, complex excavator arm with approximately 900 layers. They predicted the part distortion of the mBAAM process based on actual tool path and energy information converted from a G-code post-processed command file. Lee et al. [15] studied the influence of interlayer cooling time on Ti plate distortion in a large-scale LMD-w process. They conducted thermomechanical simulation for ten layers of double beads. The results showed that asymmetric distortion was attributed to the unidirectional scan direction. Hu et al. [3] simulated a thermal history for a thin, rectangular wall with 124 layers, using FEM simulation to correlate mBAAM process parameters with the resulting microstructure and properties.
In this study, three-dimensional (3D) FEM simulation was developed to understand the effect of process parameters (interlayer cooling time, clamp constraint, and tool path strategy) on part distortion and residual stress in an LMD-w process. We took into account variations in laser power, cooling conditions and tool paths during the large-scale LMD-w process. The simulation results were validated with the measured temperature profiles and distortion values obtained from a 3D laser scanner. A practical solution to minimize the part deformation and asymmetric stress distribution is proposed for large-scale Ti-6Al-4V components based on the simulation and experimental results.
2. Materials and Methods
2.1. Experimentation
2.1.1. Build Conditions and Input Parameters: Double Back, Interlayer Time and Layer Time
The build was printed with a six-axis KUKA robot system. A fiber laser of 20.0 kW was used to melt wire and deposit in the LMD-w system. The laser spot diameter and robot travel speed were 7.4 mm and 8.0 mm/s, respectively. The laser was delivered to the work piece through an optical fiber. The material was fed from 1.6 mm Ti-6Al-4V wire with an Abicor Binzel wire feeder. The printing was performed in a closed argon environment. A single or double beads wall with 46 layers were built for the experiments. A bead width of 11.5 mm and height of 1.6 mm were set for the single bead deposit. The distance between bead centers was 7.6 mm for double beads deposit.
Figure 1 shows the variation of laser power as a function of time during the build process. The power used to melt the wire and wall fluctuates between layers. A layer deposition time was approximately 78 s, which included two beads melting time (=22 s for each bead), double back time (shown in Figure 2 and 1.25 s for each bead), bead time (=13.3 s between beads), and layer time (=17.5 s at every layer). Interlayer cooling time was applied at every three layers for 110 s. An additional ~10 min of cooling was applied on top of the interlayer cooling time at the 34th and 40th layers, to prevent overheating the build. The inset shows the power on and off at each layer.
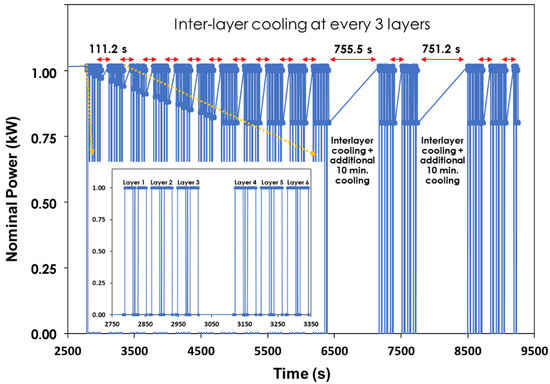
Figure 1.
Estimation of layer deposition time from the measurement. There is additional cooling time at 34th and 40th layers to prevent the build overheating. Inlet shows the power variation at the layer 1~6.
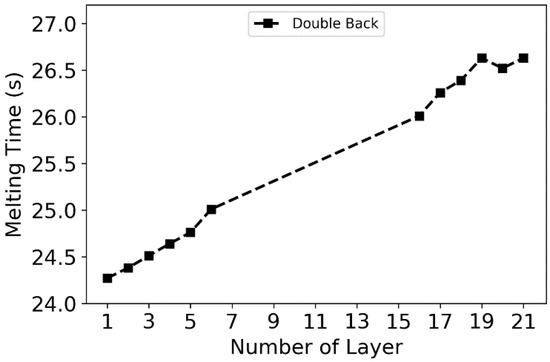
Figure 2.
A characteristic melting strategy called double-back which is used to recover the declined wall edge. The melting time continuously increases by 0.125 s per layer up to 20th layer and becomes constant at further layers.
A characteristic melting strategy used in the experiment and simulation is presented in Figure 2. In the experiment, the beam moved backward by 10 mm for the first layer and then increased the distance by 1 mm per layer, up to 20th layer. This backward melting with addition of material was designed to recover the declined deposit edge of the wall, i.e., part slumping. The backward melting (i.e., double-back) became a constant of 30 mm from 21th layer onward. The double-back time continuously increases by roughly 0.125 s up to 20th layer.
Six walls were built to investigate the effect of interlayer cooling time and constraint on the part deformation: a single bead (SB), three double beads (DB) with full clamp (bolted at every other hole) and two DB with center clamp conditions (bolted at two center holes). Three interlayer cooling times of 0 (=DB-1), 2 (=DB-2) and 4 (=DB-3) min were tested for the full clamping condition, and the two interlayer cooling times of 4 (=DB-4) and 0 (=DB-5) min were tested for the center clamping condition. The experimental conditions were summarized in Table 1 below. Figure 3 shows the deposited single and double walls with 0-, 2- and 4-min interlayer cooling time.

Table 1.
Experimental settings to investigate the influence of interlayer cooling time on part deformation.
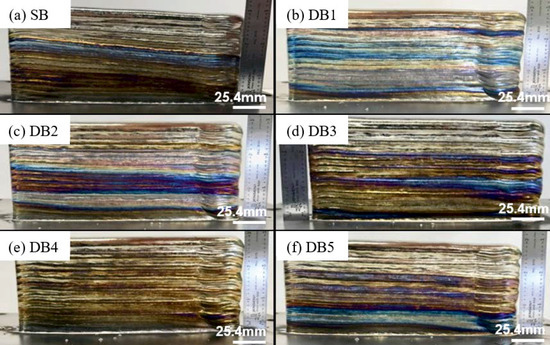
Figure 3.
Deposited walls fabricated with 0, 2 and 4 min interlayer cooling time.
2.1.2. Temperature Measurement
The schematic of the build geometry and the location of thermal couples are given in Figure 4. Ti-plate has 30 clamp holes each with a diameter of 13.5 mm. The full clamp condition had bolts at holes as shown in Figure 4a, while the center clamp condition had bolts only at the two center holes, as in Figure 4b. Five thermo-couples were inserted into the drilled holes on the Ti-plate to capture temperatures during and after the printing process. K-type thermocouples were used with a measurement uncertainty of 2.2 °C, or 0.75%. The Ti-plate was clamped to a 50.8 mm thick steel plate.
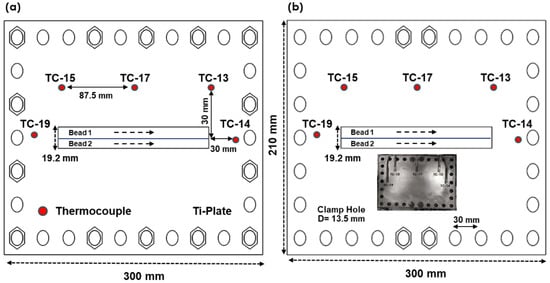
Figure 4.
Location of constraints and thermo-couples in (a) full clamp build and (b) center clamp build. A bolt clamp was used to fix the Ti build plate to the steel plate.
2.1.3. Distortion Measurement
Interlayer geometry scans were conducted with a laser line scanner mounted on the print head for the primary purpose of geometry control, but also for characterizing the distortion behavior. The edges of the build plate were scanned in addition to the build geometry every three layers. The print head moved the scanner over the build geometry and build plate in a raster pattern at a velocity of 10 mm/s. The spatial resolution attained was 1 mm along the scan-axis and 0.1 mm along the scanner line itself. Scan data was used to generate a color map of the edge of the plate that could be used to identify location-specific distortion on an interlayer basis as well as final distortion after the completion of the last layer of a build.
Post-build analysis included geometry scans of the completed walls after they were unbolted from the underlying substrate, using a FaroArm® scanner shown in Figure 5, which produced digital 3D representations of both the walls and build plates that could be used to attain a more complete representation of final and total distortion.
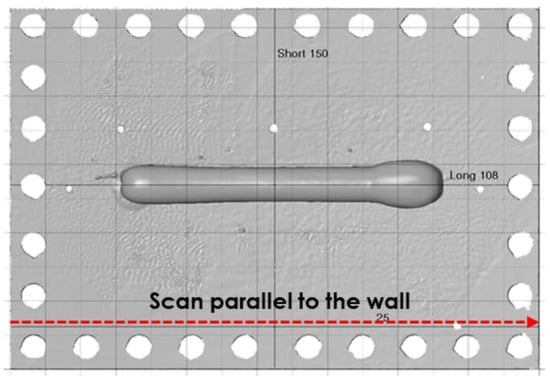
Figure 5.
Plate Faro-scan for the build with double beads.
2.2. Methodology of Numerical Simulation
2.2.1. Boundary Conditions, Build Geometry and Material Properties
Figure 6 represents the solution domain for thermal and mechanical simulation. The domain was created using a mesh and geometry generation toolkit CUBIT by Sandia National Laboratory. The characteristic mesh size used in the simulation was 1.6 mm for the Ti-wall and the Ti-plate, corresponding to the bead height. An approximately three times coarser mesh of 4.8 mm was used for the steel plate, for computational efficiency. The numerical solution was calculated using the commercial finite element method (FEM) package, ABAQUS 2018 [16]. The detailed features of the ABAQUS AM module and simulation have been addressed in earlier literature [4,5,17]. The model has 189,028 3D 8-node linear isoparametric hexahedral elements for heat transfer (DC3D8) and stress (C3D8) analyses. The model domain consists of Ti-wall, Ti-plate, and steel plate. The dimensions of the Ti plate were 300 mm (L) × 210 mm (W) × 6.35 mm (H), and the Ti-wall was 175 mm (L) × 19.2 mm (W) × 75 mm (H).
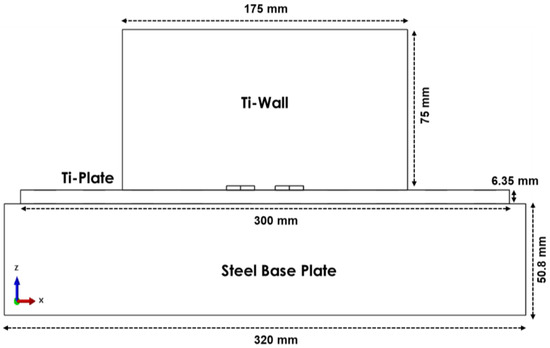
Figure 6.
Computation solution domain for thermal and mechanical simulation.
In the experiment, four and fourteen clamps were applied for the center clamp and full clamp conditions, respectively, to hold the Ti plate to the base plate. Ideally, the Ti build plate should be in full contact with the base plate. However, the two contacting surfaces of the solid plates are not perfectly smooth, so, practically speaking, there is a variable gap present along the interface. As the heat is transferred from the hot build plate to the colder base plate, a noticeable temperature drop can be found at the contact interface. This physical phenomenon is called thermal conductance [18]. There are several factors influencing the thermal conductance, such as asperity between two intermate contacts, contact pressure, cleanness, and plate deformation. The gap distance between two contacts can vary with the plate deformation caused by thermal expansion or shrinkage during printing. Since it is hard to precisely determine the variation of thermal conductance at all locations throughout the experiment, the simulation considers the thermal contact as a model parameter. The thermal contact between the Ti build plate and base plate is modeled as a surface tie. The heat transfer values of 1.4 mW/mm2·°C, 1.0 mW/mm2·°C and 0.85 mW/mm2·°C were applied to three sectioned areas on the base plate based on clamp locations.
A moving laser heat source is described as a point-concentrated heat source due to the relatively large element size compared to the melt pool. The heat source acts in the cuboidal element and moves according to the tool path. A combined heat transfer coefficient of convection and radiation was calibrated and used for heat loss through the surrounding environment [19]. The original equation is expressed below
where is the combined heat transfer coefficient and is emissivity.
Homogeneous and temperature-dependent thermo-mechanical properties are used in the simulation. The isotropic plasticity model was used to consider the mechanical response. The properties were obtained from material simulation JMatPro and literature [15,20,21]. The values used in the simulation are listed in Appendix A Table A1 and Table A2.
2.2.2. Potential Effect of Microstructure on part Residual Stress and Distortion
During fusion-based processing of Ti-6Al-4V via wire arc additive manufacturing or blown powder deposition, the solid-state phase transformation can potentially contribute to residual stresses. It has been proposed that, despite the variations in cooling rate across different fusion-based processes, the main solid state phase transformation is β→α’ [22,23,24,25]. During thermal cycling, the α’ may decompose to diffusional α. However, the β→α’/α transformation can potentially contribute to residual stress development in the material due to the volume change that accompanies the change in crystal structure from body centered cubic (β) to hexagonal close packed (α/α’). Ahn et al. [26] conducted a systematic study to investigate the impact of phase transformations in Ti-6Al-4V on the resulting residual stresses and concluded that the effect of phase transformations was minimal, owing to the low mismatch in the specific volumes of the BCC and HCP phases.
2.2.3. Design of Tool Path
One of the critical process parameters associated with deposit quality is a tool path, because it guides the motion of the laser head [2,27,28]. Characteristic features of a tool path, such as discontinuous deposition, sharp turns at the edges of a given geometry, and overlap ratio can lead to defects, non-uniform stress distribution and part failure. Figure 7 illustrates three different tool path designs commonly used in LMD-w. The letter n indicates the current layer and n+1 represents the subsequent layer. The deposition repeats the sequence of 1→2→3→4 until the end of the process. A unidirectional path, as in Figure 7a, is the simplest and most common tool path [29]. The print head always moves from the left to the right direction at every layer. A bidirectional path, as in Figure 7b, alternates the direction at every track on a layer. It potentially generates a uniform temperature distribution at the left and right edges, but it may produce overheating at the corner due to sharp turns. The last path strategy is a bidirectional path with 180° rotation at every layer, as in Figure 7c. It can avoid the accumulation of overheating caused by a repeated starting location. For instance, track 3 is melted at n+1th layer but is next to track 2 of the previously deposited nth layer.
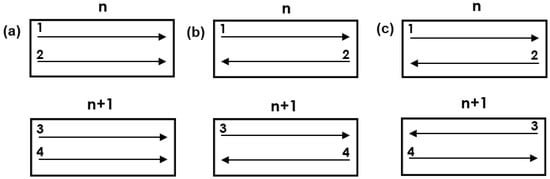
Figure 7.
Tool path strategies used in this study, (a) unidirection, (b) bidirection and (c) bidirection with 180 degree rotation at every layer.
3. Results
3.1. Imperfections of the Build at Various Interlayer Cooling Time
Six walls were built with different interlayer cooling times, and the effect on part distortion is shown in Figure 8. For the double beads (DB) condition, 0 to 4 s interlayer cooling times were examined. The plate deformation increased with increasing interlayer time in DB, regardless of the type of constraint. Larger distortion was observed under center clamp than full clamp conditions. The literature shows that the distortion and residual stresses strongly depend on the clamping conditions [30,31]. The distortions on the left and right sides of the plate could be asymmetric due to unidirectional tool path.
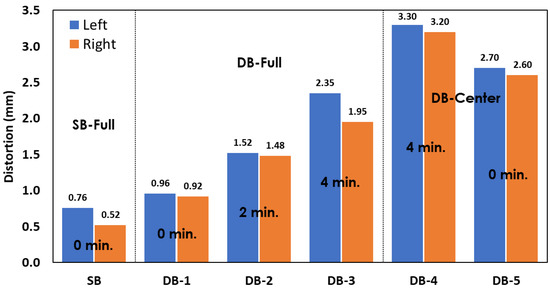
Figure 8.
Influence of build conditions on the plate distortion. The distortion increases with interlayer cooling time. Larger distortion is observed at the center clamp compared to the full clamp conditions.
3.2. Prediction and Validation of Temperature Profile and Part Distortion
3.2.1. Validation of Temperature Profile
Accurate prediction of distortion and residual stress relies on the transient temperature profile. Four different experimental settings (DB-1, DB-2, DB-4, and DB-5) were explored to investigate the effect of interlayer cooling time on temperature profile and the resulting distortion. Figure 9 and Figure 10 show a comparison of the predicted temperature profile with the measured one, for the full clamp condition (Figure 9) and the center clamp condition (Figure 10). The temperatures were extracted from the model time histories at the same locations with thermo-couples of TC-13 (=Right), -15(=Left) and -17(=Center), as shown in Figure 4.
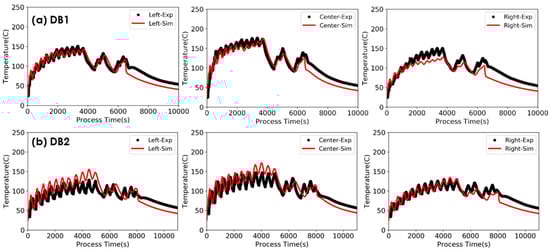
Figure 9.
Measured temperature history and model prediction at TC-13 (=right), -15(=left) and -17(=center) during the deposition at full clamp condition. Two interlayer cooling times of (a) DB1 = 0 min and (b) DB2 = 2 min.
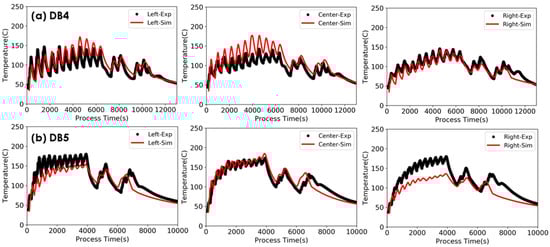
Figure 10.
Measured temperature history and model prediction at TC-13 (=right), -15(=left) and -17(=center) during the deposition at center clamp condition. Two interlayer cooling times of (a) DB4 = 4 min and (b) DB5 = 0 min.
The temperature profiles agree reasonably well with the thermo-couple measurements of TC-13, -15 and -17 in both the full clamp and center clamp conditions. Temperature mismatches were observed in the temperature profile, for instance, at the right region in DB-5. This is likely due to the gap created between the Ti and steel plates, which strongly influence the heat transfer through the plates during the heating and cooling processes. In our model, the gap heat transfer coefficient values were used as calibration parameters. To improve the model accuracy, a detailed measurement of the heat transfer coefficient between Ti and steel base plate as a function of contact configuration are required and are a part of our ongoing research. The calculated temperature profiles were used for mechanical simulation.
3.2.2. Validation of Distortion
Figure 11 shows the measured and predicted distortion in a color plot after the completion of the first and last layers at the edge of the DB-4 build plate. The thicker red color represents a higher distortion in the plate. The two red circles at the plate center are the clamp bolts that were placed on the top of the plate, because the laser scanner measured a high distortion value for the bolts. Approximately 3.3 mm of distortion was observed at both side edges of the plate, as shown in Figure 11a,b. The distortion progressively decreased towards the center of the plate, and became almost zero at the center region, because of the bolt clamps. This trend was well captured by the prediction in Figure 11c,d.
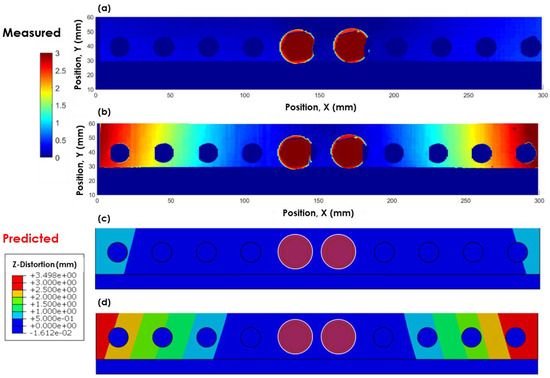
Figure 11.
Distortion at the edge of the build plate for DB-4 (=center clamp and 4 min interlayer cooling time). The magnitude of the measured (a,b) and predicted (c,d) distortions are well agreed at layer 1 and layer 47. Laser line scanner was used for the measurement.
The predicted distortions for DB-1, DB-2, DB-4, and DB-5 are compared with the measured values using the FaroArm scanner in Figure 12 and Figure 13. The blue marker and red solid line represent the predicted and measured values, respectively. The plate bends upwards by approximately 1.0 mm and 1.5 mm in DB-1 and DB-2, respectively, and 3.3 mm and 2.6 mm in DB-4 and DB-5, respectively. This upward bending can be explained by the temperature gradient mechanism [32,33]. The deposited layer expands during heating and contracts during cooling. The contraction of the upper layer is constrained by the previously deposited layer and generates tensile residual stress, resulting in the upward bending. Larger distortion was found in DB-2 (2 min. interlayer cooling) and DB-4 (4 min.) than in DB-1 (0 min.) and DB-5 (0 min.). This shows that the level of distortion increased with interlayer cooling time. This is consistent with the findings of Delinger et al. [7] on blown powder direct energy deposition of Ti-6Al-4V. Also, larger distortion was observed in center clamp conditions (DB-4 and DB-5) than full clamp conditions (DB-1 and DB-2). This indicates that the full clamp constraint effectively decreased the distortion. The model prediction captured all the characteristic features described above for the center and full clamp conditions. This implies that the model can predict the evolution of residual stress at various conditions with a reasonable accuracy.
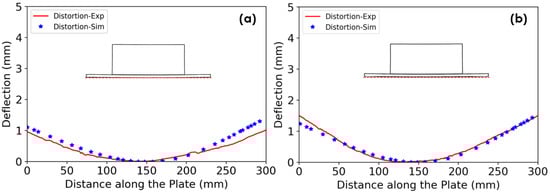
Figure 12.
Validation of plate distortion (blue = simulation and red = experiment). (a) DB-1 with 0 min and (b) DB-2 with 2 min interlayer cooling time. The magnitude of distortion became larger with increasing interlayer time.
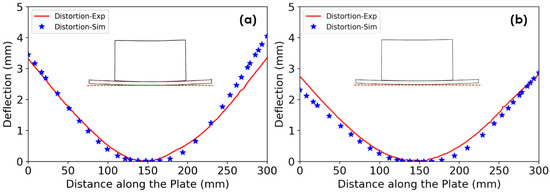
Figure 13.
Validation of plate distortion (blue = simulation and red = experiment). (a) DB-4 with 4 min and (b) DB-5 with 0-minute interlayer cooling time. The magnitude of distortion became larger with increasing interlayer time.
3.3. Effect of Tool Path on Part Residual Stress and Distortion
3.3.1. Unidirectional
Figure 14 represents the predicted normal residual stress (=) in the z-direction contours of the Ti wall and plate before and after the restraints were released from the plate. The residual stress contour for DB-1 is shown in Figure 14a,c and the contour for DB-2 is shown in Figure 14b,d. The residual stress was generally tensile over the wall. Notice that stress concentrated at the corner of the Ti-wall and -plate interface during cooling in Figure 14a,b, and then decreased when the bolts were released, as shown in Figure 15a,b. If the tensile stress is high enough in other parameter conditions, the corner would possibly be a visible cracking initiation spot (inset in Figure 14a). The stress distribution of DB-2 was similar to that of DB-1. However, the maximum value of the residual stress was approximately 30 MPa higher in DB-2 than that in DB-1. Moreover, higher contour values, in orange and red color, were observed in a wider area in DB-2. It can thus be concluded that shorter interlayer cooling time not only produced less distortion but also lowered residual stress.
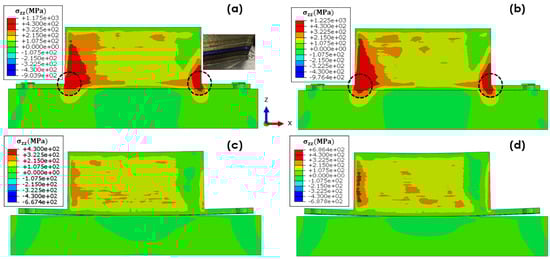
Figure 14.
Residual stress prediction at the end of printing in full clamp of (a) DB-1 with 0 min and (b) DB-2 with 2 min interlayer cooling time, and center clamp of (c) DB-5 with 0 min and (d) DB-4 with 4 min interlayer cooling time.
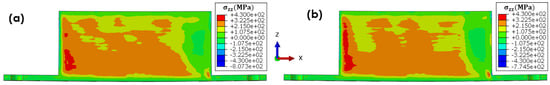
Figure 15.
Stress distribution after releasing the constraints at (a) DB-1 with 0 min and (b) DB-2 with 2 min interlayer cooling time.
As seen in Figure 14 and Figure 15, the residual stress distribution is spatially non-uniform over the part. To quantify the inhomogeneity, the distribution and magnitude of residual stresses at the bottom, middle and top region of the wall along the x-axis (=longitudinal direction) are plotted in Figure 16. As expected, a large residual stress was found at the bottom corners of the wall in the DB-1 full clamp condition, shown in Figure 16a, but not in the DB-5 center clamp condition, shown in Figure 16b. High tensile stresses were observed at the bottom of the wall corners, where cracking was observed in DB-1. Since DB-5 did not constrain the wall corners with bolts, there was no significant development in residual stress at the corners. In the middle region, the residual stress was relatively high at the left edge and maintains a constant level across the central region. Then, the stresses suddenly drop at the right edge region. This is because the tool path was unidirectional and ended at the right edge, such that heat accumulated, and stress relaxation occurred in that region.
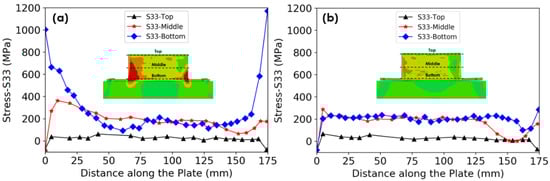
Figure 16.
Calculated stress along deposit direction (=along x-axis) at (a) DB-1 (full clamp) and (b) DB-5 (center clamp) with 0 min interlayer cooling time.
3.3.2. Bidirectional with Rotation
Tool path optimization is the most effective way to control distortion and residual stresses at a given geometry. A bidirectional tool path with 180° rotation was tested using DB-1 and DB-5 conditions to compare the distortion and residual stresses to the cases with the unidirectional tool path. An approximately 50% reduction of residual stress was observed at the bottom wall corner of DB-1 with full clamps, as shown in Figure 17a,c. Although there was no noticeable stress reduction found in DB-5, a symmetric stress dip was found at the wall edges along the middle line as shown in Figure 17b, d. This indicates that the bidirectional tool path improved the symmetrical distribution of residual stress.
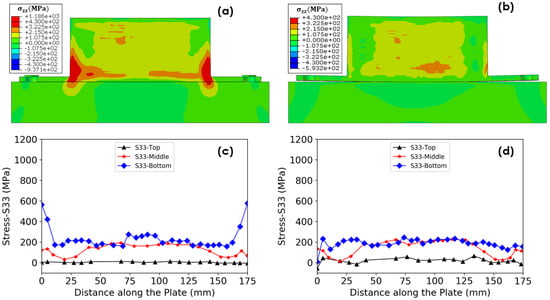
Figure 18 shows a comparison of the predicted distortions from the bidirectional tool path to the distortion from the unidirectional tool path in DB-1 and DB-5. There was little reduction in the distortion observed in full clamp DB-1, while a noticeable reduction was observed in center clamp DB-5—an approximately 20% reduction at each edge. It is reported that inhomogeneous stress distribution can lead to larger distortion after removal of the clamp [11]. A bidirectional tool path leads to a symmetric distribution of stress, and consequently, produced less distortion in DB-5.
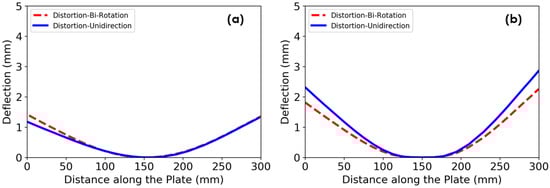
Figure 18.
Comparison of the predicted distortions from the bidirectional tool path to the distortion from the unidirectional tool path in (a) DB-1 and (b) DB-5.
4. Discussion
The current version of the macroscale simulation model has been developed as a tool to interpret experimental results and provide practical support for the development of large-scale AM with Ti alloys. Of the numerous uncertainties in the model, we see the models for heat transfer from and between the surfaces in the model as the most important and in need of further development. We use the heat transfer coefficients as the main calibration parameters. The modeling and calibration of the heat transfer between dissimilar materials and their contact configuration (Ti- and steel-plates in this work) and the heat transfer from the free surfaces (radiation and convection) are needed to improve model accuracy and prediction capability. Previous studies [2,13] neglected the role of thermal conductance between the two intimate contacts because they designed one side clamp so the part was hung in the air. However, in practical build configurations, the dominant heat transfer direction is between the Ti-plate and substrate. Insufficient control of this process may lead to uneven temperature distribution and distortions in the Ti-plate. In this study, the same heat transfer coefficients at the contacts were applied for full clamp and center clamp conditions, which may explain the temperature discrepancy in the right region in DB-5. Since the thermal conductance varies with contact pressure and part deformation, further calibration and measurement of heat transfer coefficient are required to improve the accuracy of the temperature prediction. For in-situ distortion prediction for height control, and for process optimization, further measurements and calibration are needed.
As the build height increases, the heat transfer between the Ti (build) plate and steel (foundation) plate becomes less important, and the radiation from the build surfaces takes over as the main heat drain. As the overall wall surface area increases, the heat loss by convection also increases. In large structural parts [4], the radiation and convection heat loss often dominate the effect of thermal conductance as the part builds up. The development of the corresponding heat transfer models for Ti large scale AM will be shown in upcoming publications.
5. Conclusions
In this work, a sequentially coupled 3D thermo-mechanical simulation was performed, calibrated and validated for LMD-w process. The effect of interlayer cooling time, clamp constraints, and tool path strategy was investigated to optimize part distortion and residual stress in large-scale laser additive manufactured Ti-6Al-4V components. The following key findings and conclusions can be made from this study:
- 1.
- The developed numerical simulation shows the capability of predicting the temperature histories and changes in distortion at various process parameter conditions in LMD-w process. The simulated temperature profile and distortion agree well with the measured values.
- 2.
- The part distortion decreased with decreasing interlayer cooling times. Also, shorter interlayer cooling time reduced the residual stress. Minimal interlayer cooling time is recommended to mitigate the plate distortion and residual stress as well as increase build productivity.
- 3.
- Full clamp constraint was more effective at reducing part distortion compared to the center clamp. However, in the full clamp condition, high stress concentrations caused corner cracking at the corner of the interface between the wall and plate.
- 4.
- A unidirectional tool path led to spatially non-uniform stress distribution over the part, while a bidirectional tool path with 180° rotation improved the symmetricity of stress distribution.
- 5.
- Compared to DB-5, a bidirectional tool path with 180° rotation in DB-1 decreased the residual stress by approximately 50% at the bottom corner, which potentially reduces the susceptibility to cracking.
Ongoing work includes an extension of the simple two-bead wall geometry to practical industrial geometries. Then, the model can be used to control microstructure, distortion and residual stress to achieve a high-quality part at a given complex geometry in the LMD-w process.
Author Contributions
Conceptualization, Y.L. and Y.B.; methodology, Y.L. and S.S.; validation, Y.B. and B.T.G.; resources, B.R. and S.S.; data curation, Y.L.; writing-original draft preparation, Y.L., P.N. and B.T.G.; writing-review and editing, P.N. and S.S.; supervision, S.S. and B.R., project administration, B.R. and S.S.; funding acquisition, B.R. and S.S.
Funding
The research was funded by the US Department of Energy, Office of Energy Efficiency and Renewable Energy, Advanced Manufacturing Office under contract DE-AC05-00OR22725 with UT-Battelle, LLC. This work is also supported in part by Cooperative Research and Development Agreement with GKN Aerospace, under contract No. NFE-15-05725. The United States government retains and the publisher, by accepting the article for publication, acknowledges that the United States government retains a non-exclusive, paid-up, irrevocable, worldwide license to publish or reproduce the published form of this manuscript, or allow others to do so, for United States government purposes. The Department of Energy will provide public access to these results of federally sponsored research in accordance with the DOE public access plan (http://energy.gov/downloads/doe-public-access-plan).
Acknowledgments
The authors like to acknowledge the contribution of the extended Oak Ridge National Laboratory and GKN Aerospace teams, particularly those of Abigail Barnes of ORNL and Aaron Thornton, W. Chad Henry and Chris Allison of GKN Aerospace.
Conflicts of Interest
The authors declare no conflict of interest.
Appendix A
Table A1.
Material properties of the Ti plate and wall used in the model [15,20,21].
Table A1.
Material properties of the Ti plate and wall used in the model [15,20,21].
| Temp (°C) | Density | Cond. | Specific | Temp (°C) | Exp. | E | Poisson Ratio | Yield |
|---|---|---|---|---|---|---|---|---|
| 110 | 4.42 | 7.2 | 5.6 | 93 | 12.1 | 101 | 0.33 | 735 |
| 210 | 8.8 | 5.8 | 205 | 12.5 | 94 | 0.33 | 685 | |
| 310 | 10.4 | 6.0 | 315 | 12.9 | 88 | 0.33 | 636 | |
| 410 | 11.9 | 6.2 | 425 | 13.3 | 82 | 0.33 | 586 | |
| 510 | 13.5 | 6.5 | 540 | 13.8 | 77 | 0.33 | 542 | |
| 610 | 15.1 | 6.7 | 650 | 14.2 | 72 | 0.33 | 501 | |
| 710 | 16.6 | 6.9 | 710 | 14.4 | 67 | 0.33 | 459 | |
| 810 | 18.2 | 7.1 | 870 | 15.0 | 62 | 0.33 | 417 | |
| 910 | 19.8 | 7.3 | * Thermal properties: Latent heat = 2.86 × 10¹¹ mJ/tonne, Solidus = 1604 °C, Liquidus = 1650 °C * Units: Density (×10−9 tonne/mm3), Specific heat (×10−9 mJ/tonne.C), Conductivity (mW/mm.C), Expansion (×10−6/°C), Elastic (×103 MPa), Plastic (MPa) | |||||
| 1010 | 4.34 | 21.4 | 7.5 | |||||
| 1110 | 22.9 | 7.8 | ||||||
| 1210 | 24.5 | 8.0 | ||||||
| 1310 | 23.6 | 6.9 | ||||||
| 1410 | 24.8 | 7.1 | ||||||
| 1510 | 26.1 | 7.3 | ||||||
| 1610 | 27.4 | 7.5 | ||||||
Table A2.
Material properties of the steel plate used in the model [15,20].
Table A2.
Material properties of the steel plate used in the model [15,20].
| Temp (°C) | Density | Cond. | Specific | Temp (°C) | Exp. | E | Poisson Ratio | Yield |
|---|---|---|---|---|---|---|---|---|
| 110 | 7.73 | 18.4 | 4.8 | 93 | 12.1 | 210 | 0.33 | 354 |
| 210 | 19.6 | 5.2 | 205 | 12.5 | 203 | 0.33 | 306 | |
| 310 | 21.0 | 5.7 | 315 | 12.9 | 194 | 0.33 | 279 | |
| 410 | 22.5 | 6.2 | 425 | 13.3 | 183 | 0.33 | 258 | |
| 510 | 23.8 | 7.0 | 540 | 13.8 | 169 | 0.33 | 246 | |
| 610 | 24.8 | 8.1 | 650 | 14.2 | 155 | 0.33 | 237 | |
| 710 | 25.6 | 10.1 | 710 | 14.4 | 146 | 0.33 | 167 | |
| 810 | 26.5 | 7.4 | 870 | 15.0 | 123 | 0.33 | 95 | |
| 910 | 27.5 | 7.0 | * Thermal properties: Latent heat = 2.72 × 10¹¹ mJ/tonne, Solidus = 1265 °C, Liquidus = 1500 °C * Units: Density (×10−9 tonne/mm3), Specific heat (×10−9 mJ/tonne.C), Conductivity (mW/mm.C), Expansion (×10−6/°C), Elastic (×103 MPa), Plastic (MPa) | |||||
| 1010 | 28.6 | 6.9 | ||||||
| 1110 | 29.8 | 7.0 | ||||||
| 1210 | 30.9 | 7.1 | ||||||
| 1310 | 32.0 | 7.4 | ||||||
| 1410 | 33.1 | 8.5 | ||||||
| 1510 | 32.5 | - | ||||||
References
- Debroy, T.; Mukherjee, T.; Milewski, J.O.; Elmer, J.W.; Ribic, B.; Blecher, J.J.; Zhang, W. Scientific, technological and economic issues in metal printing and their solutions. Nat. Mater. 2019, 18, 1026–1032. [Google Scholar] [CrossRef] [PubMed]
- Wang, J.; Lin, X.; Li, J.; Hu, Y.; Zhou, Y.; Wang, C.; Li, Q.; Huang, W. Effects of deposition strategies on macro/microstructure and mechanical properties of wire and arc additive manufactured Ti 6Al 4V. Mater. Sci. Eng. A 2019, 754, 735–749. [Google Scholar] [CrossRef]
- Hu, X.; Nycz, A.; Lee, Y.; Shassere, B.; Simunovic, S.; Noakes, M.; Ren, Y.; Sun, X. Towards an integrated experimental and computational framework for large-scale metal additive manufacturing. Mater. Sci. Eng. A 2019, 761, 138057. [Google Scholar] [CrossRef]
- Simunovic, S.; Nycz, A.; Noakes, M.W.; Chin, C.; Oancea, V. Process Modeling and Validation for Metal Big Area Additive Manufacturing; NAFEMS World Congress: Stockholm, Sweden, 2017; pp. 1–17. [Google Scholar]
- Lee, Y.; Kirka, M.; Dinwiddie, R.; Raghavan, N.; Turner, J.; Dehoff, R.; Babu, S. Role of scan strategies on thermal gradient and solidification rate in electron beam powder bed fusion. Addit. Manuf. 2018, 22, 516–527. [Google Scholar] [CrossRef]
- Hönnige, J.R.; Colegrove, P.A.; Ahmad, B.; Fitzpatrick, M.E.; Ganguly, S.; Lee, T.L.; Williams, S.W. Residual stress and texture control in Ti-6Al-4V wire+ arc additively manufactured intersections by stress relief and rolling. Mater. Des. 2018, 150, 193–205. [Google Scholar] [CrossRef]
- Denlinger, E.R.; Heigel, J.C.; Michaleris, P.; Palmer, T. Effect of inter-layer dwell time on distortion and residual stress in additive manufacturing of titanium and nickel alloys. J. Mater. Process. Technol. 2015, 215, 123–131. [Google Scholar] [CrossRef]
- Zhao, H.; Zhang, G.; Yin, Z.; Wu, L. Effects of Interpass Idle Time on Thermal Stresses in Multipass Multilayer Weld-Based Rapid Prototyping. J. Manuf. Sci. Eng. 2013, 135, 011016. [Google Scholar] [CrossRef]
- Aggarangsi, P.; Beuth, J.L. Localized preheating approaches for reducing residual stress in additive manufacturing. In Proceedings of the SFF Symposium, Austin, TX, USA, 8–10 August 2006; pp. 709–720. [Google Scholar]
- Babu, S.S.; Raghavan, N.; Raplee, J.; Foster, S.J.; Frederick, C.; Haines, M.; Dinwiddie, R.; Kirka, M.K.; Plotkowski, A.; Lee, Y.; et al. Additive Manufacturing of Nickel Superalloys: Opportunities for Innovation and Challenges Related to Qualification. Metall. Mater. Trans. A 2018, 49, 3764–3780. [Google Scholar] [CrossRef]
- Ding, J.; Colegrove, P.; Mehnen, J.; Ganguly, S.; Almeida, P.S.; Wang, F.; Williams, S. Thermo-mechanical analysis of Wire and Arc Additive Layer Manufacturing process on large multi-layer parts. Comput. Mater. Sci. 2011, 50, 3315–3322. [Google Scholar] [CrossRef]
- Mukherjee, T.; Zuback, J.S.; De, A.; Debroy, T. Printability of alloys for additive manufacturing. Sci. Rep. 2016, 6, 19717. [Google Scholar] [CrossRef]
- Heigel, J.; Michaleris, P.; Reutzel, E. Thermo-mechanical model development and validation of directed energy deposition additive manufacturing of Ti–6Al–4V. Addit. Manuf. 2015, 5, 9–19. [Google Scholar] [CrossRef]
- Cao, J.; Gharghouri, M.A.; Nash, P. Finite-element analysis and experimental validation of thermal residual stress and distortion in electron beam additive manufactured Ti-6Al-4V build plates. J. Mater. Process. Technol. 2016, 237, 409–419. [Google Scholar] [CrossRef]
- Lee, Y.; Bandari, Y.K.; Simunovic, S.; Richardson, B.S.; Kirka, M.M. Correlations of Interlayer Time with Distortion of Large Ti-6Al-4V Components in Laser Metal Deposition with Wire; Oak Ridge National Lab. (ORNL): Oak Ridge, TN, USA, 2018. [Google Scholar]
- ABAQUS. Analysis User’s Manual; Dassault Systémes Simulia Corp: Providence, RI, USA, 2017. [Google Scholar]
- Zhang, Q.; Xie, J.; Gao, Z.; London, T.; Griffiths, D.; Oancea, V. A metallurgical phase transformation framework applied to SLM additive manufacturing processes. Mater. Des. 2019, 166, 107618. [Google Scholar] [CrossRef]
- Salerno, L.J.; Kittel, P. Thermal Contact Conductance, NASA Technical Memorandum 110429; Ames Research Center: Moffet Field, CA, USA, 1997. [Google Scholar]
- Goldak, J.; Chakravarti, A.; Bibby, M. A new finite element model for welding heat sources. Metall. Mater. Trans. A 1984, 15, 299–305. [Google Scholar] [CrossRef]
- Saunders, N.; Guo, U.K.Z.; Li, X.; Miodownik, A.P.; Schillé, J.-P. Using JMatPro to model materials properties and behavior. JOM 2003, 55, 60–65. [Google Scholar] [CrossRef]
- Babu, B.; Lindgren, L.-E. Dislocation density based model for plastic deformation and globularization of Ti-6Al-4V. Int. J. Plast. 2013, 50, 94–108. [Google Scholar] [CrossRef]
- Sridharan, N.; Chaudhary, A.; Nandwana, P.; Babu, S.S. Texture Evolution During Laser Direct Metal Deposition of Ti-6Al-4V. JOM 2016, 68, 772–777. [Google Scholar] [CrossRef]
- Szost, B.A.; Terzi, S.; Martina, F.; Boisselier, D.; Prytuliak, A.; Pirling, T.; Hofmann, M.; Jarvis, D.J. A comparative study of additive manufacturing techniques: Residual stress and microstructural analysis of CLAD and WAAM printed Ti–6Al–4V components. Mater. Des. 2016, 89, 559–567. [Google Scholar] [CrossRef]
- Thijs, L.; Verhaeghe, F.; Craeghs, T.; Van Humbeeck, J.; Kruth, J.-P. A study of the microstructural evolution during selective laser melting of Ti–6Al–4V. Acta Mater. 2010, 58, 3303–3312. [Google Scholar] [CrossRef]
- Wang, F.; Williams, S.; Colegrove, P.; Antonysamy, A.A. Microstructure and Mechanical Properties of Wire and Arc Additive Manufactured Ti-6Al-4V. Metall. Mater. Trans. A 2013, 44, 968–977. [Google Scholar] [CrossRef]
- Ahn, J.; He, E.; Chen, L.; Wimpory, R.; Dear, J.; Davies, C. Prediction and measurement of residual stresses and distortions in fibre laser welded Ti-6Al-4V considering phase transformation. Mater. Des. 2017, 115, 441–457. [Google Scholar] [CrossRef]
- Ding, D.; Pan, Z.; Cuiuri, D.; Li, H. A tool-path generation strategy for wire and arc additive manufacturing. Int. J. Adv. Manuf. Technol. 2014, 73, 173–183. [Google Scholar] [CrossRef]
- Michel, F.; Lockett, H.; Ding, J.; Martina, F.; Marinelli, G.; Williams, S. A modular path planning solution for Wire+ Arc Additive Manufacturing. Robot. Comput. Integr. Manuf. 2019, 60, 1–11. [Google Scholar] [CrossRef]
- Saboori, A.; Gallo, D.; Biamino, S.; Fino, P.; Lombardi, M. An Overview of Additive Manufacturing of Titanium Components by Directed Energy Deposition: Microstructure and Mechanical Properties. Appl. Sci. 2017, 7, 883. [Google Scholar] [CrossRef]
- Choobi, M.S.; Haghpanahi, M.; Sedighi, M. Investigation of the effect of clamping on residual stresses and distortions in butt-welded plates. Sci. Iran. Trans. B Mech. Eng. 2010, 17, 387. [Google Scholar]
- Tsunori, M.; Davies, C.M.; Dye, D.; Nikbin, K.M. Numerical modelling of residual stress and distortion in welded thin steel plates. In Proceedings of the ASME 2008 Pressure Vessels and Piping Conference, Chicago, IL, USA, 27–31 July 2008; pp. 299–307. [Google Scholar]
- Colegrove, P.A.; Coules, H.E.; Fairman, J.; Martina, F.; Kashoob, T.; Mamash, H.; Cozzolino, L.D. Microstructure and residual stress improvement in wire and arc additively manufactured parts through high-pressure rolling. J. Mater. Process. Technol. 2013, 213, 1782–1791. [Google Scholar] [CrossRef]
- Fidder, H.; Ocelík, V.; Botes, A.; De Hosson, J.T.M. Response of Ti microstructure in mechanical and laser forming processes. J. Mater. Sci. 2018, 53, 14713–14728. [Google Scholar] [CrossRef]
© 2019 by the authors. Licensee MDPI, Basel, Switzerland. This article is an open access article distributed under the terms and conditions of the Creative Commons Attribution (CC BY) license (http://creativecommons.org/licenses/by/4.0/).