1. Background
In the coming years, all European countries should comply with the objectives of the Energy Efficiency Directive for Buildings (2010/31/EC) [
1]. This directive establishes a set of measures to face the challenge of the so-called almost zero energy consumption buildings, nZEB (nearly Zero Energy Buildings) by 2020.
In the construction sector, this directive is a means of transforming the design, construction, and management procedures towards greater energy efficiency in buildings and cities.
The challenge affects both architects and the rest of the agents (promoters, builders, manufacturers of materials, systems, and equipment), that will have to meet the regulatory requirements.
The main priority of a nZEB is the energy efficiency. In the buildings, from the conception of design to the exploitation, the objective of actively reducing the energy consumption of the final building. Although the objective is reducing energy demand, a second priority focuses on the remaining energy needs and renewable energies. Therefore, a nZEB will not only imply an optimized design and construction, but also the exploitation of energy resources in the most efficient way.
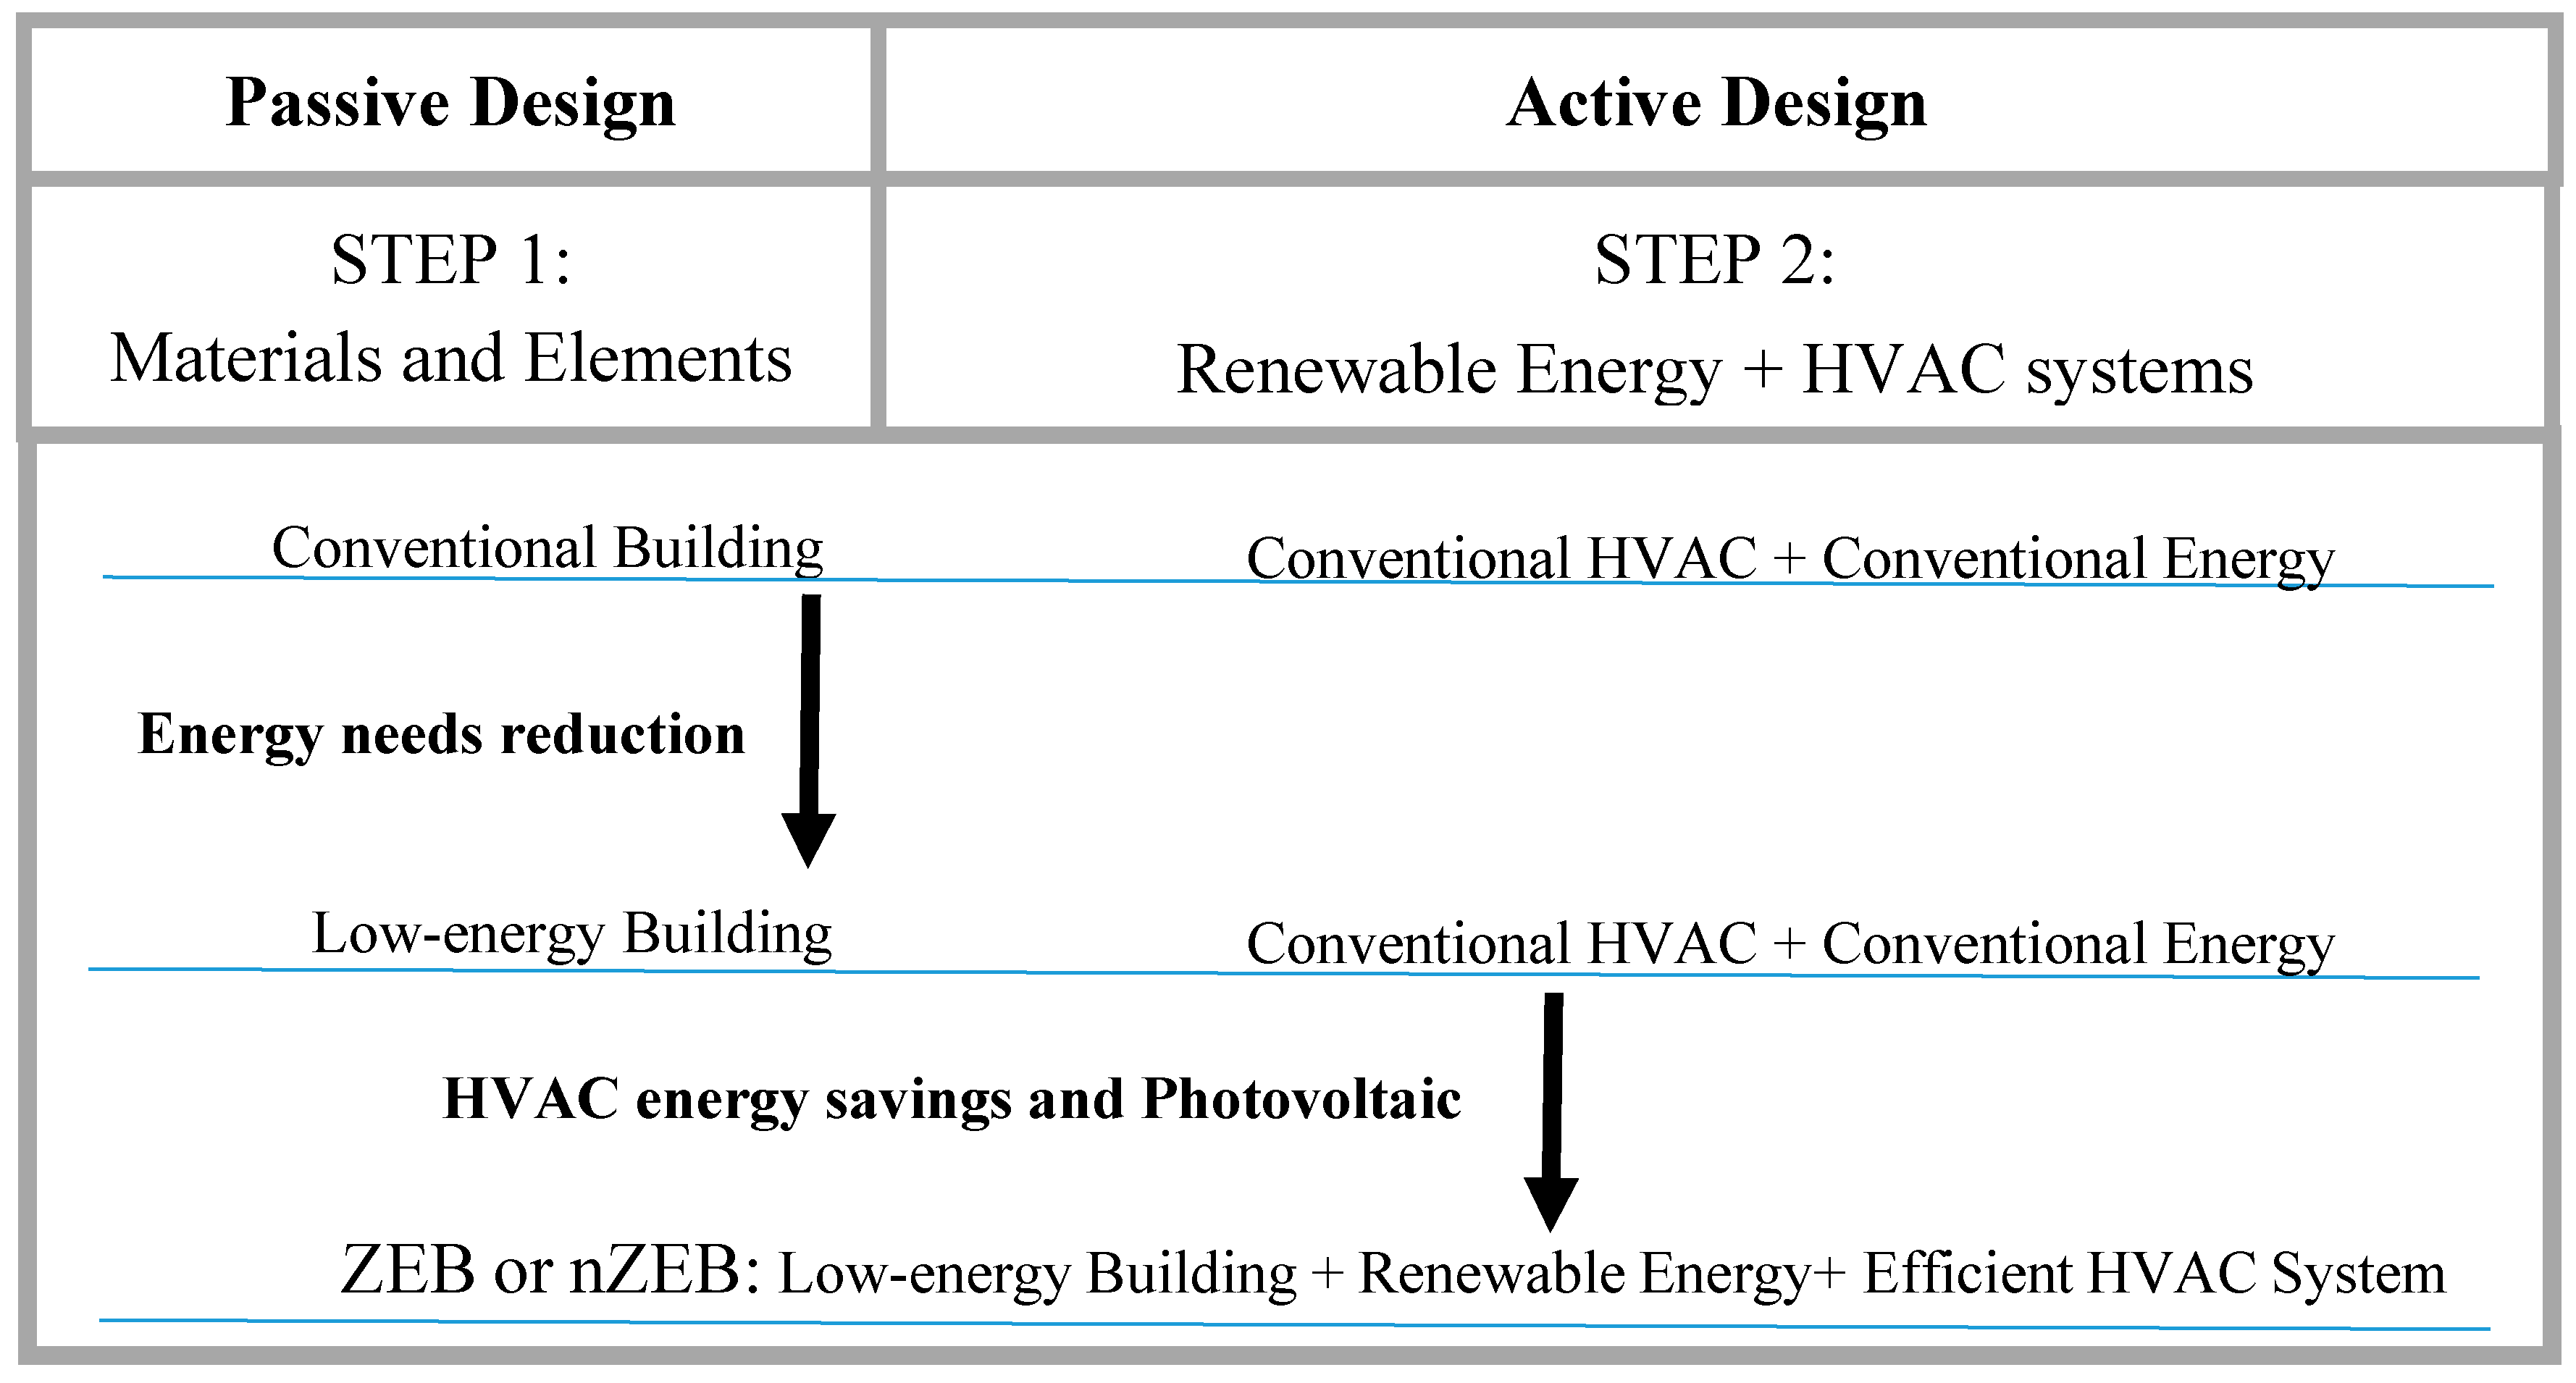
The present paper explores a methodology to design a nZEB building, by choosing design elements in two steps (
Figure 1). Firstly, the selection of passive elements, and secondly the selection of active elements with a system of photovoltaic panels to generate the energy required by such building. To achieve a ZEB (Zero Energy Building), the Building Integrated Photovoltaic (BIPV) systems used to generate electricity can play an important role [
2]. A comprehensive review of the current state of the art in the area of the BIPV technology is shown in [
3]. Moreover, some studies have verified the validity of BIPV systems for the challenge of Zero Energy Buildings [
4].
In Ferrara et al. [
5], it is demonstrated that the zero energy objective is technically feasible through the optimal interaction of all the building design variables, that can be studied in detail through advanced simulation and optimization models.
In [
6], a procedure for cost optimal and nZEB energy performance levels calculations is defined: the selection of the reference building, the definition of construction concepts based on building envelope optimization, the specification of building technical systems, the energy simulations for specified construction concepts (in this paper it is not a simulation, and it is based on a simplified model), economic calculations, and sensitivity analyses.
The main goal of the present paper is showing a methodology to achieve the design of a nZEB, including passive elements and active elements, particularly, photovoltaic, and HVAC (Heating, Ventilation, and Air Conditioning) systems.
The Energy Performance of Buildings Directive [
7] lists the main end-uses to be included in a building, such as heating, domestic hot water, refrigeration, ventilation, and lighting, being heating and cooling the elements with the highest levels of energy consumption.
To achieve an nZEB, finding out the optimal combination for a building design is necessary. To define the design elements, it is also important to consider the location and the climatic conditions. The climatic conditions and the elements define the energy demand for the heating and cooling period, based on the thermal characteristics of the passive elements. After the passive elements, active elements (as the application of photovoltaic panels) produce the necessary energy, and elements such as HVAC systems provide the required comfort level. Moreover, according to the efficiency of the passive elements and the active systems, a life cycle cost (LCC) could be defined.
In [
8], a recent review about the optimization and cost-optimal methodologies applied in the low-energy building design and environmental considerations is shown. In 2017, Loukaidou et al. defined the determination of optimal cost solutions towards nearly zero-energy buildings as a serious challenge [
9]. A review on simulation-based optimization methods applied to building performance analysis is shown in Nguyen et al. [
10]. The previous research shows the increasing trend regarding the number of optimization studies in the building area, the classification of building optimization problems and the mostly-used algorithms.
The present paper is based on an approach of a previous study [
11], focused on the minimization of building’s thermal loads through the employment of passive elements, and on a second study [
12] focused on the implementation of efficient HVAC systems, as low temperature surface embedded heating and cooling systems. In [
12], the HVAC system with different types of energy (Electric Heat Pump—EHP, Gasoil—G, biomass boiler—BB, wood pellets boiler—WPB, natural gas—NG, and woodchips boiler—WCB) is selected. Particularly, the present paper is focused on photovoltaic systems and the selection of HVAC systems based on electricity. If the adoption of renewable energy generation technologies (photovoltaics in this case) was not enough, the system would use energy from the conventional power networks.
The paper shows 12 case studies for different climatic zones in Spain. The solution obtained is based on a methodology in order to optimize the life cycle cost, minimizing the building’s thermal loads, and to select the photovoltaic technology and the HVAC system. The paper is structured as follows.
Section 1 introduces the methodology of passive optimization and explains the methodology proposed for its application with photovoltaic technology.
Section 2 exposes the case studies.
Section 3 shows the main results obtained and
Section 4 highlights the main conclusions.
2. Methodology
The process to obtain a ZEB or a nZEB requires the following steps: Firstly, the design of a building, according to the Spanish technical building code. Secondly, the optimization of the passive elements. Thirdly, the application of renewable energies and the choice of HVAC systems, for which it is necessary to redefine the life cycle cost. These aspects will be analyzed below.
2.1. Human Design Model
The first step is the human (user) design; the user builds a reference model, the initial design. The design defines a set of building specifications: the type of building, the location, the climate zone, the orientation, and a first decision and selection of elements or materials (floor, walls, windows, etc.). This step defines a fixed set of independent variables related to the building, which is generally accepted in the Spanish technical building code.
2.2. Passive Optimization
The methodology proposed is focused on the minimization of a building’s energy demand during the design process. The decision is made through the employment of passive elements. To evaluate and study the design decision, the tabu algorithm analyzes solutions and alternatives. In papers [
8,
13,
14] different algorithms and computational optimization methods applied to obtain ZEBs or nZEBs are shown. The methodology applied in passive elements is presented in [
11].
The present methodology was validated by a detailed software tool (LIDER-CALENER). This software is used as a basic procedure for building energy certification according to the Spanish building regulations.
After the human design, a simplified model of analysis was applied. This simplified model calculates the heating and cooling demand. The energy demand was considered and quantified by a simplified model defined by [
15].
The annual heating demand (HD) is estimated by Equation (1).
The heating demand in kWh/m
2 is based on the climatic zone and the corresponding correlation coefficients (
a,
b,
c,
d). The heating months include January–May and October–December. The parameters, variables and data are defined in
Table 1.
The annual cooling demand (CD) is estimated by Equation (2).
The cooling demand in kWh/m
2 is based on the climatic zone and the corresponding correlation coefficients (
a,
b,
c,
d,
e,
f). The cooling months include June–September, which define the corresponding correlation coefficients. The parameters, variables and data are defined in
Table 1.
The cooling and heating demand are used to define the Energy Performance Certificates (EPCs). The EPCs calculation method is very similar in all countries, using the annual energy demand of the building to calculate the energy rating [
16]. For such calculation, it is necessary to be very precise defining the building envelope, materials, thermal bridges, heating and cooling, etc. The methodology proposed seeks the best passive solution, based on the best EPC with the lowest Life Cycle Cost (LCC). The LCC is defined in Equation (3) and contains the cost of investment in materials and construction elements, which depend on the materials selected and their characteristics: the thermal transmittance of the opaque (walls, roofs and floors); thermal transmittance, solar factor and permeability of windows; linear thermal transmittance of thermal bridges; permeability, etc. As the investment has effects on the building demand, it implies that such demand defines the operation cost due to energy consumption for heating and cooling demand of the building studied, and therefore the living cost of consumption and emissions generated by such building.
The LCC is a method of economic analysis which solution depends on the forecasting of the relative weights for different optimization criteria: the number of years considered in the study of economic efficiency, the interest rate used to calculate the Net Present Value (NPV) and the cost of energy.
In optimization methods, the Energy Efficiency Index (EEI), or sometimes known as Building Energy Index (BEI) [
17], is the most commonly used index as a Key Performance Indicator (KPI) to track and compare performance of energy consumption in buildings. For this reason, this criterion is used in conjunction with the LCC in the methodology proposed. The solution is focused on optimizing the LCC of a building with the lowest EEI, when selecting the material for a building envelope. The Spanish EEI and energy rating labels are defined in González et al. [
18].
2.3. Renewable Energy: Photovoltaics
In the present paper, solar energy was selected among other renewable energy resources due to the fact that photovoltaic systems are clean, inexhaustible and eco-friendly.
Regarding the passive decision, the first step (the selection of the passive elements) leads to the best EEI with the minimum LCC. The material selected, and their characteristics, define the building demand, , which could be generated by a solar installation. Let us suppose that in this case it is an autonomous solar photovoltaic installation (that is, it is isolated from the electricity grid). Therefore, a suitable dimension of the energy need is a main goal, as well as an analysis of the economic cost of the installation for it.
Once the annual demand is defined, it is necessary to calculate the total energy needed to supply such demand (Equation (4)), this is the total energy that has to be produced to supply the building’s HVAC demand.
Once the available solar radiation is known, that is, the incident solar radiation (which depends on the location of the building) the energy production capacity of solar panels could be known. These values can be obtained through the existing tables with such estimations. Particularly, in this paper the PVGIS software information (Photovoltaic Geographical Information System—European Commission, Joint Research Center) was used, which estimates produced energy with relative accuracy in Europe and Africa [
19,
20]. To obtain the data of the PVGIS, latitude and longitude are required (failing that, a geolocation could be used), and then the system provides, on a monthly basis, the data from: the optimal inclination angle, the annual irradiation deficit due to shadowing, the irradiation on a horizontal plane, the irradiation on an optimally inclined plane, and the optimal inclination, among other things. This paper uses the estimation based on the photovoltaic potential of an area under consideration. In general, the installation is usually sized for the most unfavorable monthly conditions of insolation, and thus ensures that it covers the demand throughout the year.
Once the incident solar radiation is known, it is divided in order to calibrate the modules (1 kW/m
2) and the amount of peak sun hours (PSH) is obtained. For practical purposes, in the case studies analyzed in the present paper, this value does not change, but the concept of PSH will be used, since it is the equivalent number of hours that the sun would have to shine at an intensity of 1000 W/m
2 to obtain the total insolation of a day, due to the fact that the intensity of the sun varies throughout the day.
The methodology proposed determines the selection of the optimal solar panel. For doing this, it is necessary to know each solar panel and its characteristics: the name of the product and the company (both hidden in the paper), the price in €/Wp (per m2 of solar panel), the type of solar panel, the efficiency of the solar panel, and the power range. Additionally, the weight and the size of the solar panels are also known.
In order to calculate the number of modules, Equation (6) defines it as the required energy divided by PSH, the efficiency of the solar panel and the peak power of the module.
After counting the number of solar panels required, the number of panels in m2 was less than the square meters available on the roof of the building. If the available square meters had exceeded the square meters, the conventional electricity would have had to be used.
The performance of the solar panels must take into account the losses due to various reasons: losses caused by possible fouling and/or deterioration of the photovoltaic panels (normally 0.7–0.8). This factor is understood to be the efficiency factor obtained from the manufacturer’s data.
For this reason, it will be required to produce more energy than the demand required by the final user.
In the methodology proposed, it is assumed that there are no batteries, but that the energy not consumed is delivered to the network and the corresponding energy is received from the network when sufficient energy is not generated. However, if an inverter is required, the system selects the power of the DC/AC inverter depending on the total nominal power of the equipment.
The optimizer will be responsible for finding the best option to meet the defined demand.
2.4. Active Systems: HVAC
HVAC systems in buildings have the purpose to ensure a certain level of thermal comfort, but in general, this objective implies high energy consumption and high cost for the installations. In buildings, the end-use of energy is mainly dedicated for conditioning the spaces, both during winter and summer periods. After the evolution from the conventional design to an efficient envelope, the final step is the choice of an efficient HVAC system in order to achieve an optimal indoor comfort level.
In [
7], the application of the HVAC systems is presented, which will be considered for the methodology proposed in this paper.
2.5. Changes in the Life Cycle Cost
The life cycle cost of the building for the optimization of the passive elements is shown in Equation (3). However, with the application of renewable energies and HVAC systems, the LCC is modified (Equation (3)), according to the investment shown in Equation (8).
where the price (€/m
2) and the area (m
2) can be replaced by the price of a solar panel and the number of solar panels to be installed. The cost of the HVAC system is also considered in Equation (8).
Regarding the energy consumption, the calculation of the initial energy consumption (based on the use of the traditional electricity grid) is reduced to zero, given that the main goal of the methodology proposed is the implantation of 100% of renewable energy from solar panels (Equations (9) and (10)). Therefore, it also leads to reduce the costs of CO
2 emissions and to reduce the LCC.
Once the methodology is known, in
Section 2 the case studies will be presented, and in
Section 3, the results of applying this methodology in the case studies will be shown.
3. Case Studies
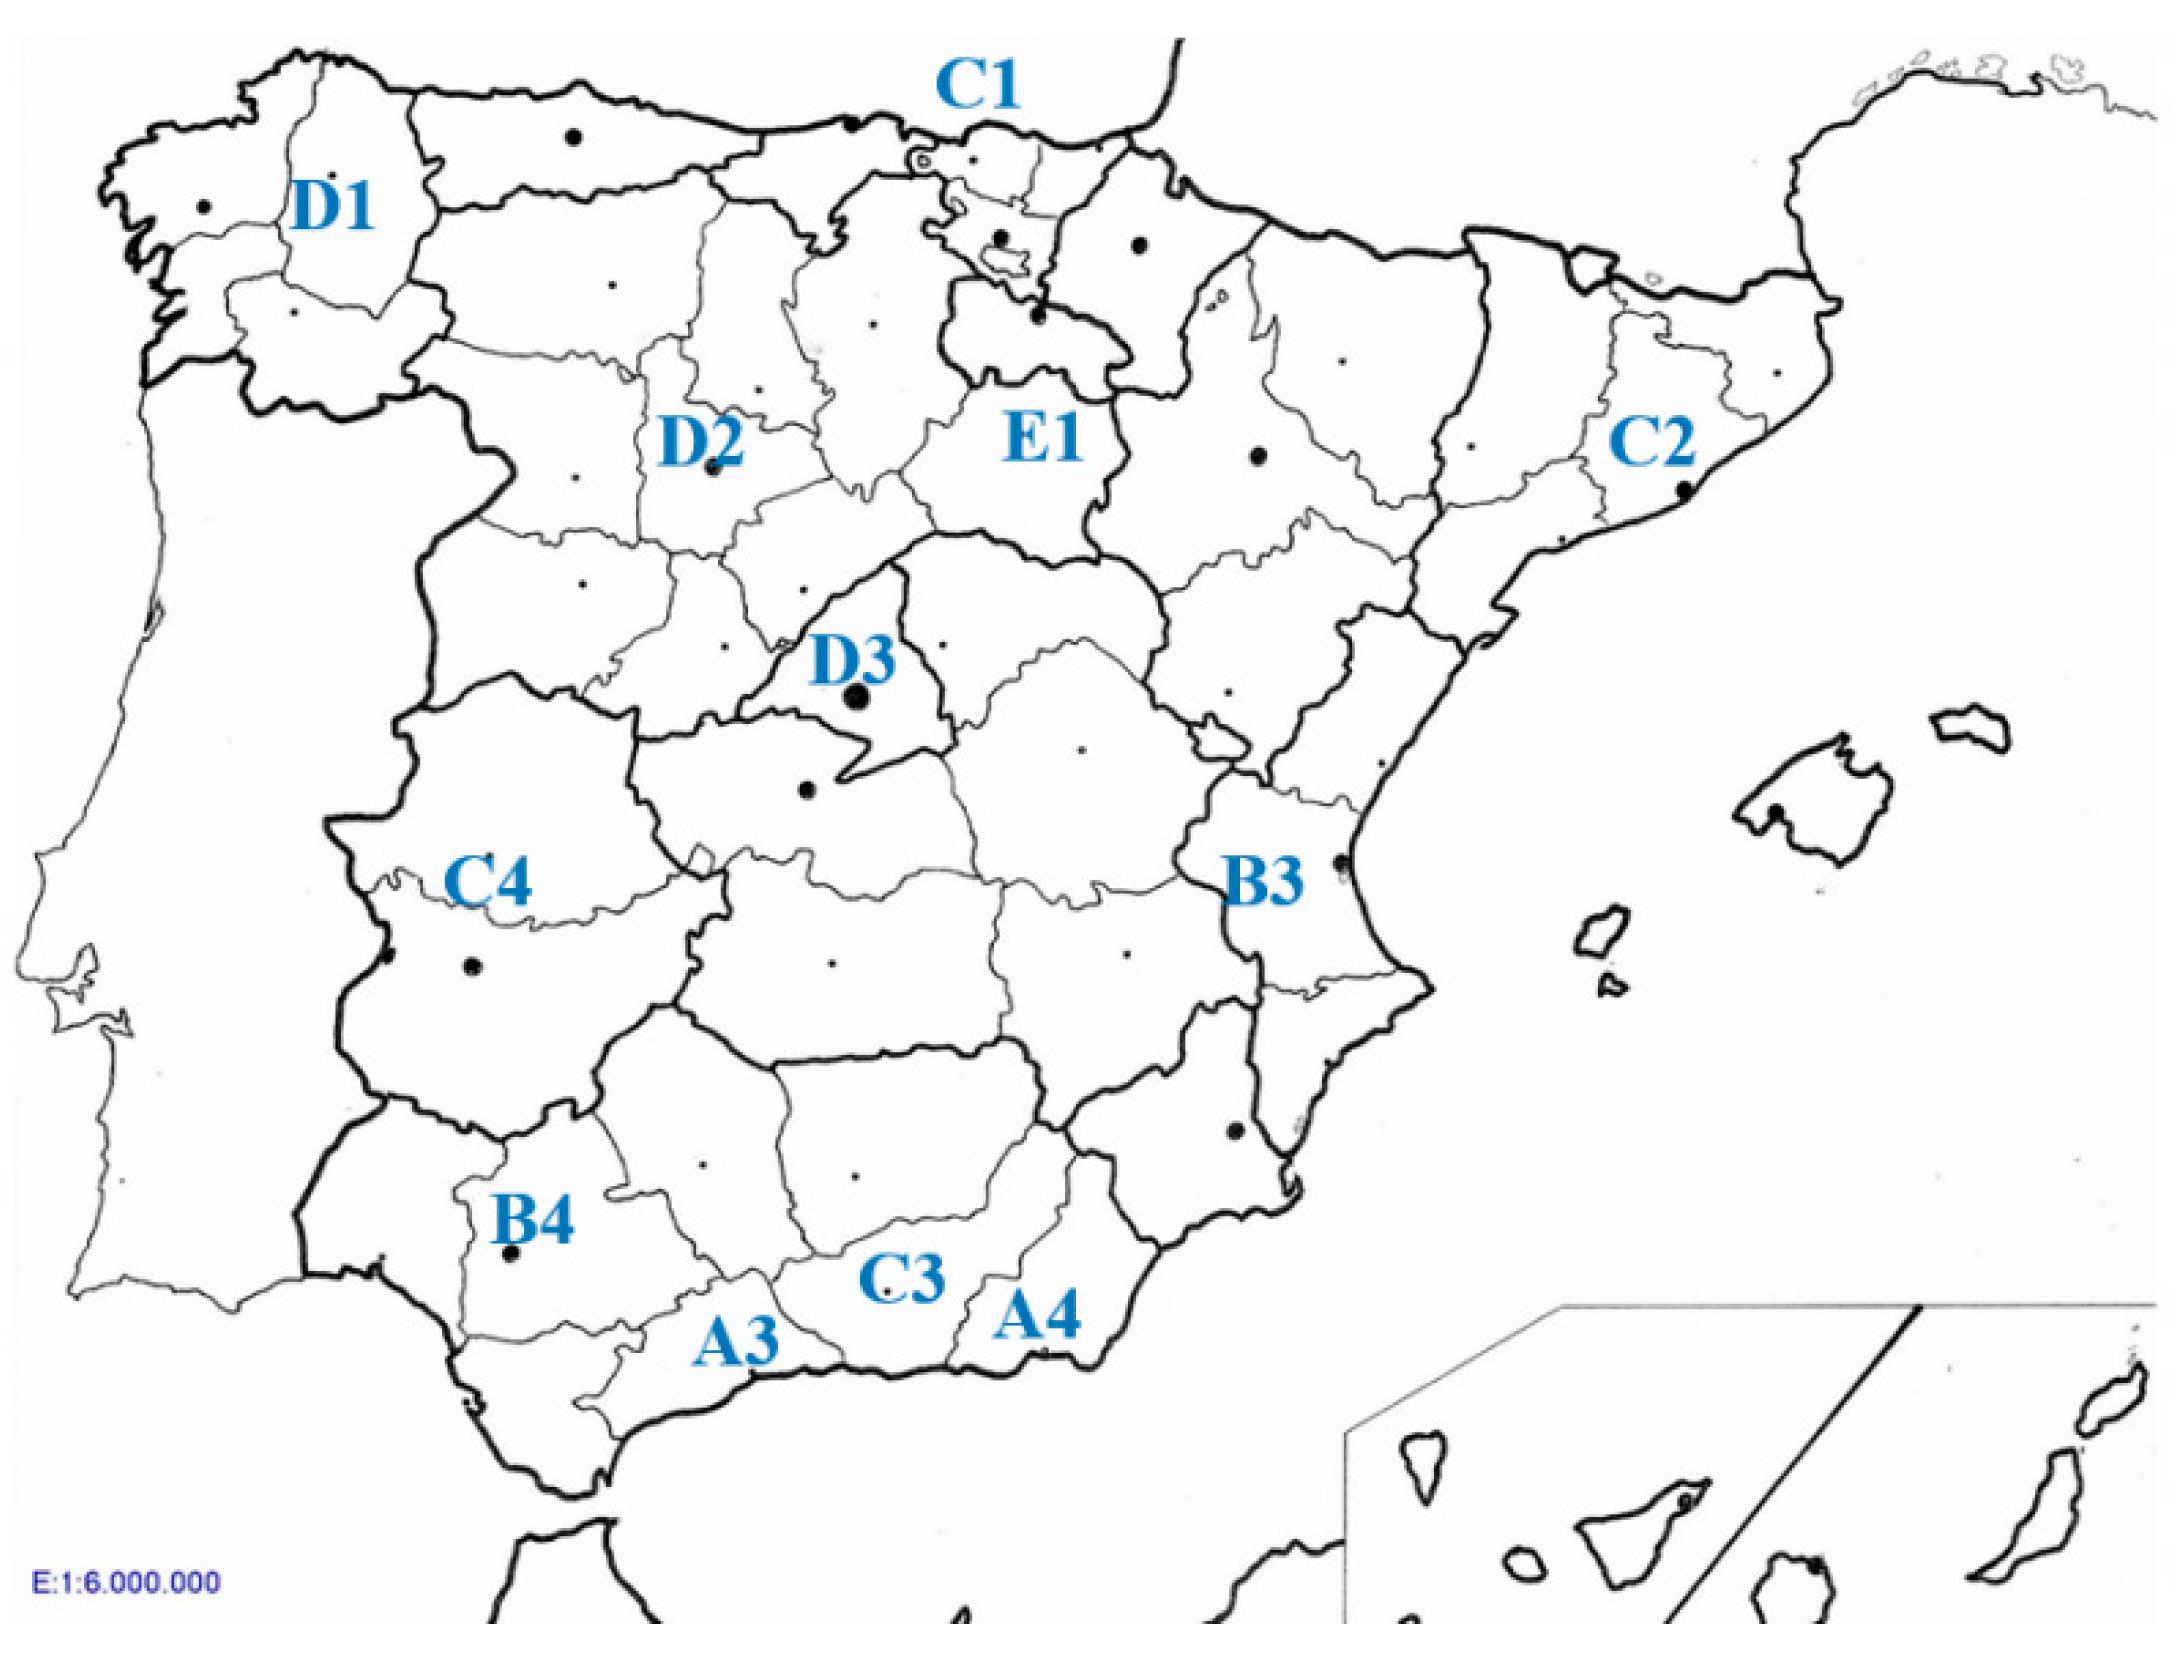
The same building, with the same characteristics was analyzed, located in different locations, with 12 climatic zones (A3, A4, B3, B4, C1, C2, C3, C4, D1, D2, D3, E1). These climatic zones are defined in the Spanish scale (Technical Building Code scale [
21], Figure 3 in [
11]) based on the Winter Climate Severity (WCS, five climate zones in winter, designated by the letters A–E) and the Summer Climate Severity (SCS, four zones for the summer, designated by the numbers 1–4) [
22], defining combinations of WCS and SCS indexes different climatic zones.
Therefore, the building considered was placed in these different locations with their specific climatic conditions. These locations and climatic zones are shown in
Table 2 and
Figure 2.
3.1. Human Design Model
A residential building was considered for the case studies. Such building was a single-family dwelling consisting on three floors: the basement, the ground floor and the first floor (
Figure 3). It has 164.4 m
2 conditioned space, the envelope area is 209.9 m
2, 62.81 m
2 of external walls, and 19.91 m
2 of windows. This building has a flat roof, without tall buildings or trees around it. The whole area on the roof would be available for installing solar modules.
3.2. Passive Optimization
The building designed in
Section 2.1 (the initial design) was the same for all locations considered: the walls u-values are 0.49 W/m
2K, the windows on the north facade: 5.60 W/m
2K u-value, 0.85 g-value, 50
p-value, on the East façade: 1.4 W/m
2K u-value, 0.7 g-value, 9
p-value, on the south facade: 3.30 W/m
2K u-value, 0.75 g-value, 50
p-value. Finally, the roof u-value is 0.57 W/m
2K, and for the floor the u-value is 0.23 W/m
2K. The solution is assuming a 3% interest rate and an increase in energy prices of about 5% for 30-year study.
Initially, the heating and cooling demand (
Table 3) was calculated based on the type on materials used in the construction, which are defined in the previous paragraph,
Currently, the EU carbon price (expressed as CO
2) is about 20 € per ton (lower limit) [
23]. On the other hand, the electricity price in Spain is about 0.13 €/kWh (standard with no time restrictions) [
24].
3.3. Renewable Energy: Photovoltaics
The initial case explored considers a building without solar panels, so as shown in
Table 3, conventional electricity would be used. The new Directive 2010/31/EU introduces the need of an indicator of primary energy, making it necessary to update energy efficiency indicators combining primary energy and CO
2 emissions. In this case, the Spanish (Peninsular) conventional electricity ratio CO
2 is 0.649 kg CO
2/kWh
e and in the case of Solar Photovoltaic is 0 kg CO
2/kWh
e, so these values were applied in Equation (3).
For the application of the methodology proposed, the radiation data from PVGIS were introduced.
Table 4 shows the locations considered for the case studies and their global irradiation.
3.4. Active Systems: HVAC
The solutions obtained, based on the proposed methodology, do not consider the use of HVAC systems. They assume the energy consumption is obtained by the passive elements based on Equations (1) and (2).
3.5. Changes in the Life Cycle Cost
The LCC was calculated (Equation (3)) considering a database with the costs of materials or constructive elements.
In
Section 3, the results are shown after applying the methodology in
Section 1 and using Equations (8)–(10). Therefore, databases were added to the system with information about HVAC systems, solar panels and inverters.
4. Results
In
Section 1, the methodology is shown and in
Section 2 it is particularized for 12 case studies. The results obtained in each step are presented below. The first step, after the case studies are presented, is the application of the tabu algorithm to obtain an optimal solution in LCC, taking into account the costs of the construction elements of the building envelope. The solution is shown in
Table 5.
Comparing the results shown in
Table 3 and
Table 5, it can be observed that the changes regarding the passive elements of the building allow us to improve the energy efficiency. From the human design with the energy rating label C (
Table 3) to energy rating label B (
Table 5).
However, to achieve the highest rating, the use of renewable energy would be necessary. Comparing
Table 3 and
Table 5, there was a certain reduction in demand. The improvement in heating demand can lead to an increase in cooling need. The locations in the north of Spain have greater heating need, see Bilbao (C1) and Soria (E1) with a higher demand for heating comparing to Seville (B4) where the demand is lower and more balanced. Likewise, the LCC of the same building to achieve similar energy efficiency is higher for cold climates.
After the optimization of elements in the first step, in the second step a new optimal solution includes the active elements. The solution is shown in
Table 6. This table shows data regarding the demand, the decision taken regarding the number of solar panels, their characteristics, those of the necessary inverter, and lastly, the estimation of the LCC and the EEI.
In the example above, each proposed solution would consist of a complete list of decisions based on the photovoltaics technologies. The selection of the inverter is the same in all cases (price 0.02 €/Wp, power of 12 kW and efficiency of 85%). The demand is defined in the first step, reducing the final energy consumption (heating and cooling), LCC, EEI and Energy Rating in the second step.
The resolution is built with a dataset of European solar panels obtained from
www.enfsolar.com, in which all the necessary data for the analysis is obtained. The database can be expanded with solar panels of greater efficiency and power, so that the application of the methodology would obtain better results.
In
Table 6, there are three cases in which 100% use of renewable energies is not reached, so other renewable energies that could be more efficient in the area, such as wind energy, could be applied. The solution could be a mix of renewable energies, thus, some energies could be complemented with others to reach the necessary demand. In these three cases, sufficient energy is not achieved due to space limitations, high demand and climatic characteristics.
On the other hand, radiation (
Table 4) and demand (
Table 6) is different for each climate zone. Particularly, the demand in southern Spain is lower and there is good radiation, so the number of panels is lower. Even so, in all locations the highest energy rating is obtained, although the LCC is lower because no CO
2 is generated, nor conventional electricity is used.
In these cities, Lugo (D1), Valladolid (D2) and Soria (E1), where there is no 100% use of renewable energy, the LCC is increased because conventional electricity is used.
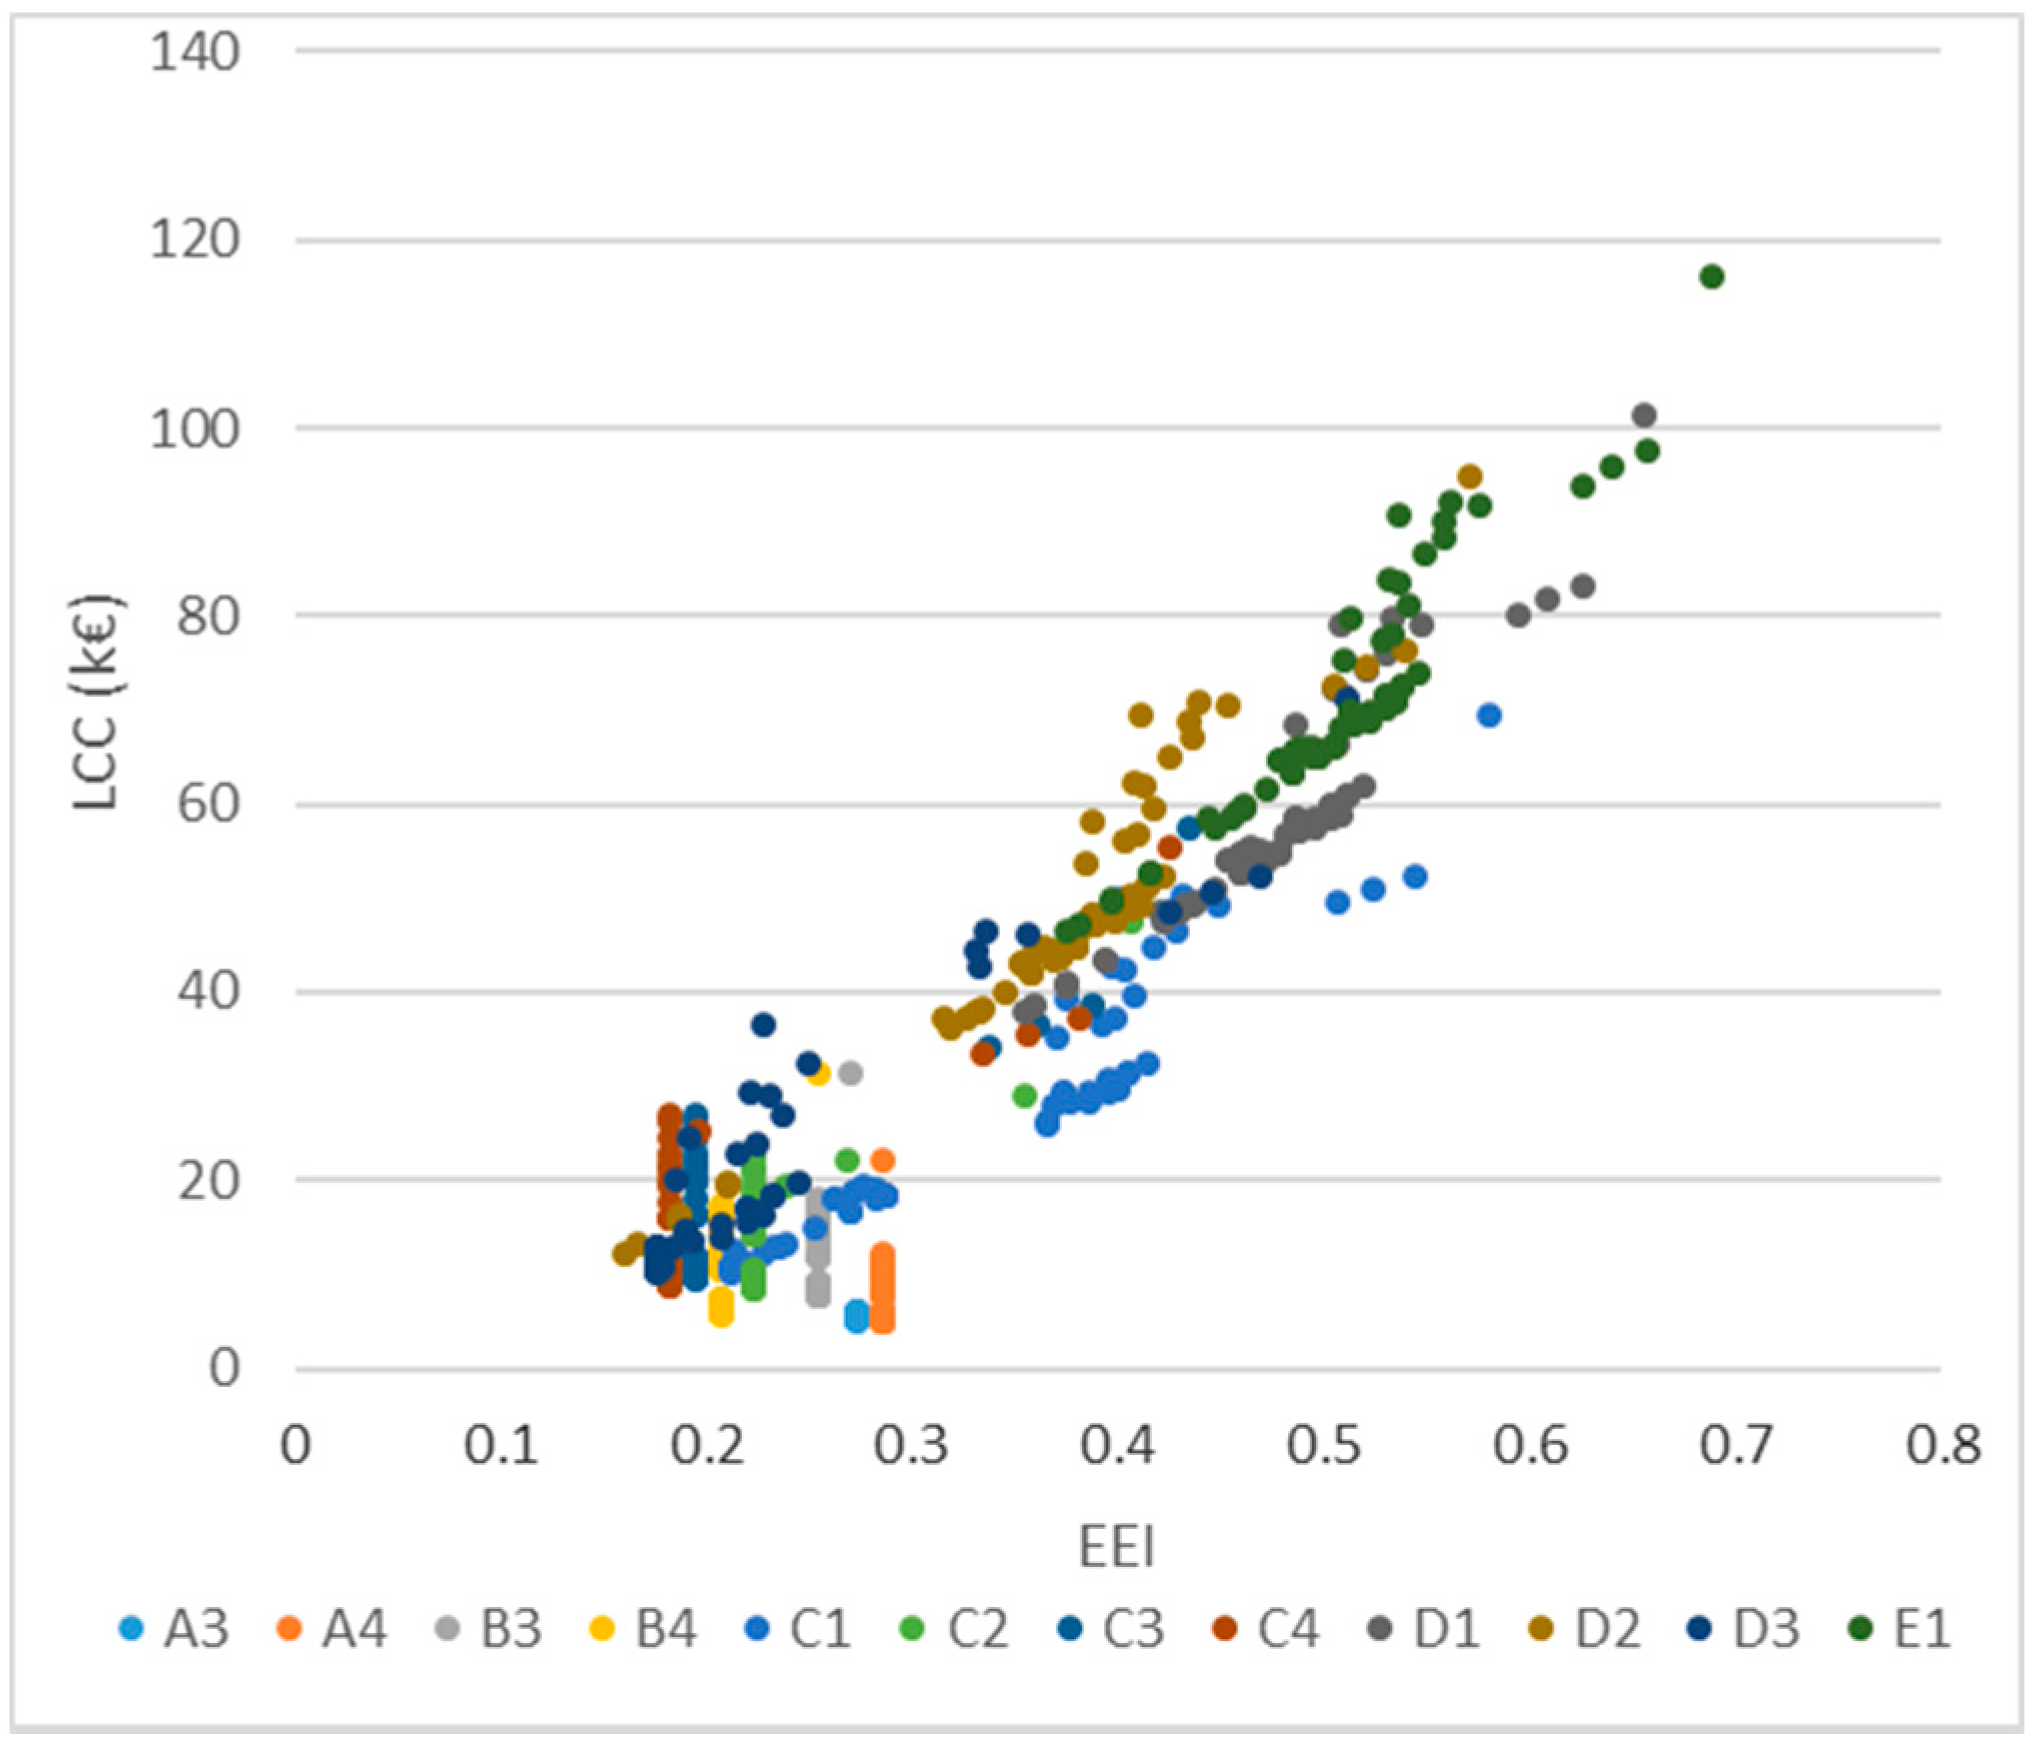
Figure 4 shows the LCC regarding the EEI for different solar panels in the selected cities of each climatic zone. It can be observed that in the climatic zones with high demand and low radiation, not all the solar panels can be used to minimize the EEI of the building with low LCC.
After the application of the methodology proposed for the 12 climatic zones considered, it is observed that such methodology allows a reduction in the first step (the algorithm selects the passive design): about 13% regarding the LCC and 42% regarding the EEI. Additionally in the second step, the active design, the average reduction is 77% in the LCC and 67% in the EEI (
Table 7).
5. Conclusions
To obtain ZEB or nZEB buildings during the design process, complex decisions are required. An expert system to assist in the decisions, regarding the optimal choice of building materials combined with renewable solutions is a good tool.
The methodology proposed in the present paper has been applied to a single-family dwelling type, with calculations carried out for 12 different climatic zones, showing satisfactory results with the official program in Spain (LIDER–CALENER). The consumption was considerably reduced and the differences in the obtained values decreased among the different climatic zones.
The methodology is based on a tabu search for optimizing building design that minimizes the LCC and the EEI of buildings.
The LCC could be improved by 77% with the application of renewable energies, and the EEI could be reduced by 67% to achieve maximum energy efficiency in the building, compared to the initial design.


