Assessment of the Potential of High-Performance Buildings to Achieve Zero Energy: A Case Study

1
Department of Building Environment and Facility Engineering, College of Architecture and Civil Engineering, Beijing University of Technology, Beijing 100124, China
2
Beijing Key Laboratory of Green Built Environment and Energy Efficient Technology, Beijing 100124, China
3
Zhuhai Singyes Green Building Technology Co., Ltd., Zhuhai 519085, Guangdong, China
*
Author to whom correspondence should be addressed.
Appl. Sci. 2019, 9(4), 775; https://doi.org/10.3390/app9040775
Submission received: 24 December 2018
/
Revised: 20 January 2019
/
Accepted: 5 February 2019
/
Published: 22 February 2019
(This article belongs to the Special Issue Zero-Energy Buildings)
Abstract
:Buildings that are designed with aggressive energy performance targets are defined broadly in this study as high-performance buildings. As the technology advances, some of these buildings have the potential to become zero-energy ready through the adoption of cost-effective measures, such as retro-commissioning and occupant behavior techniques. This study demonstrated the viability of an office building to achieve the zero-energy goal and intended to engage the owners of similar facilities. The case building was designed as a very low-energy building with an energy use intensity (EUI) goal of 42 kWh/(m2 a), and the actual EUI was 23.9 kWh/(m2 a). The calibrated simulation approach was employed in the study, and the results indicated that the case building can achieve the zero-energy goal by optimizing the controls of the HVAC (Heating, Ventilation and Air Conditioning) system, changing the occupant behavior and improving the performance of the photovoltaic system.
1. Introduction
A zero-energy building is a building with greatly reduced energy needs through efficiency gains such that the balance of the energy needs can be supplied by renewable energy generated on site on an annual basis [1,2,3]. Achieving zero energy is an ambitious yet increasingly achievable goal thanks to the recent advances in building technologies. A variety of governments, e.g., the European Union and the United States, have established policies and targets for new buildings to become zero-energy in the next ten years [4,5,6]. However, transforming the existing buildings into zero energy is as important as building new ones. The proliferation of low- and very-low-energy buildings in recent years presents great opportunities for such transformation. A number of studies have explored the technical and economic viabilities.
Alajmi et al. [7] investigated the possibility of converting a small low-rise public building located in a hot climate into a net-zero-energy building. An earlier retrofit had brought down annual energy consumption by 27% (659 MWh), and the simulation results indicated that an additional 33.6% savings (821 MWh) could be achieved by a set of energy efficiency measures (EEMs), which would make the building zero-energy ready. Three potential solutions to convert the building into a zero-energy building were discussed. The first solution would use only the photovoltaic (PV) system that utilizes the entire roof; the second solution would use less PV with the replacement of existing chillers with more efficient ones; the third solution would combine the PV and a solar cooling system. Simulation results showed that the first solution could achieve the zero-energy goal on an annual basis, while the other two solutions could achieve the zero-energy goal on both an annual and a monthly basis.
AbuGrain and Alibaba [8] studied a three-story public building in Cyprus. A variety of strategies was simulated to explore the energy-saving potential, including integrating additional insulation materials, using light sensors to reduce unnecessary lighting consumption, increasing the U-value of the windows, etc. The simulation results implied that nearly 30% annual energy savings could be realized through retro-commissioning with approximately 11% from lighting and 9% from the HVAC system. The zero-energy goal could be achieved by integrating photovoltaic panels on 23% of the roof area.
Minor et al. [9] explored a LEED (Leadership in Energy and Environmental Design) -certified building with a total floor area of 2902 m2 in Ohio, USA. They assessed two alternatives to reach the net-zero energy target. The first option was to add only PV panels to achieve zero energy on an annual basis; the other one was to add PV panels to meet all summer loads and solar thermal units to meet the heating needs. They concluded that the first option was more cost-effective.
Irulegi et al. [10] discussed a six-story university building in Spain. Natural ventilation was proposed in lieu of a conventional air conditioning system to meet the cooling needs. For the winter period, eliminating thermal bridges, using air-to-air heat recovery systems, and improving the windows’ performance in the north façade showed potential energy savings of 62%. Their study indicated that with these measures, the building had the potential to become zero-energy ready.
Some other studies reported similar findings with regard to transforming existing buildings into zero energy buildings [11,12,13,14]. Cellura et al. [15] discussed retrofitting a single-family house in a rural area in Italy to achieve zero energy. A variety of approaches and technologies, such as natural ventilation, adaptive thermal comfort, advanced lighting, and a high-performance façade, were investigated. Wu et al. [16] evaluated which HVAC technology was the most efficient for a residential building in the mixed-humid climate to achieve zero energy. Based on the simulation, a ground source heat pump (GSHP) with a heat recovery ventilator (ERV) yielded the most energy savings, but this option was also the most expensive one. The most cost-effective option was an air source heat pump (ASHP) without the heat recovery system. Kalogirou [17] studied the combined PV and the solar thermal system and concluded that the combined system would be taking a leading role in meeting the electricity and thermal energy needs for residential buildings toward zero energy.
Achieving the zero-energy goal in small low-rise commercial buildings is not overly complex; however, it is much more challenging for large high-rise office buildings [18]. There are few studies found in the literature to report how an existing large high-rise office building can potentially become zero-energy. Aksamija [19,20] explored the potential of an existing commercial building with near 20,000 m2 total floor area in a mild climate in the US moving toward zero energy. Simulation results showed that the commercial building could achieve the zero-energy goal through a deep energy retrofit. However, the economic feasibility was the biggest concern.
This paper presents a case study on how a large high-rise office building located in the hot summer and warm winter zone in China can potentially become zero energy without any significant alterations to the building. The intention is to mobilize owners of similar facilities.
2. Building Information
2.1. Basic Information
The case building is an 18-story office building (17 above grade and 1 below) with a total floor area of 23,471 m2, as shown in Figure 1. The first floor above grade is an exhibition hall, and the other floors are offices.
China is divided into five climate zones: Severe cold, cold, hot summer and cold winter, hot summer and warm winter, and mild [21]. The climate zone is defined based on the monthly average temperatures in January (tavg,Jan) and July (tavg,Jul) between 1995 and 2004, and the criteria are listed in Table 1. The case building is located in the hot summer and warm winter zone.
The building is certified as LEED Platinum as well as the Chinese three-star green building. The design EUI is 42 kWh/(m2 a), which is 40% lower than the requirement of the Chinese standard for building energy consumption [22]. In order to achieve the energy target in the hot summer and warm winter climate, a variety of passive and active technologies were adopted.
2.2. Passive Energy Saving Measures
2.2.1. High Performance Façade
As shown in Table 2, the design overall U values of the exterior wall and the roof are 0.44 W/(m2 K) and 0.40 W/(m2 K), respectively. Exterior windows use double glazed low-e glass with a U-value of 2.36 W/(m2 K) and a shading coefficient of 0.35. The design values are much stricter than those specified in the national building code [23].
2.2.2. Natural Ventilation
The exhibition hall uses natural ventilation techniques. Automated glass blinds are employed on the west, north, and south walls to improve the air distribution in the naturally ventilated exhibition hall, as shown in Figure 2. The blinds are modulated to maintain a suitable indoor air speed and distribution in response to different outside wind speeds and directions. Under severe weather conditions, e.g., storm, tropical cyclone, the blinds will be closed. To ensure occupants’ comfort, seven ceiling fans were installed and will be turned on when the outside temperature is over 30 °C.
2.2.3. Daylighting
Lighting pipes and natural lighting are employed in the building. Lighting pipes are used in the areas that do not have strict illumination requirements, such as the kettle room. The exhibition areas locate within 5 m from the exterior and the natural light can meet the illuminance requirement even in overcast days.
2.3. Active Energy Saving Measures
2.3.1. HVAC (Heating Ventilation and Air Conditioning) Systems
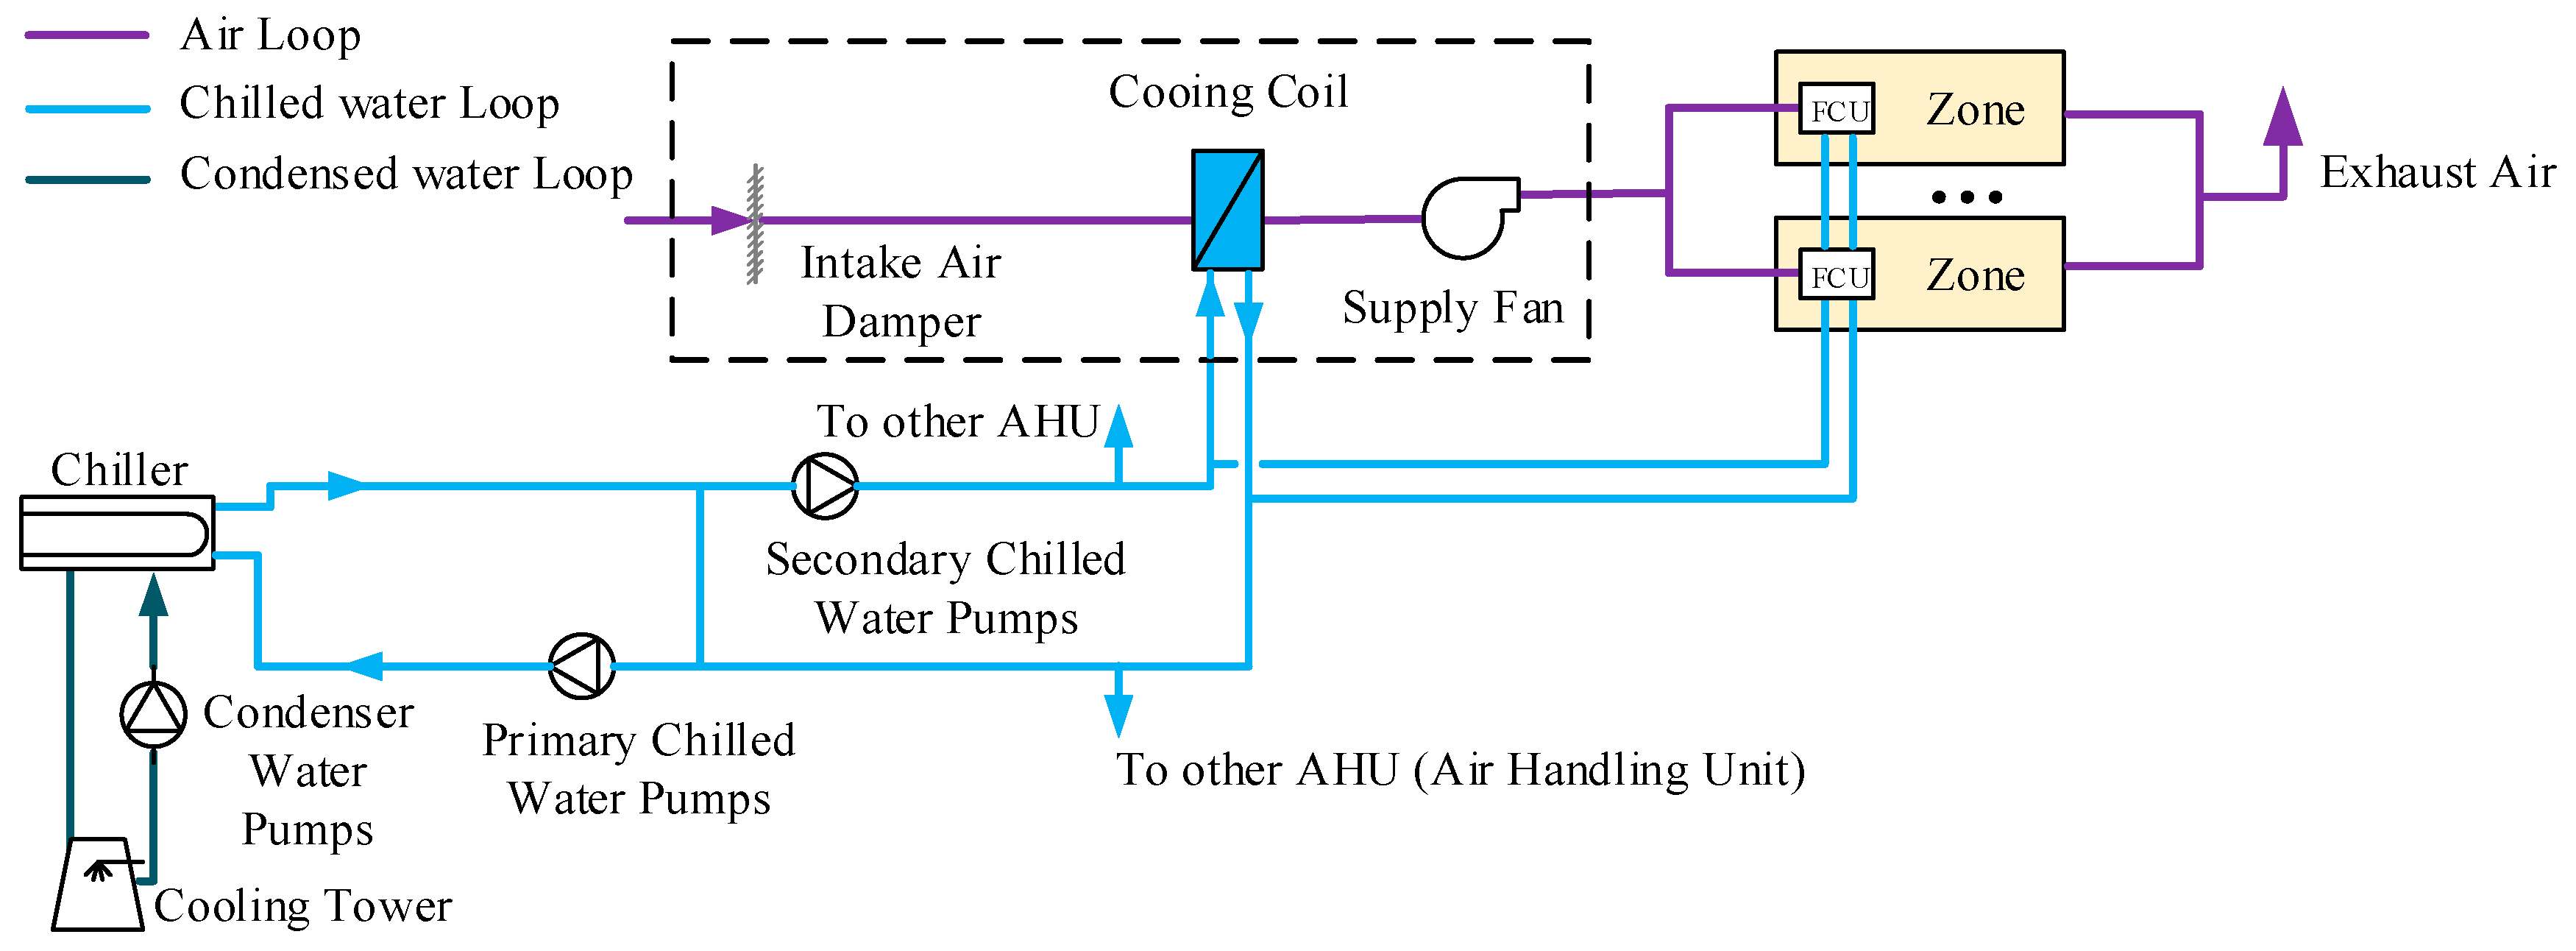
The central chilled water system comprises two water-cooled screw chillers (each 912.2 kW), together with two cooling towers, three chilled water pumps (one for standby), and three condenser water pumps (one for standby). The building is located in the hot summer and warm winter zone in China, and according to the National Code, a heating system is not recommended for buildings located in this climate zone. The thermal load of a commercial building is dominated by the internal heat gains. Therefore, the heating load of the case building is negligible, and the peak cooling demand is 1519 kW according to the measured data.
The fan coil unit plus outside air system serves the entire office space except for the 13th floor, which uses a variable refrigerant volume (VRV) system. A heat recovery unit is employed to reduce the ventilation cooling load. Figure 3 shows the HVAC system layout.
2.3.2. Photovoltaic System
The building is equipped with photovoltaic systems, including a rooftop PV system, a façade PV system, a rain canopy PV system, and a blinds PV system, as shown in Figure 4. According to the design, the annual energy production from the PV systems is 184,982 kWh (7.88 kWh/(m2 a)). When the electricity generated by the PV system does not meet the building energy demand, electricity will be drawn from the grid. The specification of the solar cell module is shown in Table 3.
2.4. Controls
2.4.1. HVAC System Control
Chiller staging is based on the frequency of the variable speed compressor. When the operation frequency is higher than 200 Hz over 20 min, another chiller will kick on; when the operation frequency is lower than 90 Hz over 20 min, one chiller will be shut down. The chilled water pumps are modulated to maintain the chilled water loop differential pressure set point. The condenser water pumps are modulated to maintain the delta T between the condenser water supply and return temperatures. The cooling tower fans are modulated to maintain the condenser water supply temperature set point. The fresh air system is modulated to maintain the indoor CO2 concentration.
2.4.2. Lighting Control
The whole building uses LED lights with DDC (Direct Digital Control) control. Each LED light is equipped with a photosensor and controlled automatically based on the illumination level and the occupancy.
2.5. Actual Energy Performance
The case building was completed in early 2017 and occupancy took place in April 2017. However, the mechanical system was still under commissioning until October. During the commissioning period, some equipment had operated 24/7. Therefore, we used the data after October 2017 in the study. Figure 5 shows the monthly energy consumption for 12 months. The lighting energy consumption is steady for the whole year, ranging from 4000 kWh to 5000 kWh. The actual EUI is 23.9 kWh/(m2 a), which is nearly half of the design goal of 42 kWh/(m2 a). This is due to the less than expected occupancy level in the building.
3. Analysis
3.1. Technical Approach
Similar to previous studies, the calibrated simulation approach was adopted in this study. This approach is an adjustment of the model inputs and parameters based on the actual measurements until the discrepancy between the simulated data and the measured ones is within a preset threshold [25]. ASHRAE Guideline 14-2014 [26] was used as the baseline for the calibration in this study.
With the calibrated energy model, we then used the GenOpt tool to optimize the controls of the HVAC system as well as other occupant behavior related strategies, e.g., adopting adaptive thermal comfort with a wider range of temperature set points.
After maximizing the efficiency gain, we explored the viable options for the PV system to determine whether the zero-energy goal is achievable.
3.2. Model Development
The energy model was created based on as-built drawings. EnergyPlus 8.9 [27,28] was chosen for the simulation. Figure 6 shows the geometry and thermal zoning of the typical floor.
The operating conditions, i.e., the occupancy density and schedule, the lighting power density and schedule, the plug load density and schedule, and room indoor temperatures, were obtained from a building operator interview, onsite measurement, and observations. The room set point temperatures were read from the building automation system (BAS) directly. The building employed electrical submetering to monitor the HVAC system, the lighting, and the plug load power consumptions.
The sensors used in the case building are all research-grade and the accuracy is much higher than the typical requirement in the building industry. The measurements concerned in this study are mainly power and temperature, and the sensor accuracies are listed in Table 5. As only direct measurements were involved, the propagation of uncertainty was not considered in the study.
The hourly data on a typical weekday and weekend were used to calculate the lighting and plug load power densities and derive their schedules for weekdays and weekend days, respectively. The numbers of occupants were counted manually by the researchers every two hours from 6 a.m. to 8 p.m. on a typical weekday and weekend to generate the occupant densities and schedules. The schedules of internal load and indoor temperature are shown in Figure 7. Table 6 presents the actual vs. design values of these parameters.
The weather file was developed using the actual weather data from the National Climatic Data Center (NCDC) [29]. The data includes hourly observations of temperature, humidity, pressure, wind speed and direction, cloud cover, and precipitation intensity but misses the global horizontal solar irradiation, the diffuse horizontal solar irradiation, and the direct normal solar irradiation that are essential to the energy simulation. We adopted the models recommended by Zhang et al. [30,31,32,33] to compute the solar irradiations:
3.3. Model Validation
Per the ASHRAE Guideline 14-2014, a normalized mean bias error (NMBE) of 5% or better and a coefficient of variation of the root mean square error (CVRMSE) of 15% or better are the minimum requirements for an energy model to be considered as a calibrated model. The NMBE and CVRMSE are defined as follows:
Figure 8 shows the measured vs. predicted monthly energy consumption for the case building. The simulated energy consumption agreed with the measured energy consumption well and both the NMBE and the CVRMSE met the ASHRAE guideline requirements.
4. Results and Discussion
4.1. Potential to Achieve ZEB
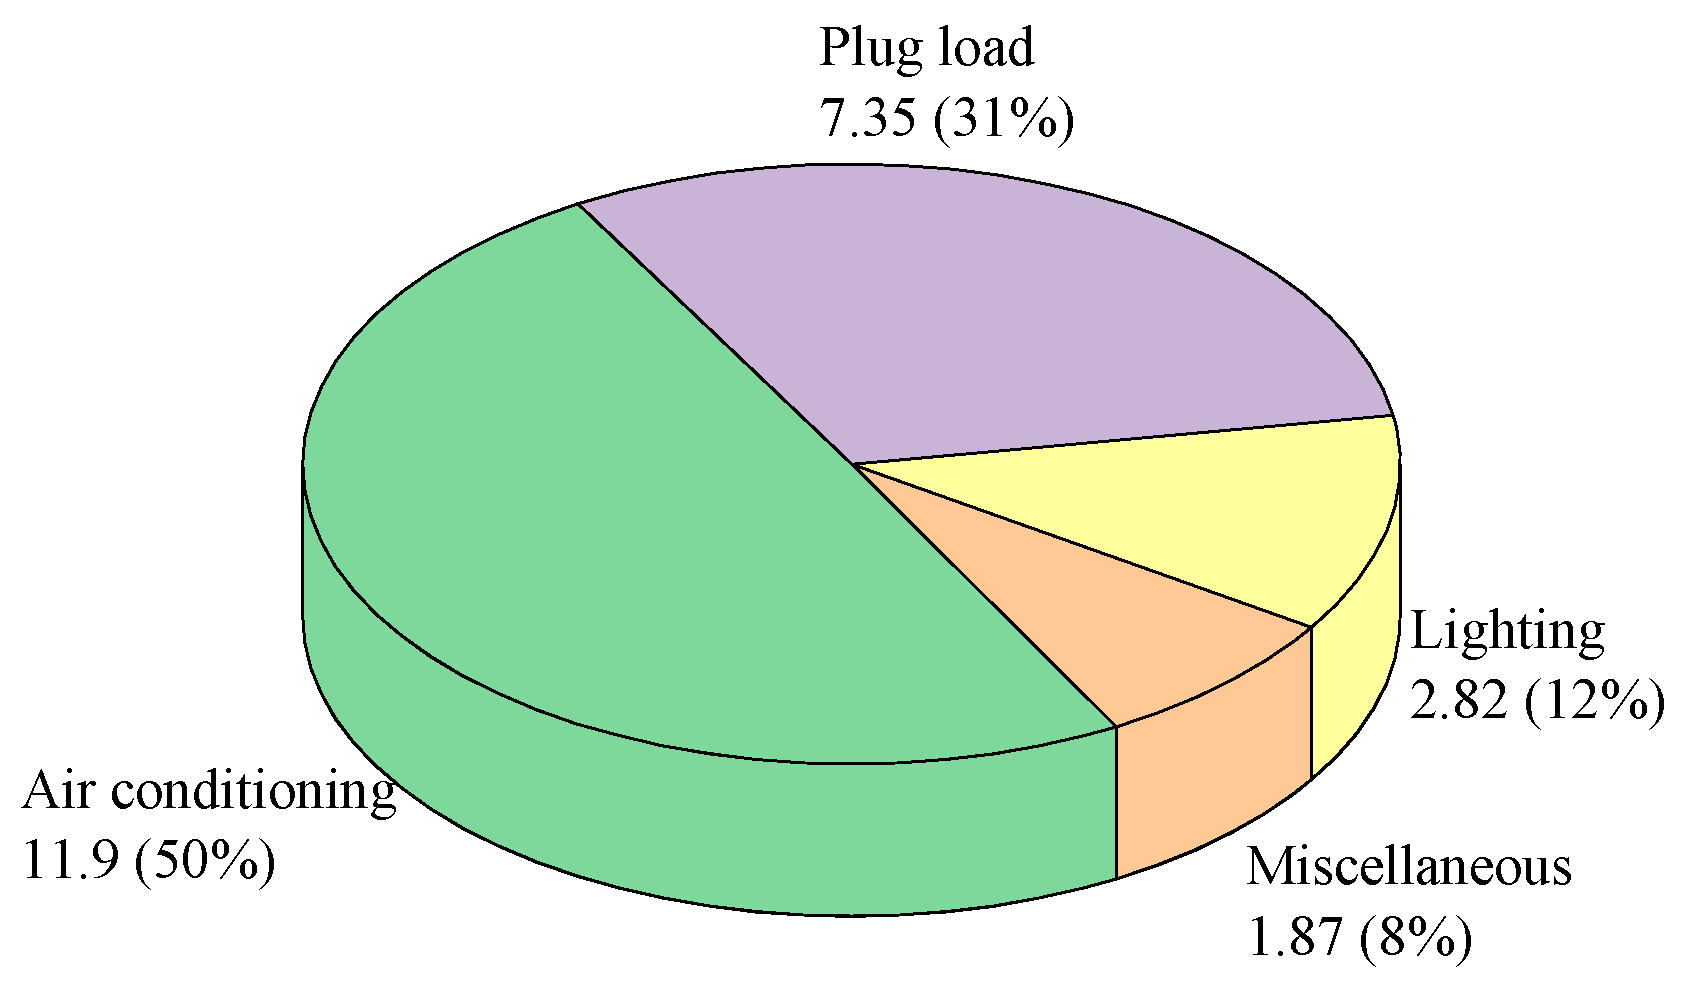
The measured EUI was about 23.9 kWh/(m2 a), which was nearly three time more than the energy generated by the existing PV system. We analyzed submetering data to find out which end use could be reduced further. Figure 9 shows the breakdown of the energy consumption. The HVAC system, the plug load, and the lighting consumed 93% of the total energy use.
4.2. Proposed Building Energy-Efficient Measures
The trending data implied that some lights and plug load equipment were left on after working hours and during weekends (as shown in Figure 6a–c). The lighting and the plug load equipment were not controlled as intended. Simply switching off the unnecessary lights and plug load equipment during unoccupied hours could yield considerable savings, as shown in Table 7.
4.3. Proposed HVAC Energy Efficiency Measures
A higher cooling temperature set point can conserve energy but could lead to increased occupant dissatisfaction. By engaging the occupants to dress appropriately, the room cooling temperature could be set to 28 °C [34]. The resulting predicted mean vote (PMV) and predicted percentage of dissatisfied (PPD) are 0.99 and 26% (clothing insulation = 0.3 clo and air velocity = 0.2 m/s), respectively.
Hartman [35] reported the benefits of supply water temperature reset to improve the chilled water system performance. The measured overall chilled water system COP (Coefficient Of Performance) of the case building was 5.0, which is considered as “good” performance according to Harman’s study. However, we found that the current setpoints of the chilled water supply temperature and the condensed water supply temperature were constant year-round at 7 °C and 29 °C, respectively. By optimizing linear reset schedules between the chilled water supply temperature and the outside air temperature, and the condenser water supply temperature and the outside wet bulb temperature, the energy consumption could be reduced by 114.9 MWh/a (20.7%). The objective function was defined as:
The GenOpt [36] was used to solve the problem and the resulting optimal reset coefficients a, b, and c are −0.28, 17, and 1.9, respectively.
The trending data show that the chilled water system was on during the winter, as shown in Figure 4. By adopting a water-side economizer, the mechanical cooling can be avoided in winter. The water-side economizer utilized the cooling tower to produce the chilled water to meet the cooling demand in winter. In addition, the chilled water pumps, the condenser water pumps, and the supply fans were not operated as intended by the design. According to the design document, the supply fan would be controlled by indoor CO2 concentration; the chilled water pump and the condenser water pump be controlled by the differential pressure of the chilled water loop and the temperature difference between the supply and return chilled water. The simulation shows that these measures can reduce energy consumption by 17.1 MWh (3.0%).
Table 8 summarizes the expected energy savings by implementing the abovementioned operation strategies and measures.
The total energy savings of the lighting, plug load equipment, and the HVAC system will be 9.16 kWh/(m2 a) and 38.3% of the total building energy consumption, which will bring down the current annual energy consumption to 14.74 kWh/(m2 a). Therefore, an annual electricity generation of 346 MWh was needed to achieve the zero-energy goal.
4.4. Photovoltaic System
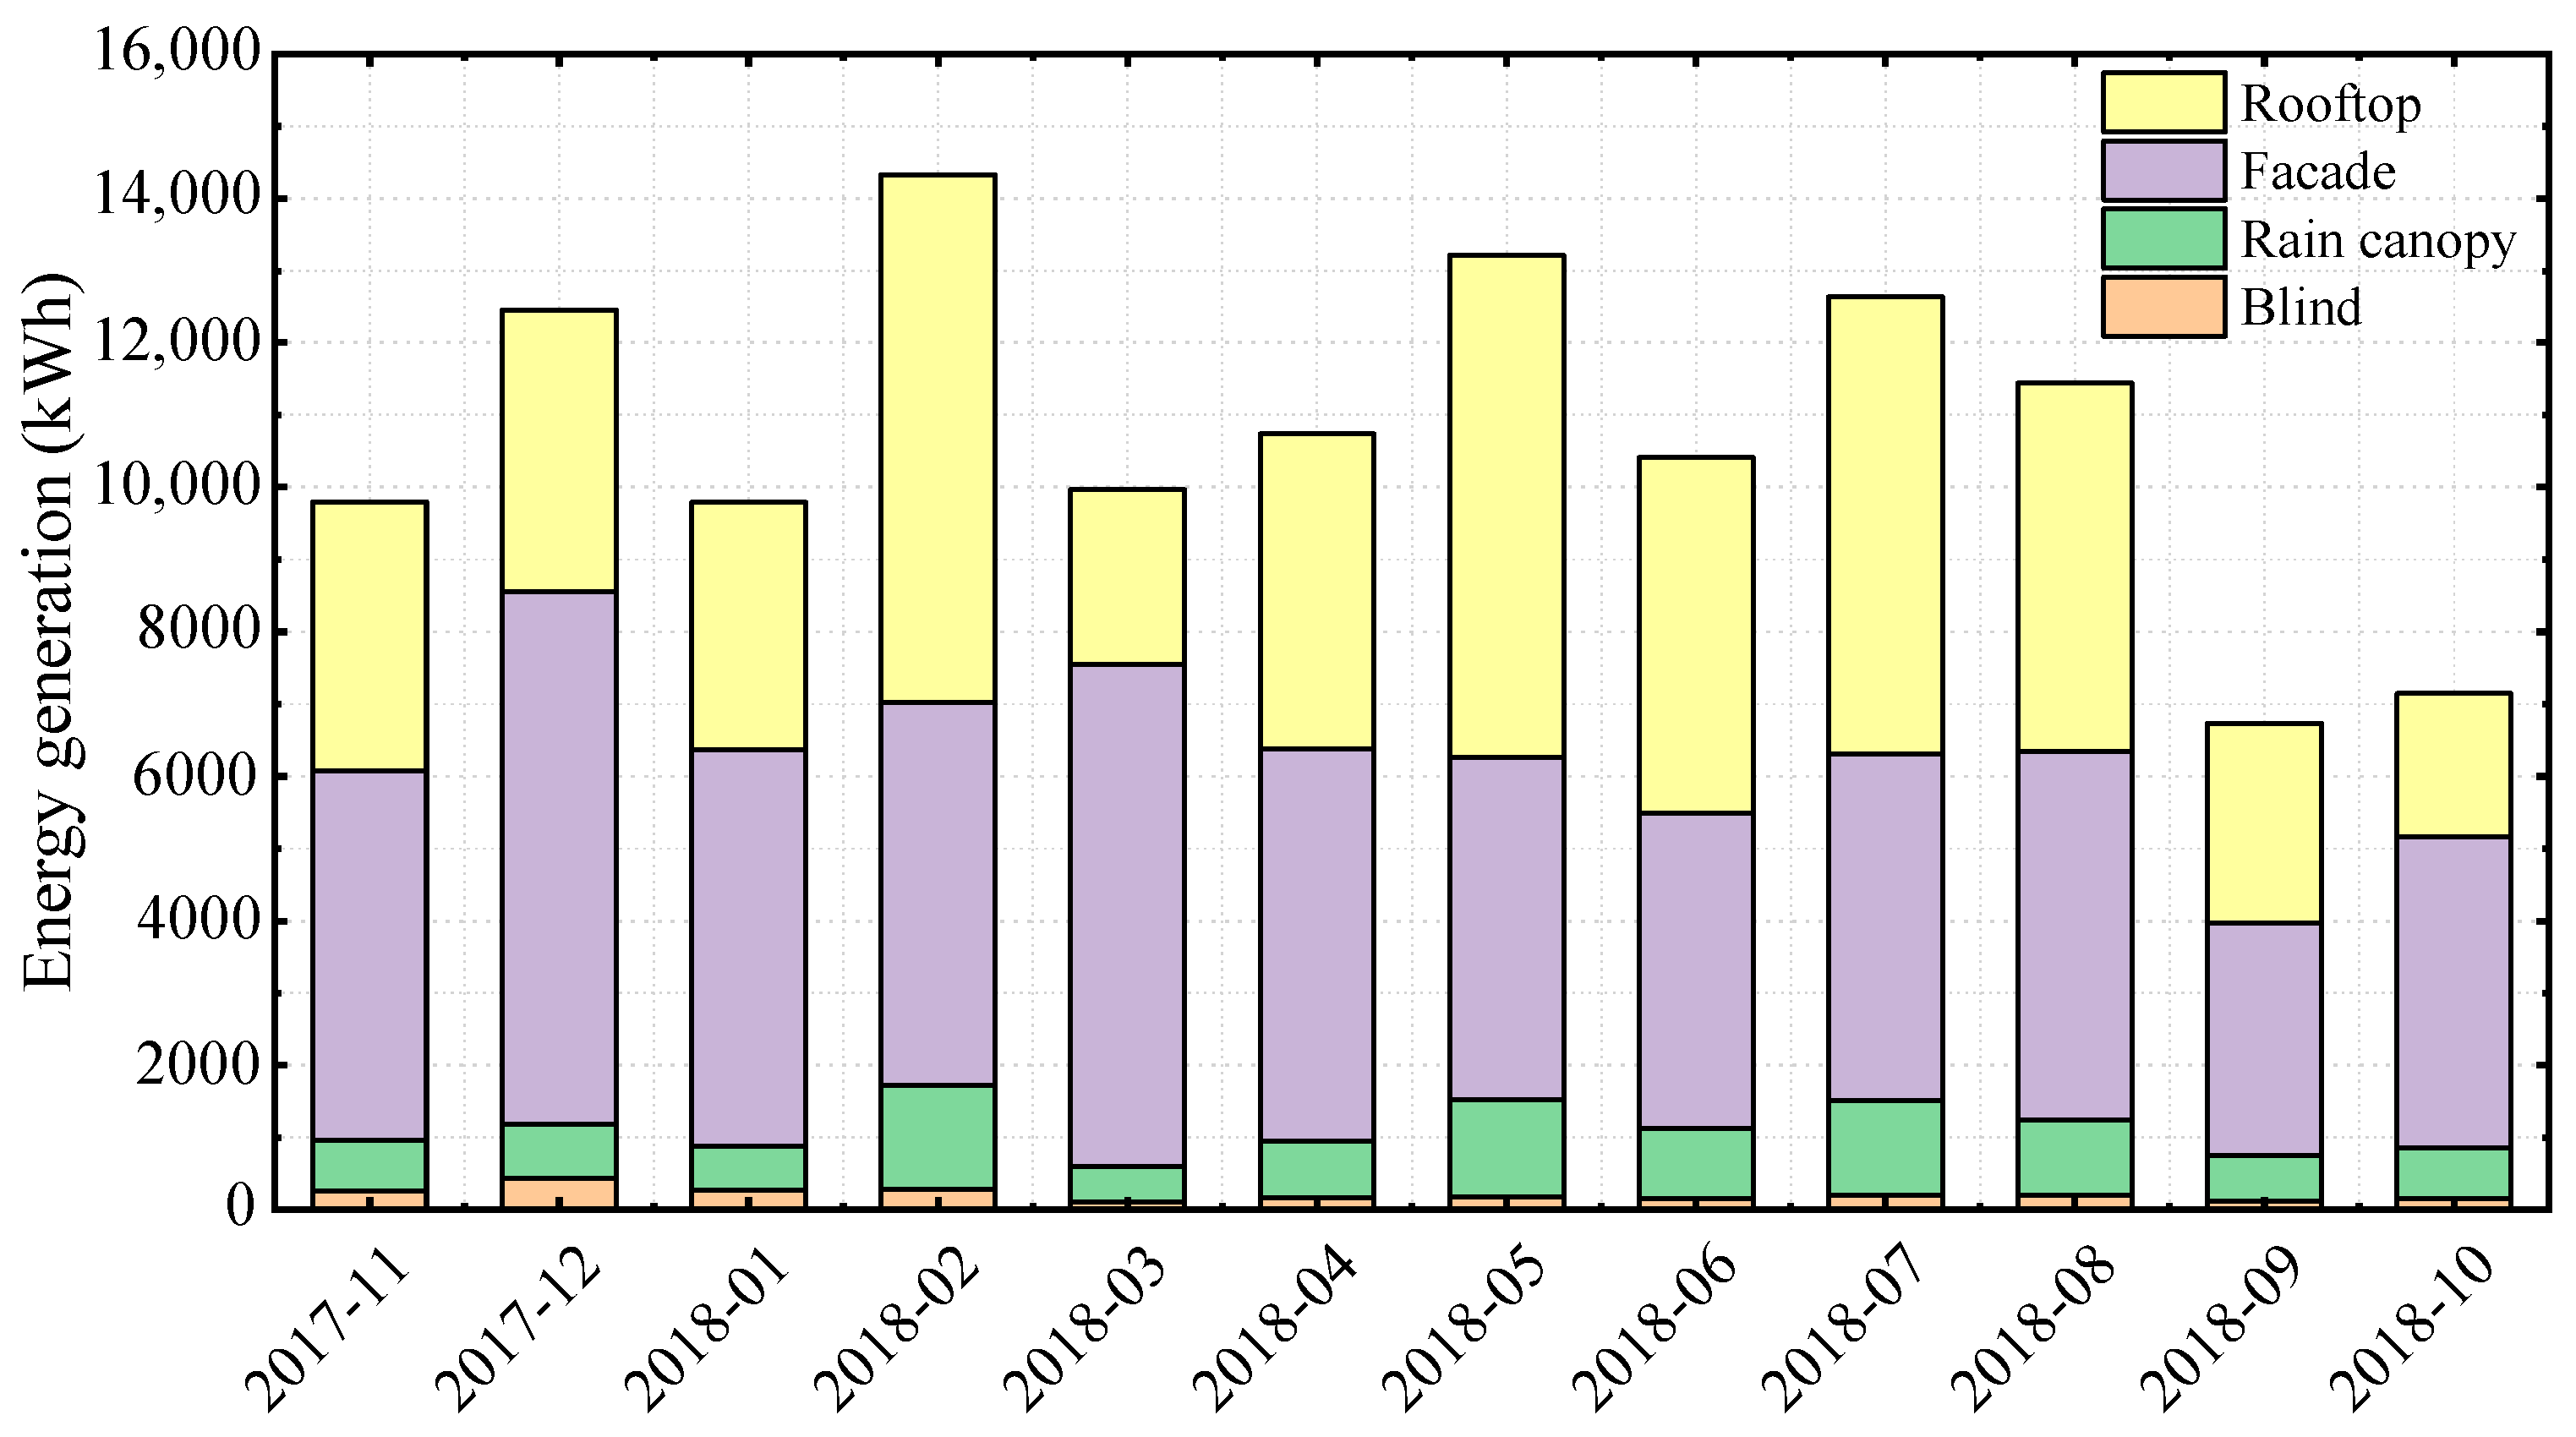
The design capacity of the existing PV system is 185 MWh, which is far less than the 346 MWh requirement. Figure 10 shows the breakdown of the monthly electricity production of the existing PV system, among which 51% is from the rooftop PV system, 37% from the façade PV system, 10% from the rain canopy PV system, and 2% from the blind PV system.
Additional 161 MWh capacity is needed to balance out the energy use. There is a parking lot on the south of the building with an area of approximately 1000 m2. We would maximize the use of the parking lot and install 562 PV panels to cover the entire parking lot. The electricity generation can be calculated by:
Using the same type of rooftop PV system, the proposed parking plot PV system can produce 144 MWh electricity yearly (6.1 kWh/(m2 a)). However, there is still a 17 MWh shortage of capacity. The existing rooftop PV panels used 52% of the rooftop area, which makes it possible to install more PV panels on the roof. Based on the calculation, installing PV panels on 15% of the rooftop area can produce 17 MWh electricity yearly, thus making it a zero-energy building. Table 9 summarizes the calculation of the additional PV system.
4.5. Preliminary Economy Analysis
The energy savings were mainly achieved through no-cost and low-cost retro-commissioning measures and can be done by the building owner’s engineering team. Therefore, the project cost would be mainly associated with the additional PV system, which includes PV panels, batteries, materials, and labor. Xin [37] reported that the cost of the PV panel and the battery was $1.18/Wp (1 US dollar = 6.77 Chinese yuan) in China based on recent market surveys. Adding labor and materials, the total cost was about $2.21/Wp. The local electricity tariff is $0.14/kWh.
A simple payback method was adopted [38]:
The payback period is 4.3 years.
5. Conclusions
This paper demonstrated the viability of transforming a high-rise office building located in the hot summer and warm winter zone into zero-energy based on the calibrated simulation analyses. Through retro-commissioning of the HVAC system and the control of the lighting and the plug load equipment, the current annual energy consumption of the case building can be reduced by 38.3%, which makes it zero-energy ready. The retro-commissioning measures only involved optimizing the controls of the mechanical system without major retrofit, and thus making it cost-effective to become zero-energy ready. By installing PV panels on the parking lot and additional 15% of its rooftop area, the simulation results showed that the case building has the potential to become zero-energy, and a simple payback period would be 4.3 years.
Author Contributions
Conceptualization, X.P. and D.W.; methodology, D.W.; software, D.W. and Z.Q.; validation, D.W.; formal analysis, D.W.; data curation, J.L. and D.L.; writing—original draft preparation, D.W.; writing—review and editing, D.W. and X.P.; supervision, X.P. and W.W.; project administration, X.P.; funding acquisition, X.P.
Funding
This work was supported in part by the National Key Research and Development Program of China (Grant No. 2016YFC0700100) and with additional support from the National Natural Science Foundation of China (Grant No. 51628801) and Young Top-Notch Talents Team Program of Beijing Excellent Talents Funding (2017000026833TD02). The authors are grateful for the support of these sponsors.
Conflicts of Interest
The authors declare no conflict of interest.
Nomenclature
| Variables, parameters and indices | |
| A1, A2, A3, A4 | the coefficients, exponents as the function of |
| C0, C1, C2, C3, C4, C5, k | regression coefficients |
| CC | the fraction of cloud cover |
| h | sun altitude |
| I0 | solar constant |
| Id | diffuse horizontal radiation at the Earth’s surface |
| Ih | global horizontal radiation at the Earth’s surface |
| In | direct normal radiation at the Earth’s surface |
| ΔI | capital cost, yuan |
| Kn | direct beam transmittance |
| Kt | clearness index |
| n | number of data points |
| N | the payback period, years |
| P | system direct current power |
| Pp | tariff, yuan/kWh |
| Q | generated energy capacity, kW |
| Qs | the annual energy savings, kWh |
| Qpv,power | total annual electricity production from PV, MWh |
| R | total solar radiation |
| R0 | standard solar radiation intensity, 1 kWh |
| Tchw,s | chilled water supply temperature |
| Tcond,s | condenser water supply temperature |
| TOA | outside air temperature |
| Tw,bulb | outside wet bulb temperature |
| yi | measured monthly energy use, kWh |
| monthly energy use derived from modeling, kWh | |
| average monthly energy use for the measurement period, kWh | |
| ηs | energy generation efficiency |
Abbreviation
| APS | Advanced power strip |
| BAS | Building automation system |
| CVRMSE | Coefficient of variation of the root mean square error |
| EEM | Energy-efficient measure |
| ERV | Energy recovery ventilator |
| EUI | Energy use intensity |
| FCU | Fan coil unit |
| GSHP | Ground source heat pump |
| NCDC | National Climatic Data Center |
| NMBE | Normalized mean bias error |
| PBA | Principal building activity |
| PMV | Predicted mean vote |
| PPD | Predicted percentage of dissatisfied |
| PV | Photovoltaic |
| STS | Solar thermal system |
| VRV | Variable refrigerant volume |
| ZEB | Zero-energy building |
References
- Cao, X.; Dai, X.; Liu, J. Building energy-consumption status worldwide and the state-of-the-art technologies for zero-energy buildings during the past decade. Energy Build. 2016, 128, 198–213. [Google Scholar] [CrossRef]
- D’Agostino, D.; Mazzarella, L. What is a nearly zero energy building? Overview, implementation and comparison of definitions. J. Build. Eng. 2019, 21, 200–212. [Google Scholar] [CrossRef]
- Firlag, S.; Piasecki, M. NZEB Renovation Definition in a Heating Dominated Climate: Case Study of Poland. Appl. Sci. 2018, 8, 1605. [Google Scholar] [CrossRef]
- Recast, E. Directive 2010/31/EU of the European Parliament and of the Council of 19 May 2010 on the energy performance of buildings (recast). Off. J. Eur. Union 2010, 13–35. Available online: https://eur-lex.europa.eu/legal-content/en/TXT/?uri=celex%3A32010L0031 (accessed on 22 February 2019).
- US DOE. Building Technologies Program: Planned Program Activities for 2008–2012; EERE Publication and Product Library: Washington, DC, USA, 2008. [Google Scholar]
- Korea Institute of Civil Engineering and Building Technology (KICT). Building Research Department [EB/OL]. Available online: http://www.kict.re.kr/eng/rsch/build.asp (accessed on 10 November 2014).
- Alajmi, A.; Abou-Ziyan, H.; Ghoneim, A. Achieving annual and monthly net-zero energy of existing building in hot climate. Appl. Energy 2016, 165, 511–521. [Google Scholar] [CrossRef]
- AbuGrain, M.Y.; Alibaba, H.Z. Optimizing existing multistory building designs towards net-zero energy. Sustainability 2017, 9, 399. [Google Scholar] [CrossRef]
- Minor, J.; Hallinan, K. Renewable Energy Design and Performance of LEED EB Platinum Building for Zero Energy Performance. ASHRAE Trans. 2011, 117, 43–51. [Google Scholar]
- Irulegi, O.; Ruiz-Pardo, A.; Serra, A.; Salmerónd, J.M.; Vegae, R. Retrofit strategies towards net zero energy educational buildings: A case study at the University of the Basque Country. Energy Build. 2017, 144, 387–400. [Google Scholar] [CrossRef]
- Torcellini, P.; Pless, S.; Deru, M.; Griffith, B.; Long, N.; Judkoff, R. Lessons Learned from Case Studies of Six High-Performance Buildings; National Renewable Energy Laboratory: Golden, CO, USA, 2006. [Google Scholar]
- Griffith, B.; Long, N.; Torcellini, P.; Judkoff, R. Assessment of the Technical Potential for Achieving Net Zero-Energy Buildings in the Commercial Sector; Technical Report NREL/TP-550-41957; National Renewable Energy Laboratory: Golden, CO, USA, 2007. [Google Scholar]
- Voss, K.; Musall, E.; Lichtmeß, M. From low-energy to Net Zero-Energy Buildings: Status and perspectives. J. Green Build. 2011, 6, 46–57. [Google Scholar] [CrossRef]
- Thomas, A.; Menassa, C.C.; Kamat, V.R. A systems simulation framework to realize net-zero building energy retrofits. Sustain. Cities Soc. 2018, 41, 405–420. [Google Scholar] [CrossRef]
- Cellura, M.; Ciulla, G.; Guarino, F.; Longo, S. Redesign of a Rural Building in a Heritage Site in Italy: Towards the Net Zero Energy Target. Buildings 2017, 7, 68. [Google Scholar] [CrossRef]
- Wu, W.; Skye, H.M.; Domanski, P.A. Selecting HVAC systems to achieve comfortable and cost-effective residential net-zero energy buildings. Appl. Energy 2018, 212, 577–591. [Google Scholar] [CrossRef] [PubMed]
- Kalogirou, S.A. Building integration of solar renewable energy systems towards zero or nearly zero energy buildings. Int. J. Low-Carbon Technol. 2013, 10, 379–385. [Google Scholar] [CrossRef] [Green Version]
- So, A.; Katz, D.; Wacks, K. Toward Zero Net Energy (zne) Super High-Rise Commercial Buildings. Continental Automated Buildings Association White Paper. Available online: http://www.caba.org/caba-white-papers. (accessed on 10 December 2018).
- Aksamija, A. Regenerative design of existing buildings for net-zero energy use. Procedia Eng. 2015, 118, 72–80. [Google Scholar] [CrossRef]
- Aksamija, A. Regenerative design and adaptive reuse of existing commercial buildings for net-zero energy use. Sustain. Cities Soc. 2016, 27, 185–195. [Google Scholar] [CrossRef]
- MOHURD. Code for Thermal Design of Civil Building; China Building Industry Press: Beijing, China, 2016.
- MOHURD. Standard for Energy Consumption of Buildings; China Building Industry Press: Beijing, China, 2016.
- MOHURD. Design Standard for Energy Efficiency of Public Buildings; China Architecture and Building Press: Beijing, China, 2015.
- Lin, B.; Liu, Y.; Wang, Z.; Pei, Z.; Davies, M. Measured energy use and indoor environment quality in green office buildings in China. Energy Build. 2016, 129, 9–18. [Google Scholar] [CrossRef]
- Mustafaraj, G.; Marini, D.; Costa, A.; Keane, M. Model calibration for building energy efficiency simulation. Appl. Energy 2014, 130, 72–85. [Google Scholar] [CrossRef]
- ASHRAE. Guideline 14—Measurement of Energy, Demand, and Water Savings; ASHRAE Standards Committee: Atlanta, GA, USA, 2014. [Google Scholar]
- Crawley, D.B.; Lawrie, L.K.; Winkelmann, F.C.; Buhl, W.F.; Huang, Y.J.; Pedersen, C.O.; Strand, R.K.; Liesen, R.J.; Fisher, D.E.; Witte, M.J.; et al. EnergyPlus: Creating a new-generation building energy simulation program. Energy Build. 2001, 33, 319–331. [Google Scholar] [CrossRef]
- U.S. Department of Energy. EnergyPlus8.9:EngineeringReference. 2018. Available online: https://www.energyplus.net/documentation (accessed on 23 March 2018).
- National Centers for Environmental Information (NCEI). NOAA Hourly Observational Climate Data. Available online: https://www.ncdc.noaa.gov/ (accessed on 10 December 2018).
- Zhang, Q.; Huang, J. Development of typical year weather data for Chinese locations. ASHRAE Trans. 2002, 108, 1063–1075. [Google Scholar]
- Zhang, Q. Separation of horizontal solar radiation into direct and diffuse components with gompertz function. J. Environ. Eng. 2004, 69, 31–37. [Google Scholar] [CrossRef]
- Zhang, Q.; Zhang, Q. Development of the typical meteorological database for Chinese locations. Energy Build. 2006, 38, 1320–1326. [Google Scholar] [CrossRef]
- Zhang, Q.; Lou, C.; Yang, H. A New Method to Separate Horizontal Solar Radiation into Direct and Diffuse components. In Proceedings of the ISES Asia-Pacific, Gwangju, Korea, October 2004; pp. 682–688. [Google Scholar]
- MOHURD. Design Code for Heating Ventilation and Air Conditioning of Civil Buildings; China Building Industry Press: Beijing, China, 2012.
- Hartman, T. All-variable speed centrifugal chiller plants. ASHRAE J. 2001, 43, 43–53. [Google Scholar]
- Wetter Michael. GenOpt—generic optimisation program. In Proceedings of the IBPSA’s Building Simulation 2001 Conference, Rio de Janeiro, Brazil, 13–15 August 2001. [Google Scholar]
- Xin, P. Research on Solar Power Technology Economic Evaluation and Application Prospect; North China Electric Power University: Beijing, China, 2015. [Google Scholar]
- Zhou, Z.; Feng, L.; Zhang, S.; Wang, C.; Chen, G.; Du, T.; Li, Y.; Zuo, J. The operational performance of “net zero energy building”: A study in China. Appl. Energy 2016, 177, 716–728. [Google Scholar] [CrossRef]
Figure 1.
Exterior view of the office building.

Figure 2.
View of automated blinds.

Figure 3.
The HVAC (Heating Ventilation and Air Conditioning) system layout.

Figure 4.
Photovoltaic system layout.

Figure 5.
Monthly building energy consumption.

Figure 6.
Geometry and thermal zoning. (a) Front view; (b) Plan view; (c) Thermal zone.

Figure 7.
Schedules of internal load and indoor temperature. (a) occupant density, (b) lighting power density, (c) plug load density, (d) indoor temperature.
Figure 7.
Schedules of internal load and indoor temperature. (a) occupant density, (b) lighting power density, (c) plug load density, (d) indoor temperature.


Figure 8.
Energy consumption: Measured vs. simulated.

Figure 9.
Building energy consumption component.

Figure 10.
Monthly energy generation.


Table 1.
Climate zones in China.
| Climate Zone. | Criteria |
|---|---|
| Severe cold. | tavg,Jan ≤ −10 °C |
| Cold. | −10 °C ≤ tavg,Jan ≤ 0 °C |
| Hot summer and cold winter. | 0 °C ≤ tavg,Jan ≤ 10 °C 25 °C ≤ tavg,Jul ≤ 30 °C |
| Hot summer and warm winter. | 10 °C < tavg,Jan. 25 °C ≤ tavg,Jul ≤ 29 °C |
| Mild. | 0 °C ≤ tavg,Jan ≤ 13 °C 18 °C ≤ tavg,Jul ≤ 25 °C |
Table 2.
Design values vs. code requirements of U values of the envelope and the window.
| Design (W/(m2 K)) | Code (W/(m2 K)) | |
|---|---|---|
| U value of wall | 0.44 | 0.9 |
| U value of roof | 0.40 | 0.9 |
| U value of window | 2.36 | 3.0 |
Table 3.
Specification of the solar cell module.
| Types | Power (Wp) | Quantities | Total Power (kWp) | |
|---|---|---|---|---|
| Rain canopy | Monocrystalline silicon | 192 | 91 | 17.47 |
| Façade | 172 | 739 | 127.11 | |
| Blind | 24 | 336 | 8.06 | |
| Rooftop | 245 | 308 | 75.46 |
Table 4.
EUI comparison.
| Lin et al. [23] | Building A | |
|---|---|---|
| Num. of samples | 8 | - |
| 25th percentile | 52.6 | - |
| Median/Actual EUI (kWh/(m2 a)) | 71.5 | 23.9 |
| 75th percentile | 80.3 | - |
| SD (Standard Deviation) | 28.0 | - |
| Skewness | 0.2 | - |
Table 5.
Details of the sensor devices.
| Sensors | Accuracy |
|---|---|
| Temperature sensor | ±0.15 °C |
| Power meter | ±1% |
Table 6.
Inputs for internal loads used in the reconciled models.
| Inputs | Actual | Design |
|---|---|---|
| Indoor temperature (°C) | 29.0 | 25.0 |
| Occupant density (m2/person) | 10.0 | 10.0 |
| Lighting power density (W/m2) | 1.1 | 9.0 |
| Plug load power density (W/m2) | 3.2 | 15.0 |
Table 7.
The lighting and plug load savings.
| Item | Energy Savings | |
|---|---|---|
| EUI (kWh/(m2·yr)) | Percentage (%) | |
| Lighting | 0.72 | 3.00 |
| Plug load | 1.95 | 8.15 |
| Total | 2.67 | 11.15 |
Table 8.
Energy efficiency measures for the HVAC system. COP.
| Energy Efficient Measures | Energy Savings | |
|---|---|---|
| EUI (kWh/(m2·yr)) | Percentage (%) | |
| Set indoor temperature to 28 °C | 0.87 | 3.6 |
| Improve the chilled water system COP | 4.89 | 20.5 |
| Optimize HVAC operation | 0.73 | 3.0 |
| Total | 6.49 | 27.1 |
Table 9.
Optimizing the rooftop and façade photovoltaic (PV) system.
| Types | Area (m2) | Percentage (%) | System Efficiency | Total Power (kWp) | |
|---|---|---|---|---|---|
| Rooftop | Existing | 517 | 52.0 | 0.76 | 75.46 |
| Proposed | 149 | 15.0 | 0.76 | 22.05 | |
| Parking lot | Proposed | 944 | - | 0.76 | 137.69 |
© 2019 by the authors. Licensee MDPI, Basel, Switzerland. This article is an open access article distributed under the terms and conditions of the Creative Commons Attribution (CC BY) license (http://creativecommons.org/licenses/by/4.0/).
Share and Cite
MDPI and ACS Style
Wang, D.; Pang, X.; Wang, W.; Qi, Z.; Li, J.; Luo, D. Assessment of the Potential of High-Performance Buildings to Achieve Zero Energy: A Case Study. Appl. Sci. 2019, 9, 775. https://doi.org/10.3390/app9040775
AMA Style
Wang D, Pang X, Wang W, Qi Z, Li J, Luo D. Assessment of the Potential of High-Performance Buildings to Achieve Zero Energy: A Case Study. Applied Sciences. 2019; 9(4):775. https://doi.org/10.3390/app9040775
Chicago/Turabian StyleWang, Dan, Xiufeng Pang, Wei Wang, Zewei Qi, Jin Li, and Duo Luo. 2019. "Assessment of the Potential of High-Performance Buildings to Achieve Zero Energy: A Case Study" Applied Sciences 9, no. 4: 775. https://doi.org/10.3390/app9040775
Note that from the first issue of 2016, this journal uses article numbers instead of page numbers. See further details here.