Seasonal and Intra-Annual Patterns of Sedimentary Evolution in Tidal Flats Impacted by Laver Cultivation along the Central Jiangsu Coast, China


Abstract
:1. Introduction
2. Materials
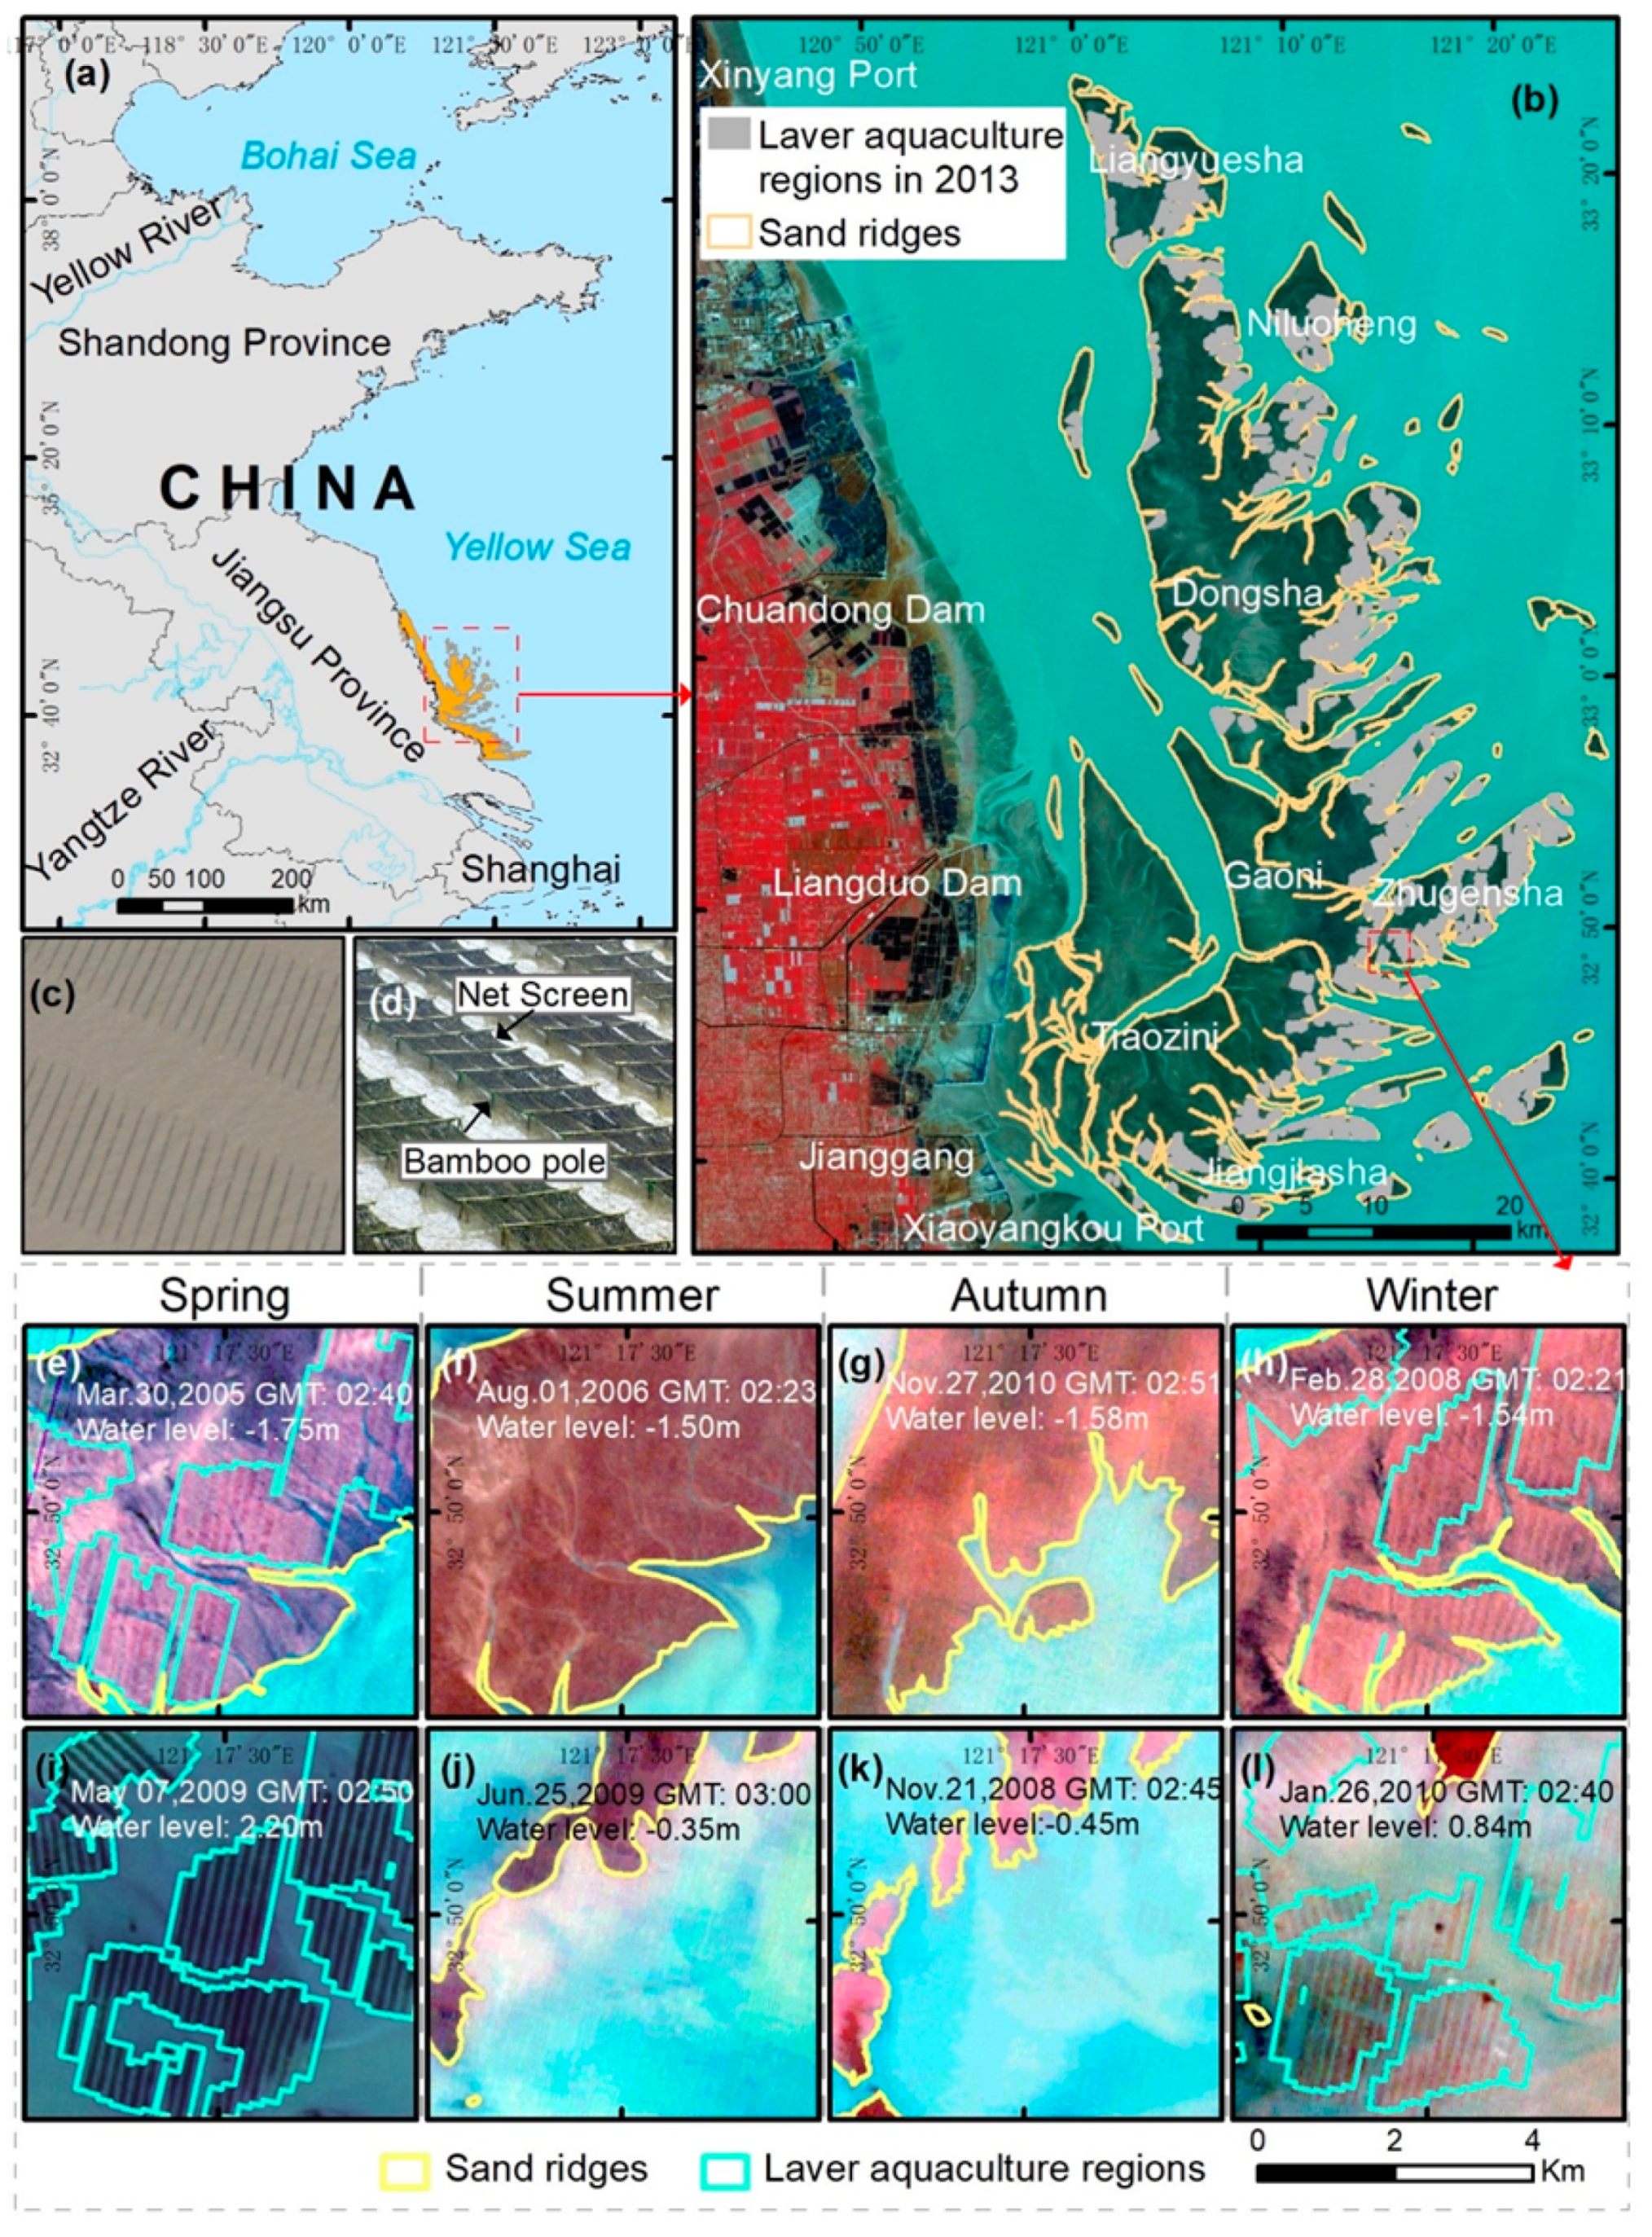
2.1. Study Area
2.2. Data Set
2.2.1. Satellite Images
2.2.2. Water Level Records
2.2.3. Pre-Processed Auxiliary Data
3. Methods
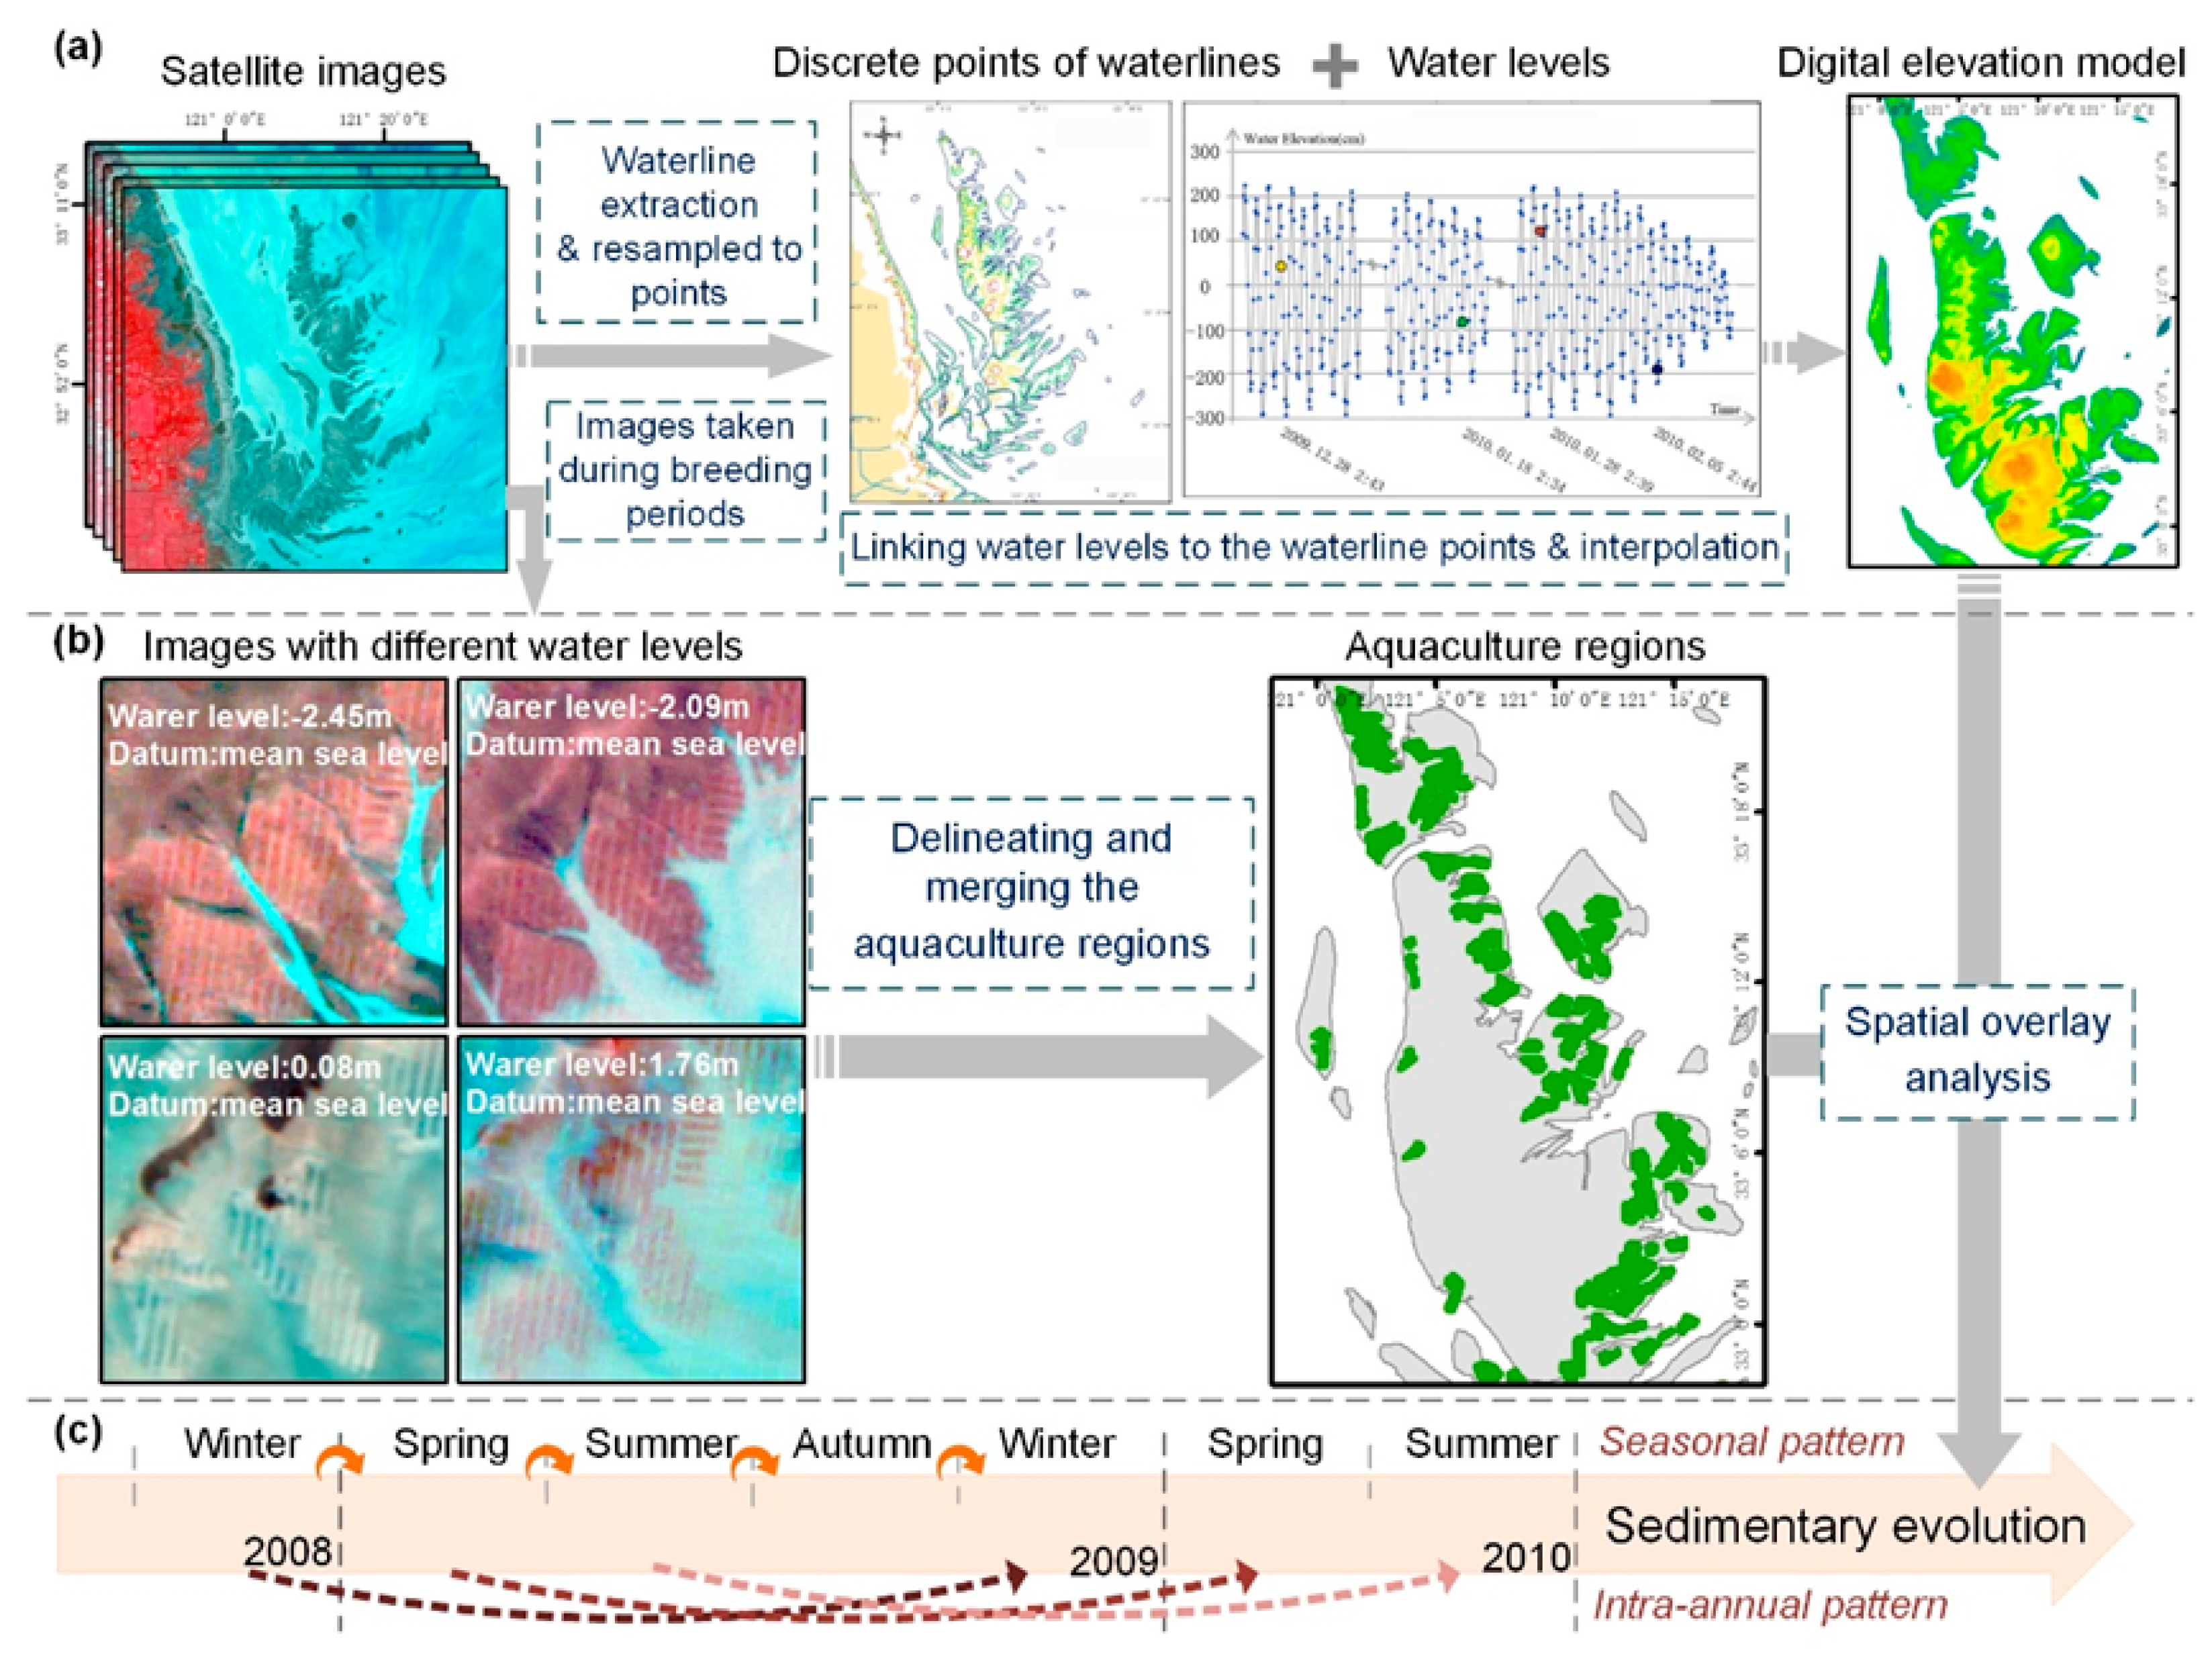
3.1. Tidal Flat DEM Construction
3.2. Extraction of Laver Aquaculture Regions
3.3. Analysis of Tidal Flat Sedimentary Evolution
4. Results
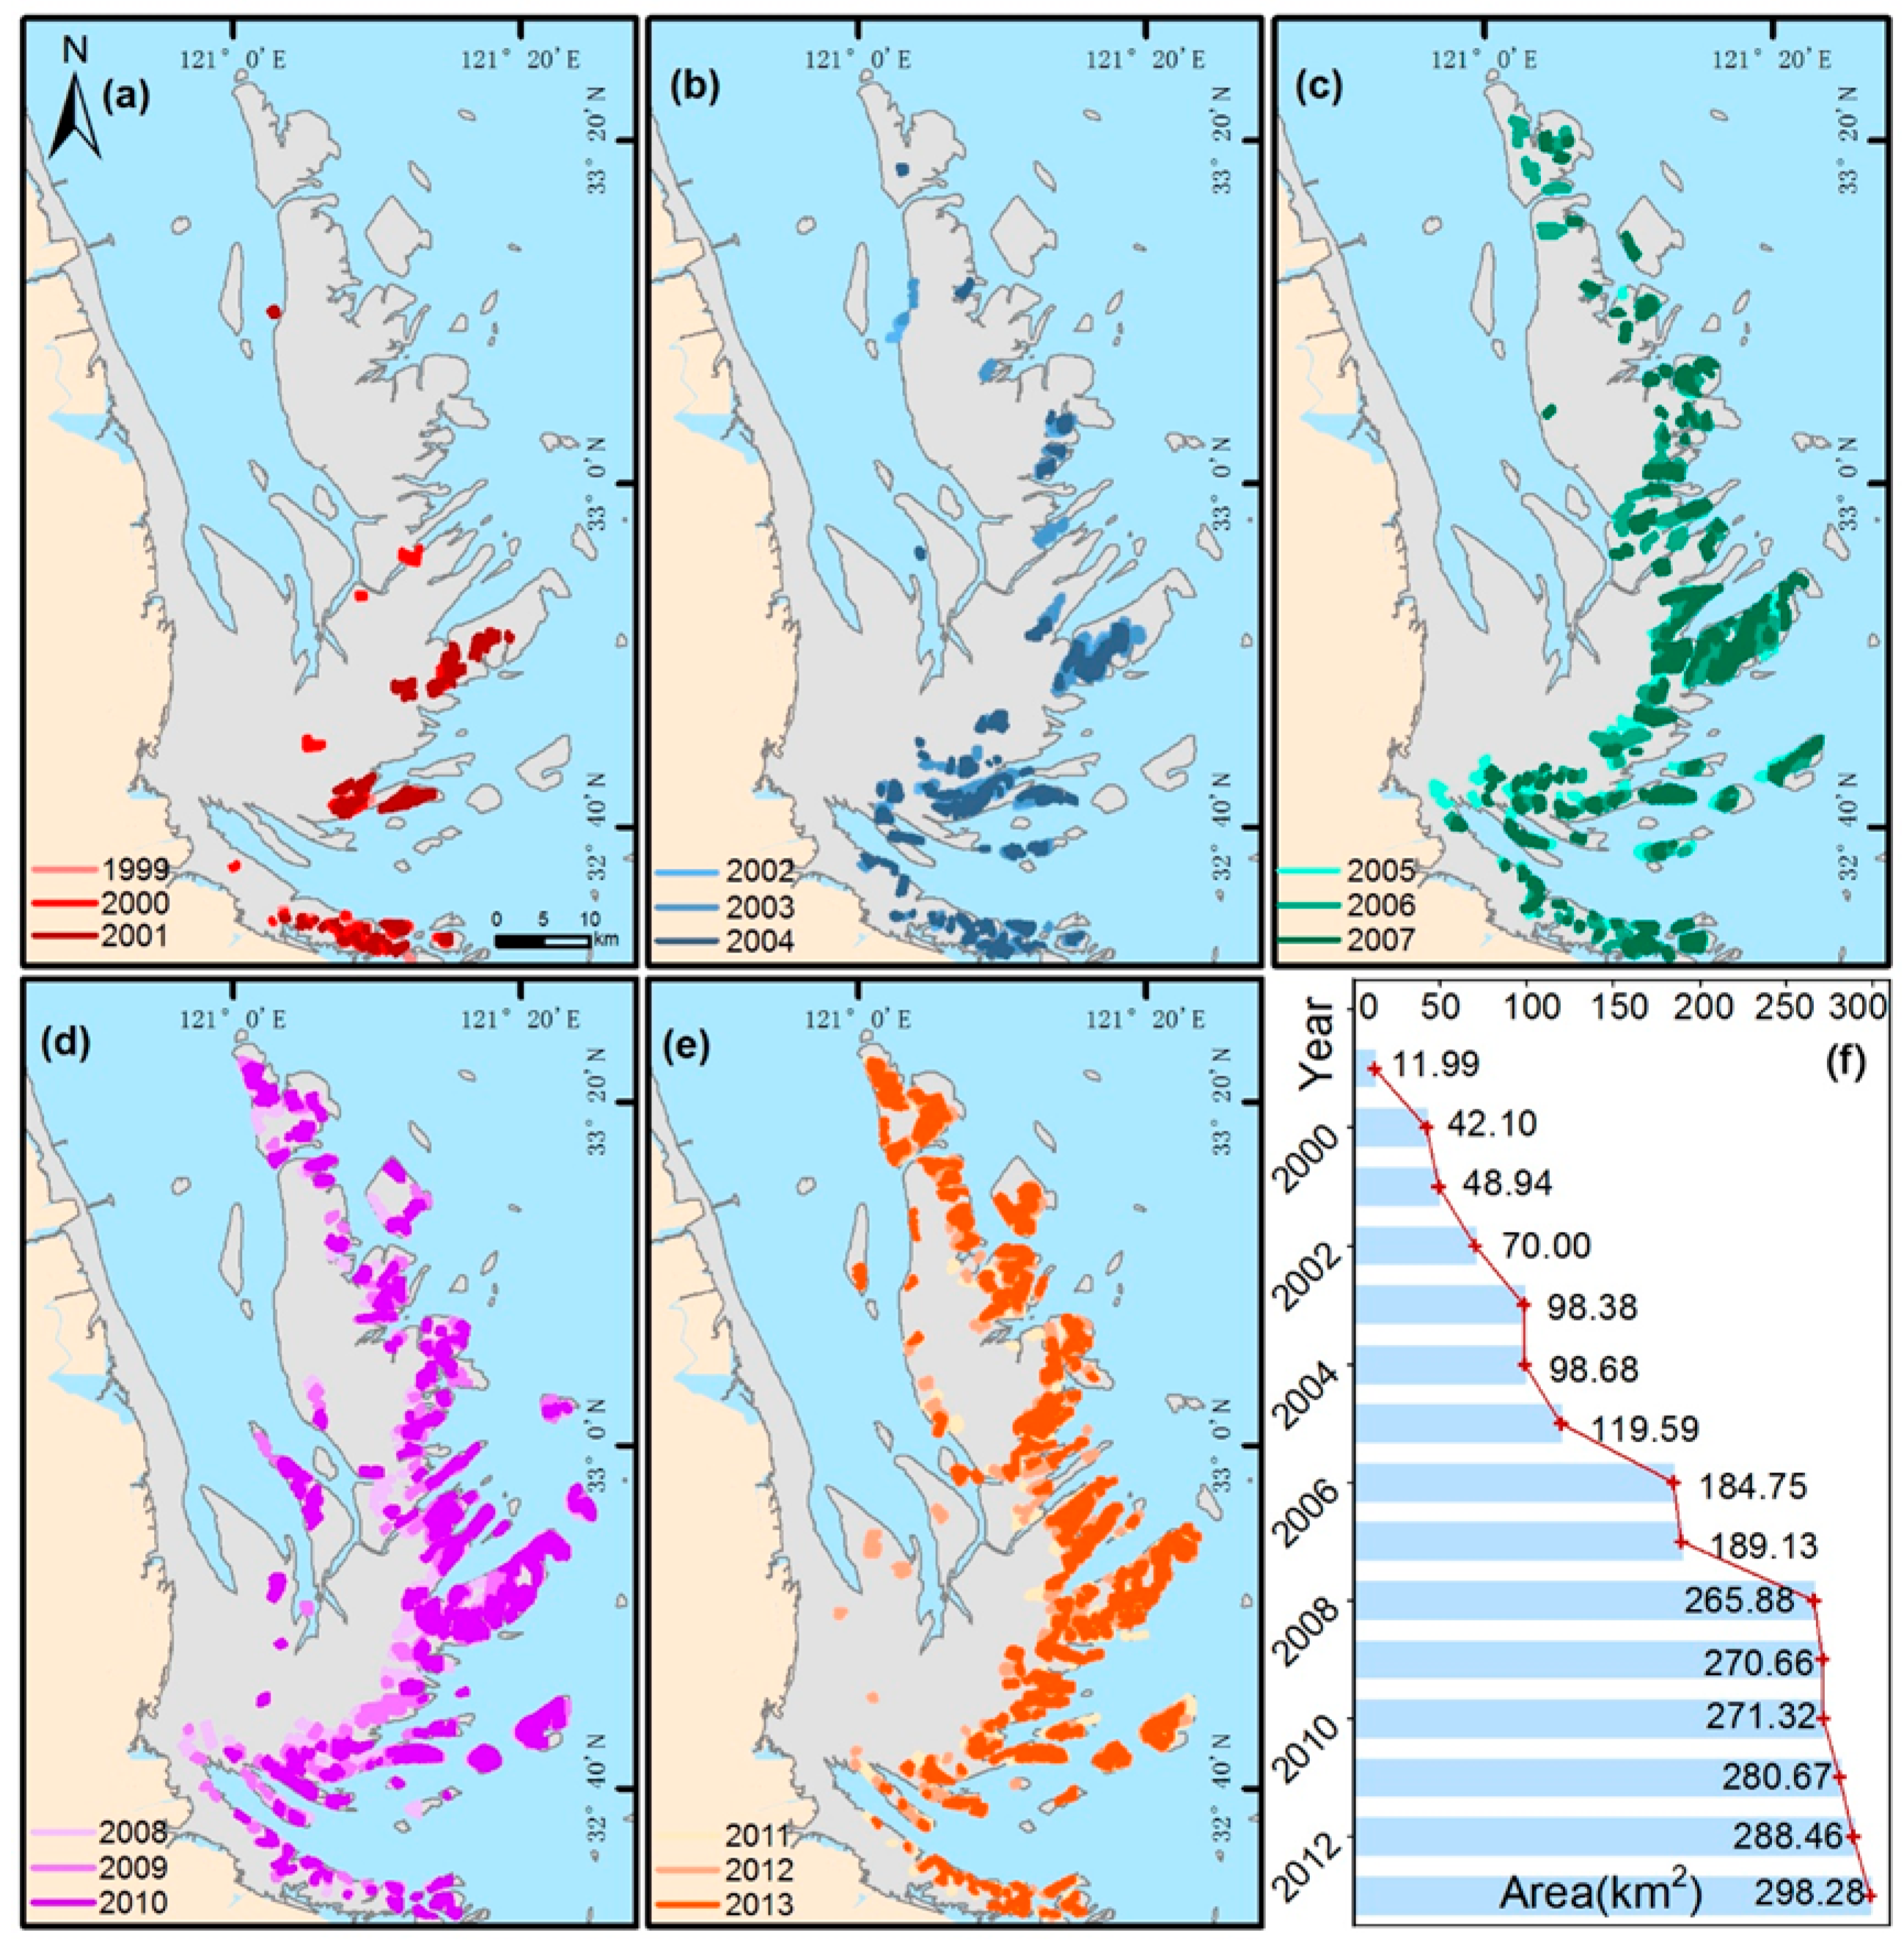
4.1. Expansion of Aquaculture Regions
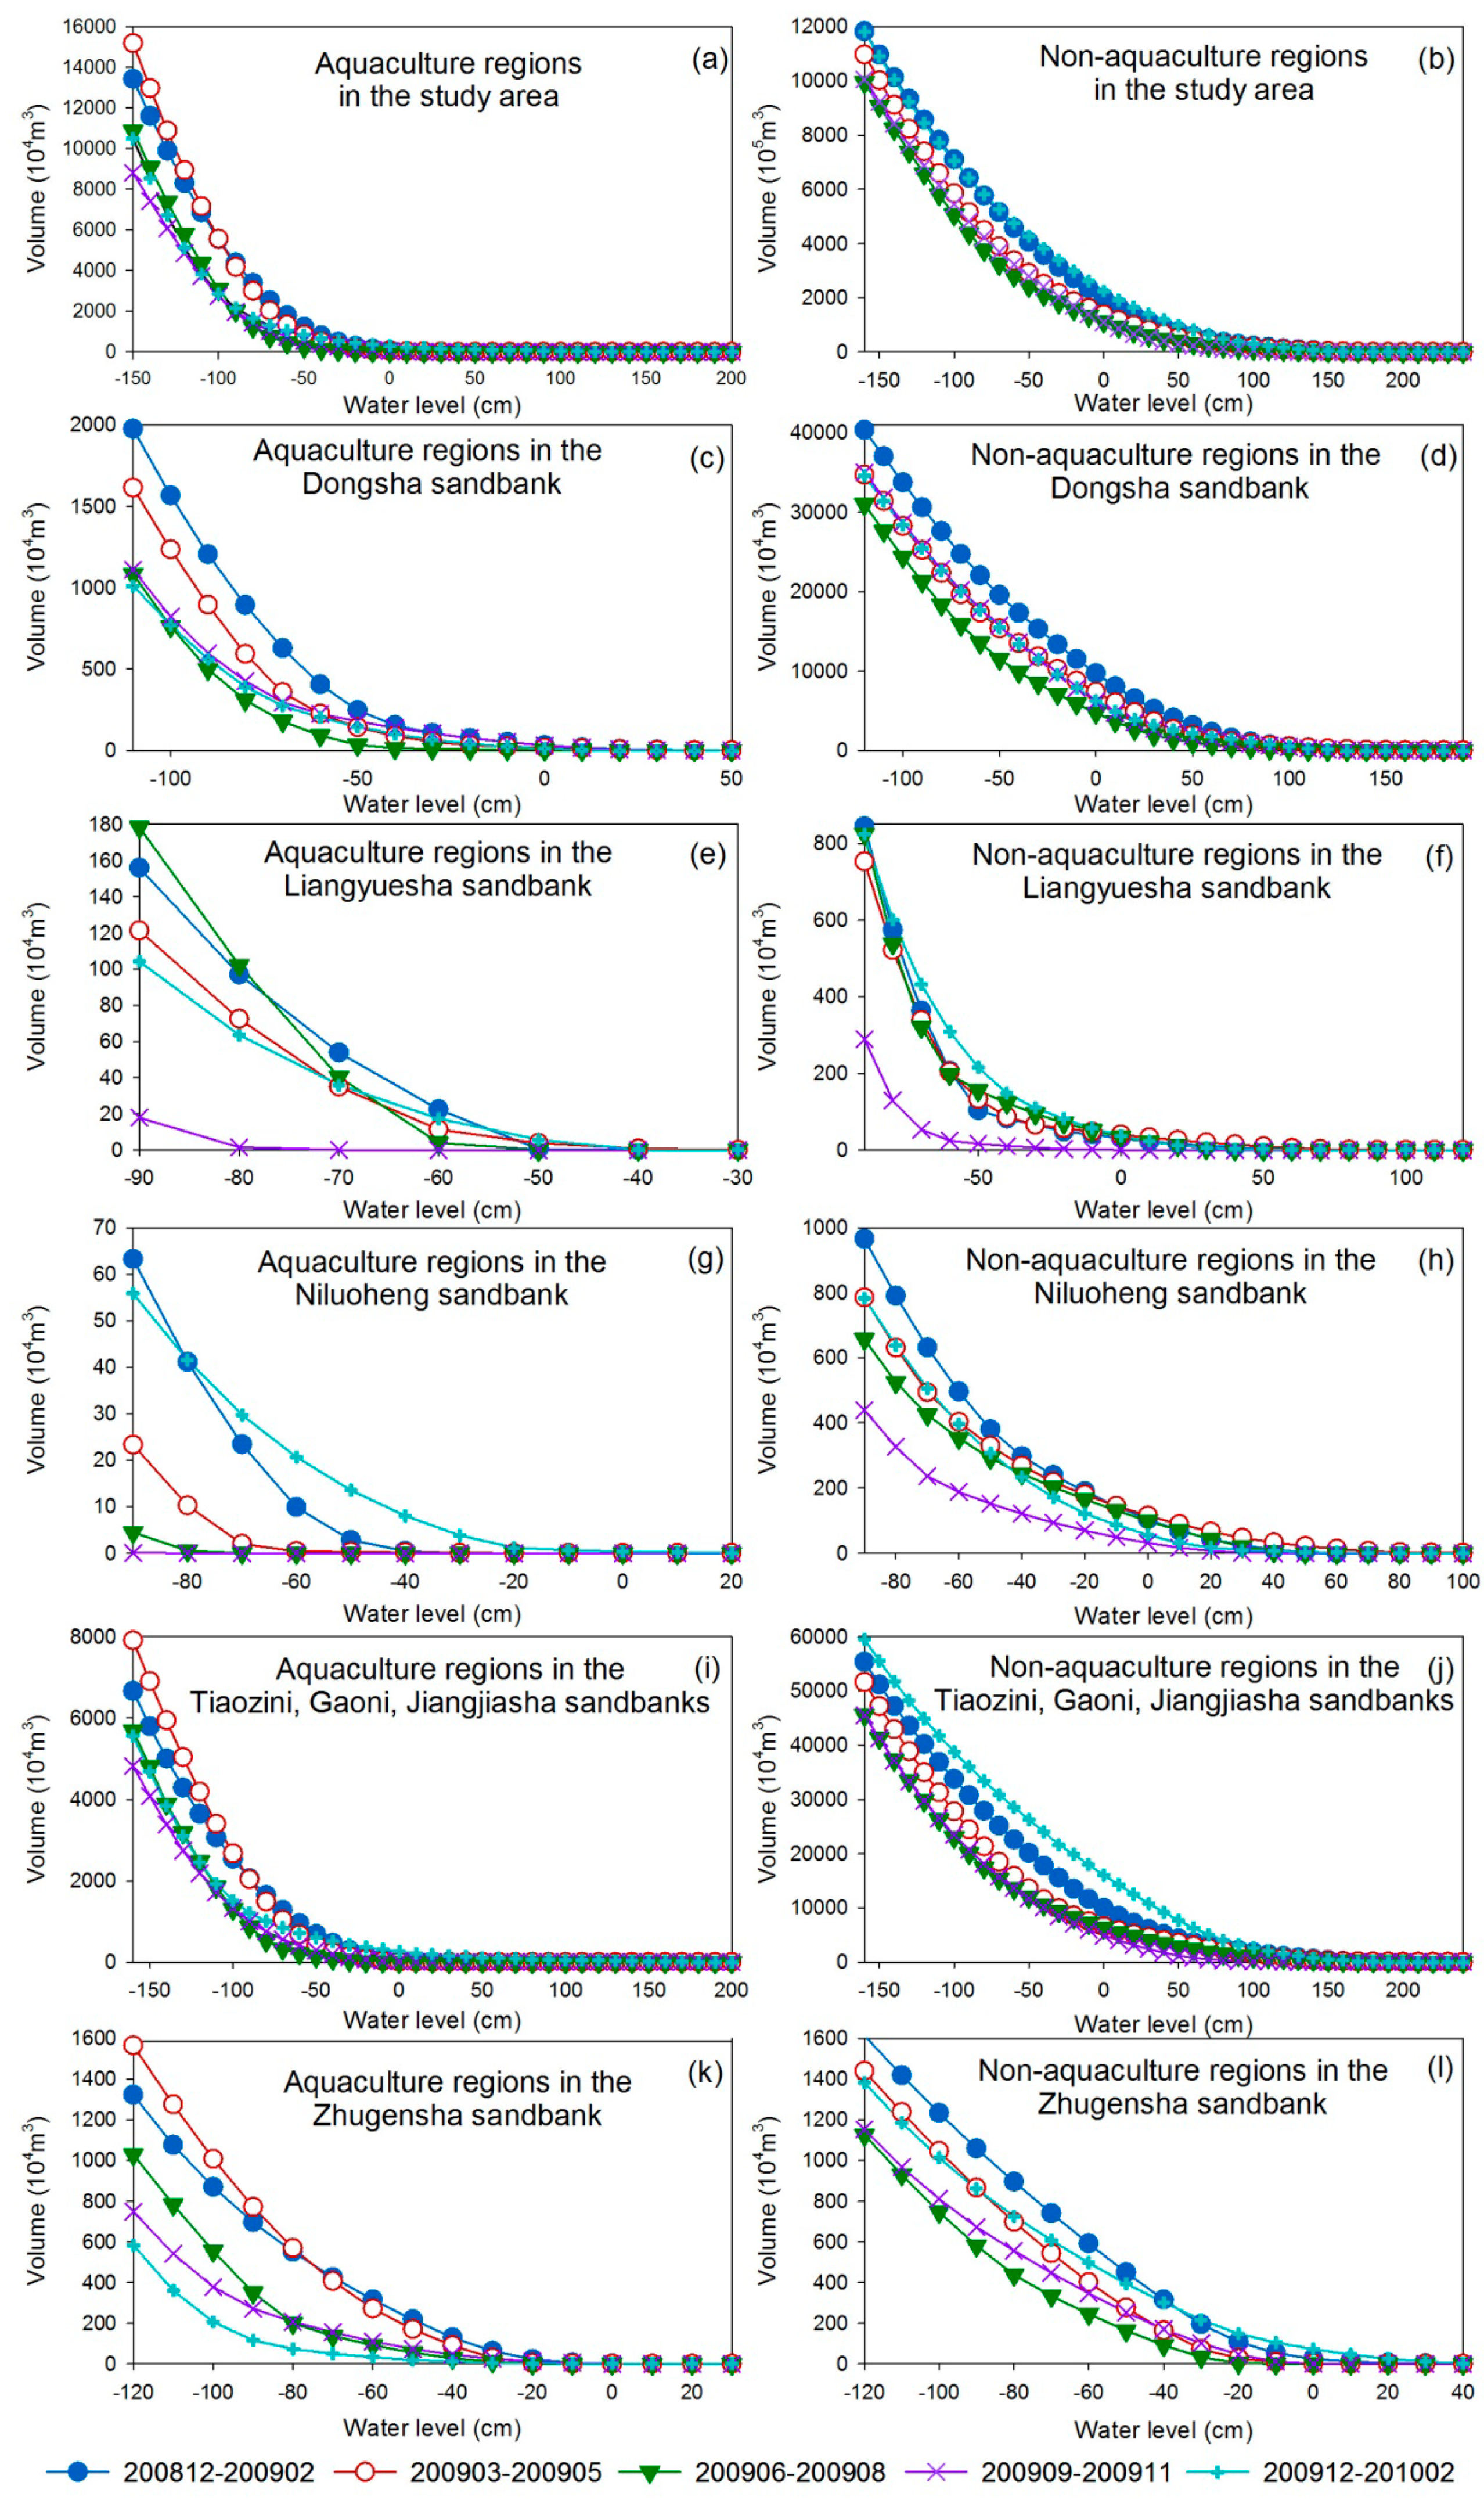
4.2. Seasonal Evolution Patterns
4.3. Intra-Annual Evolution Patterns
5. Discussion
5.1. The Availability of Remote Sensing Images
5.2. The Diversified Factors Affecting the Evolution Patterns of Tidal Flats
6. Conclusions
Author Contributions
Funding
Acknowledgments
Conflicts of Interest
References
- Chen, J.Y.; Cheng, H.Q.; Dai, Z.J.; Eisma, D.K. Harmonious development of utilization and protection of tidal flats and wetlands-a case study in Shanghai Area. China Ocean Eng. 2008, 22, 649–662. [Google Scholar]
- Zone, L.O.I.I.; Kremer, H.H.; Tissier, M.D.A.L.; Burbridge, P.R.; Talaue-Mcmanus, L.; Rabalais, N.N.; Parslow, J.; Crossland, C.J.; Young, B. Land-ocean interactions in the coastal zone: Science plan and implementation strategy. Environ. Policy Collect. 2005, 20, 1262–1268. [Google Scholar]
- Zhu, Q.; Yang, S.; Ma, Y. Intra-tidal sedimentary processes associated with combined wave–current action on an exposed, erosional mudflat, southeastern Yangtze river delta, China. Mar. Geol. 2014, 347, 95–106. [Google Scholar] [CrossRef]
- Ramesh, R.; Chen, Z.; Cummins, V.; Day, J.; D’Elia, C.; Dennison, B.; Forbes, D.L.; Glaeser, B.; Glaser, M.; Glavovic, B.; et al. Land-ocean interactions in the coastal zone: Past, present and future. Anthropocene 2015, 12, 85–98. [Google Scholar] [CrossRef]
- Liu, Y.X.; Li, M.C.; Mao, L.; Cheng, L.; Li, F.X. Toward a method of constructing tidal flat digital elevation models with modis and medium-resolution satellite images. J. Coast. Res. 2013, 29, 438–448. [Google Scholar] [CrossRef]
- Pendleton, L.; Donato, D.C.; Murray, B.C.; Crooks, S.; Jenkins, W.A.; Sifleet, S.; Craft, C.; Fourqurean, J.W.; Kauffman, J.B.; Marbà, N. Estimating global “blue carbon” emissions from conversion and degradation of vegetated coastal ecosystems. PLoS ONE 2012, 7, e43542. [Google Scholar] [CrossRef] [PubMed]
- Kirby, J.R.; Kirby, R. Medium timescale stability of tidal mudflats in bridgwater bay, bristol channel, uk: Influence of tides, waves and climate. Cont. Shelf Res. 2008, 28, 2615–2629. [Google Scholar] [CrossRef]
- Xu, J.X. Response of land accretion of the yellow river delta to global climate change and human activity. Quat. Int. 2008, 186, 4–11. [Google Scholar] [CrossRef]
- Syvitski, J.P.; Kettner, A.J.; Overeem, I.; Hutton, E.W.; Hannon, M.T.; Brakenridge, G.R.; Day, J.; Vörösmarty, C.; Saito, Y.; Giosan, L. Sinking deltas due to human activities. Nat. Geosci. 2009, 2, 681–686. [Google Scholar] [CrossRef]
- Blum, M.D.; Roberts, H.H. Drowning of the mississippi delta due to insufficient sediment supply and global sea-level rise. Nat. Geosci. 2009, 2, 488–491. [Google Scholar] [CrossRef]
- Rao, K.N.; Subraelu, P.; Kumar, K.C.V.; Demudu, G.; Malini, B.H.; Rajawat, A. Impacts of sediment retention by dams on delta shoreline recession: Evidences from the krishna and godavari deltas, india. Earth Surf. Process. Landf. 2010, 35, 817–827. [Google Scholar] [CrossRef]
- Yang, S.L.; Milliman, J.D.; Li, P.; Xu, K. 50,000 dams later: Erosion of the Yangtze river and its delta. Glob. Planet. Chang. 2011, 75, 14–20. [Google Scholar] [CrossRef]
- Ren, M.E.; Zhang, R.S.; Yang, J.H.; Zhang, D.C. The influence of storm tide on mud plain coast—With special reference to Jiangsu province. Mar. Geology Quat. Geology. 1983, 3, 1–24. [Google Scholar] [CrossRef]
- Shi, Z.; Chen, J.Y. Morphodynamics and sediment dynamics on intertidal mudflats in China (1961–1994). Cont. Shelf Res. 1996, 16, 1909–1926. [Google Scholar] [CrossRef]
- Fagherazzi, S.; Wiberg, P.L. Importance of wind conditions, fetch, and water levels on wave-generated shear stresses in shallow intertidal basins. J. Geophys. Res. Earth Surf. 2009, 114. [Google Scholar] [CrossRef]
- Flemming, B.W.; Nyandwi, N. Land reclamation as a cause of fine-grained sediment depletion in backbarrier tidal flats (Southern North Sea). Aquat. Ecol. 1994, 28, 299–307. [Google Scholar] [CrossRef]
- Hodoki, Y.; Murakami, T. Effects of tidal flat reclamation on sediment quality and hypoxia in isahaya bay. Aquat. Conserv. Mar. Freshw. Ecosyst. 2006, 16, 555–567. [Google Scholar] [CrossRef]
- Wang, Y.P.; Gao, S.; Jia, J.J.; Thompson, C.E.; Gao, J.H.; Yang, Y. Sediment transport over an accretional intertidal flat with influences of reclamation, Jiangsu coast, China. Mar. Geol. 2012, 291, 147–161. [Google Scholar] [CrossRef]
- Jia, L.W.; Pan, S.Q.; Wu, C.Y. Effects of the anthropogenic activities on the morphological evolution of the modaomen estuary, pearl river delta, China. China Ocean Eng. 2013, 27, 795–808. [Google Scholar] [CrossRef]
- Song, D.H.; Wang, X.H.; Zhu, X.M.; Bao, X.W. Modeling studies of the far-field effects of tidal flat reclamation on tidal dynamics in the East China Seas. Estuar. Coast. Shelf Sci. 2013, 133, 147–160. [Google Scholar] [CrossRef]
- Gao, G.D.; Wang, X.H.; Bao, X.W. Land reclamation and its impact on tidal dynamics in Jiaozhou Bay, Qingdao, China. Estuar. Coast. Shelf Sci. 2014, 151, 285–294. [Google Scholar] [CrossRef]
- Sun, C.; Liu, Y.X.; Zhao, S.S.; Li, H.Y.; Sun, J.Q. Saltmarshes response to human activities on a prograding coast revealed by a dual-scale time-series strategy. Estuar. Coasts 2016, 40, 522–539. [Google Scholar] [CrossRef]
- Yang, S.L.; Chen, J.Y. The role of vegetation in mud coast processes. Oceanol. Limnol. Sin. 1994, 25, 631–635. [Google Scholar]
- Netto, S.A.; Lana, P.C. Influence ofspartina alternifloraon superficial sediment characteristics of tidal flats in paranaguá bay (South-Eastern Brazil). Estuar. Coast. Shelf Sci. 1997, 44, 641–648. [Google Scholar] [CrossRef]
- Wang, A.J.; Gao, S.; Jia, J.J. Impact of the cord-grass spartina alterniflora on sedimentary and morphological evolution of tidal salt marshes on the Jiangsu coast, China. Acta Oceanol. Sin. 2006, 25, 32–42. [Google Scholar]
- Ge, B.M.; Bao, Y.X.; Cheng, H.Y.; Zhang, D.Z. Influence of spartina alterniflora invasion stages on macrobenthic communities on a tidal flat in Wenzhou bay, China. Braz. J. Oceanogr. 2012, 60, 441–448. [Google Scholar] [CrossRef]
- Kang, J.W. Changes in tidal characteristics as a result of the construction of sea-dike/sea-walls in the mokpo coastal zone in Korea. Estuar. Coast. Shelf Sci. 1999, 48, 429–438. [Google Scholar] [CrossRef]
- Byun, D.; Wang, X.; Holloway, P. Tidal characteristic adjustment due to dyke and seawall construction in the mokpo coastal zone, Korea. Estuar. Coast. Shelf Sci. 2004, 59, 185–196. [Google Scholar] [CrossRef]
- Traini, C.; Proust, J.-N.; Menier, D.; Mathew, M. Distinguishing natural evolution and human impact on estuarine morpho-sedimentary development: A case study from the vilaine estuary, France. Estuar. Coast. Shelf Sci. 2015, 163, 143–155. [Google Scholar] [CrossRef]
- Wu, X.; Wang, A. Impacts of human beings’ activities on north Jiangsu tidal flat. Sci. Geogr. Sin. 2005, 25, 614. [Google Scholar]
- Song, W.L.; Qian, Y.; Su, X.X. Analysis of ecological impact on Yancheng nature reserves for building Dafeng wind farms. Adm. Tech. Environ. Monit. 2011, 23, 32–36. [Google Scholar]
- Wang, W.; Yang, X.; Liu, G.; Zhou, H.; Ma, W.; Yu, Y.; Li, Z. Random forest classification of sediments on exposed intertidal flats using alos-2 quad-polarimetric sar data. In XXIII ISPRS Congress, Commission VIII; Halounova, L., Safar, V., Raju, P.L.N., Planka, L., Zdimal, V., Kumar, T.S., Faruque, F.S., Kerr, Y., Ramasamy, S.M., Comiso, J., et al., Eds.; The International Archives of the Photogrammetry, Remote Sensing and Spatial Information Sciences: Prague, Czech Republic, 2016; Volume XLI-B8, pp. 1191–1194. [Google Scholar] [CrossRef]
- Jung, R.; Adolph, W.; Ehlers, M.; Farke, H. A multi-sensor approach for detecting the different land covers of tidal flats in the german wadden sea—A case study at norderney. Remote Sens. Environ. 2015, 170, 188–202. [Google Scholar] [CrossRef]
- Wang, W.; Gade, M. A new sar classification scheme for sediments on intertidal flats based on multi-frequency polarimetric sar imagery. Int. Arch. Photogramm. Remote Sens. Spat. Inf. Sci. 2017, 42, 223–228. [Google Scholar] [CrossRef]
- Adolph, W.; Farke, H.; Lehner, S.; Ehlers, M. Remote sensing intertidal flats with terrasar-x. A sar perspective of the structural elements of a tidal basin for monitoring the wadden sea. Remote Sens. 2018, 10, 1085. [Google Scholar] [CrossRef]
- Geng, X.; Li, X.-M.; Velotto, D.; Chen, K.-S. Study of the polarimetric characteristics of mud flats in an intertidal zone using c- and x-band spaceborne sar data. Remote Sens. Environ. 2016, 176, 56–68. [Google Scholar] [CrossRef]
- Mason, D.C.; Davenport, I.J. Accurate and efficient determination of the shoreline in ers-1 sar images. IEEE Trans. Geosci. Remote Sens. 1996, 34, 1243–1253. [Google Scholar] [CrossRef]
- Al Fugura, A.K.; Billa, L.; Pradhan, B. Semi-automated procedures for shoreline extraction using single radarsat-1 sar image. Estuar. Coast. Shelf Sci. 2011, 95, 395–400. [Google Scholar] [CrossRef]
- Manzo, C.; Valentini, E.; Taramelli, A.; Filipponi, F.; Disperati, L. Spectral characterization of coastal sediments using field spectral libraries, airborne hyperspectral images and topographic lidar data (fhyl). Int. J. Appl. Earth Observ. Geoinf. 2015, 36, 54–68. [Google Scholar] [CrossRef]
- Adolph, W.; Jung, R.; Schmidt, A.; Ehlers, M.; Heipke, C.; Bartholomae, A.; Farke, H. Integration of terrasar-x, rapideye and airborne lidar for remote sensing of intertidal bedforms on the upper flats of norderney (German Wadden Sea). Geo-Mar. Lett. 2017, 37, 193–205. [Google Scholar] [CrossRef]
- Brockmann, C.; Stelzer, K. Optical remote sensing of intertidal flats. In Remote Sensing of the European Seas; Springer: Berlin, Germany, 2008; pp. 117–128. [Google Scholar]
- Valentini, E.; Taramelli, A.; Filipponi, F.; Giulio, S. An effective procedure for eunis and natura 2000 habitat type mapping in estuarine ecosystems integrating ecological knowledge and remote sensing analysis. Ocean Coast. Manag. 2015, 108, 52–64. [Google Scholar] [CrossRef]
- He, H.C.; Shi, Y.; Yin, Y.; Liu, X.Y.; Li, H.Q. Impact of prophyra cultivation on sedimentary and morphological evolution of tidal flat in Rudong, Jiangsu province. Quat. Sci. 2012, 32, 1161–1172. [Google Scholar]
- Widdows, J.; Brinsley, M. Impact of biotic and abiotic processes on sediment dynamics and the consequences to the structure and functioning of the intertidal zone. J. Sea Res. 2002, 48, 143–156. [Google Scholar] [CrossRef]
- Liu, Y.X.; Li, M.C.; Cheng, L.; Li, F.X.; Chen, K.F. Topographic mapping of offshore sandbank tidal flats using the waterline detection method: A case study on the Dongsha sandbank of Jiangsu radial tidal sand ridges, China. Mar. Geod. 2012, 35, 362–378. [Google Scholar] [CrossRef]
- Xing, F.; Wang, Y.P.; Wang, H.V. Tidal hydrodynamics and fine-grained sediment transport on the radial sand ridge system in the Southern Yellow Sea. Mar. Geol. 2012, 291, 192–210. [Google Scholar] [CrossRef]
- Wang, R.; Zhang, Y.Z.; Xia, F.; Zhao, S.D. Grain size distribution and transportation trends of bottom sediments in the sand ridge field of the South Yellow Sea, China. Mar. Geol. Quat. Geol. 2012, 32, 2012. [Google Scholar] [CrossRef]
- Song, J.W.; Zhang, Y.J.; LI, X.C.; Yang, W.Z. Comparison between gf-1 and landsat-8 images in land cover classification. Prog. Geogr. 2016, 35, 255–263. [Google Scholar]
- Wang, Q.; Wu, C.Q.; Li, Q.; Li, J.S. Chinese hj-1a/b satellites and data characteristics. Sci. China Earth Sci. 2010, 53, 51–57. [Google Scholar] [CrossRef]
- Liu, Y.X.; Li, M.C.; Mao, L.; Cheng, L.; Chen, K.F. Seasonal pattern of tidal-flat topography along the Jiangsu Middle Coast, China, using hj-1 optical images. Wetlands 2013, 33, 871–886. [Google Scholar] [CrossRef]
- Liu, Y.X.; Li, M.C.; Zhou, M.X.; Yang, K.; Mao, L. Quantitative analysis of the waterline method for topographical mapping of tidal flats: A case study in the Dongsha Sandbank, China. Remote Sens. 2013, 5, 6138–6158. [Google Scholar] [CrossRef]
- Taramelli, A.V.E.; Cornacchia, L.; Mandrone, S. Modelling uncertainty in estuarine system by means of combined approach of optical and radar remote sensing. Coast. Eng. 2014, 87, 77–96. [Google Scholar] [CrossRef]
- Taramelli, A.; Valentini, E.; Cornacchia, L.; Monbaliu, J.; Sabbe, K. Indications of dynamic effects on scaling relationships between channel sinuosity and vegetation patch size across a salt marsh platform. J. Geophys. Res.-Earth Surf. 2018, 123, 2714–2731. [Google Scholar] [CrossRef]
- Choi, J.K.; Eom, J.; Ryu, J.H. Spatial relationships between surface sedimentary facies distribution and topography using remotely sensed data: Example from the ganghwa tidal flat, Korea. Mar. Geol. 2011, 280, 205–211. [Google Scholar] [CrossRef]
- Mason, D.C.; Davenport, I.J.; Robinson, G.J.H.; Flather, R.A.; McCartney, B.S. Construction of an inter-tidal digital elevation model by the water-line method. Geophys. Res. Lett. 1995, 22, 3187–3190. [Google Scholar] [CrossRef]
- Wu, Y.C.; Huang, H.J.; Yang, Y.L. Hydraulic dynamical effect on the formation and evolution processes of the deltaic sand banks off northern Jiangsu Coast. Stud. Mar. Sin. 1998, 40, 55–63. [Google Scholar]
- Gao, S.; Wang, Y.P.; Gao, J.H. Sediment retention at the Changjiang sub-aqueous delta over a 57 years period, in response to catchment changes. Estuar. Coast. Shelf Sci. 2011, 95, 29–38. [Google Scholar] [CrossRef]


| No. | Acquisition Time a) yy-mm-ddd hh:mm | Sensor | Tide Level b) (m) | No. | Acquisition Time a) yy-mm-dd hh:mm | Sensor | Tide Level b) (m) |
|---|---|---|---|---|---|---|---|
| 1 | 19 February 1999 02:10 | Landsat5 TM | −1.89 | 26 | 14 April 2005 02:51 | IRS-P6 LISS3 | -1.91 |
| 2 | 12 December 1999 02:06 | Landsat7 ETM+ | −1.59 | 27 | 15 December 2005 02:36 | CEBRS CCD | 1.09 |
| 3 | 20 December 1999 02:05 | Landsat5 TM | 2.13 | 28 | 29 March 2006 02:33 | CEBRS CCD | 0.40 |
| 4 | 22 February 2000 02:04 | Landsat5 TM | −1.17 | 29 | 08 January 2007 02:25 | Landsat5 TM | −1.78 |
| 5 | 01 March 2000 02:23 | Landsat7 ETM+ | 0.87 | 30 | 09 January 2007 02:25 | CEBRS CCD | −1.62 |
| 6 | 09 March 2000 02:04 | Landsat5 TM | −1.89 | 31 | 02 January 2008 02:56 | IRS-P6 AWIFS | 0.04 |
| 7 | 15 January 2001 02:21 | Landsat7 ETM+ | −1.24 | 32 | 10 February 2008 02:44 | IRS-P6 LISS3 | −1.93 |
| 8 | 08 February 2001 02:10 | Landsat5 TM | −0.56 | 33 | 17 February 2008 02:51 | CEBRS CCD | 1.28 |
| 9 | 12 March 2001 02:10 | Landsat5 TM | −1.92 | 34 | 28 February 2008 02:21 | Landsat5 TM | −1.38 |
| 10 | 13 April 2001 02:10 | Landsat5 TM | −1.64 | 35 | 13 January 2009 02:15 | Landsat5 TM | −1.96 |
| 11 | 23 November 2001 02:10 | Landsat5 TM | −0.32 | 36 | 28 January 2009 02:49 | HJ1A CCD | −1.35 |
| 12 | 02 January 2002 02:19 | Landsat7 ETM+ | −1.60 | 37 | 06 March 2009 02:53 | HJ1B CCD | 0.49 |
| 13 | 19 February 2002 02:19 | Landsat7 ETM+ | −1.16 | 38 | 07 May 2009 02:50 | HJ1B CCD | 2.26 |
| 14 | 08 April 2002 02:19 | Landsat7 ETM+ | 1.43 | 39 | 26 January 2010 02:40 | HJ1B CCD | 0.83 |
| 15 | 05 January 2003 02:19 | Landsat7 ETM+ | −1.52 | 40 | 21 February 2010 02:54 | HJ1A CCD | −1.69 |
| 16 | 13 January 2003 02:02 | Landsat5 TM | 0.89 | 41 | 10 March 2010 02:43 | HJ1B CCD | 0.55 |
| 17 | 21 January 2003 02:19 | Landsat7 ETM+ | −1.82 | 42 | 07 March 2011 02:52 | HJ1A CCD | −1.86 |
| 18 | 29 January 2003 02:03 | Landsat5 TM | 1.82 | 43 | 26 March 2012 02:41 | HJ1B CCD | −1.98 |
| 19 | 06 February 2003 02:19 | Landsat7 ETM+ | −1.75 | 44 | 28 March 2012 02:42 | HJ1A CCD | −0.79 |
| 20 | 18 March 2003 02:04 | Landsat5 TM | −1.03 | 45 | 31 March 2012 02:23 | HJ1A CCD | 0.13 |
| 21 | 26 March 2003 02:19 | Landsat5 TM | 0.16 | 46 | 23 April 2012 02:38 | HJ1A CCD | 0.68 |
| 22 | 13 January 2004 02:41 | CEBRS CCD | −2.64 | 47 | 30 January 2013 02:17 | HJ1A CCD | −1.74 |
| 23 | 08 February 2004 02:41 | CEBRS CCD | −0.90 | 48 | 03 March 2013 02:04 | HJ1B CCD | 0.21 |
| 24 | 04 March 2004 02:09 | Landsat5 TM | 0.86 | 49 | 10 April 2013 02:01 | HJ1B CCD | 1.05 |
| 25 | 30 March 2005 02:40 | CEBRS CCD | −1.62 | 50 | 11 May 2013 02:11 | HJ1B CCD | −0.98 |
© 2019 by the authors. Licensee MDPI, Basel, Switzerland. This article is an open access article distributed under the terms and conditions of the Creative Commons Attribution (CC BY) license (http://creativecommons.org/licenses/by/4.0/).
Share and Cite
Lu, W.; Sun, J.; Liu, Y.; Liu, Y.; Zhao, B. Seasonal and Intra-Annual Patterns of Sedimentary Evolution in Tidal Flats Impacted by Laver Cultivation along the Central Jiangsu Coast, China. Appl. Sci. 2019, 9, 522. https://doi.org/10.3390/app9030522
Lu W, Sun J, Liu Y, Liu Y, Zhao B. Seasonal and Intra-Annual Patterns of Sedimentary Evolution in Tidal Flats Impacted by Laver Cultivation along the Central Jiangsu Coast, China. Applied Sciences. 2019; 9(3):522. https://doi.org/10.3390/app9030522
Chicago/Turabian StyleLu, Wanyun, Jiaqi Sun, Yongxue Liu, Yongchao Liu, and Bingxue Zhao. 2019. "Seasonal and Intra-Annual Patterns of Sedimentary Evolution in Tidal Flats Impacted by Laver Cultivation along the Central Jiangsu Coast, China" Applied Sciences 9, no. 3: 522. https://doi.org/10.3390/app9030522