Lifetime Prognosis of Lithium-Ion Batteries Through Novel Accelerated Degradation Measurements and a Combined Gamma Process and Monte Carlo Method

Department of Mechatronics Engineering, National Changhua University of Education, Changhua 500, Taiwan
*
Author to whom correspondence should be addressed.
Appl. Sci. 2019, 9(3), 559; https://doi.org/10.3390/app9030559
Submission received: 19 December 2018
/
Revised: 27 January 2019
/
Accepted: 31 January 2019
/
Published: 8 February 2019
(This article belongs to the Special Issue Advances in Dual-Ion Batteries)
Abstract
:Featured Applications
(1) Prognostics and health management of Li-ion batteries; (2) Lifetime evaluation using a dual-stress accelerated test; (3) Degradation modeling by a linear stochastic process with parameter random sampling technique.
Abstract
A compositional prognostic-based assessment using the gamma process and Monte Carlo simulation was implemented to monitor the likelihood values of test Lithium-ion batteries on the failure threshold associated with capacity loss. The evaluation of capacity loss for the test LiFePO4 batteries using a novel dual dynamic stress accelerated degradation test, called D2SADT, to simulate a situation when driving an electric vehicle in the city. The Norris and Landzberg reliability model was applied to estimate activation energy of the test batteries. The test results show that the battery capacity always decreased at each measurement time-step during D2SADT to enable the novel test method. The variation of the activation energies for the test batteries indicate that the capacity loss of the test battery operated under certain power and temperature cycling conditions, which can be accelerated when the charge–discharge cycles increase. Moreover, the modeling results show that the gamma process combined with Monte Carlo simulations provides superior accuracy for predicting the lifetimes of the test batteries compared with the baseline lifetime data (i.e., real degradation route and lifetimes). The results presented high prediction quality for the proposed model as the error rates were within 5% and were obtained for all test batteries after a certain quantity of capacity loss, and remained so for at least three predictions.
1. Introduction
The applications of lithium (Li)-ion batteries has continuously expanded because of their excellent energy density and long cycle lifetime, particularly with portable electronic devices (e.g., laptops, phones, camcorders, and cameras), hybrid or full electric vehicles (EVs), and satellites. The capacity loss has become the major concern for developing a long-driving-mileage and high-performance EV because degradation occurs when the cell is in charging–discharging cycles and various environmental conditions [1,2,3]. Some research indicates that the operation factors associated with depth of discharge (DoD), state of charge (SOC), temperature, and the charging–discharging rate are likely to reduce battery performance and energy degradation after hundreds or thousands of charging–discharging cycles [4,5]. The mechanism of degradation can be divided into chemical and mechanical degradation. The former is caused by the formation of solid electrolyte interface films, impeding deleterious degradation reactions within the cells; the latter is generated by the cyclic expansion, and contraction of insertion or alloy materials, leading to cell cracking, fatigue, and structural distortion [6,7,8,9].
Many studies have focused on predicting the lifetimes of Li-ion batteries. Ramadass et al. [10] developed a semi-empirical reliability model for predicting the capacity loss of Li-ion cells. Christensen and Newman [11] developed a model that is capable of simulating the effect of film resistance of anodes on the charging–discharging process for a Li-ion battery. Moreover, they combined the model into a galvanostatic charging–discharging model previously developed by Doyle et al. [12]. Ning et al. [13] developed a generalized model associated with the first-principle-based charging–discharging operation to simulate the degradation of rechargeable Li-ion batteries. Although this research provides scientific-based models to predict the degradation of Li-ion batteries and some of them agree with experimental data, most of their experiments were performed under a static charging–discharging process, as well as a fixed temperature. They are not realistic situations since the battery charging–discharging currents and temperature differ at all times when the EV is in operational status. Thus, it is necessary to evaluate the capacity loss of Li-ion batteries in practical conditions in order to predict their lifetimes more precisely when used in EVs.
A novel accelerated degradation test involving dual dynamic stresses, charging–discharging currents, and temperatures was developed by the authors to simulate the real conditions of driving an EV in a metropolitan area (e.g., as a commuter car). The test was called the dual dynamic stress accelerated degradation test (D2SADT) where the test battery cells were continually processed through full charging–discharging cycles through four-type-temperature-composition cycling [14]. The acceleration was defined by the ratio of the strictly operating battery to the normal operating battery in terms of the DoD ratio in these two situations. For instance, a battery pack of a plug-in hybrid EV is charged twice daily at a 50% DoD each time, once at work and once at home. If the battery pack is charged twice daily at 100% DoD each time, then the acceleration is two. Moreover, a battery pack may be operated at various temperatures when it is charged or discharged. In this study, to simplify the testing, they were represented by a four-type composition, namely one constant high, one constant low, one ramp-up, and one ramp-down temperature.
The degradation modeling for highly reliable products such as Li-ion batteries and LEDs is based on two aspects: stochastic processes and general degradation path approaches [15,16,17]. The stochastic processes involving the Wiener and gamma processes which indicate that the degradation of a test sample follows a random process associated with independent increments [18,19,20]. One advantage of stochastic processes is that they can generate a continuous-and-steady state, enabling the prediction to be updated during each measurement to easily develop a data-based model for prognostics and health management (PHM) of Li-ion batteries. However, it is also to represent the limitation of lacking the physical-oriented indicator to infer the failure mechanism associated with degradation behavior of the Li-ion battery.
In 1969, Norris and Landzberg [21] developed a practical accelerated reliability model on the basis of temperature cycling (TC) test conditions associated with cycle frequency, temperature range, and the maximum temperature. This model is to improve the Coffin–Manson equation since it is difficult to directly measure the strain associated with the thermal effect. In this study, the N–L equation was used to compute a physical-based indicator, using activation energy to illustrate the progress of degradation for the test Li-ion battery during the dual dynamic stress accelerated degradation test period. Additionally, a steady-state gamma process was applied for modeling the degradation of batteries according to observations of monitored degradation data to date. Monte Carlo simulation with controllable uncertainty was applied to simulate all the degradation paths by using the parameters of the probability distribution associated with the gamma process. Lifetime prognoses were performed in different temperature cycles with the inclusion of an increasing number of measurements. Finally, the prediction errors were computed to evaluate the quality of the lifetime prognosis by the proposed model.
2. Method
2.1. Physical-Based Reliability Model
Norris and Landzberg developed a temperature cycling-based accelerated reliability model in 1969. It is more practical than using the semi-experimental Coffin–Manson equation which has difficulties in measuring the true strain associated with the thermal effect. The N-L equation is shown below:
where AF is acceleration factor, Nu is the cycles to failure in normal use conditions (h), Na is the cycles to failure in accelerated test conditions (h), ΔTa is temperature range of TC in accelerated test conditions (K), ΔTu is temperature range of TC in normal use conditions (K), fu is cycle frequency of TC in normal use conditions, fa is cycle frequency of TC in accelerated test conditions (24 h/cycle time), n and m are exponents, and is a function associated with the effect of maximum temperature in TC, and it is expressed particularly by the Arrhenius equation, shown below.
where Ea is activation energy (ev or kJ/mole), k is Boltzmann constant 8.625 × 10⁻⁵ eV/K, is the maximum temperature in normal use conditions (K), is the maximum temperature in accelerated test conditions (K). In this study, two temperature cycling test conditions named TC1 and TC2 were setup. They represent the difference from the maximum temperature, but the other parameters, temperature range and cycle frequency, remain the same. Equation (1) was simplified to be
Thus, the activation energy is shown below:
It is noted that the activation energy in Equation (4) is from the two controllable dynamic stress variables: the power factor corresponding to charging–discharging currents and times and the environmental factor corresponding to temperature cycling at which they were implemented simultaneously.
2.2. Gamma Process Model
In reliability modeling, the gamma process represents the degradation process as a form of cumulative damage through which deterioration occurs gradually over time, and the small increments are always monotonic [22]. For a non-negative-value process {y(t), t ≥ 0}, y(t) is the measured degradation, such as the capacity loss, for a test battery at time t. Assuming that the degradation process maintains a steady state, the gamma process has the following properties [23]:
- y(0) = 0
- the increments ∆y(t) = y(t + ) − y(t) are independent
- ∆y(t) has a gamma distribution G(α, β), with the probability density function (PDF) defined by
Here, the shape parameter is > 0, the scale parameter is > 0, and the lifetime is defined as the time when the degradation reaches the failure threshold . The cumulative density function of is defined by
2.3. Monte Carlo Simulation
Monte Carlo simulation is a probabilistic-based algorithm that provides a numerical results through repeated random sampling [24]. The increments ∆y(t) are randomly generated from a gamma process to simulate all possible routes to reach the failure threshold. The parameters of the gamma distribution are quantified according to actual degradation test data. The number of Monte Carlo simulation runs m is defined to achieve the required accuracy shown as the following:
where is the standard normal statistic; , where C is the confidence level; is the standard deviation of the output; and is the standard error of the mean. In this study, we set a 0.95 confidence level and 0.01 standard error.
3. Experiment
Table 1 presents some typical specifications for the test of the high-capacity Li-ion batteries used in EVs. Figure 1 shows the test system of D2SADT that involved a battery test subsystem, a thermal chamber for TC, a data acquisition card, and a PC with software to control the tests. The test batteries were well-housed in the chamber for a long-term reliability test. The battery test subsystem was able to program various currents and time to carry out the dynamic charging–discharging test through cycling which it pumps and draws various currents to and from the cell, as well as monitor its terminal voltage and current demands. The software was going to control the main test conditions between the thermal chamber and the battery test subsystem, enabling the batteries to be tested by various temperatures and charging–discharging currents simultaneously—the so-called dual dynamic stress. Thus, the test method was realized to simulate certain driving conditions for Li-ion batteries used in EVs.
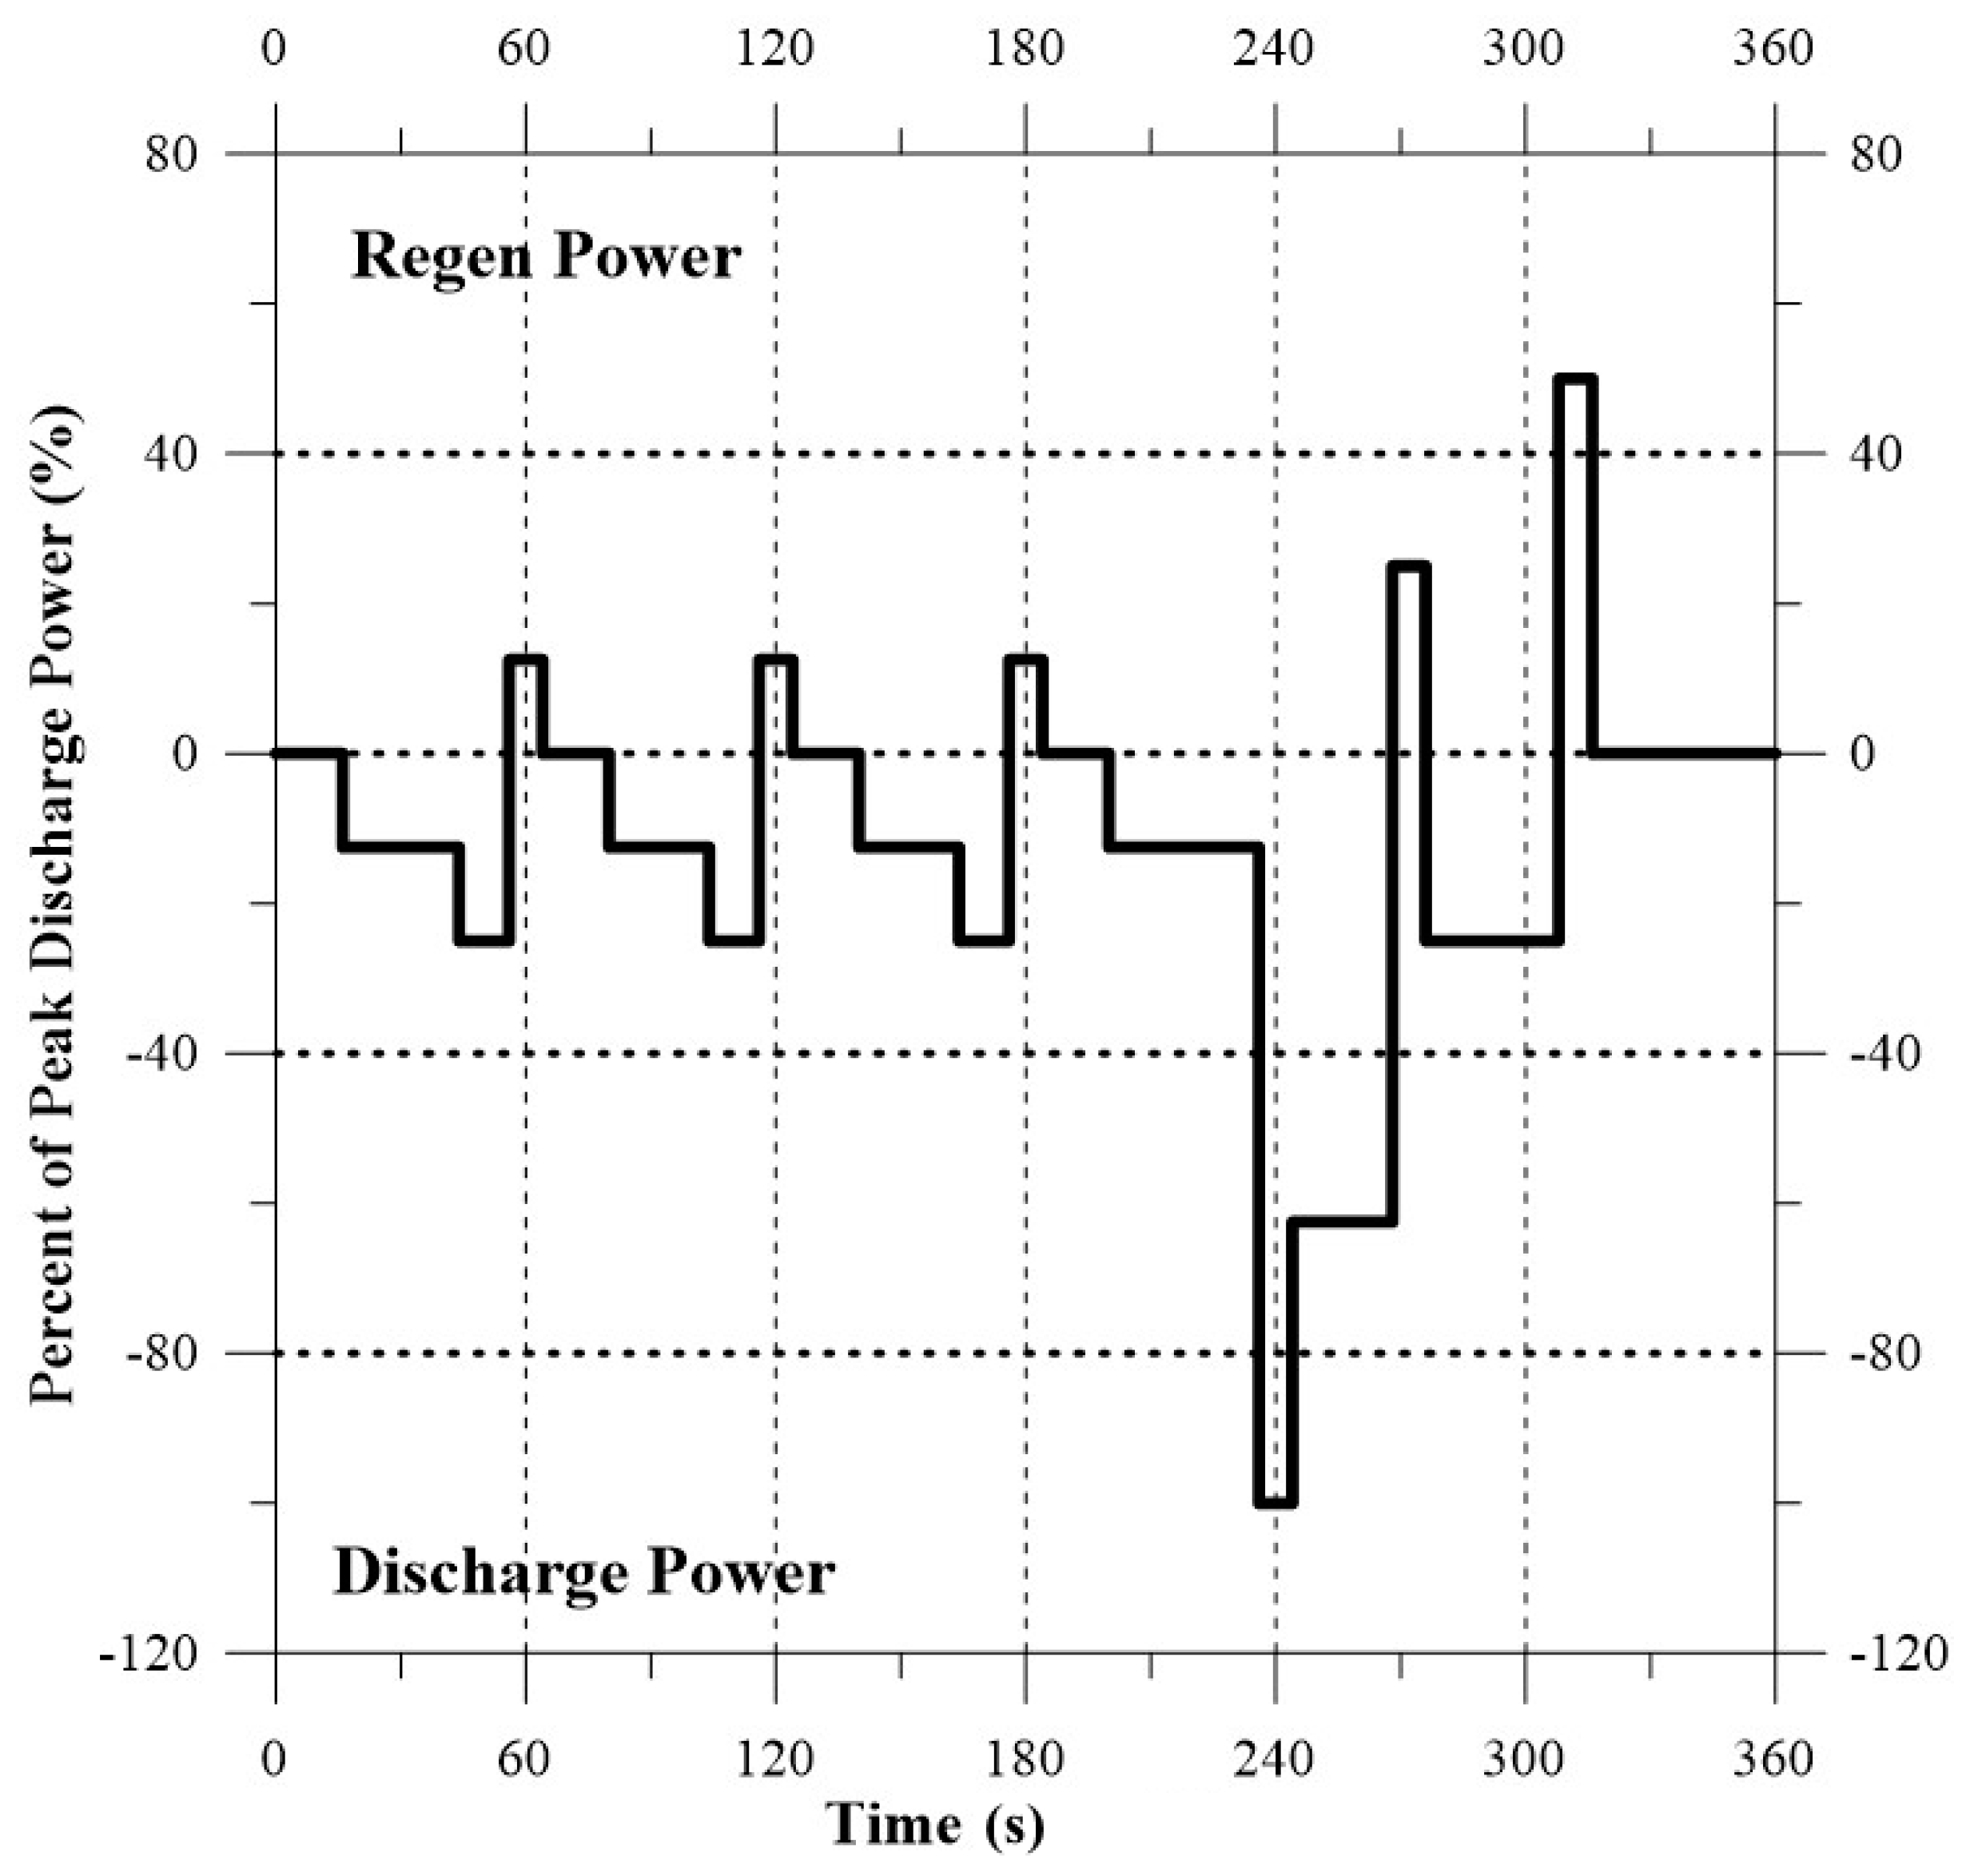
Figure 2 displays the test profiles of D2SADT. For an entire temperature cycle, it consisted of two dwell times and two ramp times, where three DSTs operated in a dwell time period and two DSTs operated in a ramp time period so that total ten DSTs operated in one temperature cycle. The Dynamic Stress Test (DST) is a variable power discharge test which is scaled to a percentage of the maximum rated power of the test vehicles, and requires regeneration levels for the general urban driving schedule. Table 2 shows the test parameters of the temperature cycling. Two temperature cycling tests called TC1 and TC2 were planed and performed to satisfy the N-L equation for evaluating the activation energy of the test battery. Figure 3 and Table 3 presents the DST profiles and the test procedures respectively. It is noted that the total test time of one DST was 360 s, but the cycles were repeated end-to-end with no time delay between them. The test battery was discharged using the DST power profile until to the cutoff condition was reached or other criteria emerged, and then was fully charged immediately. Compared to the life cycle test in standard IEC 62660-1 [25], where the main characteristics of the test profile is charge depleting, the test cycle (DST) used in this study was more focused on the variable power discharging regime to effectively simulate dynamic discharging in city traffic and highway ones [26,27]. Figure 4 shows a timing diagram of a reference power test (RPT). It was performed using the same discharging rate currents under an ambient temperature of 25 °C each time to calculate the capacity of the test battery when five temperature cycles were completed.
4. Results and Discussion
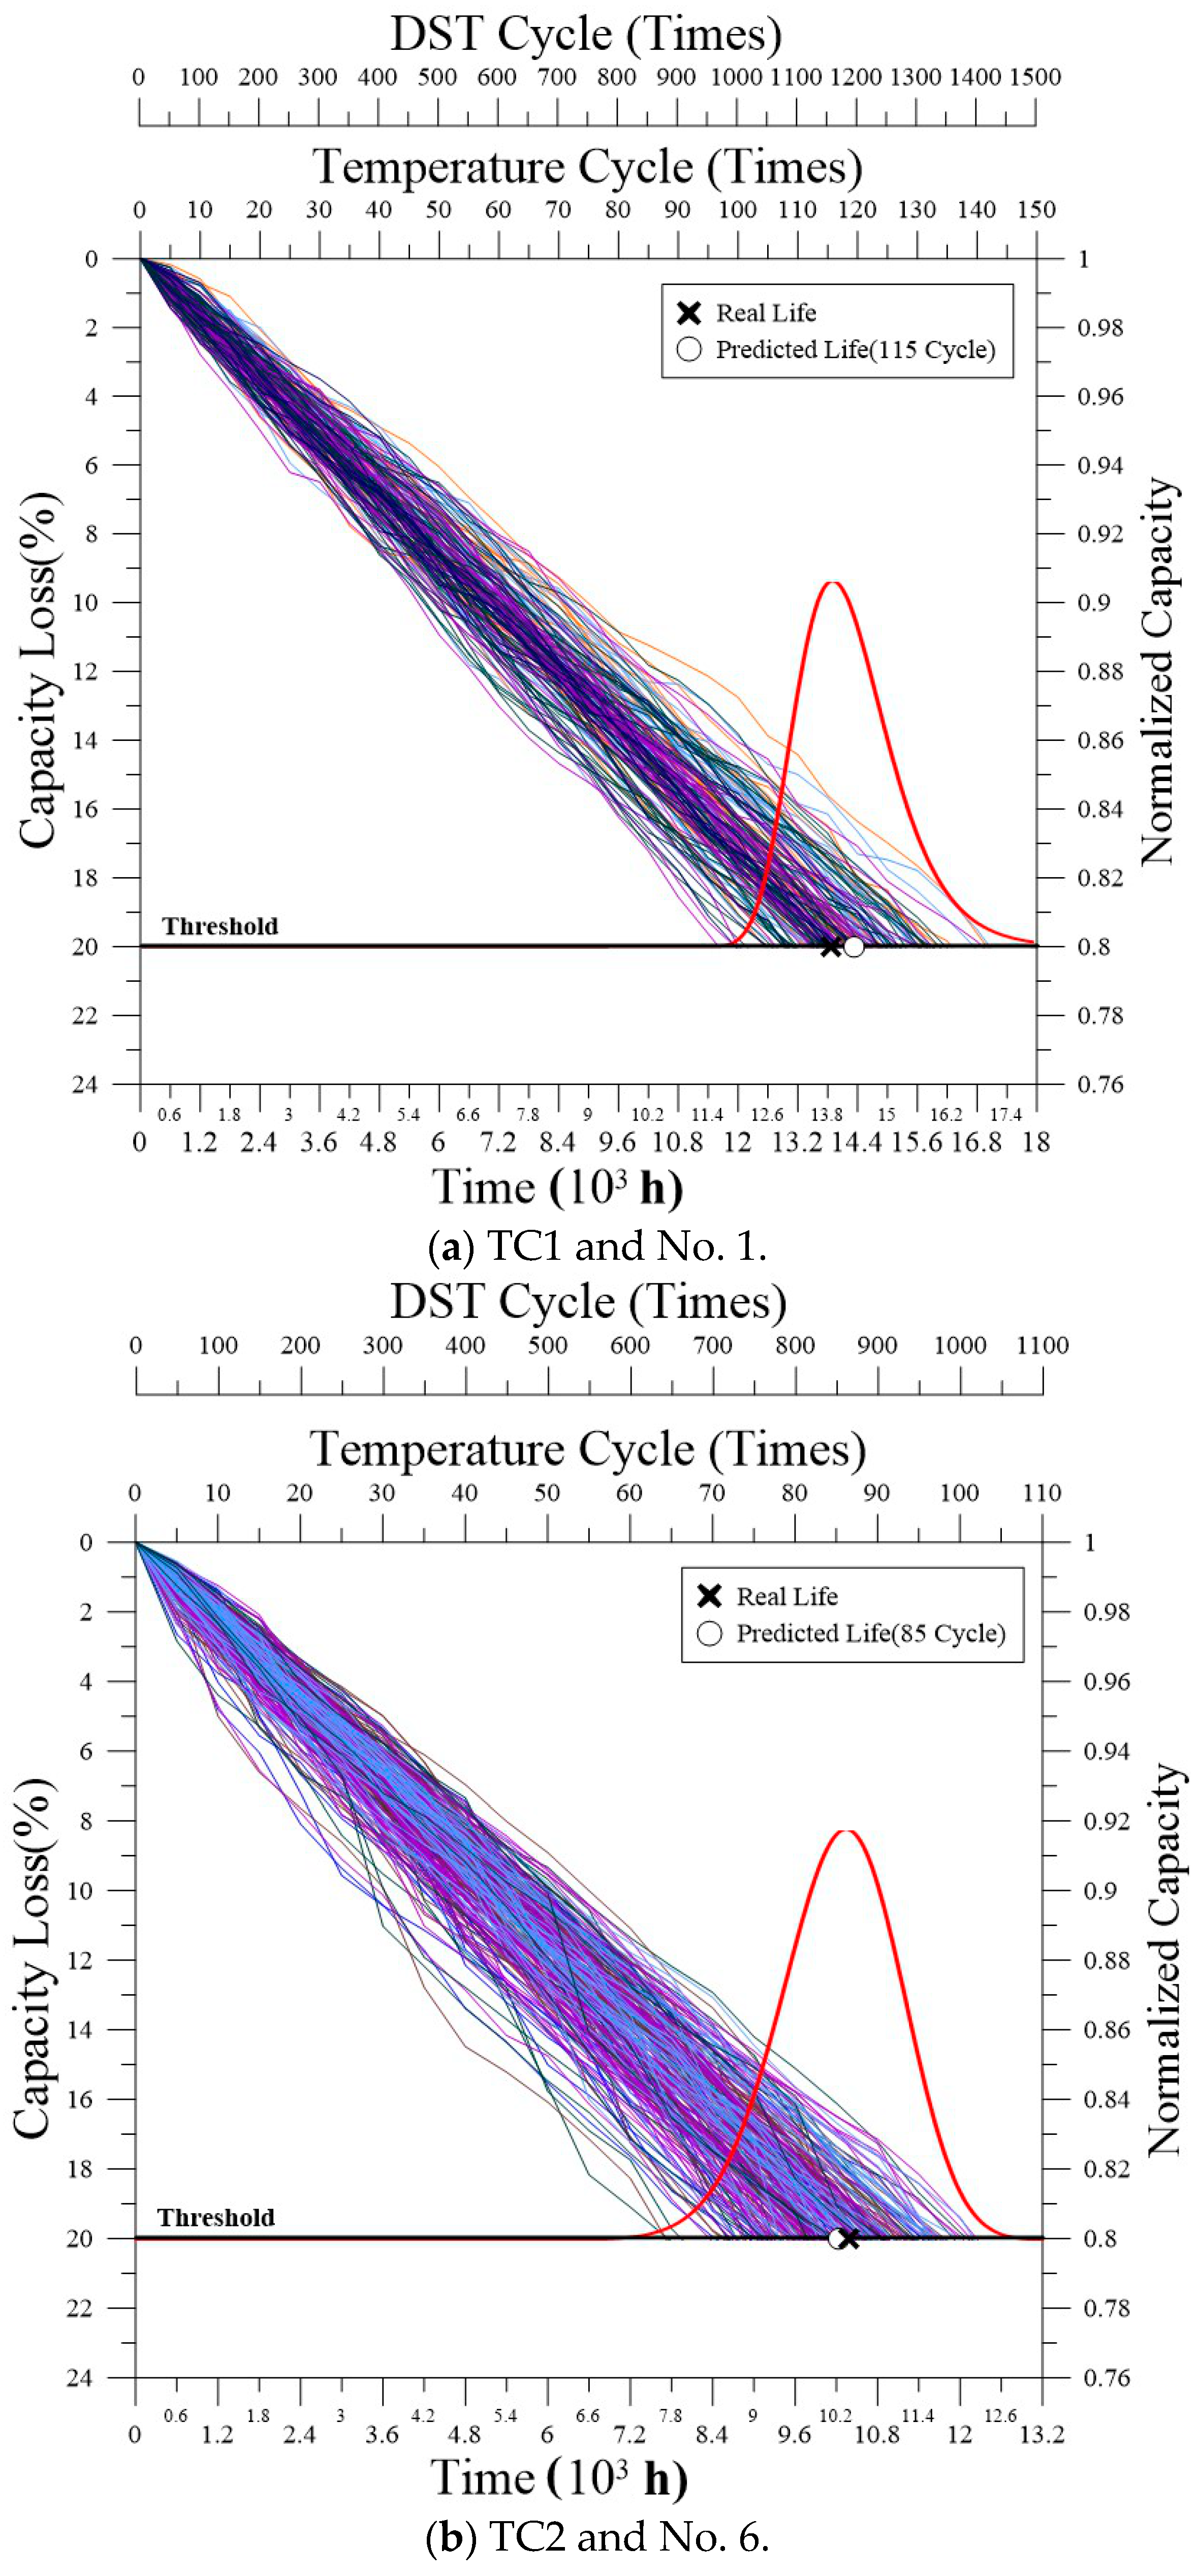
Figure 5 and Figure 6 present the degradation of the test batteries for the TC1 and the TC2 conditions through D2SADT. The capacity loss of the test battery continuously increased under both TC1 and TC2 conditions. It can be normalized by
The failure threshold was defined by a 20% capacity loss, referred from the major carmakers in the market, and the lifetime of each test battery was to be the time to reach the threshold. It is of note that the test battery operated under the hybrid dynamic stress from the charging–discharging test (DST) and temperature cycling (TC) test to accelerate the degradation of them, and both TC1 and TC2 had the same 10 DSTs for each cycle. In the case of TC1, test battery No. 1, No. 2, and No. 3 required 13,882, 13,940, 12,628 hr to reach this threshold, respectively. The test of TC2 conditions was performed after completing the TC1 test, and thus, these two test conditions were operated using the same test and measure equipment to maintain the minimum variance. Compared to TC1, the test batteries in TC2 required a shorter time to reach the threshold associated with 8971, 8139, and 10,393 hr. The average lifetimes of TC1 and TC2 were 13,483 and 9168 h, respectively. However, the significant difference of test conditions between the TC1 and TC2 was the minimum and maximum temperature; it is believed that the latter one will be the major contributor to the degradation of the Li-ion battery. As for the results, the magnitudes of capacity loss of test batteries in TC2 were generally higher than those in TC1 at the same measure time since the maximum temperature of TC2 was higher than that of TC1. Besides, only No. 1 in TC1 and No. 6 in TC2 are displayed for simplicity, though we have performed the prognosis assessment for all samples.
Figure 7 presents the relationship between the activation energy and the percentage of capacity loss for the LiFePO4 battery test. It is noted that the activation energy continuously decreased when the capacity loss increased overtime. The lower activation energy represented a higher reaction rate inside the battery, corresponding to speed up Lithium-ion diffusion in electrode materials. From the point of view of long-term reliability, the capacity loss of the test battery operating under certain power and temperature cycling conditions can be accelerated when the charge–discharge cycles increase.
Figure 8 shows the lifetime prediction by Monte Carlo (MC) simulation at the 115th TC in the cases of TC1 and No. 1, and TC2 and No. 6 at the 85th TC. Because a higher statistic standard associated with a 0.95 confidence level and 0.01 error was setup by the MC simulation, it required higher numbers of runs in order to decrease the uncertainty of the simulation; there are many possible degradation trajectories represented in the figure to reach the threshold. A statistical calculation was performed to determine the mean life of the PDF on the threshold, which was considered the predicted lifetime. Generally speaking, the predicted lifetime was very close to the real lifetime for the test batteries. To quantify the prediction accuracy, the prediction error is simply defined by
When the value is negative, the predicted lifetime was shorter than the real lifetime. However, the predicted lifetime was longer than the real lifetime when the value was positive. For the purpose of prognosis, the optimal result was that the predicted lifetime was as close as possible to the real lifetime, but the predicted lifetime must be shorter. Rather than the predicted lifetime, the residual useful life (RUL) was calculated and provided warning as early as possible to solve the pitfalls of prognostics. The prediction errors of the No. 1 and No. 6 test batteries were +3.16% and −1.47% to represent lower than the general ±5% prediction error for the industry. The RUL of the No. 1 and No. 6 test batteries by this prediction were 520 and 40 h, which were less than 600 h (next RPT measurement) to provide a stern warning that it is time to replace the battery. As a result, it reveals that the combined gamma process and Monte Carlo simulation can be used for accurately predicting the lifetimes of Li-ion batteries with a very small sample size.
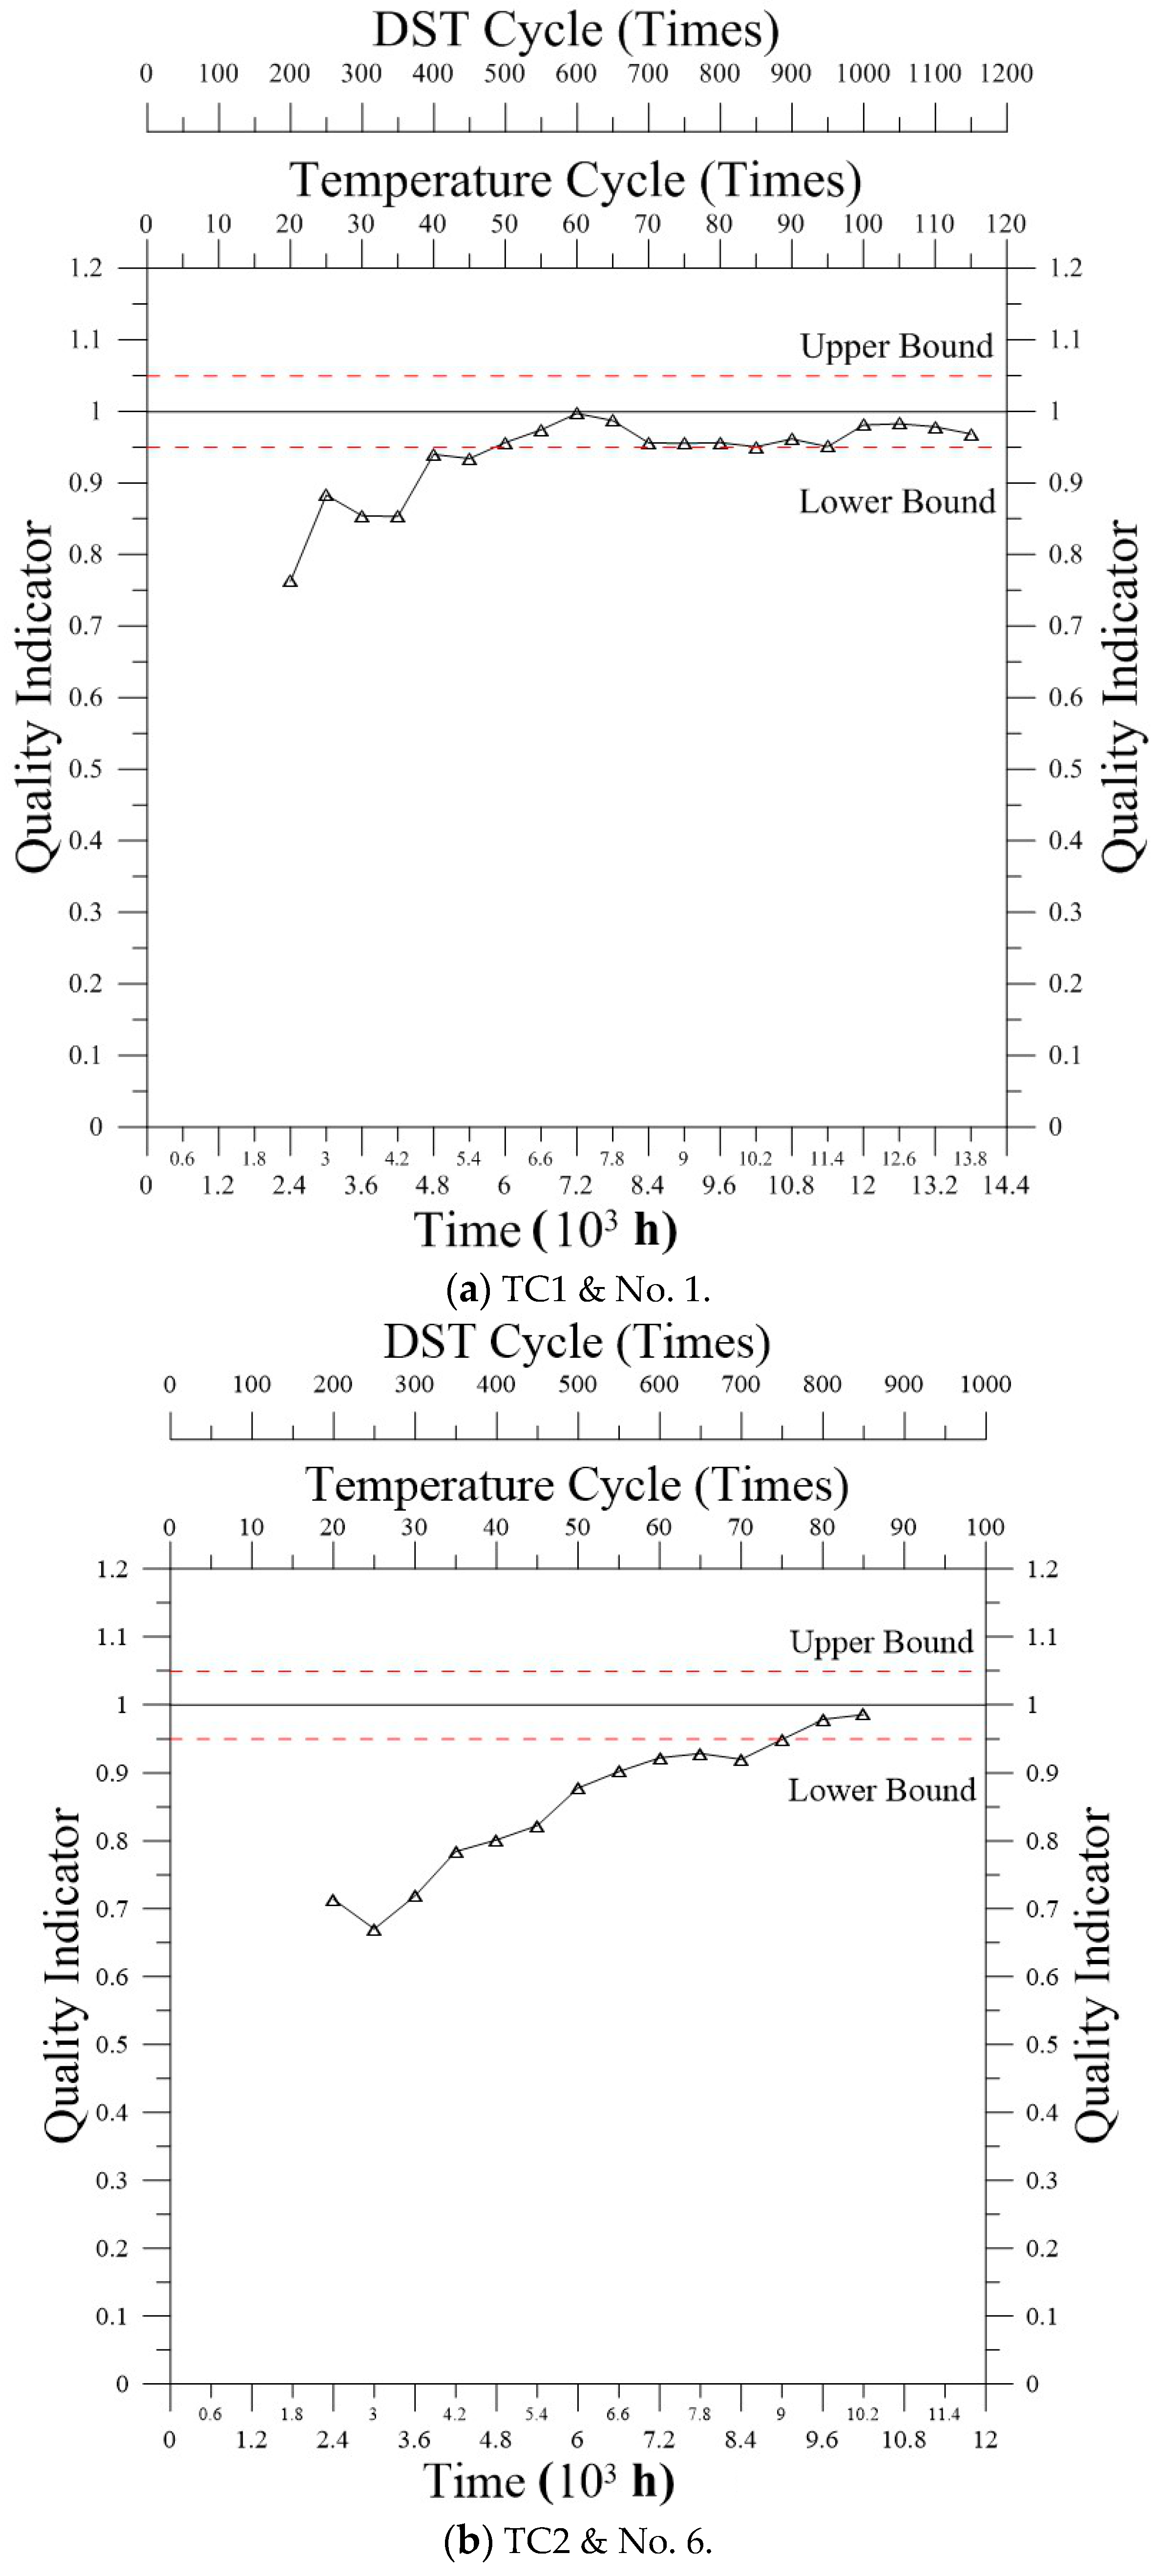
Figure 9 shows the lifetime prognosis of these two test batteries. Beginning at the 25th TC, the gamma process combined with Monte Carlo simulations were applied in each of the accumulated five temperature cycles to determine the probability density functions (PDFs) of the threshold, but we only showed the PDFs in each of the10 cycles for simplicities sake. In general, the mean life of these PDFs shifted more closely to real life when the temperature cycle increased. Figure 10 presents the evaluation of the prognosis quality for these two test batteries. The prediction errors of the No. 1 are all within ±5% after 50 temperature cycles, and the ones were the last three prognoses for the sample No. 6. As a result, the quality of the prognosis using the proposed hybrid model for these two batteries indicates a higher level after a certain quantity of capacity loss (or TCs) and remains at the last predictions in advance.
5. Conclusions
The accelerated degradation test was successfully performed to evaluate the capacity loss of the tested Lithium-ion (LiFePO4) battery using the novel dual dynamic stress accelerated degradation test (D2SADT). The Norris and Landzberg reliability model was applied to estimate activation energy which indicates that the capacity loss of the test battery operated under certain power and temperature cycling conditions, which can be accelerated when the charge–discharge cycles increase. The combined gamma process and Monte Carlo simulation approach not only provides superior prediction accuracy but also achieves high quality in prognosis. In summary, the proposed model and test method could help engineers not only understand the degradation behavior according to the indicator of activation energy, but also enable monitoring of the health states of Li-ion batteries more precisely in certain real conditions. This study provides a useful and basic reference to indicate that a non-linear stochastic model can be developed in advance to predict the lifetimes of Li-ion batteries operated in more complex conditions, such as a city, highway, and off-road driving patterns.
Author Contributions
The contributions of the individual author for this research: methodology, software, and experiment validation, investigation, and writing—original draft preparation by Y.-C.L.; conceptualization, advanced data analysis, writing—review and editing supervision, project administration, and funding acquisition by K.-J.C.
Funding
This research was funded by Ministry of Science and Technology, Taiwan, R.O.C., grant numbers MOST 107-2221-E-018-010-, 105-2221-E-018-005-, and 104-2221-E-018-011.
Acknowledgments
The authors acknowledge the funding support provided by the Ministry of Science and Technology, Taiwan, R. O. C.
Conflicts of Interest
The authors declare no conflict of interest.
References
- Santhanagopalan, S.; Zhang, Q.; Kumaresan, K.; White, R.E. Parameter estimation and life modeling of lithium-ion cells. J. Electrochem. Soc. 2008, 155, A345–A353. [Google Scholar] [CrossRef]
- Thomas, E.V.; Case, H.; Doughty, D.; Jungst, R.; Nagasubramanian, G.; Roth, E. Accelerated power degradation of li-ion cells. J. Power Sources 2003, 124, 254–260. [Google Scholar] [CrossRef]
- Spotnitz, R. Simulation of capacity fade in lithium-ion batteries. J. Power Sources 2003, 113, 72–80. [Google Scholar] [CrossRef]
- Hoog, J.; Timmermans, J.; Ioan-Stroe, D.; Swierczynski, M.; Jaguemont, J.; Goutam, S.; Omar, N.; Mierlo, J.; Bossche, P. Combined cycling and calendar capacity fade modeling of a Nickel-Manganese-Cobalt Oxide Cell with real-life profile validation. Appl. Energy 2017, 200, 47–61. [Google Scholar] [CrossRef]
- Sutter, L.; Berckmans, G.; Marinaro, M.; Smekens, J.; Firouz, Y.; Wohlfahrt-Mehrens, M.; Mierlo JOmar, N. Comprehensive aging analysis ofvolumetric constrained Lithium-ion pouch cells with high concentration silicon-alloy anodes. Energies 2018, 11, 2948. [Google Scholar] [CrossRef]
- Oldham, H.; Myland, J. Fundamentals of Electrochemical Science; Academic: San Diego, CA, USA, 1994. [Google Scholar]
- Shiao, C.C.; Chung, K.J. Accelerated degradation assessment of 18650 li-ion batteries. In Proceedings of the IEEE 2012 International Symposium on Computer, Consumer, and Control, Taichung, Taiwan, 4–6 June 2012; pp. 930–933. [Google Scholar]
- Rong, P.; Pedram, M. An analytical model for predicting the remaining battery capacity of lithium-ion batteries. IEEE Trans. VLSI Syst. 2006, 14, 441–451. [Google Scholar] [CrossRef]
- Armand, J.M. Issues and challenges facing rechargeable lithium batteries. Nature 2001, 414, 359–367. [Google Scholar]
- Ramadass, P.; Haran, B.; Gomadam, P.; White, R.; Popov, B. Development of first principles capacity fade model for li-ion cells. J. Electrochem. Soc. 2004, 151, A196–A203. [Google Scholar] [CrossRef]
- Christensen, J.; Newman, J. Effect of anode film resistance on the charge/discharge capacity of a lithium-ion battery. J. Electrochem. Soc. 2003, 150, A1416–A1420. [Google Scholar] [CrossRef]
- Doyle, M.; Fuller, T.F.; Newman, J. Modeling of galvanostatic charge and discharge of the lithium/polymer/insertion cell. J. Electrochem. Soc. 1993, 140, 1526–1533. [Google Scholar] [CrossRef]
- Ning, G.; White, R.; Popov, B. A generalized cycle life model of rechargeable li-ion batteries. Electrochim. Acta 2006, 51, 2012–2022. [Google Scholar] [CrossRef]
- Lin, Y.C.; Chung, K.J.; Hsiao, C.C. A Novel Double Dynamic Stress Accelerated Degradation Test to Evaluate Power Fade of Batteries for Electric Vehicles. In Intelligent Technologies and Engineering Systems; Lecture Notes of Electrical Engineering; Springer: New York, NY, USA, 2013; Volume 234, pp. 161–168. [Google Scholar]
- Wu, Q.; Yang, J.; Wang, J.; Xue, L. Reliability analysis of degradation with a new independent increment process. J. Mech. Sci. Technol. 2014, 28, 3971–3976. [Google Scholar] [CrossRef]
- Wei, H.; Dietrich, D.L. An alternative degradation reliability modeling approach using maximum likelihood estimation. IEEE Trans. Reliab. 2005, 54, 310–317. [Google Scholar]
- Weaver, B.P.; Meeker, W.Q. Methods for planning repeated measures accelerated degradation tests. Appl. Stoch. Models Bus. Ind. 2014, 30, 658–671. [Google Scholar] [CrossRef]
- Whitmore, G.A. Estimating degradation by a Wiener diffusion process subjected to measurement error. Lifetime Data Anal. 1995, 1, 307–319. [Google Scholar] [CrossRef] [PubMed]
- Park, C.; Padgett, W.J. Accelerated degradation models for failure based on geometric Brownian motion and Gamma processes. Lifetime Data Anal. 2005, 11, 511–527. [Google Scholar] [CrossRef] [PubMed]
- Tsai, C.; Tseng, S.; Balakrishnan, N. Optimal design for degradation tests based on Gamma processes with random effects. IEEE. Trans. Reliab. 2012, 61, 604–613. [Google Scholar] [CrossRef]
- Norris, K.C.; Landzberg, A.H. Reliability of Controlled Collapse Interconnections. IBM J. Res. Dev. 1969, 13, 266–271. [Google Scholar] [CrossRef]
- Baussaron, J.; Mihaela, B.; Leo, G.; Fabrice, G.; Paul, S. Reliability assessment based on degradation measurement: How to compare some models. Reliab. Eng. Syst. Saf. 2014, 131, 236–241. [Google Scholar] [CrossRef]
- Wang, H.; Xu, T.; Mi, Q. Lifetime prediction based on Gamma processes from accelerated degradation data. Chin. J. Aeronaut. 2015, 28, 172–179. [Google Scholar] [CrossRef]
- O’connor, P.D.T.; Kleyner, A. Practical Reliability Engineering, 5th ed.; Wiley: Hoboken, NJ, USA, 2012; pp. 109–119. [Google Scholar]
- Omar, N.; Daowd, M.; Hegazy, O.; Mulder, G.; Timmermans, J.; Coosemans, T.; Bossche, P.; Mierlo, J. Standardization work for BEV and HEV applications: Critical appraisal of recent traction battery documents. Energies 2012, 5, 138–156. [Google Scholar] [CrossRef]
- USABC. Electric Vehicle Battery Test Procedures Manual; Rev. 2; USABC and DOE National Laboratories Personnel: Idaho Falls, ID, USA, 1996.
- Ruiz, V.; Persio, F. Standards for the Performance and Durability Assessment of Electric Vehicle Batteries; JRC Tech. Reports; EU: Luxembourg, 2018. [Google Scholar]
Figure 1.
Test system of D2SADT.

Figure 2.
Test profiles of D2SADT.

Figure 3.
Test profile of the DST.

Figure 4.
Timing diagram of reference power test (RPT).

Figure 5.
The capacity loss of the test batteries during D2SADT (TC1 condition).

Figure 6.
The capacity loss of the test batteries during D2SADT (TC2 condition).

Figure 7.
The activation energy vs. the capacity loss.

Figure 8.
Lifetime prediction of the last TC for two test batteries in different temperature cycles.
Figure 8.
Lifetime prediction of the last TC for two test batteries in different temperature cycles.

Figure 9.
Lifetime prognosis of two test batteries in different temperature cycles.

Figure 10.
Prognosis quality evaluation of two test batteries in different temperature cycles.


Table 1.
Some specifications of the test battery.
| Cell Brand and Series # | Nominal Voltage | Geometry | Weight | Nominal Capacity | Dimensions | Operation Temperature |
|---|---|---|---|---|---|---|
| A123 ANR26650 | 3.3 V | Cylinder | 76 g | 2300 mAh | 25.85 mm × 65.2 mm | −30 °C ~ 55 °C |
Table 2.
Test parameters of the temperature cycling.
| Test Parameters | TC1 | TC2 |
|---|---|---|
| Tmax, °C | 55 | 60 |
| Tmin, °C | −15 | −10 |
| Temperature Range ΔT, °C | 70 | 70 |
| Dwell Time, h | 35 | 35 |
| Ramp Time, h | 25 | 25 |
| Ramp Rate, °C/h | 2.76 | 2.76 |
| Cycle Duration, day | 5 | 5 |
| Frequency of Usage, cycles/day | 0.2 | 0.2 |
Table 3.
Test procedure of the DST.
| Step | Time (s) | % | Step | Time (s) | % |
|---|---|---|---|---|---|
| 1 | 16 | 0 | 11 | 12 | −25 |
| 2 | 28 | −12.5 | 12 | 8 | 12.5 |
| 3 | 12 | −25 | 13 | 16 | 0 |
| 4 | 8 | 12.5 | 14 | 36 | −12.5 |
| 5 | 16 | 0 | 15 | 8 | −100 |
| 6 | 24 | −12.5 | 16 | 24 | −62.5 |
| 7 | 12 | −25 | 17 | 8 | 25 |
| 8 | 8 | 12.5 | 18 | 32 | −25 |
| 9 | 16 | 0 | 19 | 8 | 50 |
| 10 | 24 | −12.5 | 20 | 44 | 0 |
© 2019 by the authors. Licensee MDPI, Basel, Switzerland. This article is an open access article distributed under the terms and conditions of the Creative Commons Attribution (CC BY) license (http://creativecommons.org/licenses/by/4.0/).
Share and Cite
MDPI and ACS Style
Lin, Y.-C.; Chung, K.-J. Lifetime Prognosis of Lithium-Ion Batteries Through Novel Accelerated Degradation Measurements and a Combined Gamma Process and Monte Carlo Method. Appl. Sci. 2019, 9, 559. https://doi.org/10.3390/app9030559
AMA Style
Lin Y-C, Chung K-J. Lifetime Prognosis of Lithium-Ion Batteries Through Novel Accelerated Degradation Measurements and a Combined Gamma Process and Monte Carlo Method. Applied Sciences. 2019; 9(3):559. https://doi.org/10.3390/app9030559
Chicago/Turabian StyleLin, Yu-Chang, and Kuan-Jung Chung. 2019. "Lifetime Prognosis of Lithium-Ion Batteries Through Novel Accelerated Degradation Measurements and a Combined Gamma Process and Monte Carlo Method" Applied Sciences 9, no. 3: 559. https://doi.org/10.3390/app9030559
Note that from the first issue of 2016, this journal uses article numbers instead of page numbers. See further details here.