Advances in Engineering and Application of Optogenetic Indicators for Neuroscience


1
Media Lab, McGovern Institute for Brain Research, and Department of Brain and Cognitive Sciences, MIT, Cambridge, MA 02139, USA
2
INBICST, Moscow Institute of Physics and Technology, 123182 Moscow, Russia
3
Kurchatov Institute National Research Center, 123182 Moscow, Russia
*
Authors to whom correspondence should be addressed.
Appl. Sci. 2019, 9(3), 562; https://doi.org/10.3390/app9030562
Submission received: 15 January 2019
/
Revised: 1 February 2019
/
Accepted: 2 February 2019
/
Published: 8 February 2019
(This article belongs to the Special Issue The Advances and Applications of Optogenetics)
Abstract
:Our ability to investigate the brain is limited by available technologies that can record biological processes in vivo with suitable spatiotemporal resolution. Advances in optogenetics now enable optical recording and perturbation of central physiological processes within the intact brains of model organisms. By monitoring key signaling molecules noninvasively, we can better appreciate how information is processed and integrated within intact circuits. In this review, we describe recent efforts engineering genetically-encoded fluorescence indicators to monitor neuronal activity. We summarize recent advances of sensors for calcium, potassium, voltage, and select neurotransmitters, focusing on their molecular design, properties, and current limitations. We also highlight impressive applications of these sensors in neuroscience research. We adopt the view that advances in sensor engineering will yield enduring insights on systems neuroscience. Neuroscientists are eager to adopt suitable tools for imaging neural activity in vivo, making this a golden age for engineering optogenetic indicators.
1. Introduction
A central and astonishing feature of the nervous system is the capacity for learning and remembering, which are inherently dynamic processes. Advances in genetically-encoded sensors enable the real-time observation of key signaling molecules in a cell-type and circuit-specific manner within intact brain tissue and in vivo. Genetic strategies allow targeted expression of optogenetic tools [1,2] to a specific cell type (using specific promoters [3] or in transgenic animals expressing DNA recombinases in a specific cell type [4]) or an anatomically distinct circuit (using intersectional or retrograde viral labeling strategies [5,6]). Additionally, genetically-encoded probes are the only technique available to observe precisely the same cells longitudinally, permitting long-term monitoring of specific cellular processes, up to months [7,8]. Judiciously selecting suitable spectral properties of optical sensors potentially enables the visualization of the activity and interactions of distinct cell types [9]. Thus, genetically-encoded indicators are an indispensable tool for visualizing neuronal activity in a cell type and circuit-specific manner while minimizing disturbance to the complex cellular milieu of the brain. Advances in these sensors allow noninvasive and longitudinal monitoring of key neural processes, which is essential for understanding how information is transmitted and processed.
In this review, we describe advances from the past three years in the engineering and application of genetically-encoded fluorescence indicators of neuronal activity. We focus on indicators for calcium, voltage, and neurotransmitters that show acceptable performance for in vivo imaging. We also provide an overview of new sensors—which potentially enable fundamentally new kinds of measurements—and their molecular design, biochemical and spectral characteristics, and current limitations.
2. Calcium Indicators
Calcium is a crucial mediator of neural activity and activity-dependent synaptic plasticity [10,11]. While most neurons at rest contain cytoplasmic calcium concentrations of 50–100 nM, electrical activity can swiftly and dramatically increase calcium concentrations [12] for tens of milliseconds to several seconds [13,14]. Therefore, calcium is an excellent proxy for neuronal activity, and, accordingly, genetically-encoded calcium indicators (GECIs) are the most popular and widely used optical sensors of neuronal activity in neuroscience [8,11,15,16]. Since the development of the first proof of principle GECIs almost two decades ago [17,18,19,20], herculean efforts in protein engineering resulted in several excellent calcium sensors [21,22] providing researchers a selection of tools for diverse applications, including imaging large neural population dynamics [23,24], dendritic processing [25], as well as synaptic [26,27] and presynaptic [28] function. Here, we will discuss the major progress in engineering GECIs from the past few years and briefly describe some of their most distinctive applications. Prior work on the development and application of GECIs has been reviewed in earlier publications [8,11,15,16].
Since 2016, two types of molecular designs have prevailed among improved as well as newly developed GECIs (Figure 1a,b). The GECI families based on the GCaMP-like design are the most numerous and widely used GECIs for in vivo imaging [22] (Table 1). Calcium sensors with green fluorescence exhibit the best performance, especially the GCaMP6 variants [26] and, therefore, are the primary choice for most applications. Intensive use of the GCaMP variants in vivo resulted in a wealth of evidence for their interference with normal calcium dynamics and gene expression in mammalian systems that must be taken into account when interpreting calcium imaging data [29,30,31]. Typically, the side effects are due to the interaction of the calcium binding domain, which has a mammalian origin, with endogenous proteins, as well as the buffering of cytoplasmic calcium, artifacts more prominent during prolonged sensor expression at high levels [26,32]. To overcome these side effects, several different modifications of calcium binding domains have been attempted. For example, Yang et al. engineered GCaMP-X by incorporating an extra apoCaM-binding motif into the GCaMP variants [31]. This modification did not significantly affect overall sensor performance but reduced interactions with L-type calcium channels, thus effectively protecting CaV1-dependent excitation-transcription coupling from sensor-induced perturbations [31]. An alternative strategy to minimize GCaMP-induced side effects involve exploiting calcium binding domains cloned from fungi and yeasts that share conserved amino acid identity with their metazoan counterparts used in GCaMPs [33]. For example, the calmodulin and M13-like peptide from Aspergillus fungi swapped with the calcium-binding domain in GCaMP6s prevented interaction with endogenous proteins at low calcium concentrations in cultured mammalian cells [33]. In addition, fungal GCaMP, or FGCaMP, exhibits ratiometric by excitation fluorescence response to calcium ions, with the highest brightness and dynamic range combination among other ratiometric GECIs such as GEX-GECO [34], Pericam [19], and Y-GECO [35]. Furthermore, FGCaMP can report neuronal activity with single cell resolution in zebrafish larvae under light-sheet microscopy. Another way to improve the performance of GECIs is structure-guided mutagenesis of the GFP-CaM interface and the CaM-M13 peptide interactions [36]. For example, further mutagenesis of the calcium binding domain in the GCaMP6 variants resulted in the next generation green sensors, the jGCaMP7 series, characterized by improved sensitivity to one action potential and higher signal-to-noise ratio due to enhanced brightness [37]. However, the jGCaMP7 variants are still less validated in vivo compared to the extremely popular GCaMP6 indicators.
Very recently, Barykina et al. suggested an alternative design of GECIs, which implicates the insertion of a calcium-binding domain into a fluorescent protein (Figure 1b). Implementing this design resulted in the generation of a new family of GECIs, named after the progenitor NTnC [38], exhibiting a set of unique features (Table 1). In comparison to GECIs with the classical GCaMP design, the NTnC-like family is characterized by a smaller molecular size, lower calcium-binding capacity, higher tolerance to fusion partners, and a non-mammalian origin of calcium-binding domains. The smaller molecular size is beneficial for packaging efficiency into viral particles and perhaps ensures better folding and targeting to subcellular compartments, such as mitochondria and the endoplasmic reticulum [39]. The lower calcium-binding capacity of the NTnC family (two or one calcium ion per molecule vs four ions per molecule for GCaMP family) reduces the deleterious confound of calcium buffering, which can corrupt the patterns of registered neuronal activity [30]. However, in spite of the different stoichiometry of calcium binding sites in GCaMP and NTnC-like indicators, they linearly respond to the increasing number of action potentials in the range determined by affinity of the respective indicator to calcium ions [38,39]. Unlike the GCaMP-like GECIs, where different tags affect their dynamic range and affinity for calcium ions [40], the GFP-like N- and C-termini make the NTnC-like sensors tolerate fusions with other proteins by eliminating distortion of calcium-binding domain. Utilization of the truncated version of troponin C from muscles as a calcium-binding domain, which does not interact with endogenous proteins in mammalian cells, minimizes potential disturbances on neural physiology.
The original NTnC sensor was designed by inserting the troponin C calcium binding domain into the bright green fluorescent protein mNeonGreen [38]. In contrast to GCaMP-like sensors, NTnC exhibits negative fluorescence response, i.e., it reduces fluorescence upon calcium binding. NTnC is characterized by high brightness and pH stability, inherited from mNeonGreen, but low dynamic range (Table 1). Utilizing yellow fluorescent protein (YFP) as a sensing moiety helped to increase the dynamic range but at the expense of brightness and pH stability [39,41]. While NTnC and YTnC are suitable for reporting neuronal activity at single cell resolution in behaving mice under both one- and two-photon microscopy, they exhibit lower overall performance than the GCaMP6 variants. However, we found the NTnC-like sensors significantly outperform GCaMP6s when targeted to organelles such as the mitochondria and endoplasmic reticulum [39]. Calcium homeostasis in mitochondria and the endoplasmic reticulum plays crucial roles in cell physiology in health and disease [49,50,51,52]. However, currently available GECIs are not optimized for calcium visualization in these organelles. Therefore, the NTnC-like sensors represent promising templates for adjusting calcium affinity to match the range of calcium concentration in mitochondria and the endoplasmic reticulum. For example, truncation of the EF4-hand of the calcium-binding domain in YTnC2 indicator, which is capable of binding only one calcium ion, decreased affinity of the indicator to calcium ions by ~10-fold. The generated sensor, dYTnC2, showed optimal biochemical characteristics for measuring large calcium transients in the endoplasmic reticulum (personal communication, Table 1).
There is a great need for GECIs with red-shifted fluorescence, but engineering red-shifted variants has proven particularly challenging. Inserting calcium binding domains into red fluorescent proteins easily disrupts folding and chromophore maturation [43,53]. Furthermore, red fluorescent proteins are known to exhibit inferior photophysical properties compared to green fluorescent proteins such as photoactivation under blue light illumination, leading to imaging artifacts [54,55,56]. Despite great efforts in the development of red-shifted GECIs [34,42,54,56,57,58], only the latest generation of red GECIs is suitable for imaging calcium dynamics in living organisms [9,43]. However, further engineering and enhancement of the current red GECIs is certainly required before they can reach level of the best performing green sensors (Table 1). Brightness and dynamic range are perhaps the main properties requiring improvement. Another inherent drawback of red GECIs is their tendency to form bright fluorescence puncta in cell bodies, especially during in vivo expression. The puncta were shown to co-localize with a lysosomal marker LAMP-1. The aggregated proteins in the puncta do not show calcium sensitivity and contribute to background fluorescence, thus reducing the overall quality of the dynamic signal recordings. To reduce puncta formation, Shen et al. exploited the novel red fluorescent protein FusionRed, known to exhibit good localization in neurons [43]. Replacing the fluorescent moiety in R-GECO with a circularly permutated FusionRed generated the K-GECO indicator, which indeed demonstrated no puncta-like localization in cultured neurons [43]. However, puncta formation was not completely resolved in vivo in mice. K-GECO could report single action potentials in neurons in zebrafish larva as well as detect calcium dynamics in the visual cortex of awake mice. However, K-GECO1 did not provide the same level of in vivo sensitivity as the highly optimized jRGECO1a (Table 1).
Red-shifted GECIs enable facile application in conjugation with channelrhodopsins for all-optical interrogation of neuronal circuits [9,42,43,56]. Due to the wide action spectra of the majority of channelrhodopsins, compared with the full width at half maximum of GFP-like fluorescent proteins ranging from 30 to 70 nm, spectrally multiplexed optogenetic control with red GECIs excited at ~560 nm still remains challenging. Even one of the most blue-shifted channelrhodopsins, CheRiff [59], with acceptable in vivo performance [60], generates a sustained inward current under 560 nm illumination at moderate light power of ~15mW/mm2 that can cause substantial alternations in membrane potentials during extended imaging [61,62]. Shifting fluorescence of GECIs into the near-infrared range will provide completely crosstalk-free coupling with optogenetic tools. Near-infrared fluorescent proteins derived from phytochomes [63] have shown to be useful for labeling neurons in vivo in mammals [64], zebrafish [65], and flies [66]. Near-infrared light is also beneficial for the noninvasive whole-body imaging of small mammals [67,68] due to reduced autofluorescence, low light scattering, and minimal absorbance at longer wavelengths. Interestingly, the first attempts engineering calcium sensors based on the phytochrome-derived fluorescence proteins were unsuccessful. Obtaining functional circularly permutated variants was impossible due to the phytochrome’s topology, with the N- and C-termini far apart from each other, unlike in GFP-like proteins (personal communications). Instead, the first near-infrared GECIs were engineered by inserting the calcium binding domain into phytochrome-derived fluorescent proteins. In this respect, their design appears similar to that of the NTnC-like family (Figure 1b). The GAF-FP [69] and mIFP [66] proteins were used as fluorescent scaffolds producing GAF-CaMP [44] and NIR-GECO1 [45] indicators containing cGMP phosphodiesterase/adenylate cyclase/FhlA transcriptional activator (GAF) and Per-ARNT-Sim-GAF (PAS-GAF) domains from the phytochromes, respectively [63]. While GAF-CaMP has not been yet tested in neurons, NIR-GECO1 was shown to detect single action potentials in cultured neurons and intact mouse brain tissue. NIR-GECO1 is efficiently excited by far-red light in the range from 630 to 680 nm, enabling crosstalk free spectral multiplexing with the majority of channelrhodopsins and other fluorescence sensors. In addition, NIR-GECO1 allowed mesoscale fluorescence imaging of somatosensory cortex through the intact skin and skull of anaesthetized mice, although reliable detection of fluorescent changes required averaging of multiple trials. As a first-generation indicator, NIR-GECO1 falls short of the most extensively optimized fluorescent protein-based GECIs in several critical performance parameters but is an exciting progression in the development of far red-shifted calcium sensors.
An alternative method to record neuronal activity of a large number of neurons with single cell resolution is the permanent labeling of neurons, as demonstrated by the CaMPARI calcium sensor [70]. The CaMPARI family of light-inducible calcium sensors is based on EosFP green-to-red photoconvertable fluorescent protein, allowing ex vivo visualization of integrated over time calcium transients (Figure 1). The CaMPARI integrators are irreversibly and efficiently photoconverted from a green fluorescent state to a red state by ultraviolet light (~405 nm) irradiation only in the presence of elevated concentrations of calcium ions. The second generation of this family, CaMPARI2, is characterized by improved dynamic range of photoconversion, brightness, faster calcium dissociation kinetics, decreased photoconversion rate in inactive neurons, and compatibility with paraformaldehyde fixation [40]. In addition, the authors introduced the anti-CaMPARI-red antibody that specifically recognizes the photoconverted red form and thus allows immunohistochemical amplification of calcium signal in fixed cells or tissue. The CaMPARI2 indicator enables acquisitions of snapshots of calcium as a proxy for neuronal activity integrated during 30 seconds in the brain of zebrafish from up to 6000 individual neurons. In this respect CaMPARI integrators are comparable with CaMP and GECO indicators which allow simultaneous two-photon imaging of calcium activity over 10,000 cells in visual cortex of mice with 2.5 Hz rate [71]. In spite of great progress in the development of the CaMPARI sensors, they provide only a single snapshot of neuronal activity acquired during tens of seconds and require irradiation with highly phototoxic ultraviolet light, which also suffers from poor depth penetration in live tissue.
A significant step forward was made for improving the class of calcium sensors that employs bioluminescence resonance energy transfer (BRET) phenomenon [72]. The newly-developed BRET-based LUCI-GECO1 indicator combines the bright NanoLuc luciferase with emission maximum at 460 nm with the topological version of GCaMP6s indicator (ncpGCaMP6s; Figure 1b) [46]. In comparison to the previously developed BRET-based GECIs, LUCI-GECO1 was characterized by slightly wider dynamic range and higher brightness. Due to the lack of need for illumination for fluorescence excitation, LUCI-GECO1 enables straightforward multiplexing with optogenetic tools, such as channelrhodopsins. While BRET-based calcium sensors hold great promise for noninvasive imaging in mammals, their application in vivo has not yet been demonstrated.
3. Potassium Indicators
Sodium and potassium are important physiological ions crucial in maintaining and regulating membrane potentials in neurons. In neurons at rest, cytoplasmic sodium levels are an order of magnitude lower than extracellular (~10 mM intracellular vs ~150 mM extracellular) [73]. During an action potential, intracellular sodium levels transiently increase [74,75], and because sodium is the major current carrier of glutamate-gated voltage changes, noninvasive optical imaging of sodium would enable the visualization of a key correlate of excitatory synaptic transmission. Potassium is also a crucial regulator of cell excitability [76,77]. At rest, cytoplasmic potassium levels are high, but during an action potential, there is a potassium efflux, the change in the absolute number of ions is relatively modest [76,77]. Noninvasively recording potassium at single cell resolution would offer an important proxy to neural activity. Unfortunately, there are no genetically-encoded sodium sensors developed to date, and genetically-encoded potassium sensors are only an emerging class of optical probes. We note that an important part of the difficulty in engineering potassium and sodium sensors—compared to calcium sensors—is that while calcium concentrations during an action potential change by more than four orders of magnitude, changes in potassium and sodium concentrations during an action potential are only one order of magnitude. Thus, imaging potassium and sodium is inherently more difficult than imaging calcium transients owing to the more subtle changes in ion concentration.
Genetically-encoded potassium indicators (GEPI) are currently represented mainly by three Förster (fluorescence) resonance energy transfer (FRET)-based indicators (Figure 1c; Table 1). All three GEPIs share the same Kbp protein from E. coli as a potassium binding domain and utilize CFP/YFP fluorescent FRET-pairs to register conformational changes in the Kbp part [47,48]. Since GEPI dissociation kinetics from potassium ions is limited by hundred milliseconds, they are not appropriate for the detection of fast potassium dynamics during neuronal activity. Meanwhile, GEPIs were successfully applied to monitor slower potassium transients in different cellular compartments in cultured cells. Thus, further development of faster and non-FRET-based variants of GEPIs with higher dynamic range are in high demand.
4. Voltage Sensors
Voltage changes are the primary means of millisecond-scale computation in neurons because they enable sophisticated fast dendritic computations and rapid transmission of signals across long distances [78]. Voltage changes are the most direct measure of a neuron’s electrical potential [79]. Therefore, optical voltage sensors are an ideal method to noninvasively measure electrical activity at single cell resolution. However, despite recent progress in development of new voltage sensitive probes [60,65,80,81,82], voltage imaging still remains technically more challenging than calcium imaging. One of the major challenges is associated with the sub-millisecond timescale of membrane potential changes during neuronal activity. Subsequently, voltage imaging requires kHz acquisition rates to resolve brief voltage changes upon action potentials, while calcium imaging is typically performed at 1 to 10 Hz. Although currently available scientific-grade cameras can perform imaging at kHz rates, these high speed result in pixel counts reduced by an order of magnitude than those commonly used for calcium imaging. Furthermore, compared to the GECIs expressed in the bulk cytosol, the maximum number of voltage sensor molecules that can be localized on plasma membrane is several orders of magnitude smaller. These factors significantly reduce the number of photons integrated during each acquired frame making fluorescence signal increasingly difficult to distinguish cells from background fluorescence in brain tissue.
The first proof of principle of a fully genetically-encoded voltage sensor was reported in 1997 [83], followed by almost two decades of intensive protein engineering efforts to develop a fluorescence sensor capable of reporting neuronal activity with single cell, single spike resolution in awake mice [84]. To date a number of improved and newly engineered genetically-encoded voltage indicators (GEVIs) with diverse spectral and biophysical characteristics reached the level of performance sufficient for in vivo imaging with high temporal precision at single-cell resolution in awake mice surpassing beyond “proof of principle” applications (Table 2). Currently, the majority of developed GEVIs are based on two types of voltage-sensitive moieties: microbial rhodopsins and voltage-sensing domains (VSDs) from voltage-sensitive phosphatases. Naturally-occurring and engineered microbial rhodopsins have already found widespread application in neuroscience due to their ability to optically control electrical activity of genetically targeted neurons [85]. Photoactivated rhodopsin translocates ions across the plasma membrane thus modulating membrane potentials, usually in a predictable manner [86,87,88]. Several years ago, Adam Cohen’s group made a discovery that paved the way for the utilization of opsins not only for manipulating membrane potential but also for observing changes in voltage across the plasma membrane. His group showed that one class of opsins, light-driven proton pumps, can work in reverse, i.e., emitting light in response to membrane voltage alternations [89,90]. Indeed, spectroscopic studies of the proton pumping mechanism in rhodopsins, cloned from archaea and bacteria, revealed a complex spectroscopic photocycle involving multiple intermediates with diverse absorption spectra [89,90,91]. Certain transitions between intermediates appeared to be voltage dependent while occurring at submillisecond time scales [92]. Furthermore, a single point mutation in the chromophore vicinity of proton pumps was enough to almost completely abolish light-driven currents while retaining their voltage dependent spectral changes. Altogether, these features confer optical recording of membrane potential dynamics at biologically-relevant temporal resolution via probing opsin absorption spectrum. Voltage modulated spectral changes, or the so called electrochromic effect, can be read-out via nonradiative quenching of an attached fluorescent moiety, a form of FRET [93,94]. Using electrochromic FRET (eFRET) approach, a palette of GEVIs with fluorescence ranging from green to red were engineered by appending various fluorescent proteins to the C-terminus of the proton pumping microbial opsins [80,84,95,96] (Figure 2a). The first generation of eFRET-opsin voltage sensors, incorporating Mac and Arch proton pumps [97] as voltage-sensing scaffolds, can report single action potentials in cultured neurons with a moderate signal-to-noise ratio (7–9 at 1 kHz acquisition rate) [95,96]. However, these sensors suffer from poor membrane localization and relatively slow kinetics, on the order of few milliseconds, that precluded their adaptation by the neuroscience community. Substantial improvement in overall performance was achieved by utilizing the blue-shifted Acetabularia acetabulum rhodopopsin (Ace) [98] in fusion with the very bright green fluorescent protein mNeonGreen. The resulting group of GEVIs, usually collectively called Ace2N-mNeon (2N stands for the point mutation abolishing proton pumping), is characterized by high brightness, moderate photostability, and submillisecond kinetics, providing high spike detection fidelity under wide-field microscopy in both ex vivo and in vivo preparations [84]. For example, the Ace2N-4aa-mNeon variant, containing four amino acids in the linker between Ace and mNeonGreen, was demonstrated to report single action potentials in individual neurons in the primary visual cortex of awake mice (Table 1). In turn, a variant with a shorter linker, Ace2N-2aa-mNeon, was able to detect odor-evoked voltage signals in single olfactory projection neurons and their dendritic arbors and axonal boutons in live fruit flies.
Coupling Ace2N with the bright fluorescent protein mRuby3 led to the development of a red-shifted GEVI named VARNAM [80], which inherited the fast kinetics of Ace2N and high brightness and photostability of mRuby3. However, despite a single point mutation that presumably improved eFRET efficiency by red-shifting absorbance spectrum of Ace2N, VARNAM exhibits lower voltage sensitivity than other advanced GENIs suitable for in vivo imaging (Table 1). For example, averaging up to 10 optical trails was required to resolve evoked excitatory and inhibitory postsynaptic potentials using VARNAM in intact brain tissue [80]. In live mice, VARNAM was able to track cell-type specific oscillatory dynamics for subsets of neurons in somatosensory and frontal cortex and CA1 of the hippocampus using the fiberoptic imaging. In addition, VARNAM reported spontaneous neuronal activity with single spike precision in multiple cell types in live fruit flies.
Another recently developed fluorescent voltage sensor utilizing Ace2N as a voltage sensing domain is Voltron [82]. While Voltron is not a fully genetically-encoded probe, but rather a chemogenetic or hybrid voltage sensor, we discuss it here in comparison with other GEVIs due to its high performance in multiple species in vivo, including mice, zebrafish, and fruit flies. Voltron combines Ace2N with a self-labeling protein tag domain that covalently binds improved rhodamine dyes such as the Janelia Fluor® (JF) dyes [100] (Figure 2b). While a palette of JF dyes with emission maxima ranging from 505 to 635 nm were shown to work well with Voltron in cultured neurons, the Voltron/JF525 combination exhibited the highest voltage sensitivity and, thus, used for all further in vivo applications. To perform voltage imaging in vivo in mice, Voltron was fused to the soma-localization motif from the Kv2.1 potassium channel [101] to reduce neuropil fluorescence contamination thus improving single cell resolution, similarly to the strategy previously used to enable single-cell precision optogenetics [102,103]. Using a simple wide-field imaging set-up, soma-localized Voltron reported single action potentials in hippocampal parvalbumin neurons and visual cortex pyramidal neurons in awake mice. Particularly impressive was the ability to perform single spike detection in up to 46 GABAergic neurons in visual cortex layer I imaged simultaneously for over 15 minutes (Table 2). Voltron also retained its high performance in live zebrafish and fruit flies, reliably reporting single action potentials. Voltron relies on bright synthetic dyes delivered exogenously. While dye administration is straightforward, even for mice, easily passing through the blood brain barrier, quick internalization and accumulation of the JF dyes in the cytoplasm of the cells create high background fluorescence, significantly reducing imaging quality. Development of new dyes that fluoresce only upon binding to the HaloTag will significantly improve Voltron class of GEVIs.
Among all tested light-driven proton pumps, Arch uniquely possesses dim near-infrared fluorescence under strong red laser excitation [90]. Furthermore, Arch fluorescence intensifies as membrane potential increases. The mechanism of this voltage sensitive fluorescence is still poorly studied, but might involve chromophore protonation [92]. Hochbaum et al. subjected Arch to directed molecular evolution to improve its brightness and voltage sensitivity [59]. The result, dubbed QuasAr2, is capable of reporting single action potentials with high temporal resolution in intact brain tissue and even in mouse nodose ganglia in vivo [99] (Table 2). Near-infrared fluorescence and high voltage sensitivity of QuasAr2 enabled the recording of optogenetically-triggered synaptic inputs in single trials to probe synaptic strength in intact brain tissue [27]. However, due to its extremely low brightness, requiring up to three orders of magnitude higher light intensity than for GFP imaging, QuasAr2 did not become a widely used tool. Subsequent enhancement of QuasAr2 brightness generated several variants with distinct biochemical and photophysical characteristics (Figure 2c). For example, Adam Cohen’s group developed a blue light activated version of QuasAr, named NovArch [104] and paQuasAr3 [60]. Near-infrared fluorescence of NovArch and paQuasAr3 can be reversibly enhanced by blue illumination without affecting voltage sensitivity (Table 2). This blue light enhanced brightness of paQuasAr3 is sufficient to perform population voltage imaging with single cell resolution in hippocampal cells of awake mice. At the same time, it complicates combining voltage imaging with optogenetic control by channelrhodopsins. In another study, significant improvement of near-infrared brightness was achieved by implementation of a robotic multidimensional directed evolution approach [65]. Large libraries, up to tens of millions of independent clones, expressed in mammalian cells were screened for improved brightness and localization using robotic cell picker. Selected variant Archon1 exhibited several fold higher fluorescence and nearly ideal membrane localization in neurons when expressed in vivo in mice, zebrafish, and worms. The soma-localized version of Archon1 enabled population voltage imaging in striatum, cortex, and hippocampus of behaving mice under a cheap and simple wide-field imaging set up (personal communication). In addition, Archon1 was the first reported GEVI to report single action potentials in zebrafish larvae. Despite several generations of improved Arch-derived voltage sensors, the sensors still suffer from very low fluorescence brightness in comparison to other classes of GEVIs.
In the past few years the field of GEVIs was strongly dominated by opsin-based sensors, however, opsin-based sensors all share one disappointing limitation: they do not exhibit voltage sensitivity under two-photon excitation. Although fundamentally and technically more challenging than wide-field imaging, two-photon microscopy offers increased imaging depth with higher spatial resolution in scattering tissue. For example, two-photon microscopy has been used for subcellular voltage imaging in live fruit flies using GEVIs [105,106,107] as well as dendritic [108] and somatic [109] voltage using chemical dyes. The development of the improved version of the ASAP sensor [110], named ASAP3, enabled two-photon voltage imaging in awake mice using a fully genetically-encoded probe [81]. The ASAP family of GEVIs is based on the insertion of a circularly permuted EGFP into the voltage-sensing domain from Gallus gallus of voltage-sensitive phosphatases between the third and fourth transmembrane domains (Figure 2d). ASAP3 development involved random mutagenesis of the linkers between circularly permuted EGFP and voltage-sensing domain to optimize coupling of four transmembrane helix movement during depolarization to chromophore protonation. Using the soma-localized version of ASAP3, Chavarha et al. performed reliable voltage imaging with single cell single spike resolution in visual cortex at a depth up to ~130 µm. Improved performance of ASAP3 compared to its precursors can be partially attributed to its kinetics. ASAP3 has a submillisecond on rate, but several-fold slower off kinetics, unlike opsin-based sensors (Table 2). This combination of kinetic parameters results in significant boarding of optical action potential waveforms thus increasing the effective number of photons emitted during spikes. However, fast two-photon imaging is still limited to a small imaging area and recording of more than one cell at a time still represent significant technical challenge. Additionally, wide-field imaging of opsin-based sensor is more cost efficient.
5. Neurotransmitter Indicators
Neurons communicate with one another using chemical messengers called neurotransmitters. Neurotransmitters are released by a pre-synaptic cell via vesicle-mediated exocytosis into the synaptic cleft [111], where they reach concentrations in the high micromolar range [112]. Here, neurotransmitters bind to receptors on the post-synaptic cell, initiating second messenger signaling cascades (via metabotropic receptors) or evoking ion flux (via ionotropic receptors) [113], and are subsequently cleared on the millisecond time scale from the post-synaptic cleft by neurotransmitter transporters [114]. In addition to classical neurotransmitters, including glutamate [115], gamma-aminobutyric acid (GABA) [116], and other biogenic amines [117], neurons also signal using non-classical neurotransmitters, such as peptides [118], endocannabinoids [119], and even gases [120]. Recent advance in protein engineering have yielded a number of fully genetically-encoded fluorescent sensors enabling real time optical detection of a few key neurotransmitters with high specificity and sensitivity within the intact brains of several model organisms.
All genetically-encoded neurotransmitter indicators (GENIs) utilize two types of ligand-binding proteins as sensing moieties, either periplasmic-binding proteins (PBP) or G protein-coupled receptors (GPCRs; Figure 3). PBPs are bacterial non-enzymatic receptors with specificity for a wide variety of small molecule ligands, including neurotransmitters. Upon ligand binding, PBPs undergo significant conformational changes [121] sufficient to modulate fluorescence of covalently bound optical probes thus providing versatile scaffolds for fluorescence biosensor engineering [122,123,124]. To date, PBPs have been used to develop three different classes of genetically-encoded neurotransmitter indicators (GENIs) specialized for the optical detection of glutamate, GABA, and glycine. The first GENIs, FLIPE and superGluSnFR, capable of reporting transients of the chief excitatory neurotransmitter glutamate in cultured neurons, were engineered by fusing the glutamate PBP GltI from Escherichia coli (also known as ybeJ) with a FRET pair of cyan fluorescent protein (CFP) and yellow fluorescent protein (YFP) [125,126]. However, a relatively low signal-to-noise ratio, an inherent drawback for most of FRET-based sensors, significantly limited applications of FLIPE and superGluSnFR in vivo. A breakthrough in imaging glutamate transients in vivo was achieved with the development of a single FP-based sensor, iGluSnFR [127], boasting a positive intensiometric fluorescence response (Table 3). iGluSnFR was constructed by insertion of a circularly permuted (cp) EGFP into the interdomain hinge region of GltI with further optimization of linkers between cpEGFP and GltI to improve the fluorescence dynamic range (Figure 3a). For expression in neurons, iGluSnFR is targeted to the extracellular side of the plasma membrane by fusion with a PDGFR peptide segment, similar to the first generation of glutamate sensors [125,126]. Two-photon microscopy of iGluSnFR allowed single trial recordings of glutamate transients at single dendritic spines as well as dendritic branches in the primary motor cortex of awake behaving mice [127]. In addition, iGluSnFR reliably reported synaptic activity in vivo in zebrafish and the nematode Caenorhabditis elegans [127]. However, due to its slow off rate, with a reported decay half-time of 92 ms, iGluSnFR failed to resolve fast transients associated with local glutamate release during external electrical stimulations of neurons higher than 10 Hz [128,129], highlighting a clear need for a glutamate sensor with improved biophysical characteristics.
Further optimization of iGluSnFR by rational design resulted in variants with improved brightness, kinetics, and altered glutamate affinity. The substitution of cpEGFP with a circularly permutated version of superfolder GFP (cpsfGFP) significantly enhanced brightness and photostability giving rise to a new series of the SF-iGluSnFR glutamate sensors [130] (SF stands for superfolder GFP used as reporting moiety; Figure 3a). Subsequent mutagenesis of the GltI domain in SF-iGluSnFR generated two variants, named SF-iGluSnFR-A184S and SF-iGluSnFR-S72A, which exhibit higher affinity and faster kinetics, respectively, compared to the original iGluSnFR [130] (Table 3). The SF-iGluSnFR-A184S variant significantly outperformed iGluSnFR in detecting stimulus-evoked glutamate release at individual dendritic spines imaged in neuropils of the visual cortex under two-photon excitation. In turn, the faster off rate of SF-iGluSnFR-S72A enabled almost an order of magnitude higher temporal resolution than was previously achievable with original iGluSnFR. For example, SF-iGluSnFR-S72A fluorescence was able to resolve synaptic responses in brain tissue during single action potentials evoked at frequencies up to 100 Hz. Even higher temporal resolution was achieved by the iGluSnFR-S72T point mutant, named iGluu (u stands for “ultrafast”) [129], which was able to resolve responses at single synapses in hippocampal slices during single action potentials evoked even at frequencies of 100 Hz. However, it showed about 1.5-fold lower sensitivity than SF-iGluSnFR-S72A under similar imaging conditions (Table 3). Overall, the kinetics and sensitivity of SF-iGluSnFRs and iGluu make them superior to the fastest green calcium sensor GCaMP6f in terms of monitoring presynaptic activity, as was demonstrated for granule cell axons within mouse cerebellar brain slices.
Mutagenesis of the fluorescence moiety of iGluSnFRs enabled diversification of the spectral properties of the glutamate sensor, highlighting the versatility of its molecular design. Introduction of point mutations in the chromophore forming tripeptide led to SF-iGluSnFR variants with blue (emission peak ~450 nm), cyan (emission peak ~475 nm), and yellow (emission peak ~530 nm) fluorescence [130]. On the other hand, substitution of cpEGFP with cpmApple from the R-GECO1 calcium sensor resulted in the R-iGluSnFR glutamate sensor with red emission peaked at ~590 nm [131]. Despite subsequent intense optimization by random mutagenesis resulting in an additional 12 amino acid mutations throughout the protein, performance of R-iGluSnFR is far inferior to that of green glutamate sensors, with a dynamic range of only -33% compared to 250% for SF-iGluSnFR-S72A, thus precluding its in vivo application. Among chromatic variants of iGluSnFR, only the sensor with yellow emission, SF-Venus-iGluSnFR, was utilized for in vivo imaging in mouse visual cortex. The major advantage of SF-Venus-iGluSnFR over green fluorescence sensors for glutamate is its high brightness under two-photon excitation at 1,030 nm, compatible with powerful femtosecond fiber lasers, which are gaining popularity in the neuroscience community due to their affordability and usability. Currently, fluorescent sensors for glutamate represent the most diverse group of GENIs, however, the most practical variants are still limited to green fluorescence.
The versatility of the PBP-based sensor design was also demonstrated by the development of green fluorescent sensors for the chief inhibitory neurotransmitter GABA, called an intensity-based GABA Sensing Fluorescence Reporter or iGABASnFR [132] (Figure 3a). Marvin et al. used the newly identified PBP Pf622 cloned from Pseudomonas fluorescens [139] as a GABA-binding domain. The initial version of the sensor, created by insertion of cpsfGFP into the Pf622 domain, was further optimized by side-directed mutagenesis to increase affinity and sensitivity (Table 3). The iGABASnFR was shown to report GABA release events over large volume of brain tissue in vivo in mouse visual cortex and in zebrafish cerebellum with sub-second kinetics, although with rather low fluorescence changes at just 10%. While iGABASnFR is a solely available fully genetically-encoded sensor for GABA, it will most likely require further optimization to enhance affinity, kinetics, and sensitivity before it can be widely adopted by the neuroscience community.
Development of the PBP-based sensor for Gly appeared to be more challenging. The wild-type PBP Atu2422 from Agrobacterium tumefaciens, selected as a binding domain for glycine sensor development, also displays promiscuous binding for L-serine and GABA [140]. To increase specificity of Atu2422, Zhang et al. employed computationally-guided mutagenesis. Introducing steric obstructions into the ligand-binding site of Atu2422 produced a binding domain highly selective for glycine. Fusing the engineered binding domain with CFP-YFP FRET pair, but not with cpEGFP as in iGluSnFR, resulted in the functional glycine sensor, denoted GlyFS, characterized by ~28% of fluorescence dynamic range (Table 3). Membrane targeting of GlyFS via a PDGFR peptide fusion, as used for the iGluSnFR and iGABASnFR sensors, reduced dynamic range to 4%, which is 7-fold lower than that in vitro, due to inefficient membrane trafficking of the protein. Instead, extracellular space immobilization was performed through a biotinylation-based technique that anchors proteins to the outer side of the plasma membrane (Figure 3b). Taking advantage of the GlyFS ratiometric response, the authors performed measurements of the absolute concentration of Gly in brain slices revealing dependency of Gly concentration on animal age. The suggested immobilization technique requires biotinylation of cell surface in intact brain tissue with subsequent delivery of the GlyFS sensor and streptavidin [141]. While the biotinylation-based technique was demonstrated to be compatible with tumor imaging in live mice [142], it might not be feasible for neuroimaging in vivo thus limiting GlyFS application to in vitro and ex vivo preparations. The GlyFS engineering is an inspiring example showing that PBPs are flexible templates for generating diversity of binding domains. Nevertheless, GlyFS still requires further development to increase its usefulness and applicability for neuroscience research.
The second class of ligand-binding domains utilized for GENI engineering is represented by GPCRs. GPCRs share a highly conservative 3D structure comprising of seven α-helix transmembrane domains (TM) and constitute the majority of receptors with high specificity for endogenous neurotransmitters. Structural studies indicate that the largest conformation changes upon ligand binding to GPCRs by occurs at the cytosolic end of TM6. The α-helix of TM6 can undergo more than 6 Å shift outwards from the helix bundle center at the same time initiating the 2–3 Å shift of TM5 [143,144]. For this reason, the third intracellular loop, located between TM5 and TM6, is a primary target for insertion of reporting moieties to engineer GENIs. Indeed, first generation of GPCR-based sensors was constructed by insertion of FRET donors and acceptors into the third intracellular loop and at the shortened C terminal domain [145,146,147,148]. The FRET-based sensors exhibited good specificity and affinity to agonists as well as adequate kinetics, however, their utility for in vivo imaging is limited due to the relatively modest ~10%, changes in FRET signal. Very recently, an alternative design of GENIs was suggested to overcome this limitation. Incorporation of the conformationally sensitive cpEGFP into the third intracellular loop enabled over an order of magnitude larger fluorescence changes during GPCR activation than for the FRET-based sensors while preserving high specificity and reasonable kinetics of fluorescence response (Figure 3c). Typically, this engineering strategy involves three consecutive steps: (i) optimization of the insertion site within third intracellular loop of GPCR; (ii) optimization of the linkers between cpEGFP and GPCR; (iii) tuning ligand affinity by point mutations within the ligand-binding pocket. Moreover, the bulky cpEGFP moiety introduced into the intracellular loop almost completely demolish coupling with major GPCR downstream pathways, presumably due to the steric hindrance imposed for G protein or arrestin interaction with the GPCR [149,150]. As a result, this design strategy was successfully exploited to develop a series of GPCR-based sensors suitable for in vivo imaging of dopamine (DA), acetylcholine (ACh), and norepinephrine (NE), also called noradrenaline (NA), in multiple model organisms. In addition, as a proof of concept a class of sensors for other neuromodulators and neuropeptides were engineered using Gs-coupled β1 and β2 adrenergic receptors, Gi-coupled κ and µ-type opioid receptors, and Gq-coupled serotonin receptor-2A and melatonin type-2 receptor [134].
Two groups in parallel independently developed green fluorescence DA sensors with similar biochemical characteristics (Table 3). Patriarchi et al. reported a series of DA sensors, called dLight, developed based on the human Dopamine Receptor D1 (DRD1) [134]. Two variants in this series, dLight1.1 and dLight1.2, showed optimal combination of apparent DA affinity and sensitivity and were used for in vivo imaging in behaving mice (Table 3). The higher affinity dLight1.1 sensor enabled visualization of spontaneous and optogenetically evoked dopamine transients in the nucleus accumbens by recording aggregated fluorescence signal from multiple cells using fiber photometry. Under these imaging conditions, dLight1.1 could report both activation and inhibition of dopamine transients resolving individual spikes at up to 5 Hz stimulation frequency. Higher spatial resolution of dopamine imaging was achieved under two-photon microscopy of dLight1.2 expressed in layer 2/3 neurons of the cortex during a visuomotor learning task. Two-photon imaging with micron-resolution revealed a dopamine transient map with functionally heterogeneous dopamine signals in the cortex. In contrast, utilizing Dopamine Receptor D2 (DRD2) as a sensing moiety, Sun et al. developed a pair of alternative dopamine sensors, named genetically-encoded GPCR-activation-based-DA sensors (GRABDA) [135]. Overall, in comparison to the dLight sensors, two selected variants, GRABDA1m and GRABDA1m, are characterized by several fold smaller dynamic range and slower kinetics but higher apparent affinity to DA (Table 3). Similar to the dLight sensors, the signal-to-noise ratio and temporal resolution of GRABDA were sufficient to record the dynamic bi-directional changes during DA activation and inhibition in dorsal striatum and nucleus accumbens in behaving mice using fiber photometry. In particular, imaging GRABDA in nucleus accumbens revealed a time-locked DA elevation aligned to various sexual behaviors, confirming an important role of DA in behavioral motivation, anticipation, or arousal. In addition, the GRABDA sensors were shown to readily respond to visually induced DA release in the intact brain of the zebrafish larvae as well as reveal compartmentalized DA dynamics in the mushroom body of fruit flies with single neuron resolution. In summary, two groups of the currently available DA sensors demonstrated comparable performance in vivo and selection of a particular variant have to be determined based on the exact intended application.
Similar design approaches enabled the development a pair of NE sensors with altered ligand affinity based on the α-adrenergic receptor (α2AR) [137]. Two NE sensors, named GRABNE1m and GRABNE1h, are characterized by micromolar and nanomolar apparent affinity for NE, respectively, and exhibit several fold increase in fluorescence upon NE binding when measured in cultured cells (Table 3). Due to its slightly higher dynamic range, GRABNE1m is the preferred variant for in vivo imaging. For example, GRABNE1m allowed reliable detection of NE release in locus coeruleus and hypothalamus in freely moving mice using fiber photometry. In addition, confocal imaging of GRABNE1m-expressing neurites in the optic tectum of zebrafish revealed a time-locked increase in green fluorescence during looming stimuli.
Utilizing the human muscarinic acetylcholine receptor 3 as a sensing moiety enabled development of green fluorescence sensor for ACh, named GACh2.0 [136]. While GACh2.0 exhibited similar dynamic range to that of the GRABDA sensors and adequate affinity in cultured cells (Table 3), its in vivo performance was not sufficient for single-trial imaging of the ACh transients when tested under two-photon microscopy in visual cortex in mice. Nevertheless, in intact brain tissue GACh2.0 showed ~5% fluorescence changes in a single trial in medial entorhinal cortex during multiple pulses of electrical stimulation, though single pulse stimulation still could not be detected. The poor in vivo performance of GACh2.0 can be attributed to severe sensor mislocalization when expressed in brain tissue; further improvement will certainly require optimization of membrane trafficking in vivo. Furthermore, GACh2.0 activation exhibited downstream coupling to Gq-dependent calcium signaling. While the coupling was about seven-fold smaller compared to wild-type M3R, it still was much higher than for other analogous GPCR-based neurotransmitter sensors. Therefore, the Sindbis viral expression system, which permitted a more rapid (~18 h) and robust expression, was used for the GACh2.0 expression in brain slices and in vivo, while other GPCR-based GENIs were shown to be performing well with the widely used adeno associated virus (AAV) gene delivery.
Activation of the native downstream-coupled pathways by GPCR-based GENIs is usually an undesired drawback due to potential artifacts. However, it is possible to engineer GPCR-coupled downstream pathways for optical signal activation, for example, by inducing the expression of a reporter gene [151,152,153]. One such fully genetically-encoded system is the Tango assay. The Tango system couples a transcription factor to a GPCR receptor via a specific tobacco etch virus (TEV) protease–sensitive cleavage site. The GPCR activation recruits TEV protease fused to β-arrestin, which releases tethered transcription factor (tTA) by cleavage TEV site, initiating expression of a reporter gene [152]. Signal amplification via gene expression enables single-cell resolution detection of neurotransmitter release with nanomolar sensitivity. Recent modification of the Tango system, named DRD2-iTango2, enabled its application for in vivo detection of DA release in the mouse nucleus accumbens during locomotion. DA release was read out by GFP expression activated via dopamine receptor 2. As a main difference to the first generation Tango systems, iTango2 incorporated improved light-inducible dimer [154] (iLID; Figure 3d). This modification prevented access by TEV protease in the dark state thus significantly improving signal-to-noise ratio and reducing background fluorescence, thus overcoming the main caveats of the original Tango system. As a result, iTango2 represents three-component fully genetically-encoded system with highly modular design (Figure 3d), that can be easily adopted to the end user needs. For example, the iTango2 system was demonstrated to work well in cultured cells with various GPCRs, such as neuropeptide Y receptor type 1, cannabinoid receptor type 1, and serotonin receptor 1A. At the same time, iTango2 can be designed to conditionally express any gene of interest. For instance, using a light-driven chloride pump as a downstream expressing gene it was possible to gain optogenetic control over the behavioral relevance of a temporally and genetically identified population of neurons. In comparison to the most of the GENIs described above, the iTango2 system enables read out with single cell resolution, rather than recording aggregated signal from multiple cells expressing sensor (Table 3). However, higher spatial resolution comes at the cost of significantly reduced temporal resolution, on the order of tens of minutes, as well as the inability to record inhibition of neurotransmitter release. In addition, DRD2-iTango requires efficient co-expression of three genes packed into the separate AAVs that may impose optimization of multiple AAV co-expression for different cells types and brain regions.
6. Conclusions
Genetically-encoded sensors are indispensable tools for neuroscientists because they enable the study of neural population dynamics, circuit organization, and the activity patterns of specific cell types and even distinct organelles. We predict sensors for key signaling molecules will continue to improve in terms of brightness, kinetics, localization, toxicity, and red-shifted variants, expanding the toolbox for neuroscientists in important and exciting ways. For example, expanded genome databases [155,156] and directed evolution strategies [157,158] expand the resources available to protein engineers to identify and optimize ligand binding domains.
The development of new imaging modalities, such as prisms to image across midline fissures [159,160] and gradient index (GRIN) lenses to image deep brain structures [161,162], are beginning to afford optical access to historically inaccessible brain regions, and, in combination with the development of new sensors, facilitate more vigorous interrogation of brain function. Optical indicators are also amenable to methods aimed at manipulating brain activity, such as optogenetic and chemogenetic actuators, permitting the simultaneous observation and manipulation of neural activity. Parallel advances in complementary technologies, such as brain clearing and tissue expansion [163,164], further broaden the power and applicability of sensors to map distinct circuits [165]. Future studies monitoring neural activity in vivo will continue to benefit from efforts to improve genetically-encoded fluorescent sensors.
Author Contributions
Conceptualization, K.D.P.; writing—original draft preparation, K.D.P., F.V.S.; writing—review and editing, K.D.P., M.H.M.; visualization, K.D.P., F.V.S.; supervision, K.D.P.; funding acquisition, F.V.S.
Funding
This research was funded by Russian Science Foundation grant No. 16-15-10323 and Russian Foundation for Basic Research No. 19-04-00395.
Conflicts of Interest
The authors declare no conflict of interest.
References
- Deisseroth, K.; Feng, G.; Majewska, A.K.; Miesenbock, G.; Ting, A.; Schnitzer, M.J. Next-Generation Optical Technologies for Illuminating Genetically Targeted Brain Circuits. J. Neurosci. 2006, 26, 10380–10386. [Google Scholar] [CrossRef] [PubMed]
- Knopfel, T.; Lin, M.Z.; Levskaya, A.; Tian, L.; Lin, J.Y.; Boyden, E.S. Toward the Second Generation of Optogenetic Tools. J. Neurosci. 2010, 30, 14998–15004. [Google Scholar] [CrossRef] [PubMed]
- Kügler, S.; Kilic, E.; Bähr, M. Human synapsin 1 gene promoter confers highly neuron-specific long-term transgene expression from an adenoviral vector in the adult rat brain depending on the transduced area. Gene Ther. 2003, 10, 337–347. [Google Scholar] [CrossRef] [PubMed]
- Sauer, B. Inducible gene targeting in mice using the Cre/lox system. Methods 1998, 14, 381–392. [Google Scholar] [CrossRef] [PubMed]
- Madisen, L.; Garner, A.R.; Shimaoka, D.; Chuong, A.S.; Klapoetke, N.C.; Li, L.; Van der Bourg, A.; Niino, Y.; Egolf, L.; Monetti, C. Transgenic mice for intersectional targeting of neural sensors and effectors with high specificity and performance. Neuron 2015, 85, 942–958. [Google Scholar] [CrossRef] [PubMed]
- Daigle, T.L.; Madisen, L.; Hage, T.A.; Valley, M.T.; Knoblich, U.; Larsen, R.S.; Takeno, M.M.; Huang, L.; Gu, H.; Larsen, R. A Suite of Transgenic Driver and Reporter Mouse Lines with Enhanced Brain-Cell-Type Targeting and Functionality. Cell 2018, 174, 465–480. [Google Scholar] [CrossRef]
- Margolis, D.J.; Lütcke, H.; Schulz, K.; Haiss, F.; Weber, B.; Kügler, S.; Hasan, M.T.; Helmchen, F. Reorganization of cortical population activity imaged throughout long-term sensory deprivation. Nat. Neurosci. 2012, 15, 1539–1546. [Google Scholar] [CrossRef]
- Huber, D.; Gutnisky, D.A.; Peron, S.; O’Connor, D.H.; Wiegert, J.S.; Tian, L.; Oertner, T.G.; Looger, L.L.; Svoboda, K. Multiple dynamic representations in the motor cortex during sensorimotor learning. Nature 2012, 484, 473–478. [Google Scholar] [CrossRef]
- Dana, H.; Mohar, B.; Sun, Y.; Narayan, S.; Gordus, A.; Hasseman, J.P.; Tsegaye, G.; Holt, G.T.; Hu, A.; Walpita, D. Sensitive red protein calcium indicators for imaging neural activity. Elife 2016, 5, 1–24. [Google Scholar] [CrossRef]
- Zucker, R.S. Calcium- and activity-dependent synaptic plasticity. Curr. Opin. Neurobiol. 1999, 9, 305–313. [Google Scholar] [CrossRef]
- Grienberger, C.; Konnerth, A. Imaging Calcium in Neurons. Neuron 2012, 73, 862–885. [Google Scholar] [CrossRef] [PubMed]
- Berridge, M.J.; Lipp, P.; Bootman, M.D. The versatility and universality of calcium signalling. Nat. Rev. Mol. Cell Biol. 2000, 1, 11–21. [Google Scholar] [CrossRef]
- Helmchen, F.; Borst, J.G.; Sakmann, B. Calcium dynamics associated with a single action potential in a CNS presynaptic terminal. Biophys. J. 1997, 72, 1458–1471. [Google Scholar] [CrossRef]
- Koester, H.J.; Sakmann, B. Calcium dynamics associated with action potentials in single nerve terminals of pyramidal cells in layer 2/3 of the young rat neocortex. J. Physiol. 2000, 529, 625–646. [Google Scholar] [CrossRef] [PubMed]
- Broussard, G.J.; Liang, R.; Tian, L. Monitoring activity in neural circuits with genetically encoded indicators. Front. Mol. Neurosci. 2014, 7, 97. [Google Scholar] [CrossRef] [PubMed]
- Lin, M.Z.; Schnitzer, M.J. Genetically encoded indicators of neuronal activity. Nat. Neurosci. 2016, 19, 1142–1153. [Google Scholar] [CrossRef] [PubMed]
- Miyawaki, A.; Llopis, J.; Heim, R.; Michael McCaffery, J.; Adams, J.A.; Ikura, M.; Tsien, R.Y. Fluorescent indicators for Ca2+ based on green fluorescent proteins and calmodulin. Nature 1997. [Google Scholar] [CrossRef]
- Baird, G.S.; Zacharias, D.A.; Tsien, R.Y. Circular permutation and receptor insertion within green fluorescent proteins. Proc. Natl. Acad. Sci. USA 1999. [Google Scholar] [CrossRef]
- Nagai, T.; Sawano, A.; Park, E.S.; Miyawaki, A. Circularly permuted green fluorescent proteins engineered to sense Ca2+. Proc. Natl. Acad. Sci. USA 2001. [Google Scholar] [CrossRef]
- Nakai, J.; Ohkura, M.; Imoto, K. A high signal-to-noise Ca2+ probe composed of a single green fluorescent protein. Nat. Biotechnol. 2001. [Google Scholar] [CrossRef]
- Pérez Koldenkova, V.; Nagai, T. Genetically encoded Ca2+ indicators: Properties and evaluation. Biochim. Biophys. Acta Mol. Cell Res. 2013, 1833, 1787–1797. [Google Scholar] [CrossRef] [PubMed]
- Greenwald, E.C.; Mehta, S.; Zhang, J. Genetically Encoded Fluorescent Biosensors Illuminate the Spatiotemporal Regulation of Signaling Networks. Chem. Rev. 2018, 118, 11707–11794. [Google Scholar] [CrossRef] [PubMed]
- Ziv, Y.; Burns, L.D.; Cocker, E.D.; Hamel, E.O.; Ghosh, K.K.; Kitch, L.J.; El Gamal, A.; Schnitzer, M.J. Long-term dynamics of CA1 hippocampal place codes. Nat. Neurosci. 2013. [Google Scholar] [CrossRef] [PubMed]
- Ahrens, M.B.; Orger, M.B.; Robson, D.N.; Li, J.M.; Keller, P.J. Whole-brain functional imaging at cellular resolution using light-sheet microscopy. Nat. Methods 2013. [Google Scholar] [CrossRef] [PubMed]
- Sheffield, M.E.J.; Dombeck, D.A. Calcium transient prevalence across the dendritic arbour predicts place field properties. Nature 2014. [Google Scholar] [CrossRef] [PubMed]
- Chen, T.W.; Wardill, T.J.; Sun, Y.; Pulver, S.R.; Renninger, S.L.; Baohan, A.; Schreiter, E.R.; Kerr, R.A.; Orger, M.B.; Jayaraman, V. Ultrasensitive fluorescent proteins for imaging neuronal activity. Nature 2013. [Google Scholar] [CrossRef] [PubMed]
- Fan, L.Z.; Nehme, R.; Adam, Y.; Jung, E.S.; Wu, H.; Eggan, K.; Arnold, D.B.; Cohen, A.E. All-optical synaptic electrophysiology probes mechanism of ketamine-induced disinhibition. Nat. Methods 2018, 15, 823–831. [Google Scholar] [CrossRef] [PubMed]
- Broussard, G.J.; Liang, Y.; Fridman, M.; Unger, E.K.; Meng, G.; Xiao, X.; Na, J.; Leopoldo, P.; Tian, L. In vivo measurement of afferent activity with axon-specific calcium imaging. Nat. Neurosci. 2018. [Google Scholar] [CrossRef]
- Steinmetz, N.A.; Buetfering, C.; Lecoq, J.; Lee, C.R.; Peters, A.J.; Jacobs, E.A.K.; Coen, P.; Ollerenshaw, D.R.; Valley, M.T.; de Vries, S.E.J. Aberrant Cortical Activity in Multiple GCaMP6-Expressing Transgenic Mouse Lines. Eneuro 2017, 4, ENEURO.0207-17. [Google Scholar] [CrossRef]
- McMahon, S.M.; Jackson, M.B. An Inconvenient Truth: Calcium Sensors Are Calcium Buffers. Trends Neurosci. 2018. [Google Scholar] [CrossRef]
- Yang, Y.; Liu, N.; He, Y.; Liu, Y.; Ge, L.; Zou, L.; Song, S.; Xiong, W.; Liu, X. Improved calcium sensor GCaMP-X overcomes the calcium channel perturbations induced by the calmodulin in GCaMP. Nat. Commun. 2018, 9, 1504. [Google Scholar] [CrossRef] [PubMed]
- Tian, L.; Hires, S.A.; Mao, T.; Huber, D.; Chiappe, M.E.; Chalasani, S.H.; Petreanu, L.; Akerboom, J.; McKinney, S.A.; Schreiter, E.R. Imaging neural activity in worms, flies and mice with improved GCaMP calcium indicators. Nat. Methods 2009. [Google Scholar] [CrossRef] [PubMed]
- Barykina, N.V.; Subach, O.M.; Piatkevich, K.D.; Jung, E.E.; Malyshev, A.Y.; Smirnov, I.V.; Bogorodskiy, A.O.; Borshchevskiy, V.; Varizhuk, A.; Pozmogova, G.E. Green fluorescent genetically encoded calcium indicator based on calmodulin/M13-peptide from fungi. PLoS ONE 2017, 12, e0183757. [Google Scholar] [CrossRef] [PubMed]
- Zhao, Y.; Araki, S.; Wu, J.; Teramoto, T.; Chang, Y.F.; Nakano, M.; Abdelfattah, A.S.; Fujiwara, M.; Ishihara, T.; Nagai, T. An Expanded Palette of Genetically Encoded Ca2+ Indicators -Supplementay Info. Science 2011. [Google Scholar] [CrossRef] [PubMed]
- Zhao, Y.; Abdelfattah, A.S.; Zhao, Y.; Ruangkittisakul, A.; Ballanyi, K.; Campbell, R.E.; Harrison, D.J. Microfluidic cell sorter-aided directed evolution of a protein-based calcium ion indicator with an inverted fluorescent response. Integr. Biol. 2014. [Google Scholar] [CrossRef] [PubMed]
- Sun, X.R.; Badura, A.; Pacheco, D.A.; Lynch, L.A.; Schneider, E.R.; Taylor, M.P.; Hogue, I.B.; Enquist, L.W.; Murthy, M.; Wang, S.S.H. Fast GCaMPs for improved tracking of neuronal activity. Nat. Commun. 2013. [Google Scholar] [CrossRef] [PubMed]
- Dana, H.; Sun, Y.; Mohar, B.; Hulse, B.; Hasseman, J.P.; Tsegaye, G.; Tsang, A.; Wong, A.; Patel, R.; Macklin, J.J. High-performance GFP-based calcium indicators for imaging activity in neuronal populations and microcompartments. bioRxiv 2018. [Google Scholar] [CrossRef]
- Barykina, N.V.; Subach, O.M.; Doronin, D.A.; Sotskov, V.P.; Roshchina, M.A.; Kunitsyna, T.A.; Malyshev, A.Y.; Smirnov, I.V.; Azieva, A.M.; Sokolov, I.S. A new design for a green calcium indicator with a smaller size and a reduced number of calcium-binding sites. Sci. Rep. 2016, 6, 34447. [Google Scholar] [CrossRef]
- Barykina, N.V.; Doronin, D.A.; Subach, O.M.; Sotskov, V.P.; Plusnin, V.V.; Ivleva, O.A.; Gruzdeva, A.M.; Kunitsyna, T.A.; Ivashkina, O.I.; Lazutkin, A.A. NTnC-like genetically encoded calcium indicator with a positive and enhanced response and fast kinetics. Sci. Rep. 2018. [Google Scholar] [CrossRef]
- Moeyaert, B.; Holt, G.; Madangopal, R.; Perez-Alvarez, A.; Fearey, B.C.; Trojanowski, N.F.; Ledderose, J.; Zolnik, T.A.; Das, A.; Patel, D. Improved methods for marking active neuron populations. Nat. Commun. 2018. [Google Scholar] [CrossRef]
- Doronin, D.A.; Barykina, N.V.; Subach, O.M.; Sotskov, V.P.; Plusnin, V.V.; Ivleva, O.A.; Isaakova, E.A.; Varizhuk, A.M.; Pozmogova, G.E.; Malyshev, A.Y. Genetically encoded calcium indicator with NTnC-like design and enhanced fluorescence contrast and kinetics. BMC Biotechnol. 2018, 18, 10. [Google Scholar] [CrossRef] [PubMed]
- Ohkura, M.; Sasaki, T.; Kobayashi, C.; Ikegaya, Y.; Nakai, J. An improved genetically encoded red fluorescent Ca2+ indicator for detecting optically evoked action potentials. PLoS ONE 2012, 7, e1796. [Google Scholar] [CrossRef] [PubMed]
- Shen, Y.; Dana, H.; Abdelfattah, A.S.; Patel, R.; Shea, J.; Molina, R.S.; Rawal, B.; Rancic, V.; Chang, Y.F.; Wu, L. A genetically encoded Ca2+ indicator based on circularly permutated sea anemone red fluorescent protein eqFP578. BMC Biol. 2018, 16, 1–16. [Google Scholar] [CrossRef] [PubMed]
- Lanin, A.A.; Chebotarev, A.S.; Barykina, N.V.; Subach, F.V.; Zheltikov, A.M. The whither of bacteriophytochrome-based near-infrared fluorescent proteins: Insights from two-photon absorption spectroscopy. J. Biophotonics 2019, 1–7. [Google Scholar] [CrossRef] [PubMed]
- Qian, Y.; Piatkevich, K.D.; Larney, B.; Abdelfattah, A.S.; Sohum, M.; Murdock, M.H.; Gottschalk, S.; Molina, R.S.; Zhang, W.; Chen, Y. A genetically encoded near-infrared fluorescent calcium ion indicator. Nat. Methods 2019, 1, 1–7. [Google Scholar] [CrossRef]
- Qian, Y.; Rancic, V.; Wu, J.; Ballanyi, K.; Campbell, R.E. A bioluminescent Ca2+ indicator based on a topological variant of GCaMP6s. ChemBioChem 2018, 1–6. [Google Scholar] [CrossRef]
- Shen, Y.; Wu, S.-Y.; Rancic, V.; Aggarwal, A.; Qian, Y.; Miyashita, S.-I.; Ballanyi, K.; Campbell, R.E.; Dong, M. Genetically encoded fluorescent indicators for imaging intracellular potassium ion concentration. Commun. Biol. 2019, 2, 18. [Google Scholar] [CrossRef] [PubMed]
- Bischof, H.; Rehberg, M.; Stryeck, S.; Artinger, K.; Eroglu, E.; Waldeck-Weiermair, M.; Gottschalk, B.; Rost, R.; Deak, A.T.; Niedrist, T. Novel genetically encoded fluorescent probes enable real-Time detection of potassium in vitro and in vivo. Nat. Commun. 2017, 8, 1–11. [Google Scholar] [CrossRef] [PubMed]
- Görlach, A.; Klappa, P.; Kietzmann, D.T. The Endoplasmic Reticulum: Folding, Calcium Homeostasis, Signaling, and Redox Control. Antioxid. Redox Signal. 2006. [Google Scholar] [CrossRef]
- Marchi, S.; Patergnani, S.; Missiroli, S.; Morciano, G.; Rimessi, A.; Wieckowski, M.R.; Giorgi, C.; Pinton, P. Mitochondrial and endoplasmic reticulum calcium homeostasis and cell death. Cell Calcium 2018. [Google Scholar] [CrossRef]
- Giorgi, C.; Agnoletto, C.; Bononi, A.; Bonora, M.; de Marchi, E.; Marchi, S.; Missiroli, S.; Patergnani, S.; Poletti, F.; Rimessi, A. Mitochondrial calcium homeostasis as potential target for mitochondrial medicine. Mitochondrion 2012. [Google Scholar] [CrossRef] [PubMed]
- Otera, H.; Ishihara, N.; Mihara, K. New insights into the function and regulation of mitochondrial fission. Biochim. Biophys. Acta Mol. Cell Res. 2013. [Google Scholar] [CrossRef] [PubMed]
- Shui, B.; Wang, Q.; Lee, F.; Byrnes, L.J.; Chudakov, D.M.; Lukyanov, S.A.; Sonderman, H.; Kotlikoff, M.I. Circular permutation of red fluorescent proteins. PLoS ONE 2011. [Google Scholar] [CrossRef] [PubMed]
- Akerboom, J.; Carreras Calderón, N.; Tian, L.; Wabnig, S.; Prigge, M.; Tolö, J.; Gordus, A.; Orger, M.B.; Severi, K.E.; Macklin, J.J. Genetically encoded calcium indicators for multi-color neural activity imaging and combination with optogenetics. Front. Mol. Neurosci. 2013, 6, 1–29. [Google Scholar] [CrossRef]
- Shen, Y.; Wiens, M.D.; Campbell, R.E. A photochromic and thermochromic fluorescent protein. RSC Adv. 2014. [Google Scholar] [CrossRef]
- Wu, J.; Liu, L.; Matsuda, T.; Zhao, Y.; Rebane, A.; Drobizhev, M.; Chang, Y.-F.; Araki, S.; Arai, Y.; March, K. Improved orange and red Ca2+ indicators and photophysical considerations for optogenetic applications. ACS Chem. Neurosci. 2013. [Google Scholar] [CrossRef] [PubMed]
- Wu, J.; Abdelfattah, A.S.; Miraucourt, L.S.; Kutsarova, E.; Ruangkittisakul, A.; Zhou, H.; Ballanyi, K.; Wicks, G.; Drobizhev, M.; Rebane, A. A long Stokes shift red fluorescent Ca2+ indicator protein for two-photon and ratiometric imaging. Nat. Commun. 2014. [Google Scholar] [CrossRef] [PubMed]
- Inoue, M.; Takeuchi, A.; Horigane, S.I.; Ohkura, M.; Gengyo-Ando, K.; Fujii, H.; Kamijo, S.; Takemoto-Kimura, S.; Kano, M.; Nakai, J. Rational design of a high-affinity, fast, red calcium indicator R-CaMP2. Nat. Methods 2014. [Google Scholar] [CrossRef]
- Hochbaum, D.R.; Zhao, Y.; Farhi, S.L.; Klapoetke, N.; Werley, C.A.; Kapoor, V.; Zou, P.; Kralj, J.M.; Maclaurin, D.; Smedemark-Margulies, N. All-optical electrophysiology in mammalian neurons using engineered microbial rhodopsins. Nat. Methods 2014, 11, 825–833. [Google Scholar] [CrossRef]
- Adam, Y.; Kim, J.J.; Lou, S.; Cohen, A.E. All-optical electrophysiology reveals brain-state dependent changes in hippocampal subthreshold dynamics and excitability. bioRxiv 2018. [Google Scholar] [CrossRef]
- Klapoetke, N.C.; Murata, Y.; Kim, S.S.; Pulver, S.R.; Birdsey-Benson, A.; Cho, Y.K.; Morimoto, T.K.; Chuong, A.S.; Carpenter, E.J.; Tian, Z. Independent optical excitation of distinct neural populations. Nat. Methods 2014, 11, 338–346. [Google Scholar] [CrossRef] [PubMed]
- Trojanowski, N.F.; Nelson, M.D.; Flavell, S.W.; Fang-Yen, C.; Raizen, D.M. Distinct Mechanisms Underlie Quiescence during Two Caenorhabditis elegans Sleep-Like States. J. Neurosci. 2015, 35, 14571–14584. [Google Scholar] [CrossRef] [PubMed]
- Piatkevich, K.D.; Subach, F.V.; Verkhusha, V.V. Engineering of bacterial phytochromes for near-infrared imaging, sensing, and light-control in mammals. Chem. Soc. Rev. 2013, 42, 3441–3452. [Google Scholar] [CrossRef] [PubMed]
- Piatkevich, K.D.; Suk, H.-J.; Kodandaramaiah, S.B.; Yoshida, F.; DeGennaro, E.M.; Drobizhev, M.; Hughes, T.E.; Desimone, R.; Boyden, E.S.; Verkhusha, V.V. Near-Infrared Fluorescent Proteins Engineered from Bacterial Phytochromes in Neuroimaging. Biophys. J. 2017, 113, 2299–2309. [Google Scholar] [CrossRef]
- Piatkevich, K.D.; Jung, E.E.; Straub, C.; Linghu, C.; Park, D.; Suk, H.-J.; Hochbaum, D.R.; Goodwin, D.; Pnevmatikakis, E.; Pak, N. A robotic multidimensional directed evolution approach applied to fluorescent voltage reporters. Nat. Chem. Biol. 2018. [Google Scholar] [CrossRef] [PubMed]
- Yu, D.; Baird, M.A.; Allen, J.R.; Howe, E.S.; Klassen, M.P.; Reade, A.; Makhijani, K.; Song, Y.; Liu, S.; Murthy, Z. A naturally monomeric infrared fluorescent protein for protein labeling in vivo. Nat. Methods 2015, 12, 763–765. [Google Scholar] [CrossRef] [PubMed]
- Filonov, G.S.; Piatkevich, K.D.; Ting, L.-M.; Zhang, J.; Kim, K.; Verkhusha, V.V. Bright and stable near-infrared fluorescent protein for in vivo imaging. Nat. Biotechnol. 2011, 29, 757–761. [Google Scholar] [CrossRef] [PubMed]
- Piatkevich, K.D.; Subach, F.V.; Verkhusha, V.V. Far-red light photoactivatable near-infrared fluorescent proteins engineered from a bacterial phytochrome. Nat. Commun. 2013, 4, 2153. [Google Scholar] [CrossRef]
- Rumyantsev, K.A.; Shcherbakova, D.M.; Zakharova, N.I.; Emelyanov, A.V.; Turoverov, K.K.; Verkhusha, V.V. Minimal domain of bacterial phytochrome required for chromophore binding and fluorescence. Sci. Rep. 2015, 5, 18348. [Google Scholar] [CrossRef]
- Fosque, B.F.; Sun, Y.; Dana, H.; Yang, C.T.; Ohyama, T.; Tadross, M.R.; Patel, R.; Zlatic, M.; Kim, D.S.; Ahrens, M.B. Labeling of active neural circuits in vivo with designed calcium integrators. Science 2015. [Google Scholar] [CrossRef]
- Stringer, C.; Pachitariu, M.; Steinmetz, N.; Reddy, C.; Carandini, M.; Harris, K.D. Spontaneous behaviors drive multidimensional, brain-wide neural activity. bioRxiv 2018. [Google Scholar] [CrossRef]
- Saito, K.; Chang, Y.F.; Horikawa, K.; Hatsugai, N.; Higuchi, Y.; Hashida, M.; Yoshida, Y.; Matsuda, T.; Arai, Y.; Nagai, T. Luminescent proteins for high-speed single-cell and whole-body imaging. Nat. Commun. 2012, 3, 1262–1269. [Google Scholar] [CrossRef] [PubMed]
- Rose, A.M.; Valdes, R. Understanding the sodium pump and its relevance to disease. Clin. Chem. 1994, 40, 1674–1685. [Google Scholar] [PubMed]
- Rose, C.R.; Konnerth, A. NMDA receptor-mediated Na+ signals in spines and dendrites. J. Neurosci. 2001, 21, 4207–4214. [Google Scholar] [CrossRef] [PubMed]
- Rose, C.R. Book Review: Na+ Signals at Central Synapses. Neurosci. 2002. [Google Scholar] [CrossRef] [PubMed]
- Llinás, R.R. The intrinsic electrophysiological properties of mammalian neurons: Insights into central nervous system function. Science 1988, 242, 1654–1664. [Google Scholar] [CrossRef] [PubMed]
- Bean, B.P. The action potential in mammalian central neurons. Nat. Rev. Neurosci. 2007, 8, 451–465. [Google Scholar] [CrossRef]
- Stuart, G.J.; Spruston, N. Dendritic integration: 60 years of progress. Nat. Neurosci. 2015, 18, 1713–1721. [Google Scholar] [CrossRef]
- Peterka, D.S.; Takahashi, H.; Yuste, R. Imaging voltage in neurons. Neuron 2011, 69, 9–21. [Google Scholar] [CrossRef]
- Kannan, M.; Vasan, G.; Huang, C.; Haziza, S.; Li, J.Z.; Inan, H.; Schnitzer, M.J.; Pieribone, V.A. Fast, in vivo voltage imaging using a red fluorescent indicator. Nat. Methods 2018, 15, 1108–1116. [Google Scholar] [CrossRef]
- Chavarha, M.; Villette, V.; Dimov, I.K.; Pradhan, L.; Evans, S.W.; Shi, D.; Yang, R.; Chamberland, S.; Bradley, J.; Mathieu, B.; et al. Fast two-photon volumetric imaging of an improved voltage indicator reveals electrical activity in deeply located neurons in the awake brain. bioRxiv 2018. [Google Scholar] [CrossRef]
- Abdelfattah, A.S.; Kawashima, T.; Singh, A.; Novak, O.; Mensh, B.D.; Paninski, L.; Macklin, J.J.; Podgorski, K.; Lin, B.J.; Chen, T.W. Bright and photostable chemigenetic indicators for extended in vivo voltage imaging. bioRxiv 2018. [Google Scholar] [CrossRef]
- Siegel, M.S.; Isacoff, E.Y. A genetically encoded optical probe of membrane voltage. Neuron 1997. [Google Scholar] [CrossRef]
- Gong, Y.; Huang, C.; Li, J.Z.; Grewe, B.F.; Zhang, Y.; Eismann, S.; Schnitzer, M.J. High-speed recording of neural spikes in awake mice and flies with a fluorescent voltage sensor. Science 2015, 350, 1361–1366. [Google Scholar] [CrossRef] [PubMed]
- Yizhar, O.; Fenno, L.; Zhang, F.; Hegemann, P.; Diesseroth, K. Microbial Opsins: A Family of Single-Component Tools for Optical Control of Neural Activity Topic Introduction Microbial Opsins: A Family of Single-Component Tools for Optical Control of Neural Activity. Cold Spring Harb. Protoc. 2011, 273–283. [Google Scholar] [CrossRef]
- Mattis, J.; Tye, K.M.; Ferenczi, E.A.; Ramakrishnan, C.; Shea, D.J.O.; Prakash, R.; Gunaydin, L.A.; Hyun, M.; Fenno, L.E.; Gradinaru, V.P. rinciples for applying optogenetic tools derived from direct comparative analysis of microbial opsins. Nat. Methods 2011, 9, 159–172. [Google Scholar] [CrossRef]
- Nagel, G.; Szellas, T.; Huhn, W.; Kateriya, S.; Adeishvili, N.; Berthold, P.; Ollig, O.; Hegemann, P.; Bamberg, E. Channelrhodopsin-2, a directly light-gated cation-selective membrane channel. Proc. Natl. Acad. Sci. USA 2003, 100, 13940–13945. [Google Scholar] [CrossRef] [PubMed]
- Gradinaru, V.; Thompson, K.R.; Deisseroth, K. eNpHR: A Natronomonas halorhodopsin enhanced for optogenetic applications. Brain Cell Biol. 2008, 36, 129–139. [Google Scholar] [CrossRef]
- Kralj, J.M.; Hochbaum, D.R.; Douglass, A.D.; Cohen, A.E. Electrical spiking in Escherichia coli probed with a fluorescent voltage-indicating protein. Science 2011. [Google Scholar] [CrossRef]
- Kralj, J.M.; Douglass, A.D.; Hochbaum, D.R.; MacLaurin, D.; Cohen, A.E. Optical recording of action potentials in mammalian neurons using a microbial rhodopsin. Nat. Methods 2012. [Google Scholar] [CrossRef]
- Lanyi, J. Bacteriorhodopsin. Annu. Rev. Physiol. 2004, 66, 665–688. [Google Scholar] [CrossRef] [PubMed]
- Maclaurin, D.; Venkatachalam, V.; Lee, H.; Cohen, A.E. Mechanism of voltage-sensitive fluorescence in a microbial rhodopsin. Proc. Natl. Acad. Sci. USA 2013, 110, 5939–5944. [Google Scholar] [CrossRef] [PubMed]
- Kuznetsova, S.; Zauner, G.; Aartsma, T.J.; Engelkamp, H.; Hatzakis, N.; Rowan, A.E.; Nolte, R.J.M.; Christianen, P.C.M.; Canters, G.W. The enzyme mechanism of nitrite reductase studied at single-molecule level. Proc. Natl. Acad. Sci. USA 2008, 105, 3250–3255. [Google Scholar] [CrossRef] [PubMed]
- Bayraktar, H.; Fields, A.P.; Kralj, J.M.; Spudich, J.L.; Rothschild, K.J.; Cohen, A.E. Ultrasensitive measurements of microbial rhodopsin photocycles using photochromic FRET. Photochem. Photobiol. 2012, 88, 90–97. [Google Scholar] [CrossRef] [PubMed]
- Gong, Y.; Wagner, M.J.; Li, J.Z.; Schnitzer, M.J. Imaging neural spiking in brain tissue using FRET-opsin protein voltage sensors. Nat. Commun. 2014, 5, 1–11. [Google Scholar] [CrossRef] [PubMed]
- Zou, P.; Zhao, Y.; Douglass, A.D.; Hochbaum, D.R.; Brinks, D.; Werley, C.A.; Harrison, D.J.; Campbell, R.E.; Cohen, A.E. Bright and fast multicoloured voltage reporters via electrochromic FRET. Nat. Commun. 2014, 5, 4625. [Google Scholar] [CrossRef] [PubMed]
- Chow, B.Y.; Han, X.; Dobry, A.S.; Qian, X.; Chuong, A.S.; Li, M.; Henninger, M.A.; Belfort, G.M.; Lin, Y.; Monahan, P.E. High-performance genetically targetable optical neural silencing by light-driven proton pumps. Nature 2010, 463, 98–102. [Google Scholar] [CrossRef] [PubMed]
- Tsunoda, S.P.; Ewers, D.; Gazzarrini, S.; Moroni, A.; Gradmann, D.; Hegemann, P. H+-pumping rhodopsin from the marine alga Acetabularia. Biophys. J. 2006, 91, 1471–1479. [Google Scholar] [CrossRef]
- Lou, S.; Adam, Y.; Weinstein, E.N.; Williams, E.; Williams, K.; Parot, V.; Kavokine, N.; Liberles, S.; Madisen, S.; Zeng, H. Genetically Targeted All-Optical Electrophysiology with a Transgenic Cre-Dependent Optopatch Mouse. J. Neurosci. 2016, 36, 11059–11073. [Google Scholar] [CrossRef]
- Grimm, J.B.; English, B.P.; Chen, J.; Slaughter, J.P.; Zhang, Z.; Revyakin, A.; Patel, R.; Macklin, J.J.; Normanno, D.A.; Singer, R.H. A general method to improve fluorophores for live-cell and single-molecule microscopy. Nat. Methods 2015. [Google Scholar] [CrossRef]
- Lim, S.T.; Antonucci, D.E.; Scannevin, R.H.; Trimmer, J.S. A Novel Targeting Signal for Proximal Clustering of the Kv2.1 K+ Channel in Hippocampal Neurons. Neuron 2000, 25, 385–397. [Google Scholar] [CrossRef]
- Baker, C.A.; Elyada, Y.M.; Parra, A.; Bolton, M.M.L. Cellular resolution circuit mapping with temporal-focused excitation of soma-targeted channelrhodopsin. Elife 2016, 5, 1–15. [Google Scholar] [CrossRef] [PubMed]
- Shemesh, O.; Tanese, D.; Zampini, V.; Changyang, L.; Kiryln, P.; Ronzitti, E.; Papagiakoumou, E.; Boyden, E.S.; Emiliani, V. Temporally precise single-cell resolution optogenetics. Nat. Neurosci. 2017, 20, 1796. [Google Scholar] [CrossRef] [PubMed]
- Chien, M.-P.; Brinks, D.; Adam, Y.; Bloxham, W.; Kheifets, S.; Cohen, A.E. Two-photon photoactivated voltage imaging in tissue with an Archaerhodopsin-derived reporter. bioRxiv 2017. [Google Scholar] [CrossRef]
- Cao, G.; Platisa, J.; Pieribone, V.A.; Raccuglia, D.; Kunst, M.; Nitabach, M.N. Genetically targeted optical electrophysiology in intact neural circuits. Cell 2013, 154, 904–913. [Google Scholar] [CrossRef]
- Yang, H.H.H.; St-Pierre, F.; Sun, X.; Ding, X.; Lin, M.Z.Z.; Clandinin, T.R.R. Subcellular Imaging of Voltage and Calcium Signals Reveals Neural Processing In Vivo. Cell 2016, 166, 245–257. [Google Scholar] [CrossRef] [PubMed]
- Chamberland, S.; Yang, H.H.; Pan, M.M.; Evans, S.W.; Guan, S.; Chavarha, M.; Yang, Y.; Salesse, C.; Wu, H.; Wu, J.C. Fast two-photon imaging of subcellular voltage dynamics in neuronal tissue with genetically encoded indicators. Elife 2017, 6, 1–35. [Google Scholar] [CrossRef]
- Roome, C.J.; Kuhn, B. Simultaneous dendritic voltage and calcium imaging and somatic recording from Purkinje neurons in awake mice. Nat. Commun. 2018, 9, 1–14. [Google Scholar] [CrossRef]
- Kulkarni, R.U.; Vandenberghe, M.; Thunemann, M.; James, F.; Andreassen, O.A.; Djurovic, S.; Devor, A.; Miller, E.W. In Vivo Two-Photon Voltage Imaging with Sulfonated Rhodamine Dyes. ACS Cent. Sci. 2018, 4, 1371–1378. [Google Scholar] [CrossRef]
- St-Pierre, F.; Marshall, J.D.; Yang, Y.; Gong, Y.; Schnitzer, M.J.; Lin, M.Z. High-fidelity optical reporting of neuronal electrical activity with an ultrafast fluorescent voltage sensor. Nat. Neurosci. 2014, 17, 884–889. [Google Scholar] [CrossRef]
- Südhof, T.C. Neurotransmitter release: The last millisecond in the life of a synaptic vesicle. Neuron 2013. [Google Scholar] [CrossRef] [PubMed]
- Scimemi, A.; Beato, M. Determining the neurotransmitter concentration profile at active synapses. Mol. Neurobiol. 2009. [Google Scholar] [CrossRef]
- Lüscher, C.; Malenka, R.C. NMDA receptor-dependent long-term potentiation and long-term depression (LTP/LTD). Cold Spring Harb. Perspect. Biol. 2012. [Google Scholar] [CrossRef] [PubMed]
- Von Gersdorff, H.; Sakaba, T.; Berglund, K.; Tachibana, M. Submillisecond kinetics of glutamate release from a sensory synapse. Neuron 1998. [Google Scholar] [CrossRef]
- Meldrum, B.S. Glutamate as a Neurotransmitter in the Brain: Review of Physiology and Pathology. J. Nutr. 2000, 130, 1007S–1015S. [Google Scholar] [CrossRef] [PubMed]
- McCormick, D.A. GABA as an inhibitory neurotransmitter in human cerebral cortex. J. Neurophysiol. 1989, 62, 1018–1027. [Google Scholar] [CrossRef] [PubMed]
- Rudnick, G. Neurotransmitter Transporters: Structure, Function, and Regulation; Reith, M.E.A., Ed.; Humana Press: New York, NY, USA, 2002; pp. 25–52. [Google Scholar]
- Snyder, S.H. Brain peptides as neurotransmitters. Science 1980, 209, 976–983. [Google Scholar] [CrossRef]
- Kreitzer, A.C. Neurotransmission: Emerging Roles of Endocannabinoids. Curr. Biol. 2005, 15, R549–R551. [Google Scholar] [CrossRef]
- Dawson, T.M.; Snyder, S.H. Gases as biological messengers: Nitric oxide and carbon monoxide in the brain. J. Neurosci. 1994, 14, 5147–5159. [Google Scholar] [CrossRef]
- Ames, G.F.L. Bacterial Periplasmic Transport Systems: Structure, Mechanism, and Evolution. Annu. Rev. Biochem. 1986. [Google Scholar] [CrossRef]
- De Lorimier, R.M.; Smith, J.J.; Dwyer, M.A.; Looger, L.L.; Sali, K.M.; Paavola, C.D.; Rizk, S.S.; Sadigov, S.; Conrad, D.W.; Loew, L. Construction of a fluorescent biosensor family. Protein Sci. 2002, 11, 2655–2675. [Google Scholar] [CrossRef] [PubMed]
- Dwyer, M.A.; Hellinga, H.W. Periplasmic binding proteins: A versatile superfamily for protein engineering. Curr. Opin. Struct. Biol. 2004, 14, 495–504. [Google Scholar] [CrossRef] [PubMed]
- Deuschle, K.; Okumoto, S.; Fehr, M.; Looger, L.L.; Kozhukh, L.; Frommer, W.B. Construction and optimization of a family of genetically encoded metabolite sensors by semirational protein engineering. Protein Sci. 2005, 14, 2304–2314. [Google Scholar] [CrossRef] [PubMed]
- Okumoto, S.; Looger, L.L.; Micheva, K.D.; Reimer, R.J.; Smith, S.J.; Frommer, W.B. Detection of glutamate release from neurons by genetically encoded surface-displayed FRET nanosensors. Proc. Natl. Acad. Sci. USA 2005, 102, 8740–8745. [Google Scholar] [CrossRef] [PubMed]
- Hires, S.A.; Zhu, Y.; Tsien, R.Y. Optical measurement of synaptic glutamate spillover and reuptake by linker optimized glutamate-sensitive fluorescent reporters. Proc. Natl. Acad. Sci. USA 2008, 105, 4411–4416. [Google Scholar] [CrossRef] [PubMed]
- Marvin, J.S.; Borghuis, B.G.; Tian, L.; Cichon, J.; Harnett, M.T.; Akerboom, J.; Gordus, A.; Renninger, S.L.; Chen, T.W.; Bargmann, C.I. An optimized fluorescent probe for visualizing glutamate neurotransmission. Nat. Methods 2013, 10, 162–170. [Google Scholar] [CrossRef] [PubMed]
- Taschenberger, H.; Woehler, A.; Neher, E. Superpriming of synaptic vesicles as a common basis for intersynapse variability and modulation of synaptic strength. Proc. Natl. Acad. Sci. USA 2016. [Google Scholar] [CrossRef]
- Helassa, N.; Dürst, C.D.; Coates, C.; Kerruth, S.; Arif, U.; Schulze, C.; Wiegert, J.S.; Geeves, M.; Oertner, T.G.; Török, K. Ultrafast glutamate sensors resolve high-frequency release at Schaffer collateral synapses. Proc. Natl. Acad. Sci. USA 2018, 115, 5594–5599. [Google Scholar] [CrossRef]
- Marvin, J.S.; Scholl, B.; Wilson, D.E.; Podgorski, K.; Kazemipour, A.; Müller, J.A.; Schoch, S.; Quiroz, F.J.U.; Rebola, N.; Bao, H. Stability, affinity, and chromatic variants of the glutamate sensor iGluSnFR. Nat. Methods 2018, 15, 936–939. [Google Scholar] [CrossRef]
- Wu, J.; Abdelfattah, A.S.; Zhou, H.; Ruangkittisakul, A.; Qian, Y.; Ballanyi, K.; Campbell, R.E. Genetically Encoded Glutamate Indicators with Altered Color and Topology. ACS Chem. Biol. 2018, 13, 1832–1837. [Google Scholar] [CrossRef]
- Looger, L.L.; Marvin, J.S.; Shimoda, Y.; Magloire, V.; Leite, M.; Kawashima, T.; Jensen, T.P.; Knott, E.L.; Novak, O.; Podgorski, K. A genetically encoded fluorescent sensor for in vivo imaging of GABA. bioRxiv 2018. [Google Scholar] [CrossRef]
- Zhang, W.H.; Herde, M.K.; Mitchell, J.A.; Whitfield, J.H.; Wulff, A.B.; Vongsouthi, V.; Sanchez-Romero, I.; Gulakova, P.E.; Minge, D.; Breithausen, B. Monitoring hippocampal glycine with the computationally designed optical sensor GlyFS. Nat. Chem. Biol. 2018, 14, 861–869. [Google Scholar] [CrossRef]
- Patriarchi, T.; Cho, J.R.; Merten, K.; Howe, M.W.; Marley, A.; Xiong, W.H.; Folk, R.W.; Broussard, G.J.; Liang, R.; Jang, M.J. Ultrafast neuronal imaging of dopamine dynamics with designed genetically encoded sensors. Science 2018, 360, 1–15. [Google Scholar] [CrossRef] [PubMed]
- Sun, F.; Zeng, J.; Jing, M.; Zhou, J.; Feng, J.; Owen, S.F.; Luo, Y.; Li, F.; Wang, H.; Yamaguchi, T. A Genetically Encoded Fluorescent Sensor Enables Rapid and Specific Detection of Dopamine in Flies, Fish, and Mice. Cell 2018, 174, 481–496. [Google Scholar] [CrossRef] [PubMed]
- Jing, M.; Zhang, P.; Wang, G.; Feng, J.; Mesik, L.; Zeng, J.; Jiang, H.; Wang, S.; Looby, J.C.; Guagliardo, N.A. A genetically encoded fluorescent acetylcholine indicator for in vitro and in vivo studies. Nat. Biotechnol. 2018, 36, 726–737. [Google Scholar] [CrossRef] [PubMed]
- Feng, J.; Zhang, C.; Lischinsky, J.; Jing, M.; Zhou, J.; Wang, H.; Zhang, Y.; Dong, A.; Wu, Z.; Wu, H.; et al. A genetically encoded fluorescent sensor for rapid and specific in vivo detection of norepinephrine. bioRxiv 2018. [Google Scholar] [CrossRef]
- Lee, D.; Creed, M.; Jung, K.; Stefanelli, T.; Wendler, D.J.; Oh, W.C.; Mignocchi, N.L.; Lüscher, C.; Kwon, H.B. Temporally precise labeling and control of neuromodulatory circuits in the mammalian brain. Nat. Methods 2017, 14, 495–503. [Google Scholar] [CrossRef] [PubMed]
- Guthrie, G.D.; Nicholson-Guthrie, C.S. gamma-Aminobutyric acid uptake by a bacterial system with neurotransmitter binding characteristics. Proc. Natl. Acad. Sci. USA 1989. [Google Scholar] [CrossRef]
- Planamente, S.; Vigouroux, A.; Mondy, S.; Nicaise, M.; Faure, D.; Moréra, S. A conserved mechanism of GABA binding and antagonism is revealed by structure-function analysis of the periplasmic binding protein Atu2422 in Agrobacterium tumefaciens. J. Biol. Chem. 2010. [Google Scholar] [CrossRef]
- Whitfield, J.H.; Zhang, W.H.; Herde, M.K.; Clifton, B.E.; Radziejewski, J.; Janovjak, H.; Henneberger, C.; Jackson, C.J. Construction of a robust and sensitive arginine biosensor through ancestral protein reconstruction. Protein Sci. 2015. [Google Scholar] [CrossRef]
- Tannous, B.A.; Grimm, J.; Perry, K.F.; Chen, J.W.; Weissleder, R.; Breakefield, X.O. Metabolic biotinylation of cell surface receptors for in vivo imaging. Nat. Methods 2006. [Google Scholar] [CrossRef] [PubMed]
- Park, J.H.; Scheerer, P.; Hofmann, K.P.; Choe, H.W.; Ernst, O.P. Crystal structure of the ligand-free G-protein-coupled receptor opsin. Nature 2008. [Google Scholar] [CrossRef] [PubMed]
- Scheerer, P.; Park, J.H.; Hildebrand, P.W.; Kim, Y.J.; Krauß, N.; Choe, H.W.; Hofmann, K.P.; Ernst, O.P. Crystal structure of opsin in its G-protein-interacting conformation. Nature 2008. [Google Scholar] [CrossRef] [PubMed]
- Vilardaga, J.P.; Bünemann, M.; Krasell, C.; Castro, M.; Lohse, M.J. Measurement of the millisecond activation switch of G protein-coupled receptors in living cells. Nat. Biotechnol. 2003, 21, 807–812. [Google Scholar] [CrossRef]
- Ziegler, N.; Bätz, J.; Zabel, U.; Lohse, M.J.; Hoffmann, C. FRET-based sensors for the human M1-, M3-, and M 5-acetylcholine receptors. Bioorganic Med. Chem. 2011, 19, 1048–1054. [Google Scholar] [CrossRef] [PubMed]
- Masharina, A.; Reymond, L.; Maurel, D.; Umezawa, K.; Johnsson, K. A Fluorescent Sensor for GABA and Synthetic GABA. J. Am. Chem. Soc. 2012, 134, 19026–19034. [Google Scholar] [CrossRef] [PubMed]
- Maier-Peuschel, M.; Frölich, N.; Dees, C.; Hommers, L.G.; Hoffmann, C.; Nikolaev, V.O.; Lohse, M.J. A fluorescence resonance energy transfer-based M2 muscarinic receptor sensor reveals rapid kinetics of allosteric modulation. J. Biol. Chem. 2010, 285, 8793–8800. [Google Scholar] [CrossRef] [PubMed]
- Luttrell, L.M.; Lefkowitz, R.J. The role of ß-arrestins in the termination and transduction of G-protein-coupled receptor signals. J. Cell Sci. 2002. [Google Scholar] [CrossRef]
- Neves, S.R.; Ram, P.T.; Iyengar, R. G protein pathways. Science 2002. [Google Scholar] [CrossRef] [PubMed]
- Barnea, G.; Strapps, W.; Herrada, G.; Berman, Y.; Ong, J.; Kloss, B.; Axel, R.; Lee, K.J. The genetic design of signaling cascades to record receptor activation. Proc. Natl. Acad. Sci. USA 2008, 105, 64–69. [Google Scholar] [CrossRef]
- Nguyen, Q.T.; Schroeder, L.F.; Mank, M.; Muller, A.; Taylor, P.; Griesbeck, O.; Kleinfeld, D. An in vivo biosensor for neurotransmitter release and in situ receptor activity. Nat. Neurosci. 2010, 13, 127–132. [Google Scholar] [CrossRef] [PubMed]
- Muller, A.; Joseph, V.; Slesinger, P.A.; Kleinfeld, D. Cell-based reporters reveal in vivo dynamics of dopamine and norepinephrine release in murine cortex. Nat. Methods 2014, 11, 1245–1252. [Google Scholar] [CrossRef] [PubMed]
- Guntas, G.; Hallett, R.A.; Zimmerman, S.P.; Williams, T.; Yumerefendi, H.; Bear, J.E.; Kuhlman, B. Engineering an improved light-induced dimer (iLID) for controlling the localization and activity of signaling proteins. Proc. Natl. Acad. Sci. USA 2015. [Google Scholar] [CrossRef] [PubMed]
- Overbeek, R.; Bartels, D.; Vonstein, V.; Meyer, F. Annotation of Bacterial and Archaeal Genomes: Improving Accuracy and Consistency. Chem. Rev. 2007, 107, 3431–3447. [Google Scholar] [CrossRef] [PubMed]
- Markowitz, V.M.; Chen, I.-M.A.; Chu, K.; Pati, A.; Ivanova, N.N.; Kyrpides, N.C. Ten Years of Maintaining and Expanding a Microbial Genome and Metagenome Analysis System. Trends Microbiol. 2015, 23, 730–741. [Google Scholar] [CrossRef] [PubMed]
- Packer, M.S.; Liu, D.R. Methods for the directed evolution of proteins. Nat. Rev. Genet. 2015, 16, 379–394. [Google Scholar] [CrossRef] [PubMed]
- Subach, F.V.; Piatkevich, K.D.; Verkhusha, V.V. Directed molecular evolution to design advanced red fluorescent proteins. Nat. Methods 2011. [Google Scholar] [CrossRef]
- Chia, T.H.; Levene, M.J. Microprisms for in vivo multilayer cortical imaging. J. Neurophysiol. 2009, 102, 1310–1314. [Google Scholar] [CrossRef]
- Andermann, M.L.; Gilfoy, N.B.; Goldey, G.J.; Sachdev, R.N.S.; Wölfel, M.; McCormick, D.A.; Reid, R.C.; Levene, M.J. Chronic Cellular Imaging of Entire Cortical Columns in Awake Mice Using Microprisms. Neuron 2013, 80, 900–913. [Google Scholar] [CrossRef]
- Ghosh, K.K.; Burns, L.D.; Cocker, E.D.; Nimmerjahn, A.; Ziv, Y.; El Gamal, A.; Schnitzer, M.J. Miniaturized integration of a fluorescence microscope. Nat. Methods 2011, 8, 871–878. [Google Scholar] [CrossRef]
- Yu, K.; Ahrens, S.; Zhang, X.; Schiff, H.; Ramakrishnan, C.; Fenno, L.; Deisseroth, K.; Zhao, F.; Luo, M.H.; Gong, L. The central amygdala controls learning in the lateral amygdala. Nat. Neurosci. 2017, 20, 1680. [Google Scholar] [CrossRef] [PubMed]
- Tillberg, P.W.; Chen, F.; Piatkevich, K.D.; Zhao, Y.; Yu, C.-C.; English, B.P.; Gao, L.; Martorell, A.; Suk, H.J.; Yoshida, F. Protein-retention expansion microscopy of cells and tissues labeled using standard fluorescent proteins and antibodies. Nat. Biotechnol. 2016, 34, 987–992. [Google Scholar] [CrossRef] [PubMed]
- Wassie, A.T.; Zhao, Y.; Boyden, E.S. Expansion microscopy: Principles and uses in biological research. Nat. Methods 2019, 16, 33–41. [Google Scholar] [CrossRef] [PubMed]
- Lee, K.-S.; Vandemark, K.; Mezey, D.; Shultz, N.; Fitzpatrick, D. Functional Synaptic Architecture of Callosal Inputs in Mouse Primary Visual Cortex. Neuron 2018, 1–8. [Google Scholar] [CrossRef]
Figure 1.
Molecular design of genetically-encoded calcium and potassium indicators. (a,b) The structure of calcium indicators are shown as ribbon diagrams according to the crystal structures of NTnC (protein database (PDB) 5MWC), dYTnC2 (unpublished), GAF-CaMP (combination of GAF-domain of PaBphP phytochrome PDB 3C2W and CaM/M13-peptide pair from GCaMP6m GECI PDB 3WLD), NIR-GECO1 (combination of the PAS-GAF domain of PaBphP phytochrome PDB 3C2W and CaM/M13-peptide pair from GCaMP6m GECI PDB 3WLD), LUCI-GECO1 (combination of NanoLuc luciferase PDB 5IBO and GCaMP6m GECI PDB 3WLD), FGCaMP (unpublished), and K-GECO (PDB 5UKG) in calcium-bound state. (c) The organization of potassium indicators is shown schematically and according to the X-ray structures of Cerulean and mVenus fluorescent proteins (PDB 5OXC and 1MYW, respectively), and Kbp potassium binding protein from E.coli (PDB 5FIM).

Figure 2.
Molecular design of selected genetically-encoded and hybrid fluorescent voltage indicators. (a) eFRET-opsin voltage sensors Ace2N and VARNAM. (b) Hybrid eFRET-opsin voltage sensor Voltron. (c) Opsin-based voltage sensors Archon1 and paQuasAr3. (d) VSD-based voltage sensor ASAP3.
Figure 2.
Molecular design of selected genetically-encoded and hybrid fluorescent voltage indicators. (a) eFRET-opsin voltage sensors Ace2N and VARNAM. (b) Hybrid eFRET-opsin voltage sensor Voltron. (c) Opsin-based voltage sensors Archon1 and paQuasAr3. (d) VSD-based voltage sensor ASAP3.

Figure 3.
Molecular design of genetically-encoded neurotransmitter indicators. (a) PBP-based glutamate and GABA sensors. (b) PBP-based glycine sensor. (c) GPCR-based dopamine, acetylcholine, and norepinephtine sensors. (d) iTango2 system for dopamine detection.
Figure 3.
Molecular design of genetically-encoded neurotransmitter indicators. (a) PBP-based glutamate and GABA sensors. (b) PBP-based glycine sensor. (c) GPCR-based dopamine, acetylcholine, and norepinephtine sensors. (d) iTango2 system for dopamine detection.


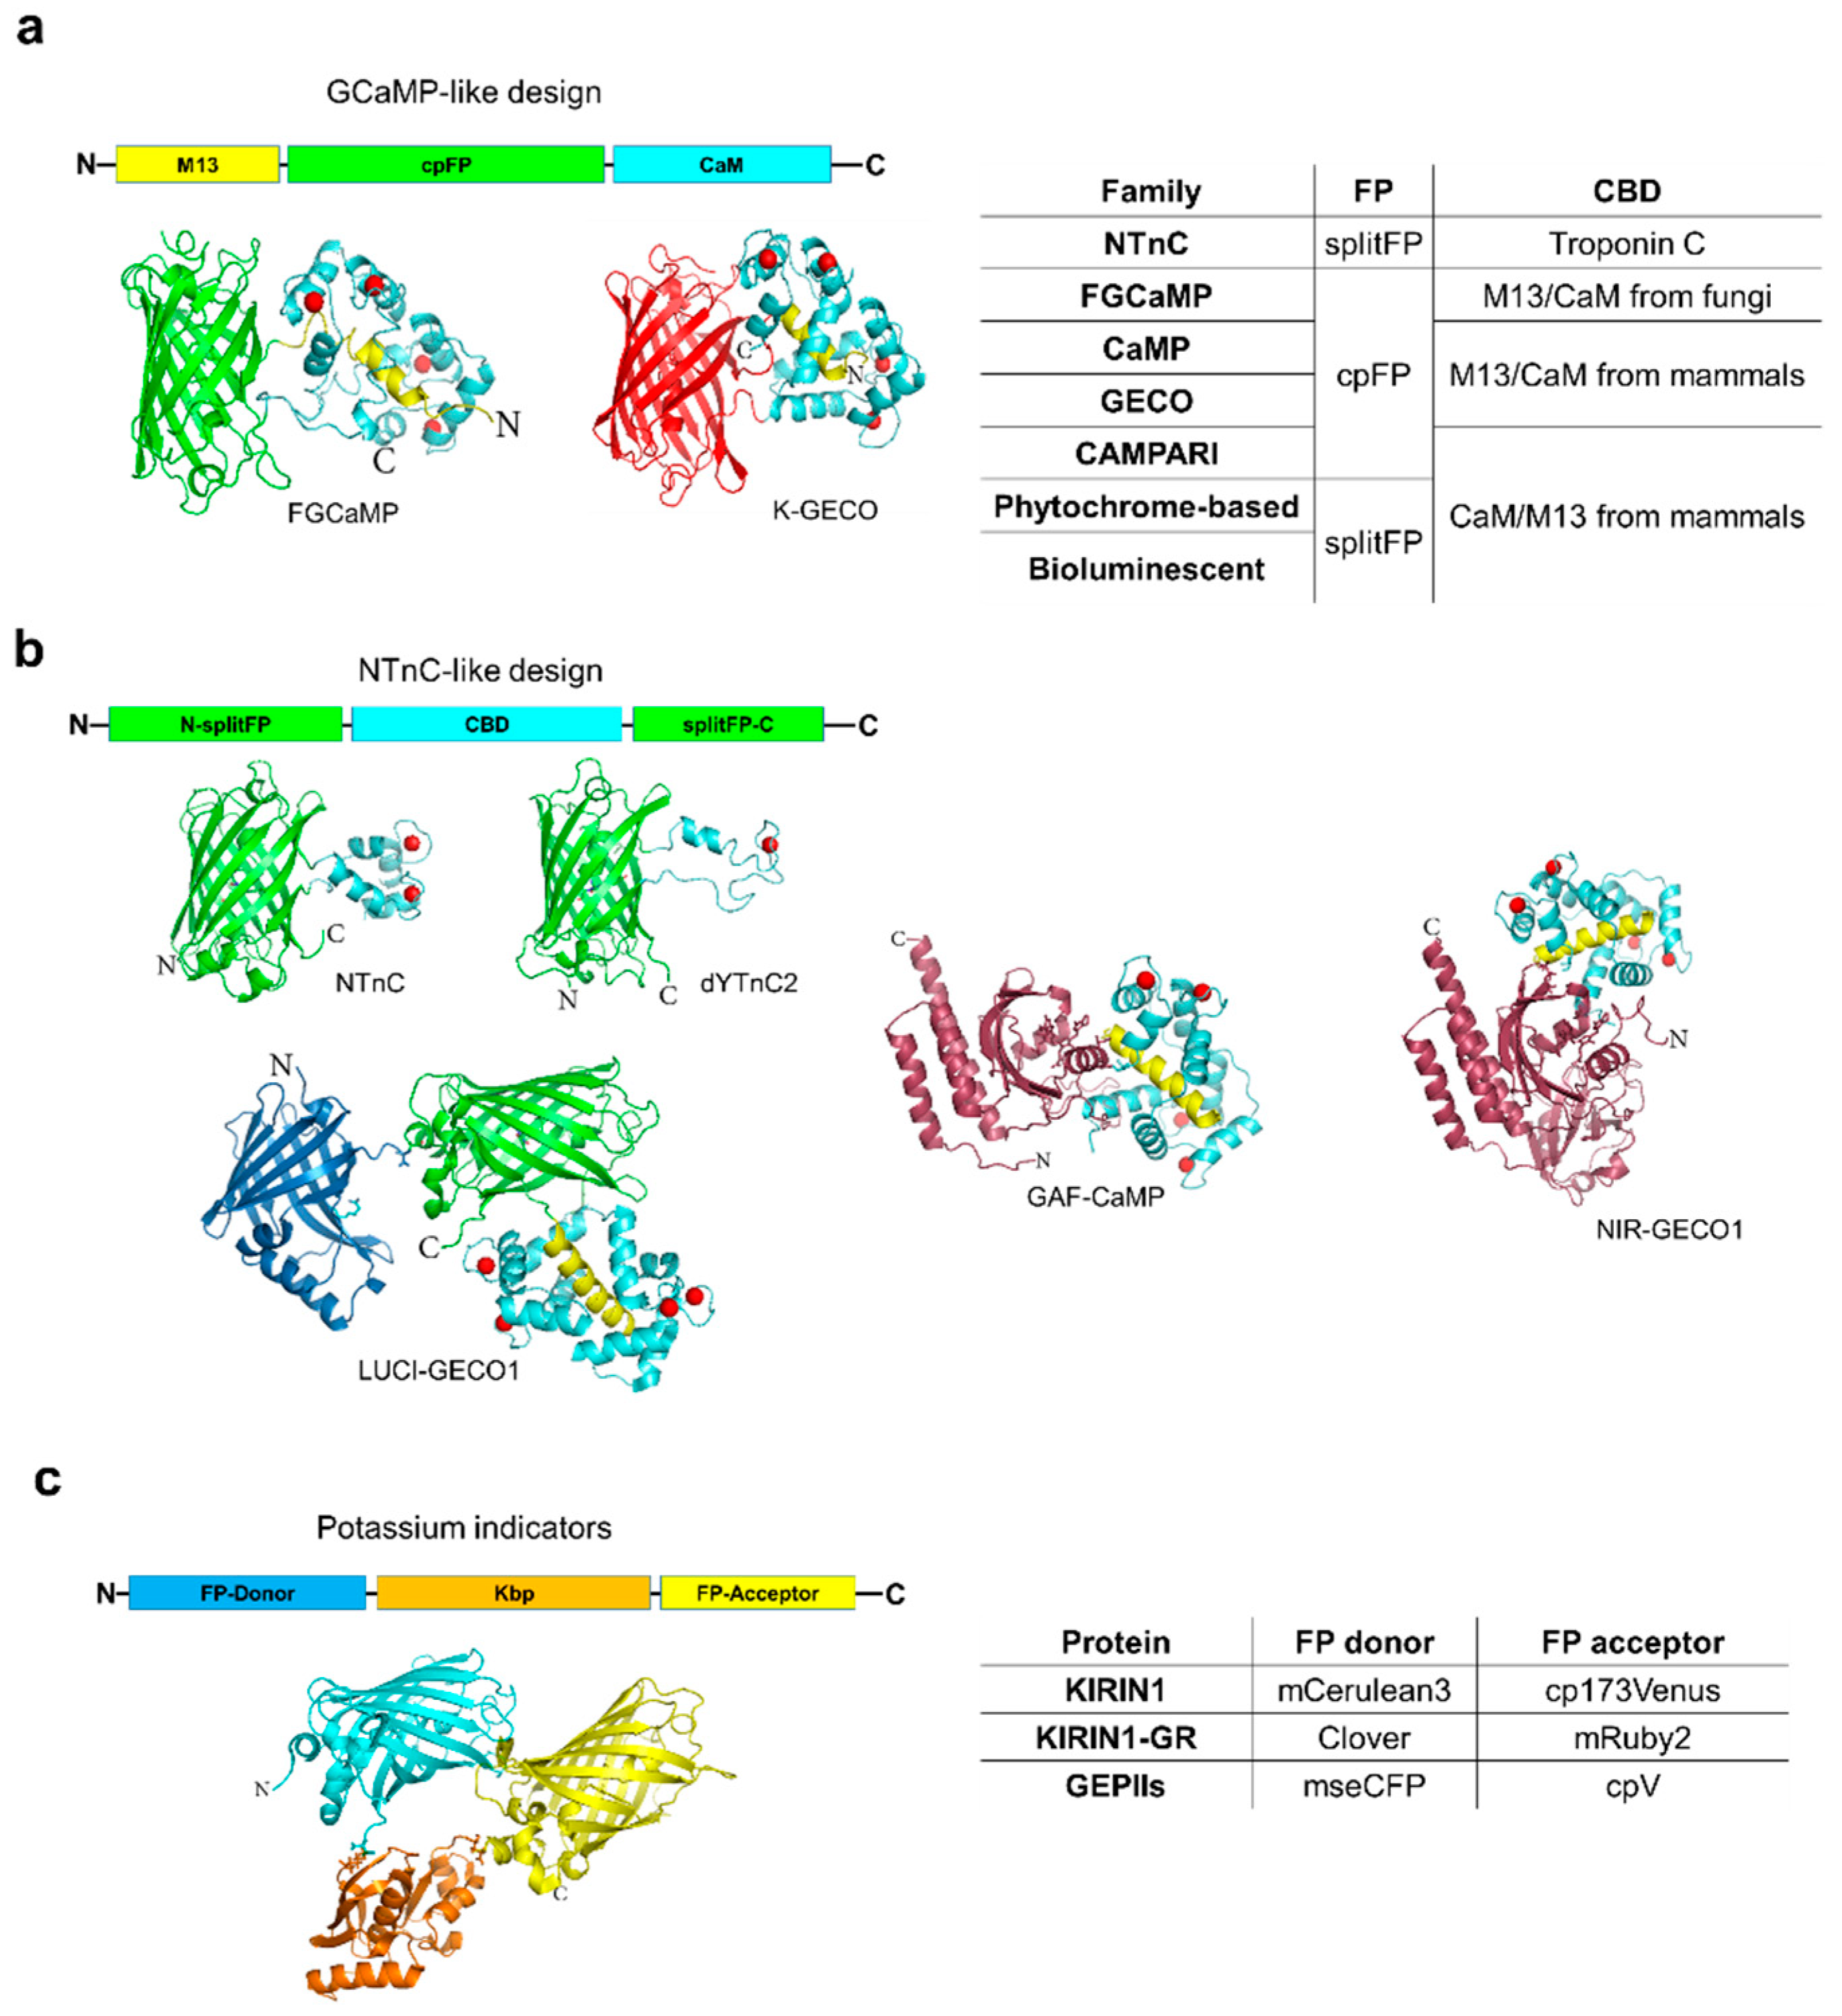
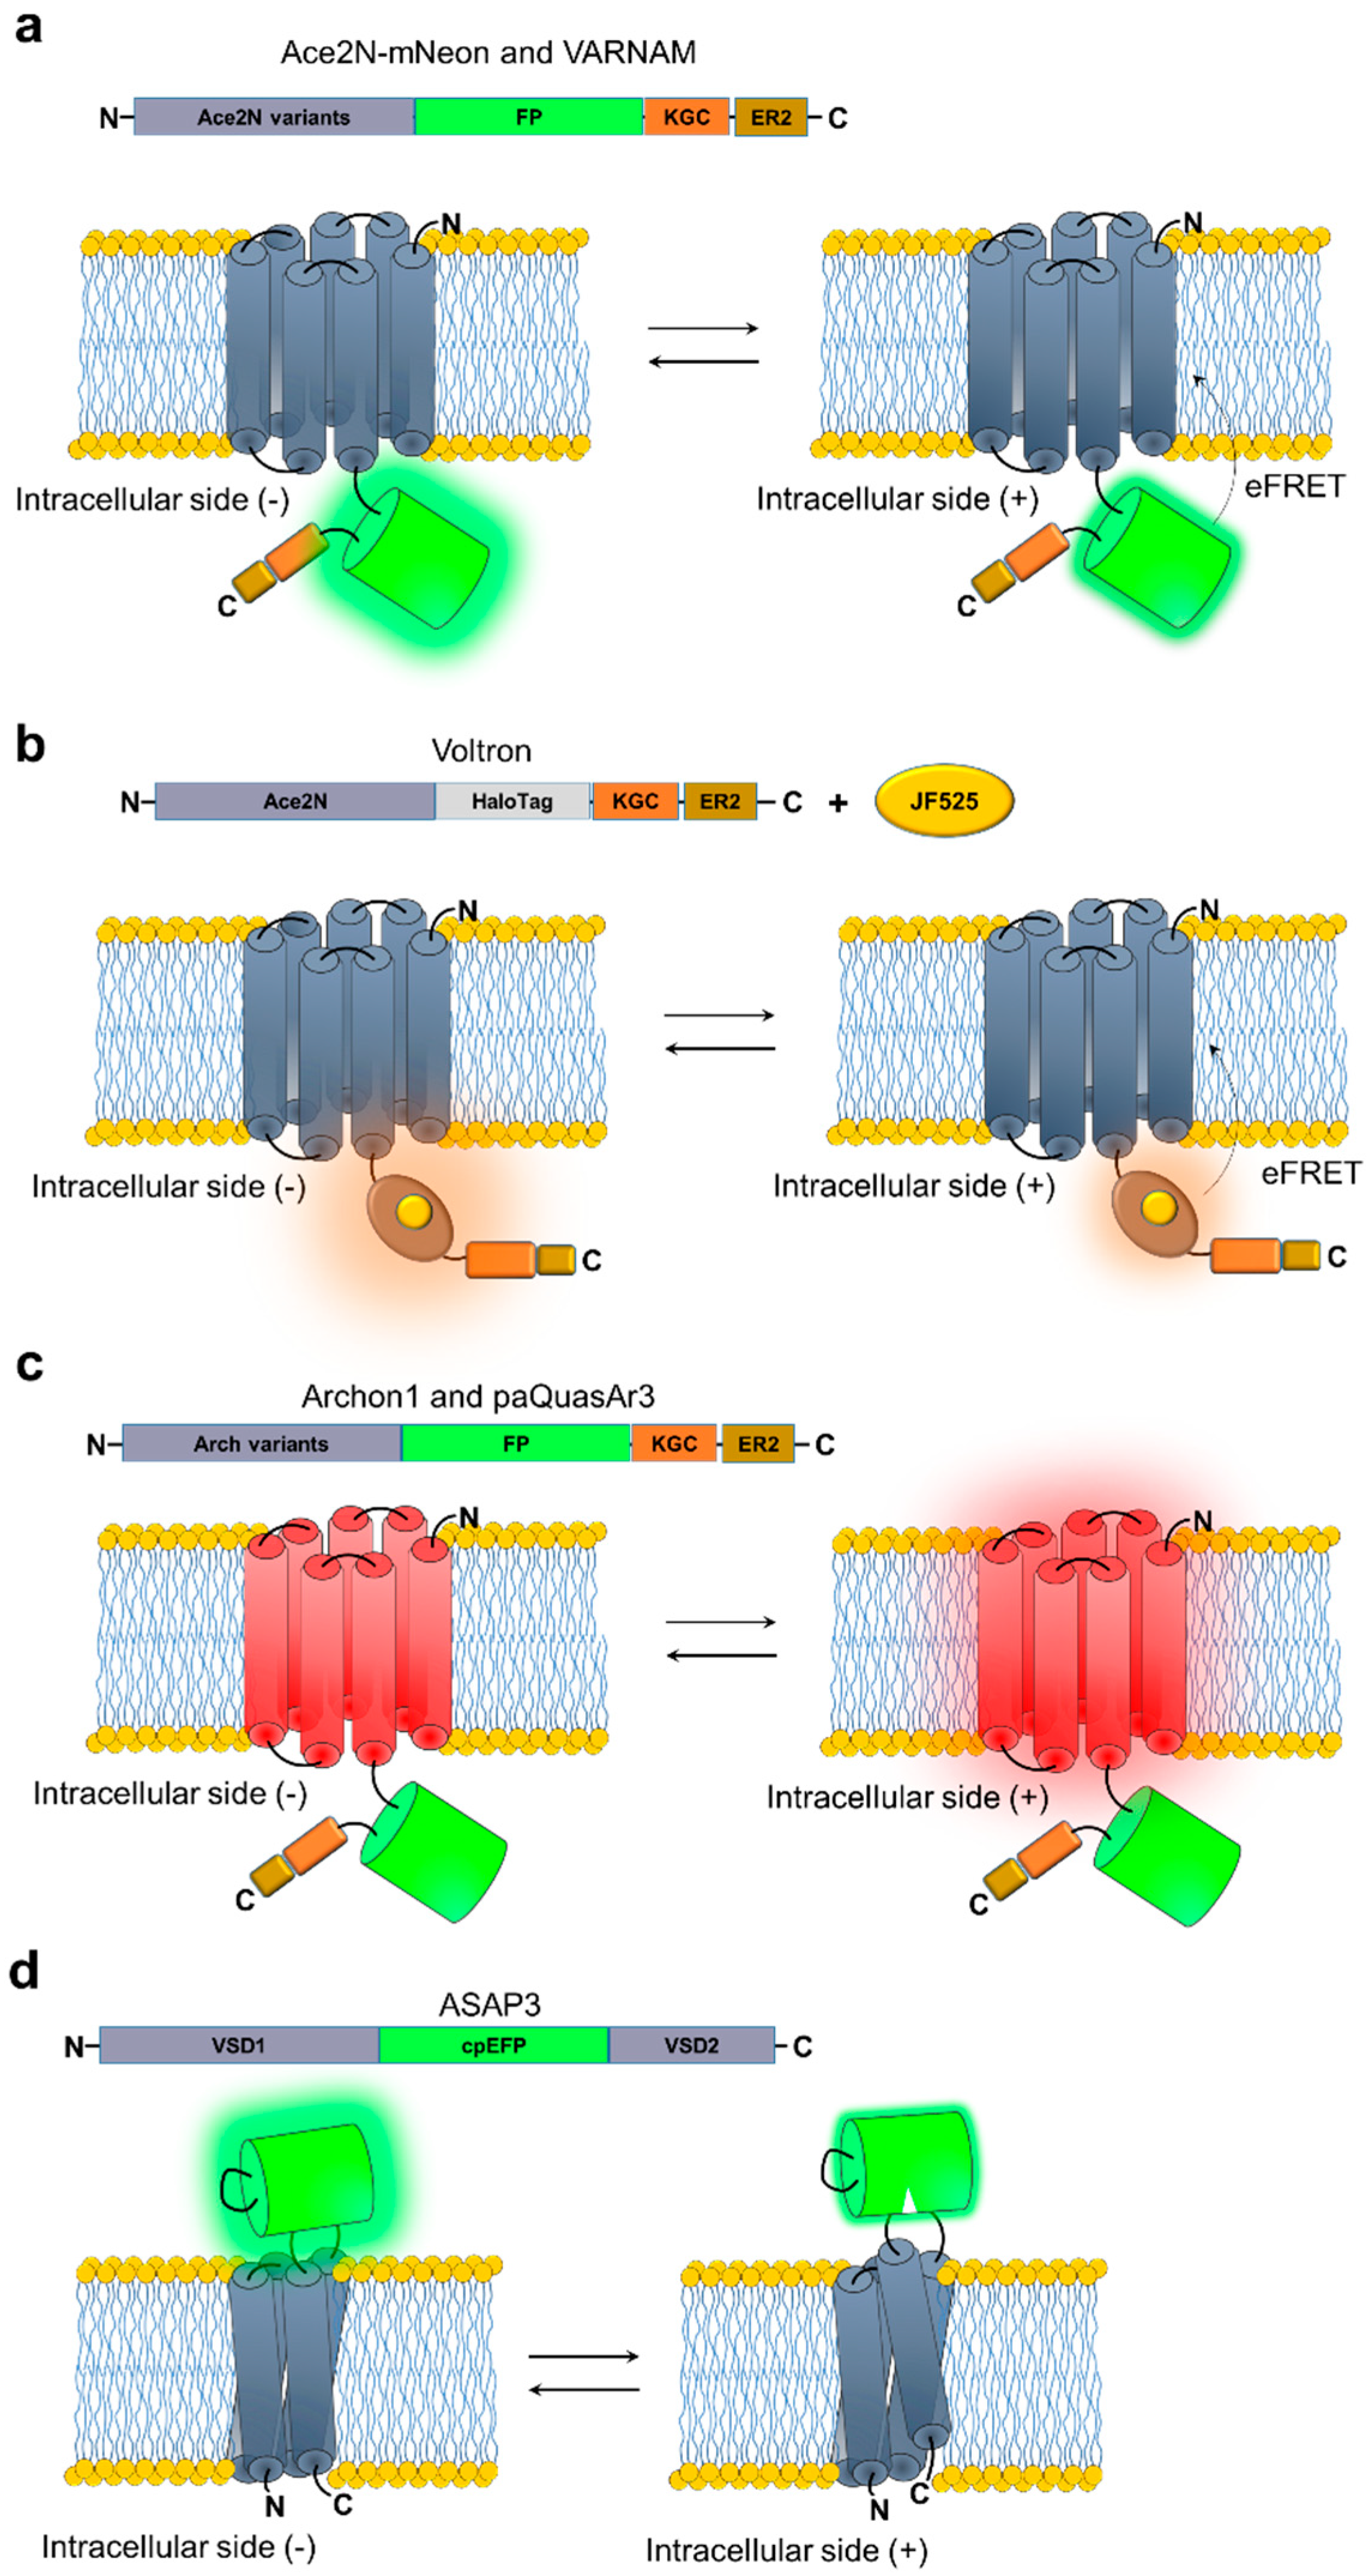
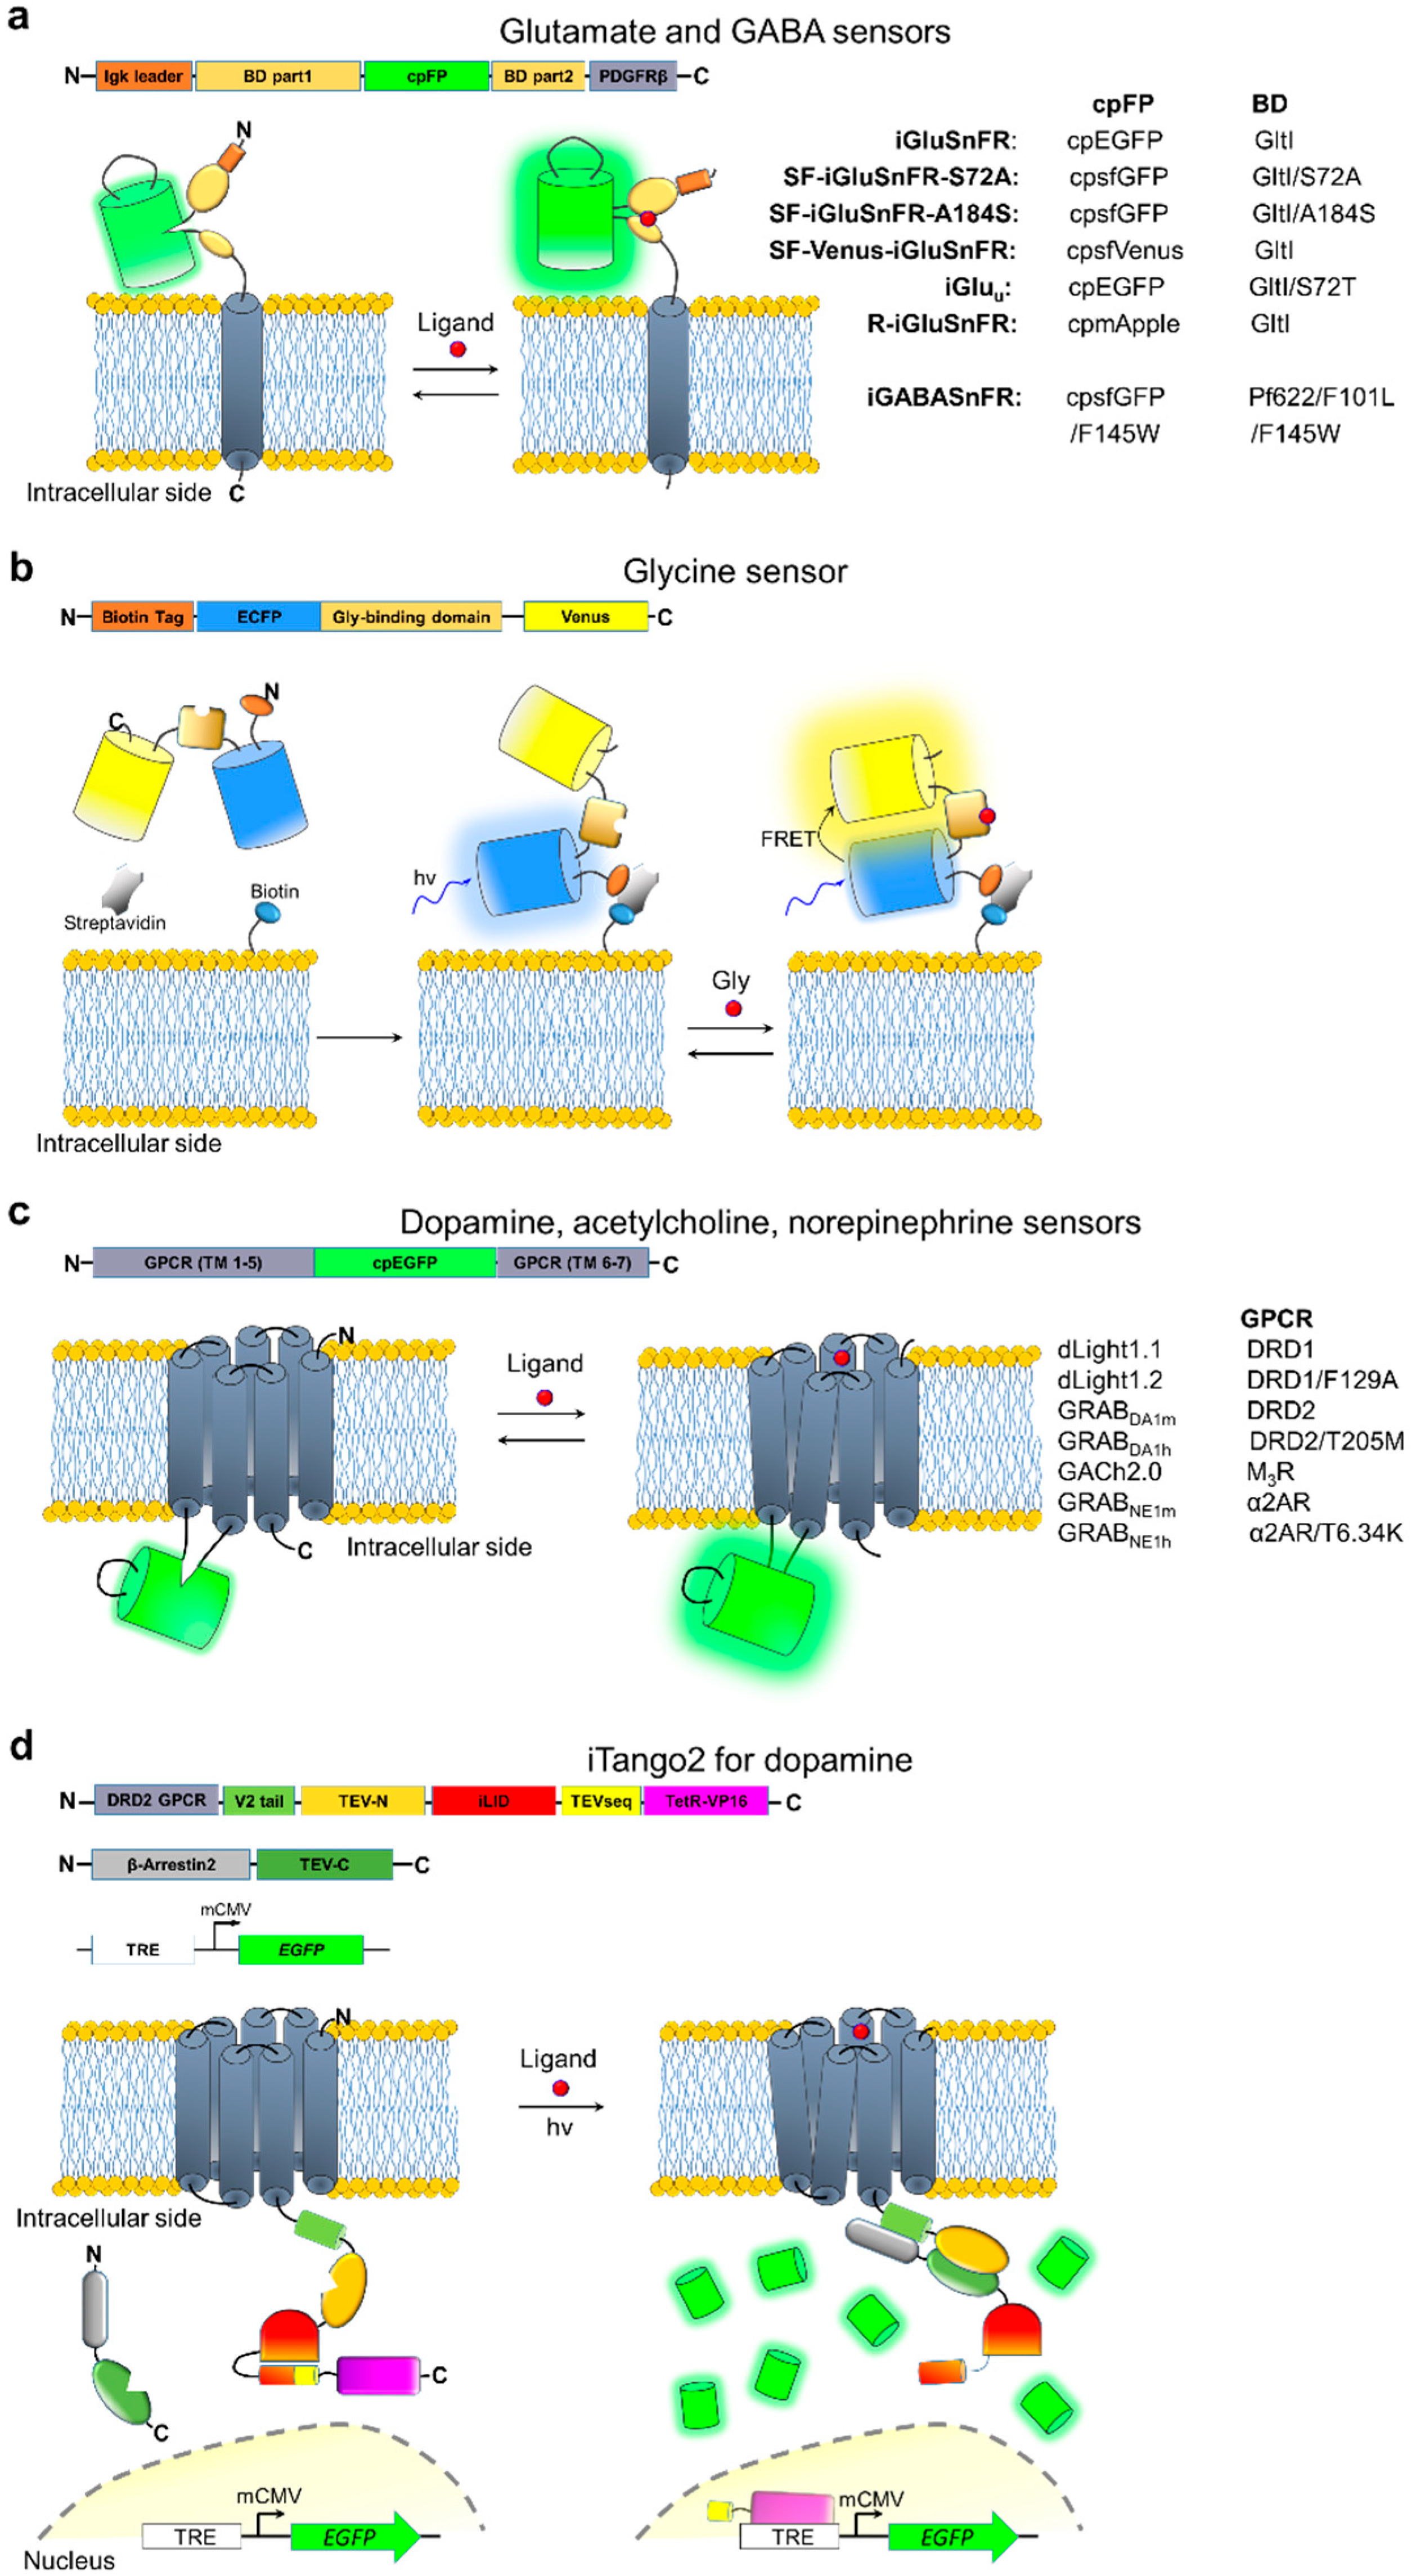
Table 1.
The key characteristics and performance of the selected genetically-encoded fluorescent calcium and potassium indicators.
Table 1.
The key characteristics and performance of the selected genetically-encoded fluorescent calcium and potassium indicators.
| Family | Indicator a | Ex/Em (nm) b | Brightness vs. EGFP (%) c | pKa,apo/pKa,sat | ΔF/F (%) d | Kd (nM) e | koff (s−1) f | ΔF/F/SNR per AP | Ref. | ||
|---|---|---|---|---|---|---|---|---|---|---|---|
| Slice or Culture | In Vivo | ||||||||||
| Calcium indicators | |||||||||||
| NTnC | NTnC | 505/518 | 163 | 6.09/6.08 | 100 | 192 | 0.8 | 0.027/18 | ND | [38] | |
| iYTnC2 | 499/518 | 16 | 7.4/8.5 | 450 | 331 | 1.12 | 0.0015/ND | ND | [41] | ||
| YTnC | 495/516 | 17 | 5.2/6.3 | 290 | 410 | 0.96 | 0.008/ND | ND | [39] | ||
| dYTnC2 | 496/518 | ND | ND | 1900 | 2700 | ND | ND | ND | [unpublished] | ||
| FGCaMP | FGCaMP® | apo | 402/516 | 56 | 6.56/7.0 | 590 | 400 | 1.2 | ND | ND | [33] |
| sat | 493/516 | 104 | 6.2/7.33 | 1370 | 460, 4400 | ||||||
| CaMP | GCaMP6s | 497/515 | 124 | 9.77/6.20 | 6220 | 227 | 0.69–1.12 | 0.022–0.28/7.6–183 | 0.25/ND | [26] | |
| GCaMP6f | 497/515 | 109 | 8.77/6.34 | 5080 | 492 | 3.93 | 0.18/101 | 0.15/ND | [26] | ||
| jGCAMP7s | 497/515 | 103 | 7.69/6.36 | 3900 | 68 * | 2.86 | 0.657/25 | ND | [37] | ||
| GECO | jRGECO1a | 560/590 | 35 | 8.6/6.3 | 1060 | 148 * | 7.6 | ~0.29/~13 | 0.13/ND | [9,42] | |
| K-GECO1 | 565/590 | 82 | ND | 1100 | 165 * | ND | ~0.26/~11 | ND | [43] | ||
| CAMPARI | CAMPARI2 | G | 502/516 | 268 | ND | 7.8 | 199 * | 1.43 | ND | ND | [40] |
| R | 562/577 | 126 | ND | ||||||||
| Phytochrome-based | GAF-CaMP | 635/672 | 21, 69 * | 3.0; 9.0/ 3.0; >10.0 | 52 | 15 | ND | ND | ND | [44] | |
| NIR-GECO1 | 678/704 | ND | 6.0/4.7 | 85 | 215 | 1.93 | 2.5/25 | ND | [45] | ||
| Bioluminecent | LUCI-GECO1BRET | donor | 460 | ND | 8.15/6.07 | 406 | 285 * | ND | ND | ND | [46] |
| acceptor | 497/515 | ||||||||||
| Potassium indicators | |||||||||||
| GEPI | KIRIN1FRET | donor | 433/475 | 104 | 3.2 | 130 | 1660 | ND | ND | ND | [47] |
| acceptor | 515/530 | ND | ND | ||||||||
| KIRIN1-GRFRET | donor | 505/515 | 251 | 6.2 | 20 | 2560 | ND | ND | ND | ||
| acceptor | 559/600 | 128 | 5.3 | ||||||||
| GEPIIFRET | donor | 457/475 | ND | ND | 220 | 420–26,000 | 0.75 | ND | ND | [48] | |
| acceptor | 515/527 | ||||||||||
| GINKO1 | 502/514 | 22 | ND | 250 | 420 | ND | ND | ND | [47] | ||
a ®, ratiometric, FRET—Förster (fluorescence) resonance energy transfer (FRET)-based indicator, BRET—bioluminescence resonance energy transfer (BRET)-based indicator. b Excitation/emission wavelengths for the brightest state. For ratiometric and FRET-based indicators two wavelengths or two pairs of wavelengths correspond to apo- and saturated-states or ex/em of the donor and acceptor, respectively. c Brightness is a product of quantum yield and extinction coefficient normalized to the brightness of EGFP. For ratiometric and FRET-based indicators brightness of apo- and saturated-states or fluorescent protein acceptor and donor are shown, respectively, *—two-photon brightness. d Dynamic range is maximally achievable ΔF/F between calcium/potassium-saturated and apo-states. e Kd is the equilibrium calcium dissociation constant in the presence of 1mM MgCl2, * Kd values measured in the absence of 1mM MgCl2; f koff are the off kinetics of dissociation from calcium/potassium ions measured using stopped flow fluorimetry. ND—not determined.
Table 2.
Performance of selected genetically-encoded and hybrid fluorescent voltage sensors.
| Sensor | Ex/Em (nm) | ΔF/FAP (%) | SNR | On Kinetics a (ms) | Off Kinetics a (ms) | Number of Simultaneously Imaged Neurons In Vivo | Ref |
|---|---|---|---|---|---|---|---|
| Ace2N-4aa-mNeon | 506/517 | −6.5 | ND | 0.37 (58)/5.5 | 0.5 (60)/5.9 | 2 in primary visual cortex L2/3 | [84] |
| ASAP3 | 485/510 | −10 b | 19 b | 0.94 (72)/7.2 | 3.8 (76)/16 | 1 in primary visual cortex L1 and L2/3 | [81] |
| Voltron525 | 525/549 | −6.5 b | 27 b | 0.64 (61)/4.1 | 0.78 (55)/3.9 | 46 in primary visual cortex L1 | [82] |
| VARNAM | 558/592 | −4.8 | 12 | 0.9/5.2 | 0.8/4.7 | Aggregated population signal | [80] |
| QuasAr2 | 590/715 | 15 | 8.5 | 0.3 (62)/3.2 | 0.3/(73) 4.0 | 14 in mouse nodose ganglia | [99] |
| paQuasAr3 | 590/715 | 23 b | 28 b | 0.9 (57)/15 | 0.93 (79)/15 | 6 in hippocampus | [60] |
| Archon1 | 590/715 | 53 b | 37 b | 0.61 (88)/8.1 c | 1.1 (88)/13 c | 18 in CA1 hippocampus | [65] |
Ex—excitation wavelength; Em—emission wavelength; SNR—signal-to-noise ratio per single action potential measured in intact mouse brain slice at 22 °C under wide-field microscopy at 500 Hz acquisition rate; ND—not determined. a voltage kinetics evaluated by bi-exponential fitting (in the format fast/slow), where the value in parentheses represents the % of current magnitude in the fast τ component, measured in HEK cells at 34 °C; b values measured for soma localized version of the sensor; c measured in cultured neurons.
Table 3.
Characteristics of selected genetically-encoded fluorescent neurotransmitter reporters.
| Sensor | Ligand | Ex/Em (nm) | ΔF/F (%) | Kd (µM) | On Kinetics (ms) | Off Kinetics (ms) | In Vivo Imaging | Ref |
|---|---|---|---|---|---|---|---|---|
| iGluSnFR | Glu a | 490/510 | 100 | 4.9 | 15 | 92 | Single dendritic spines | [127] |
| SF-iGluSnFR-A184S | Glu a | 490/510 | 69 | 0.6 | 85 | 450 | Single dendritic spines | [130] |
| SF-iGluSnFR-S72A | Glu a | 490/510 | 250 | 34 | 5 | 11 | Single dendritic spines | [130] |
| SF-Venus-iGluSnFR | Glu a | 515/528 | 66 | 2.0 | ND | ND | Single dendritic spines | [130] |
| iGluu | Glu a | 490/510 | 170 | 53 | 0.7 | 3 | Not tested | [129] |
| R-iGluSnFR1 | Glu a | 562/588 | −33 | 18 | ND | ND | Not tested | [131] |
| iGABASnFR | GABA | 485/510 | 10 b | ~9 b | ~25 c | ~60 c | Aggregated neuropil imaging | [132] |
| GlyFS | Gly | 434/477 515/528 (FRET) | 28.3 19.0 | 28 21 | ND | ND | Not tested | [133] |
| dLight1.1 | DA | 490/516 | 230 d | 0.33 d | ND | ND | Aggregated signal | [134] |
| dLight1.2 | DA | 490/516 | 340 d | 0.77 d | 9.5 e | 90 e | Aggregated signal | [134] |
| GRABDA1m | DA | 490/510 | 90 | 0.13 | 80 e | 3100 e | Aggregated signal | [135] |
| GRABDA1h | DA | 490/510 | 90 | 0.01 | 110 e | 17,150 e | Aggregated signal | [135] |
| GACh2.0 | ACh | 490/510 | 90 | 2 | 280 d | 760 d | Single neurons with 15 trails averaging | [136] |
| GRABNE1m | NE | 490/510 | 230 | 1.9 | 72 d | 680 d | Aggregated signal | [137] |
| GRABNE1h | NE | 490/510 | 150 | 0.093 | 36 d | 1890 d | Not tested | [137] |
| iTango2 | DA | 488/507 554/581 | 900 | ND | ~105-106 | NA | Single neurons | [138] |
Ex—excitation wavelength; Em—emission wavelength; ΔF/F—maximally achievable fluorescence changes between ligand-free and ligand saturated states; Kd—ligand dissociation constant measured for cultured neurons expressing corresponding sensor, unless otherwise stated; ND—not determined; NA—not applicable. a shows similar affinity for Asp; b characterized in vitro; c estimated from the trace for one action potential in cultured neurons presented in the corresponding publication; d measured in HEK cells; e measured in acute brain slice.
© 2019 by the authors. Licensee MDPI, Basel, Switzerland. This article is an open access article distributed under the terms and conditions of the Creative Commons Attribution (CC BY) license (http://creativecommons.org/licenses/by/4.0/).
Share and Cite
MDPI and ACS Style
Piatkevich, K.D.; Murdock, M.H.; Subach, F.V. Advances in Engineering and Application of Optogenetic Indicators for Neuroscience. Appl. Sci. 2019, 9, 562. https://doi.org/10.3390/app9030562
AMA Style
Piatkevich KD, Murdock MH, Subach FV. Advances in Engineering and Application of Optogenetic Indicators for Neuroscience. Applied Sciences. 2019; 9(3):562. https://doi.org/10.3390/app9030562
Chicago/Turabian StylePiatkevich, Kiryl D., Mitchell H. Murdock, and Fedor V. Subach. 2019. "Advances in Engineering and Application of Optogenetic Indicators for Neuroscience" Applied Sciences 9, no. 3: 562. https://doi.org/10.3390/app9030562
Note that from the first issue of 2016, this journal uses article numbers instead of page numbers. See further details here.