Application of Self-Organizing Neural Networks to Electrical Fault Classification in Induction Motors


Department of Electrical Machines, Drives and Measurements, Wroclaw University of Science and Technology, 50-370 Wroclaw, Poland
*
Author to whom correspondence should be addressed.
Appl. Sci. 2019, 9(4), 616; https://doi.org/10.3390/app9040616
Submission received: 31 December 2018
/
Revised: 27 January 2019
/
Accepted: 8 February 2019
/
Published: 13 February 2019
(This article belongs to the Special Issue Fault Detection and Diagnosis in Mechatronics Systems)
Abstract
:Electrical winding faults, namely stator short-circuits and rotor bar damage, in total constitute around 50% of all faults of induction motors (IMs) applied in variable speed drives (VSD). In particular, the short circuits of stator windings are recognized as one of the most difficult failures to detect because their detection makes sense only at the initial stage of the damage. Well-known symptoms of stator and rotor winding failures can be visible in the stator current spectra; however, the detection and classification of motor windings faults usually require the knowledge of human experts. Nowadays, artificial intelligence methods are also used in fault recognition. This paper presents the results of experimental research on the application of the stator current symptoms of the converter-fed induction motor drive to electrical fault detection and classification using Kohonen neural networks. The experimental tests of a diagnostic setup based on a virtual measurement and data pre-processing system, designed in LabView, are described. It has been shown that the developed neural detectors and classifiers based on self-organizing Kohonen maps, trained with the instantaneous symmetrical components of the stator current spectra (ISCA), enable automatic distinguishing between the stator and rotor winding faults for supplying various voltage frequencies and load torque values.
1. Introduction
Nowadays variable speed drives (VSD) with induction motors (IM) are widely used in many industrial processes and plants. During the operation of IM-VSD, different types of damage occur in the electrical circuits of the stator and rotor, in the mechanical system of the motor and the loading machine, in coupling elements as well as in the power converters, control systems and measuring sensors [1]. Statistical surveys of electrical machine failures were conducted in previous years by various independent centres and the published results were slightly different from one another [2,3,4,5,6]. The quantitative share of individual types of damage of induction motors is reported as follows:
- bearings–~40%,
- stator faults–~38%,
- rotor faults–~10%,
- others–~12%.
The pulse frequencies of pulse width modulation (PWM) converters suppling modern VSDs were increased to 20 kHz due to the rapid progress in the switching devices. A very short rise time of each modulated signal wave front causes a highly non-linear voltage distribution among various tums in the winding and often results in high voltage stresses [6,7,8]. These stresses are several times higher than those caused by sinusoidal waveforms and negatively affect the stator winding insulation. This in turn causes the degradation of the winding insulation over time and can lead to an increase in stator winding faults and, as a consequence, to an outage of the whole drive system [6,8].
Modern inverter-fed VSDs introduce additional problems to the failure detection and extraction of fault symptoms [8,9,10]. It results from variable (regulated) power frequency, variable load conditions, the influence of PWM modulation of high frequency on diagnostic signals, current and voltage distortion, voltage surge, the occurrence of voltage and current zero-sequence components. Therefore, for the diagnosis of VSD systems, it is necessary to use appropriate measuring and processing equipment.
As seen above, electrical winding faults, namely stator short-circuits and rotor bar damage, together constitute around 50% of all faults of the induction motors (IMs) applied in VSDs. The most common electrical faults of IMs are failures of the stator windings, especially inter-turn insulation. Damage to the main and interphase insulation is less frequent. Stator faults usually start as inter-turn short circuits (ITSC). When an ITSC occurs, extremely high currents flowing in the short-circuited coil cause the propagation of destruction [4,5,6,7,8]. Hence, early and accurate incipient faults detection in this machine is crucial. If incipient stator faults are not diagnosed, it may result in severe phase to phase or phase to ground short circuits. This in turn may lead to a catastrophic damage of machine core and windings. Thus ITSCs of the stator windings are recognized as among the most difficult failures to detect, because detection makes sense only at the initial stage of the damage. For low-voltage motors, incipient stator fault detection procedures are yet to be standardized [10,11,12].
Damages to IM rotors (breaks of bars or a squirrel-cage ring or connections of bars with rings) and the resulting asymmetries are a relatively frequent cause of IM failures. They occur mainly in motors that work in difficult conditions or are subject to frequent and long starts. Damage to the cage (degeneration of welds between the cage bars and the shortening ring, ring section cracks, bar cracks) starts with a fault to the individual segments of rings or several bars. The damage leads to unfavourable phenomena in the motor: vibrations caused by alternating electromagnetic torque components, uneven magnetic tension, increased motor slip, imbalance and eccentricity of the rotor. As a result, during further exploitation the machine damage expands (e.g., mechanical damage to the stator insulation system occurs), and consequently an emergency stop of the industrial process and the necessity of replacing or repairing the motor may follow. Similarly, as in the case of stator winding failures, the consequences obviously encompass significant losses in production and large costs. This is why the diagnosis of this kind of damage makes sense only at the initial stage [4]. When a fault is detected early, it is possible to prevent it from spreading to other coils of stator winding or rotor bars. Therefore, both stator and rotor winding faults have attracted much attention over the last decades.
For ITSC faults (in low-voltage motors) intensive tests were carried out using various variables, methods and techniques, in open- [13,14] and closed-loop drives [15,16]. The symptoms of damage to stator windings occur in many signals available directly by measurements or indirectly—by calculated (estimated) quantities [13,14,15,16,17]. Most of the significant methods and related techniques are based on monitoring one or more signals and the use of advanced signal processing methods. An overview of these methods is presented in detail in [18,19,20,21,22,23,24,25,26,27], where the ITSCs are detected in the stator phase current [18], in the phase shift between phase currents, phase shift between current and stator voltage [14,19], axial flux [2,20], instantaneous active and reactive power [21] or mechanical vibrations [22]. The most popular signal processing methods are based on motor current signature analysis (MCSA) [1,2,7], symmetrical components analysis (SCA) [23,24,25,26,27,28,29] and the stator current Park’s vector approach analysis [29,30].
The detection of ITSC using SCA is based on studying the variation of the amplitude of the negative-sequence component of the stator current or the motor impedance [13,14,23]. When choosing these methods, their sensitivity to the asymmetry of supply voltages is an important issue [24]. In the case of an IM supplied from frequency converter the ITSC can be detected using instantaneous symmetrical components as presented in [25,26]. A spectral analysis of the instantaneous negative-sequence component of the stator current makes it possible to find characteristic frequencies whose amplitude strongly depends on the degree of damage to the stator windings.
The diagnostic information contained in the zero sequence symmetrical component of the stator voltage [27] can also be used to detect shorted turns in the stator winding. This component also shows symptoms of damage to the cage rotor [28]. In the case of the asymmetry of the stator and rotor windings in the zero voltage waveforms, there are deformations with specific characteristic frequencies that can be distinguished in the Fast Fourier Transform (FFT) analysis. However, in order to diagnose the motor windings by monitoring the zero voltage component, a neutral point of the stator windings must be available. Thus, it should be noted that the measurement of the zero voltage component in industrial conditions is difficult to implement due to safety reasons.
The problem of detecting damage to cage rotors also has a rich bibliography. The discussion on most of the methods used is included, among others, in [29,30]. To detect damage in cage rotors, the most commonly used methods are the Motor Current Signal Analysis (MCSA) and the Extended Park’s Vector Analysis (EPVA) [29,30,31,32]. They are effective and feasible methods based on non-invasive measurement of the stator current. The processing of the current signal or the spatial vector module of the stator current by means of the FFT, allows us to obtain the information on the frequency spectrum characteristic to the cage rotor failures (so-called slip frequencies). On the basis of the evaluation of their amplitude value, the technical condition of the rotor is evaluated. The accuracy of calculations is greatly influenced by the frequency resolution, noise and the leakage of the fundamental frequency harmonic as well as the motor load level and hence this method is not recommended in nonstationary processes. Therefore, more advanced signal processing methods are used, including time-frequency analysis, such as Short-Time Fourier Transform (STFT), Wavelet Transform (WT) or Higher Order Transform (HOT) [30,31,32]. Symptoms of damage to cage rotors can also be detected in the axial flux, measured by means of additional measuring coils installed in the axis of the motor shaft, outside or inside the machine [31].
The analysis of the symmetrical components of the stator current can also be used to detect the asymmetry of the rotor windings. Similarly to the MCSA analysis, characteristic frequencies associated with rotor damage appear in the spectra of the instantaneous components of the positive- and negative-sequence of the stator current [26].
Thus the diagnostics of IM winding faults constitutes a complex problem that requires the measurement data acquisition of chosen state variables of the drive system, signal pre-processing to extract the fault symptoms, which can help the diagnostic system to detect the fault and evaluate its level. The fault symptom classification is much more difficult when diagnostic signal changes are not unequivocal and the number of datasets is large. The classification of such data is very difficult but the application of artificial intelligence methods can help to solve this problem and enables the objectification and automation of this process [1,2,33,34,35,36].
From early 2000, feedforward multilayer neural networks trained with the Levenberg‒Marquardt algorithm have been applied for the detection of different IM faults: electrical and mechanical types (see [25,26,33,34,35,36,37,38,39] among many others available in technical literature). The Kohonen maps were also used for IM fault detection [33,37,38,39], but literature is not as abundant as in the case of feedforward networks. For example, in [37] the Kohonen Network (KN) with a Winner Takes All (WTA) method was applied to the detection of broken bar faults of IM using classical FFT of stator phase current and slip frequencies as network inputs. The authors report an 98% effectiveness; however, they do not present detailed results. Similar research is presented in [38] for the IM with one or two broken rotor bars. Relatively good results were obtained in the classification of healthy and faulty motor cases, while the separation of faulted classes were much worse. In [39] a Self-Organizing Map (SOM) network trained with the supervised Learning Vector Quantization (LVQ) algorithm was successfully used for mechanical (damage bearings) and electrical (stator winding short-circuit and broken rotor bars) faults classification. The feature extraction was taken from the sound data and wavelet analysis. Only motors with single fault types were tested. In [33] KN was used for multiple faults classification in IM, namely for bearings failures and supply asymmetry recognition, based on the stator current and vibration spectra. It was found there that KN is able to classify different types of faults (electrical and mechanical).
However, according to the best knowledge of the authors, the Kohonen self-organizing networks were not applied to the detection of incipient stator faults as well as for the multiple electrical faults classification of the induction motor windings, namely stator short-circuit turns and rotor bar faults simultaneously. Therefore, the authors are convinced that their work could be considered a novelty, which proves that simple SOMs can be effective in the early detection and classification of incipient electrical faults in IM drives, regardless of whether they occur independently or simultaneously.
Moreover, in our work we have used an analysis of instantaneous symmetrical components, which is a rarely used method in IM fault diagnostics. In particular, this method has not yet been used in the diagnosis of rotor failures, neither was it applied to in the detection of stator and rotor windings simultaneously. In addition, the work presents a ready diagnostic system that allows us to accurately classify electrical faults symptoms of IM and determine fault levels.
In this paper the results of experimental research on the application of stator current symptoms of the converter-fed induction motor drive to the electrical fault detection and classification using Kohonen neural networks are demonstrated. The experimental tests of a diagnostic setup based on a virtual measurement and data pre-processing system, designed in LabView, are described. It has been shown that the developed neural detectors and classifiers based on self-organizing Kohonen maps, trained with the instantaneous symmetrical components of the stator current spectra (SCA), enable the automatic distinguishing between the stator and rotor winding faults for various supplying voltage frequencies and load torque values.
The paper consists of six sections. After the introduction with a brief overview of the technical literature dedicated to fault detection of IM stator and rotor windings, the method of instantaneous symmetrical components analysis (ISCA) is presented in Section 2, as it was used in this research work for the analysis of the electrical winding damage of the induction motor drive. In the next section the main idea and features of the Kohonen self-organizing network are presented. The main part of this article is Section 4 and Section 5. In Section 4 the experimental setup, the data acquisition system and the measured signals pre-processing methodology aimed at fault symptoms detection is described. In Section 5 the experimental results obtained for the developed neural detectors and classifiers based on SMSs are given, together with a discussion of the neural detectors’ efficiency. The paper is concluded with a short summary.
2. Symmetrical Component Analysis of Electrical Winding Faults
The imbalance in three-phase systems, under steady state condition, can be evaluated using the well-known method of symmetrical components analysis (SCA). In the case of the monitoring and diagnostics of different asymmetries in induction motors, the three-phase stator currents are transformed into a symmetrical component coordinate system, according to the following complex Fortescue’s transformation:
where:
- IsA, IsB, IsC—stator phase currents in steady state in phases A, B, C, respectively;
- I0, I1, I2—zero-, positive- and negative-sequence components of the stator current in steady state, respectively;
- .
Equation (1) relates to sinusoidal phase current signals in steady state. In three-phase induction motors there is no zero-sequence current component I0, this is why the calculation of symmetrical components in the steady state is reduced to the calculation of the positive- and negative-sequence components I1, I2, from Equation (1). However, the supply of IMs from PWM inverters additionally introduces a series of harmonics that cause the distortion of voltages and currents, moreover these signals change over time. Thus the classical SCA cannot be used directly in this case.
The concept of symmetrical components described in Equation (1) deals with the phasors and hence is a steady-state concept. However, in the technical literature it was extended to the concept of symmetrical components in the time domain, which is also referred to as instantaneous symmetrical components (ISCA) [40,41]:
where:
- isA(t), isB(t), isC(t)—corresponding instantaneous current signals of the three phases,
- i0, i1, i2—instantaneous zero-, positive-, and negative-sequence symmetrical components of the stator current.
The instantaneous symmetrical components defined by Equation (2) are in general complex signals. According to another definition, which can also apply here, you can get real signals. The idea consists in the replacement of complex phasor a with a 120° phase-shift operator in the time domain [42]. Thus:
where Sx stands for an x-degree phase-angle operator in the time domain.
Another formulation can be derived based on a 90° phase-shift operator that is easier to implement [43]. The idea is to write:
and the result is as follows:
This concept can be defined both on a total signal (such as above) or on its single frequency component (for example its fundamental component). It can be shown that Equations (3) and (5) are equivalent with respect to the fundamental components. Taking into account that in the cage induction motor the zero-sequence current component does not exist, quantities i1, i2 can be presented as the sums of the real and imaginary parts:
where:
In the next step of the ISCA algorithm, the FFT analysis of the calculated instantaneous symmetrical components can be performed, and then on the basis of the spectrum, the fault symptoms may be sought [25].
It is known that the FFT has limitations because it assumes the stationarity of the analysed signals, i.e., that the harmonic components they contain occur all the time and are unchangeable over time. However, in the case of electric faults, analysed in steady-state motor operation, with adequate recording time and high resolution, the assumption of stationarity does lead to major errors in the separation of frequencies (symptoms) characteristic of these failures. The elimination of the basic FFT defect, i.e., the loss of information about the time of the occurrence of individual fault harmonics, is possible through the use of time-frequency analyses, e.g., STFT or WT. In the case of monitoring drives with high dynamics, in conditions of rapid changes of velocity or load moments, the variability of signal states containing components with variable time amplitudes, it becomes necessary to use more complex signal analysis methods. This, however, is associated with an increase in the complexity of calculations and an increase in the time of receiving diagnostic information. Therefore, in most industrial drives, the FFT analysis is a sufficiently accurate tool to obtain diagnostic information and is the most commonly used method of fault diagnosis in electrical machines.
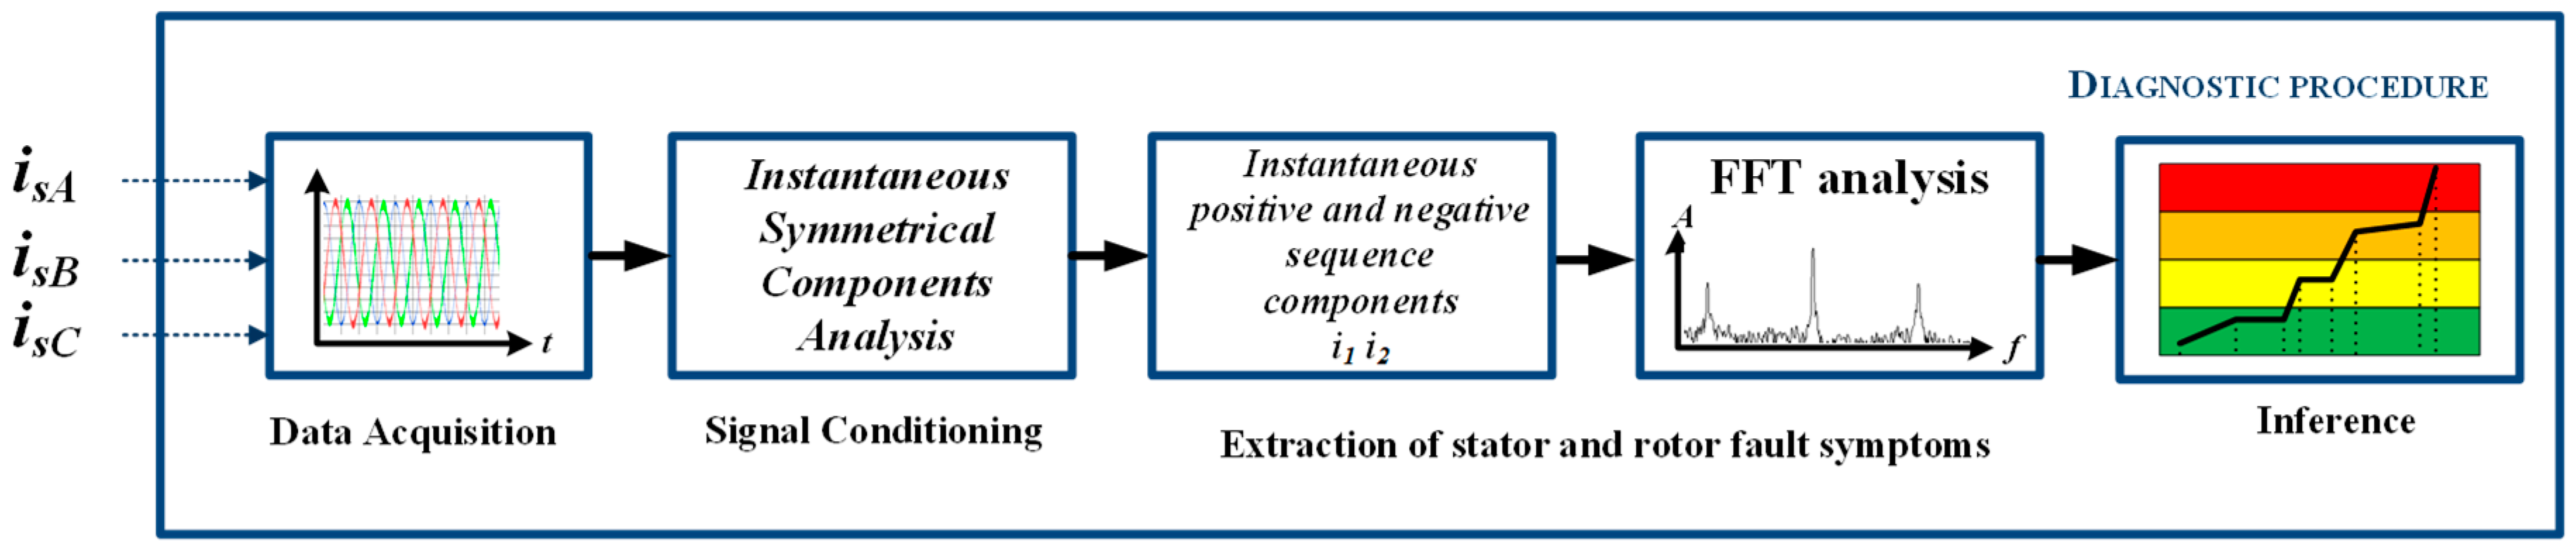
Thus the procedure used in this research for the calculation of the stator and rotor fault symptoms using instantaneous symmetrical components and FFT analysis is presented in Figure 1.
To fulfil the stationarity requirement of the tested signals, the appropriate conditions of the data recording should be met. In the case of a rotor bar failure analysis (whose symptoms depend on motor slip frequency), the data were recorded within 5 s, thus ensuring the spectral resolution at the level of df = 0.2 Hz, which already allows the extraction of appropriate harmonic components with high accuracy. For a damage to the stator winding, the case is simpler because then the change in the amplitude value of supply frequency fs is analysed, thus the data recording time can be at the level of 1 s (or even less).
The instantaneous symmetrical components of the positive and negative sequence of the stator current are used in the further part of this work to evaluate the condition of IM winding with the application of the Kohonen self-organizing maps.
3. Design of the Neural Fault Classifier Based on the Kohonen Network
3.1. General Remarks
Monitoring the technical condition of the drive system involves continuous observation, collection and processing of numerous features of diagnostic signals related to the operation of a given system. The interpretation of the analysis results of these diagnostic signals is a complex process and requires a lot of knowledge about the structure and physical phenomena occurring in the drive. The lack of general methods used to formally record the expert’s diagnostic knowledge makes it very difficult to automate the process of diagnostic inference. Increasingly frequently, artificial intelligence methods using artificial neural networks, fuzzy logic and fuzzy neural networks are used for this purpose [33,34,35]. In diagnostics systems, especially neural networks of different types can be successfully used for the detection and classification of motor drive failures as well as for making decisions about emergency states. The most popular ones are Multi-Layer Perceptron (MLP) networks [33,34,35,36]; however, they are not effective in the classification of different failure types, especially when multiple instances of damage occur. In such cases self-organizing networks can give much better results [33,37,38,39], therefore they are used in this paper.
3.2. Self-Organizing Kohonen Network
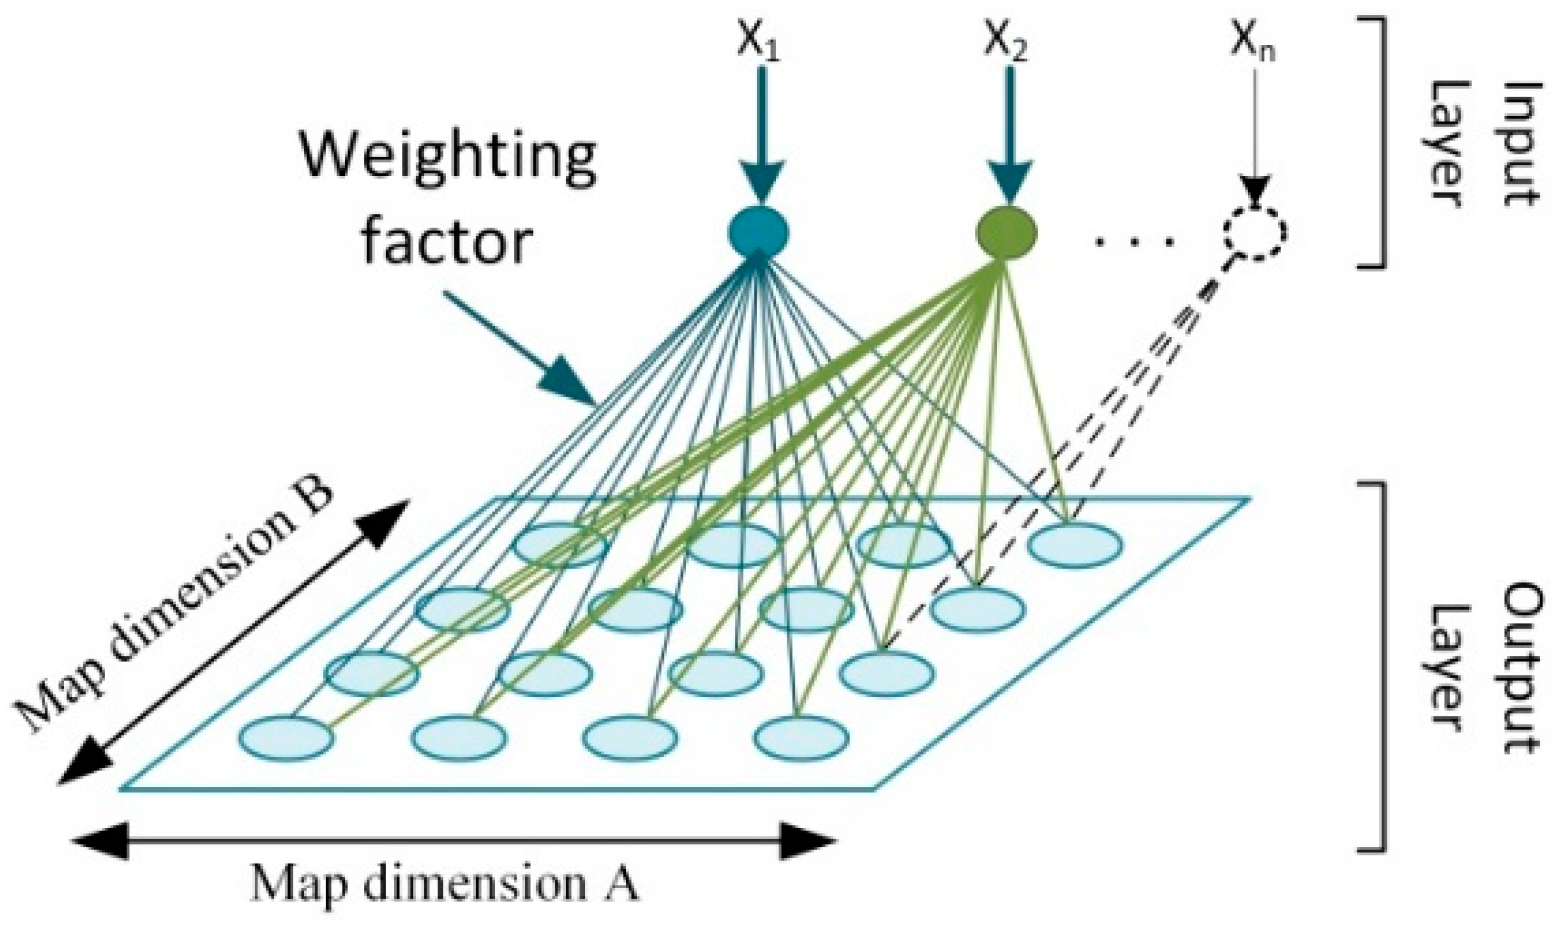
The self-organizing neural network was originally proposed by Kohonen and belongs to the competitive type of networks [44]. A competitive neural network has only two layers: the input layer, and the output–competitive (Kohonen) layer. The input layer neurons are fully connected to each neuron of the competition layer (Figure 2). In this way, the input layer, via a set of connections, sends a complete input pattern to each neuron in the competition layer. Neurons in the Kohonen layer compete with each other to obtain the strongest response, in line with the traditional dependence:
where: wij—weighting factor between ith neuron of input layer and jth neuron of the Kohonen layer, xij—input signal (component of input vector) of the network.
A single neuron, being the winner in this competition, generates +1 at the exit. Other neurons do not generate any signal. In vector notation, the total excitation for each Kohonen layer’s neuron is a scalar product between the input vector and the weight vector. Therefore, the winning neuron is one of those that have the highest value of this product, so the angle between the input vector and the weight vector is the smallest.
Two types of learning with competition are used to teach self-organizing networks. The first one is the WTA algorithm (Winner Takes All) and boils down to teaching (weight change) only the winning neuron. Its modification is the WTM (Winner Takes Most) method, in which neurons belonging to the neighbourhood of the winner are also subjected to learning, but in a degree dependent on the distance from it. The further away, the change in weights is smaller. Thanks to the fact that the neurons are in the vicinity of various winners during learning, their weights are changed in such a way that they become somewhat similar to each of their winning neighbours. Such a network, in which neighbouring neurons are also taught, is called a Self-Organizing Map (SOM).
In the case of the WTA method, the weight wij between the ith neuron of the input layer and jth neuron of the Kohonen layer, being the winner in a given iteration, is modified according to the following rule:
where: η—is the learning coefficient in the range (0; 1).
In the learning process, both the input vector and the vector of the weights should be normalized [37], usually to a unit of length, using the standard Euclidean standardization technique of dividing each vector element by the length of this vector. After completing the learning process, the found weight factors cause the learned element in the output layer to be responsible for a group of patterns similar to each other (cluster). It should be emphasized that the teaching of the Kohonen network proceeds in an unsupervised manner, i.e., only entry patterns are necessary for learning.
WTM learning is used in SOM networks, as it allows us to construct the models of input patterns used in the training process. If a part of the learning patterns has a particular characteristic, the weight vectors automatically assign themselves in such a way as to determine the relative similarities or differences. In a trained SOM network, patterns with similar characteristics will have winning neurons that are either the same or adhere to each other. This allows us to obtain a self-organizing topological map.
In order to find the neurons closest to the winner, a similarity function should be defined that uses the distance between the weight vector wi of the examined neuron and the input vector x, and on this basis the neuron for which this distance is the smallest is selected:
The most frequently used measure is the Euclidean distance:
From the point of view of the neuron network learning process, the neighbourhood of the winning neuron is also important. At the beginning of learning, the neighbourhood includes a very large radius. Then it is gradually reduced until it covers only the winning neuron. This fact is taken into account in the formula for changing the weights in Equation (8), written now in matrix form:
where: —neighbourhood function.
The simplest neighbourhood function proposed by Kohonen is the rectangular neighbourhood function, defined as follows:
or the Gauss function:
where: R—neighbourhood radius, d—distance between the input vector x and the weight vector w of the neuron.
During the learning process, both the neighbourhood and the learning rate are reduced, usually exponentially.
In the basic algorithm of the self-organizing network, both the number of neurons and the network topology are determined from the beginning and do not change in the network learning process. On the other hand, the size of the neighbourhood decreases so that in the final stage the neighbourhood is of zero order and consists only of the considered neuron. Network learning is an iterative process associated with samples k = 1, 2, … The self-learning algorithms of neural networks lead to the sensible adaptation of weights during a self-organization process. Networks taught in this mode will react not only to the values of input signals, but also to the probability of their appearance. Learning will therefore require redundant input data. Rarely occurring input vectors will have less impact on the training process than vectors that appear frequently.
The self-organizing Kohonen map has found many applications in practice. The basic function it performs is to map the topology of input data through a much smaller number of neuron weights that make up the network. Hence, it has found direct application in data compression and diagnostics and is also used in this work for fault classification of IM windings.
4. Analysis of the Diagnostic Signals—Experimental Results
4.1. Short Description of the Experimental Setup
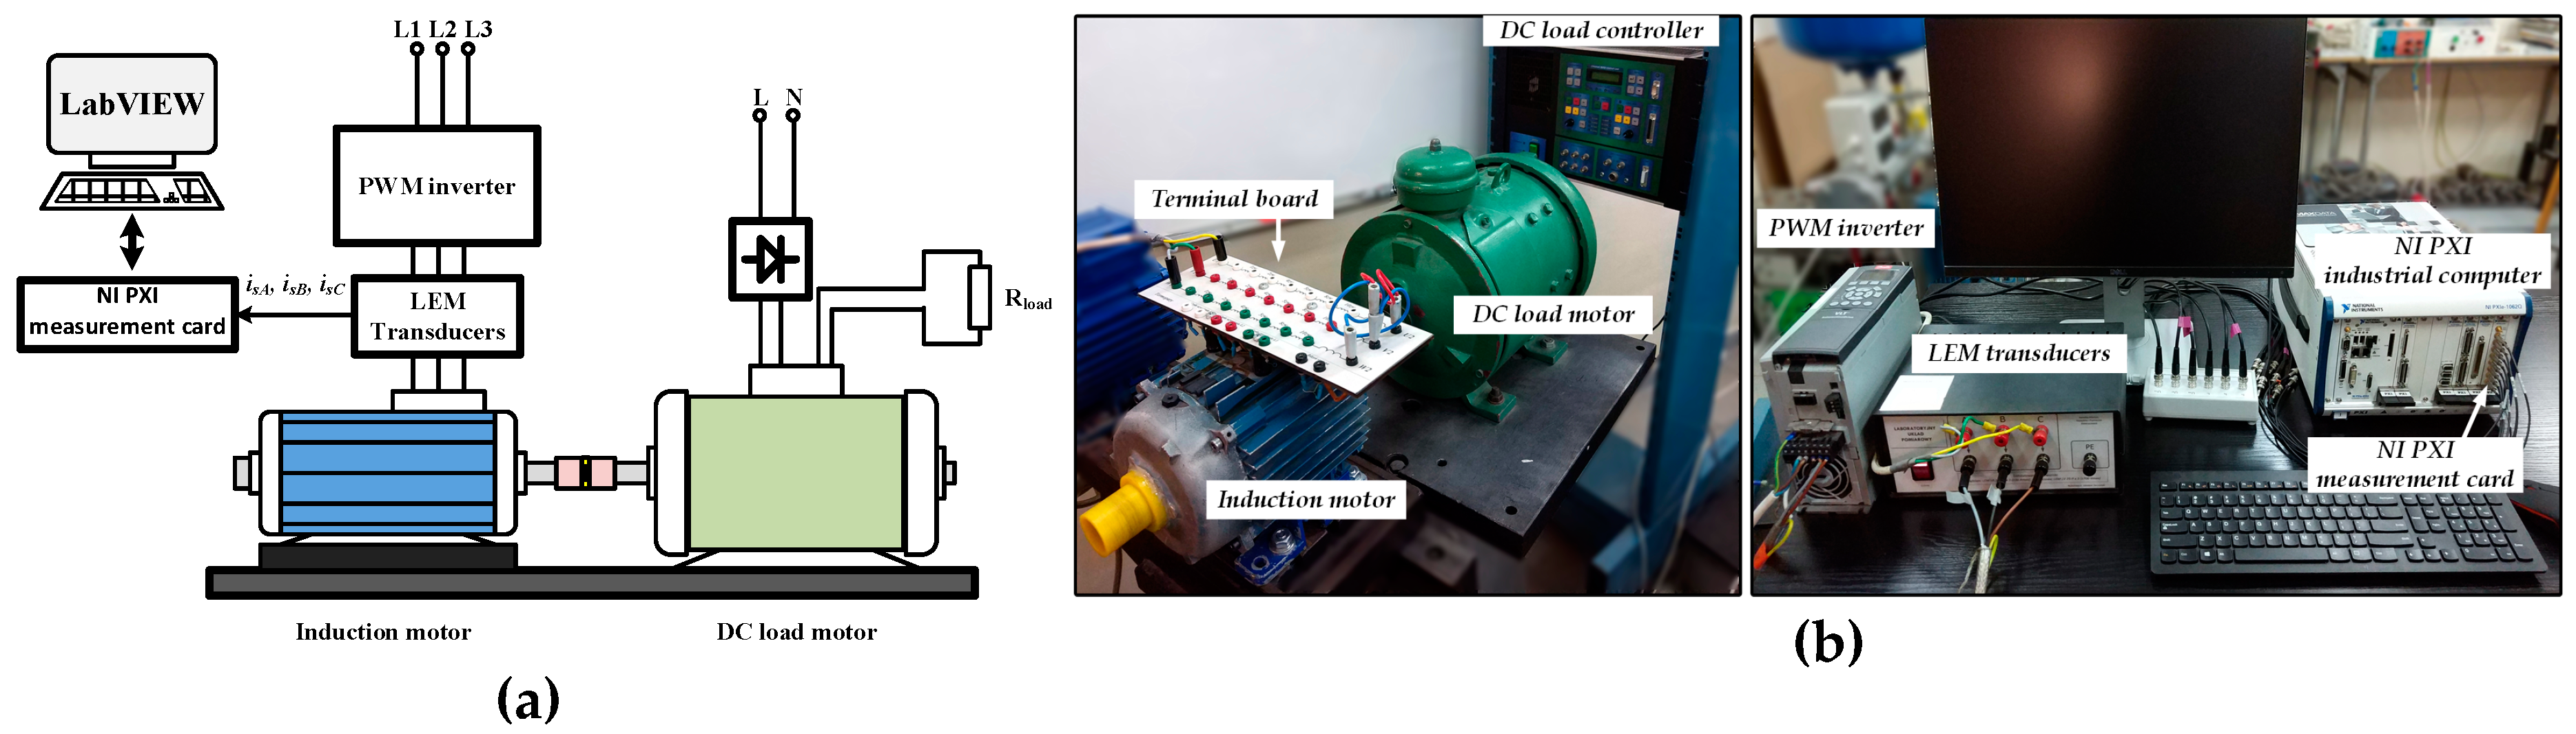
Experimental tests were conducted on a specially designed setup with the induction motor of special construction, which allowed for physical modelling of inter-turn short-circuits in each of three phases of the motor and exchanging of rotors with different rotor bar failures. The squirrel cage induction motor of 1.5 kW was fed from an industrial frequency converter (with 10 kHz modulation frequency), in the frequency range fs = 20 ÷ 50 Hz, operating in an open-loop system under scalar control us/fs = const. The rated data of the motor are presented in Table 1.
The load torque of the tested motor was changed from zero value to nominal load. The measurement data acquisition and analysis of phase currents as well as phase-to-phase stator voltages were conducted using an industrial computer NI PXI 8186 (National Instruments, Austin, TX, USA) equipped with DAQ NI PXI–4472 measurement card with very high resolution. Stator and rotor winding damage monitoring was carried out using a computer measurement and diagnostic system based on virtual tools developed in the LabVIEW environment. To reflect the real nature of the stator winding damage, the current in the shorted turn was not limited with additional resistance. A schematic diagram and the real drive system are presented in Figure 3, while in Figure 4 the details of the fault modelling in stator and rotor windings are shown.
The tests were carried out for various types of stator or rotor winding damage as well as mixed defects. During the tests, special attention was focused on the changing operating conditions of the machine, in order to ensure high efficiency of fault detection regardless of the load torque and reference speed of the drive system.
The conducted research was limited to examining the impact of the following electrical faults of the driving motor:
- 0 ÷ 5 shorted turns of one stator phase that constituted 1.6% of stator turns in phase A,
- 0 ÷ 2 damaged rotor cage bars that constituted 7.7% of rotor bars.
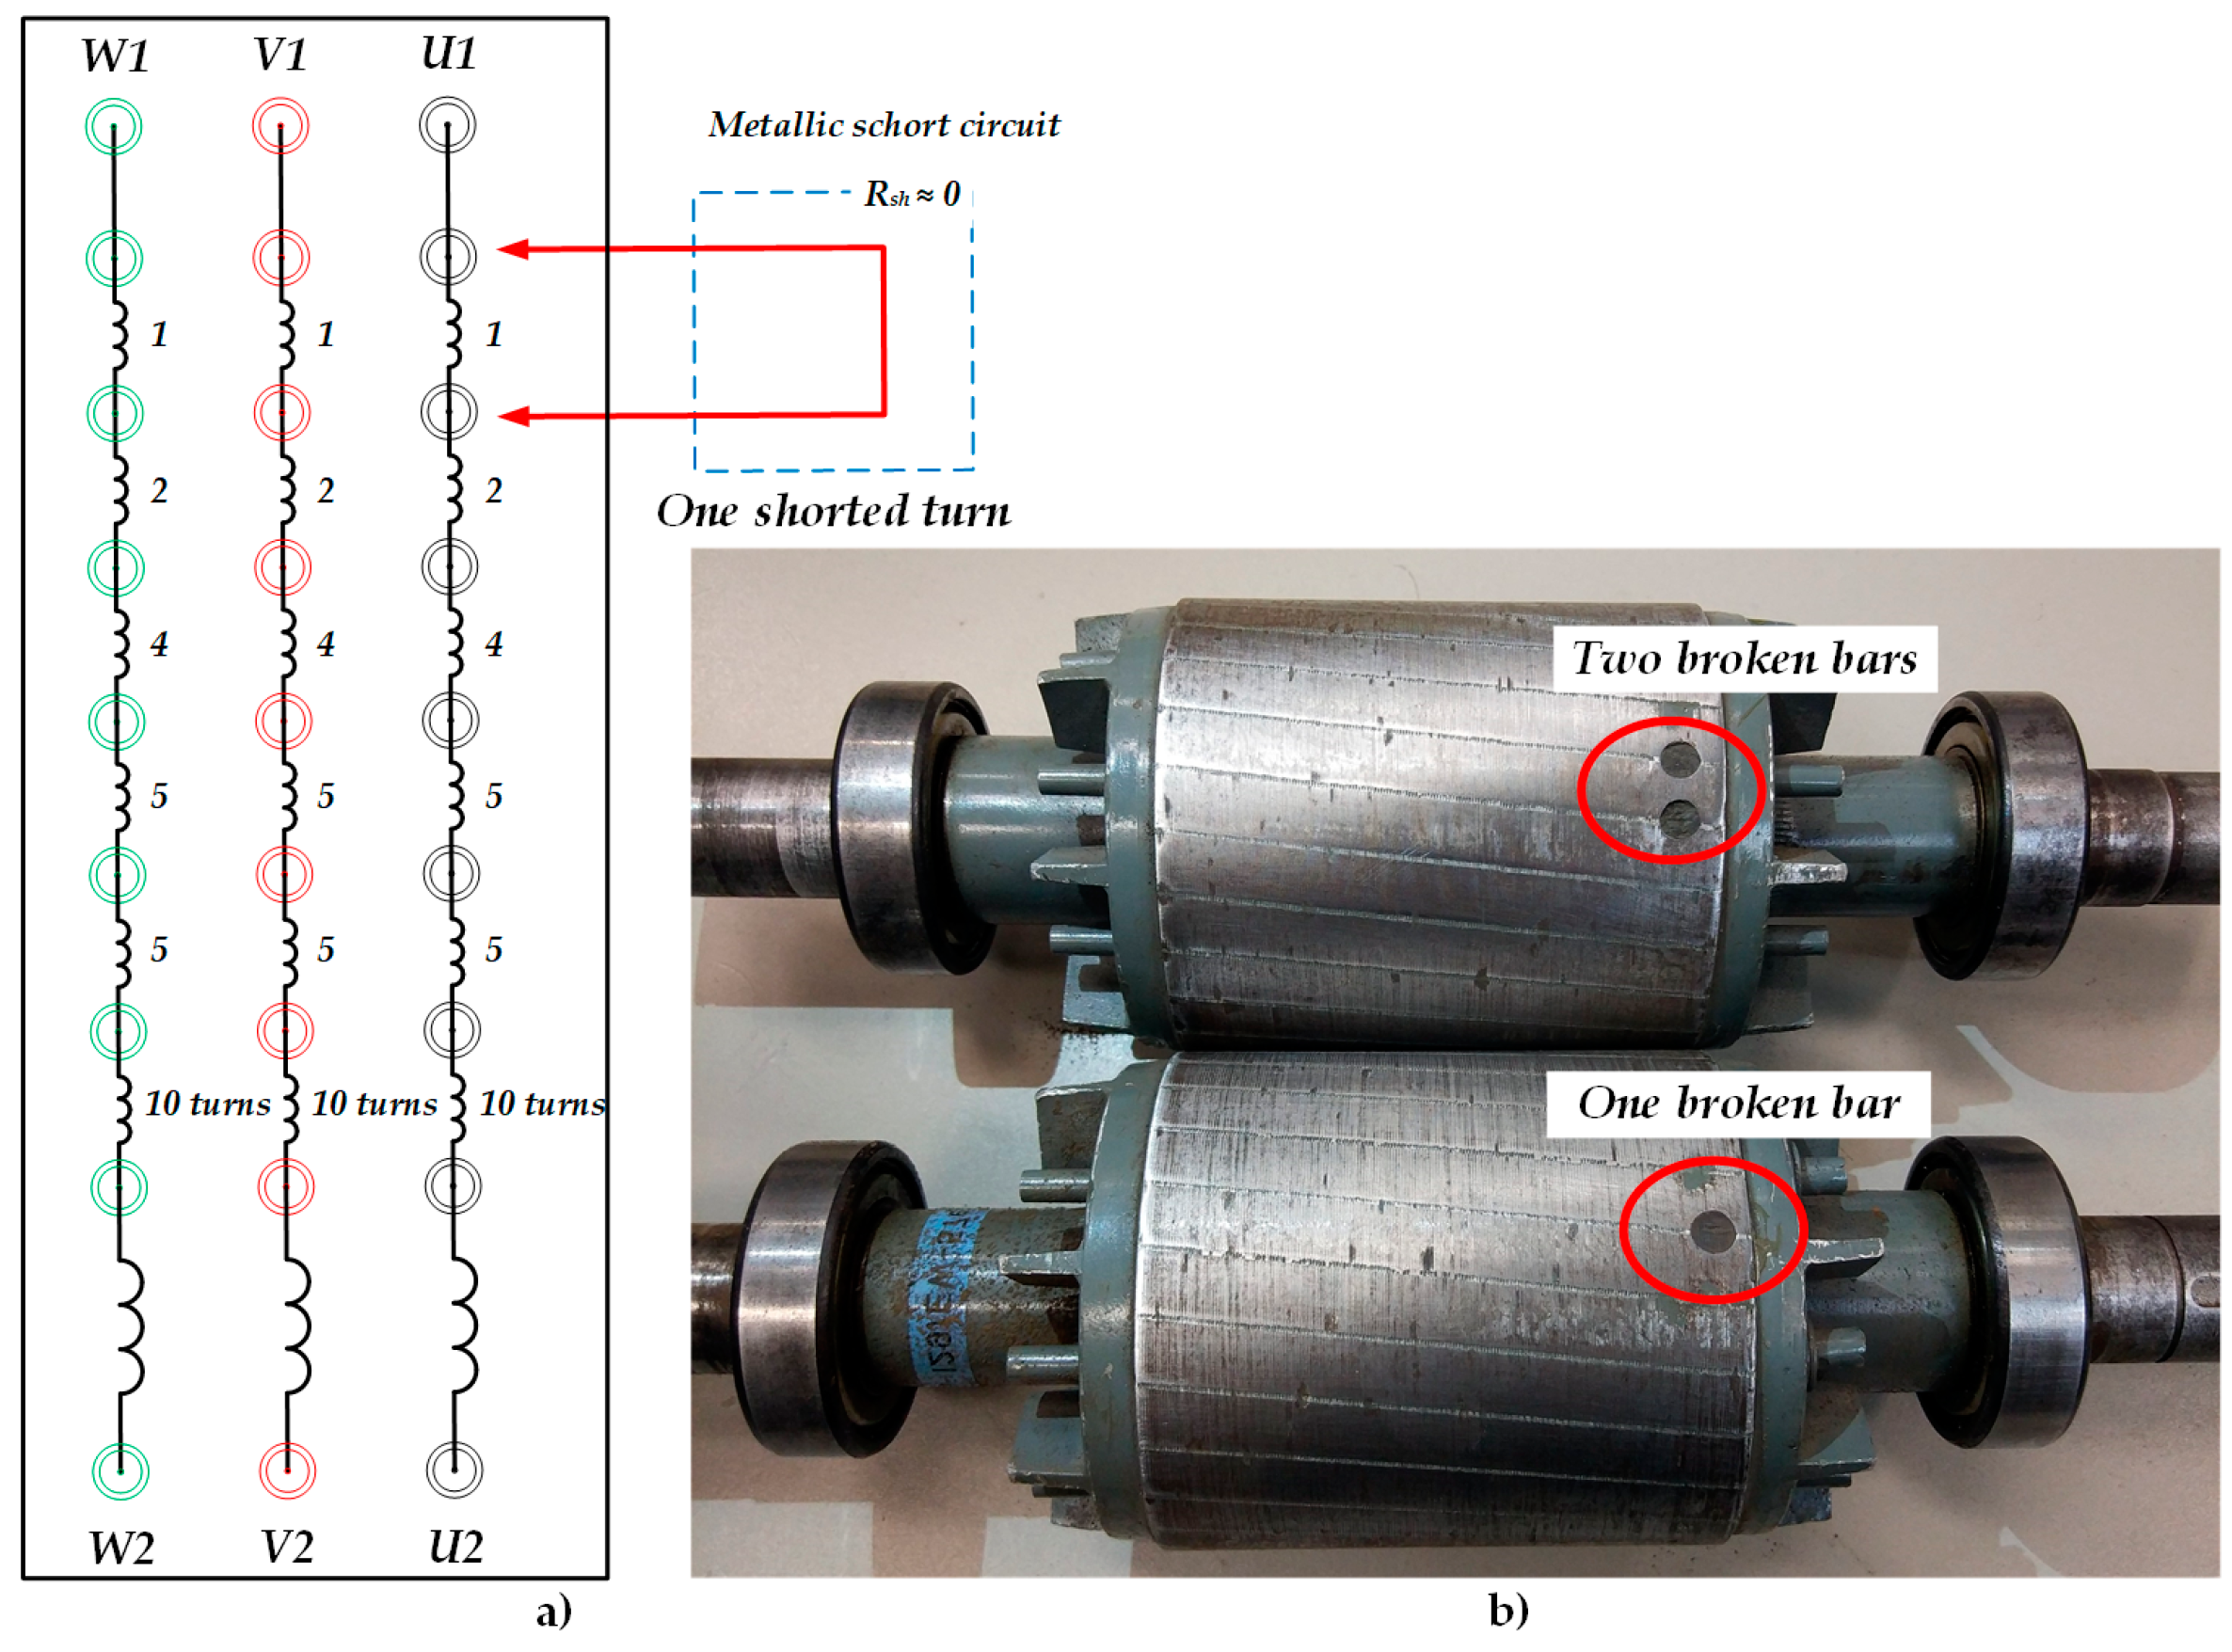
The stator winding has been specially prepared so that you can make a short circuit of the proper number of turns in each phase of the stator. A corresponding group of coils was led out to the terminal board, and the short-circuit was physically modelled through a metallic connection. The research presents the impact of a fault in a single phase of the motor winding (Figure 4a).
Rotor damage, in the form of broken bars, was modelled by preparing rotors with pre-drilled windings. In addition, the resulting holes were sealed to reduce the impact of the rotor imbalance (Figure 4b).
On the basis of the conducted tests, the symptoms of rotor and stator defects of the induction motor were selected in order to start the process of Kohonen networks’ learning. The self-organizing maps were implemented in the LabVIEW environment of National Instruments using Matlab software [45].
4.2. Results of Stator and Rotor Fault Extraction
The characteristic frequency components, that characterize faults in the stator winding (ITSCs) are known as [14]:
where: fs—power supply frequency [Hz], s—slip, pp—number of pole pairs, k = 1, 2, 3,…, m = 1, 3, 5,…
On other hand faults in the rotor windings (broken bars) in the well-known Motor Current Signature Analysis (MSCA) are described as follows [7,29]:
where: k = 1, 2, 3,… (usually in practice k = 1).
These characteristic frequency components for electrical faults could be also searched for in the stator current symmetrical components.
The first part of the research concerned obtaining information on the technical condition of the motor windings and isolating from the spectrum analysis those frequencies that change under the influence of the winding failures, and thus may be symptoms of a given stator or rotor fault. For this purpose, a series of tests and spectral analyses of the instantaneous symmetrical components i1 and i2 of the stator current signals obtained after the FFT were performed for various degrees of damage to the stator winding and rotor bars in accordance with the procedure shown in Figure 1. Sample spectra of the instantaneous symmetrical components are shown in Figure 5 and Figure 6.
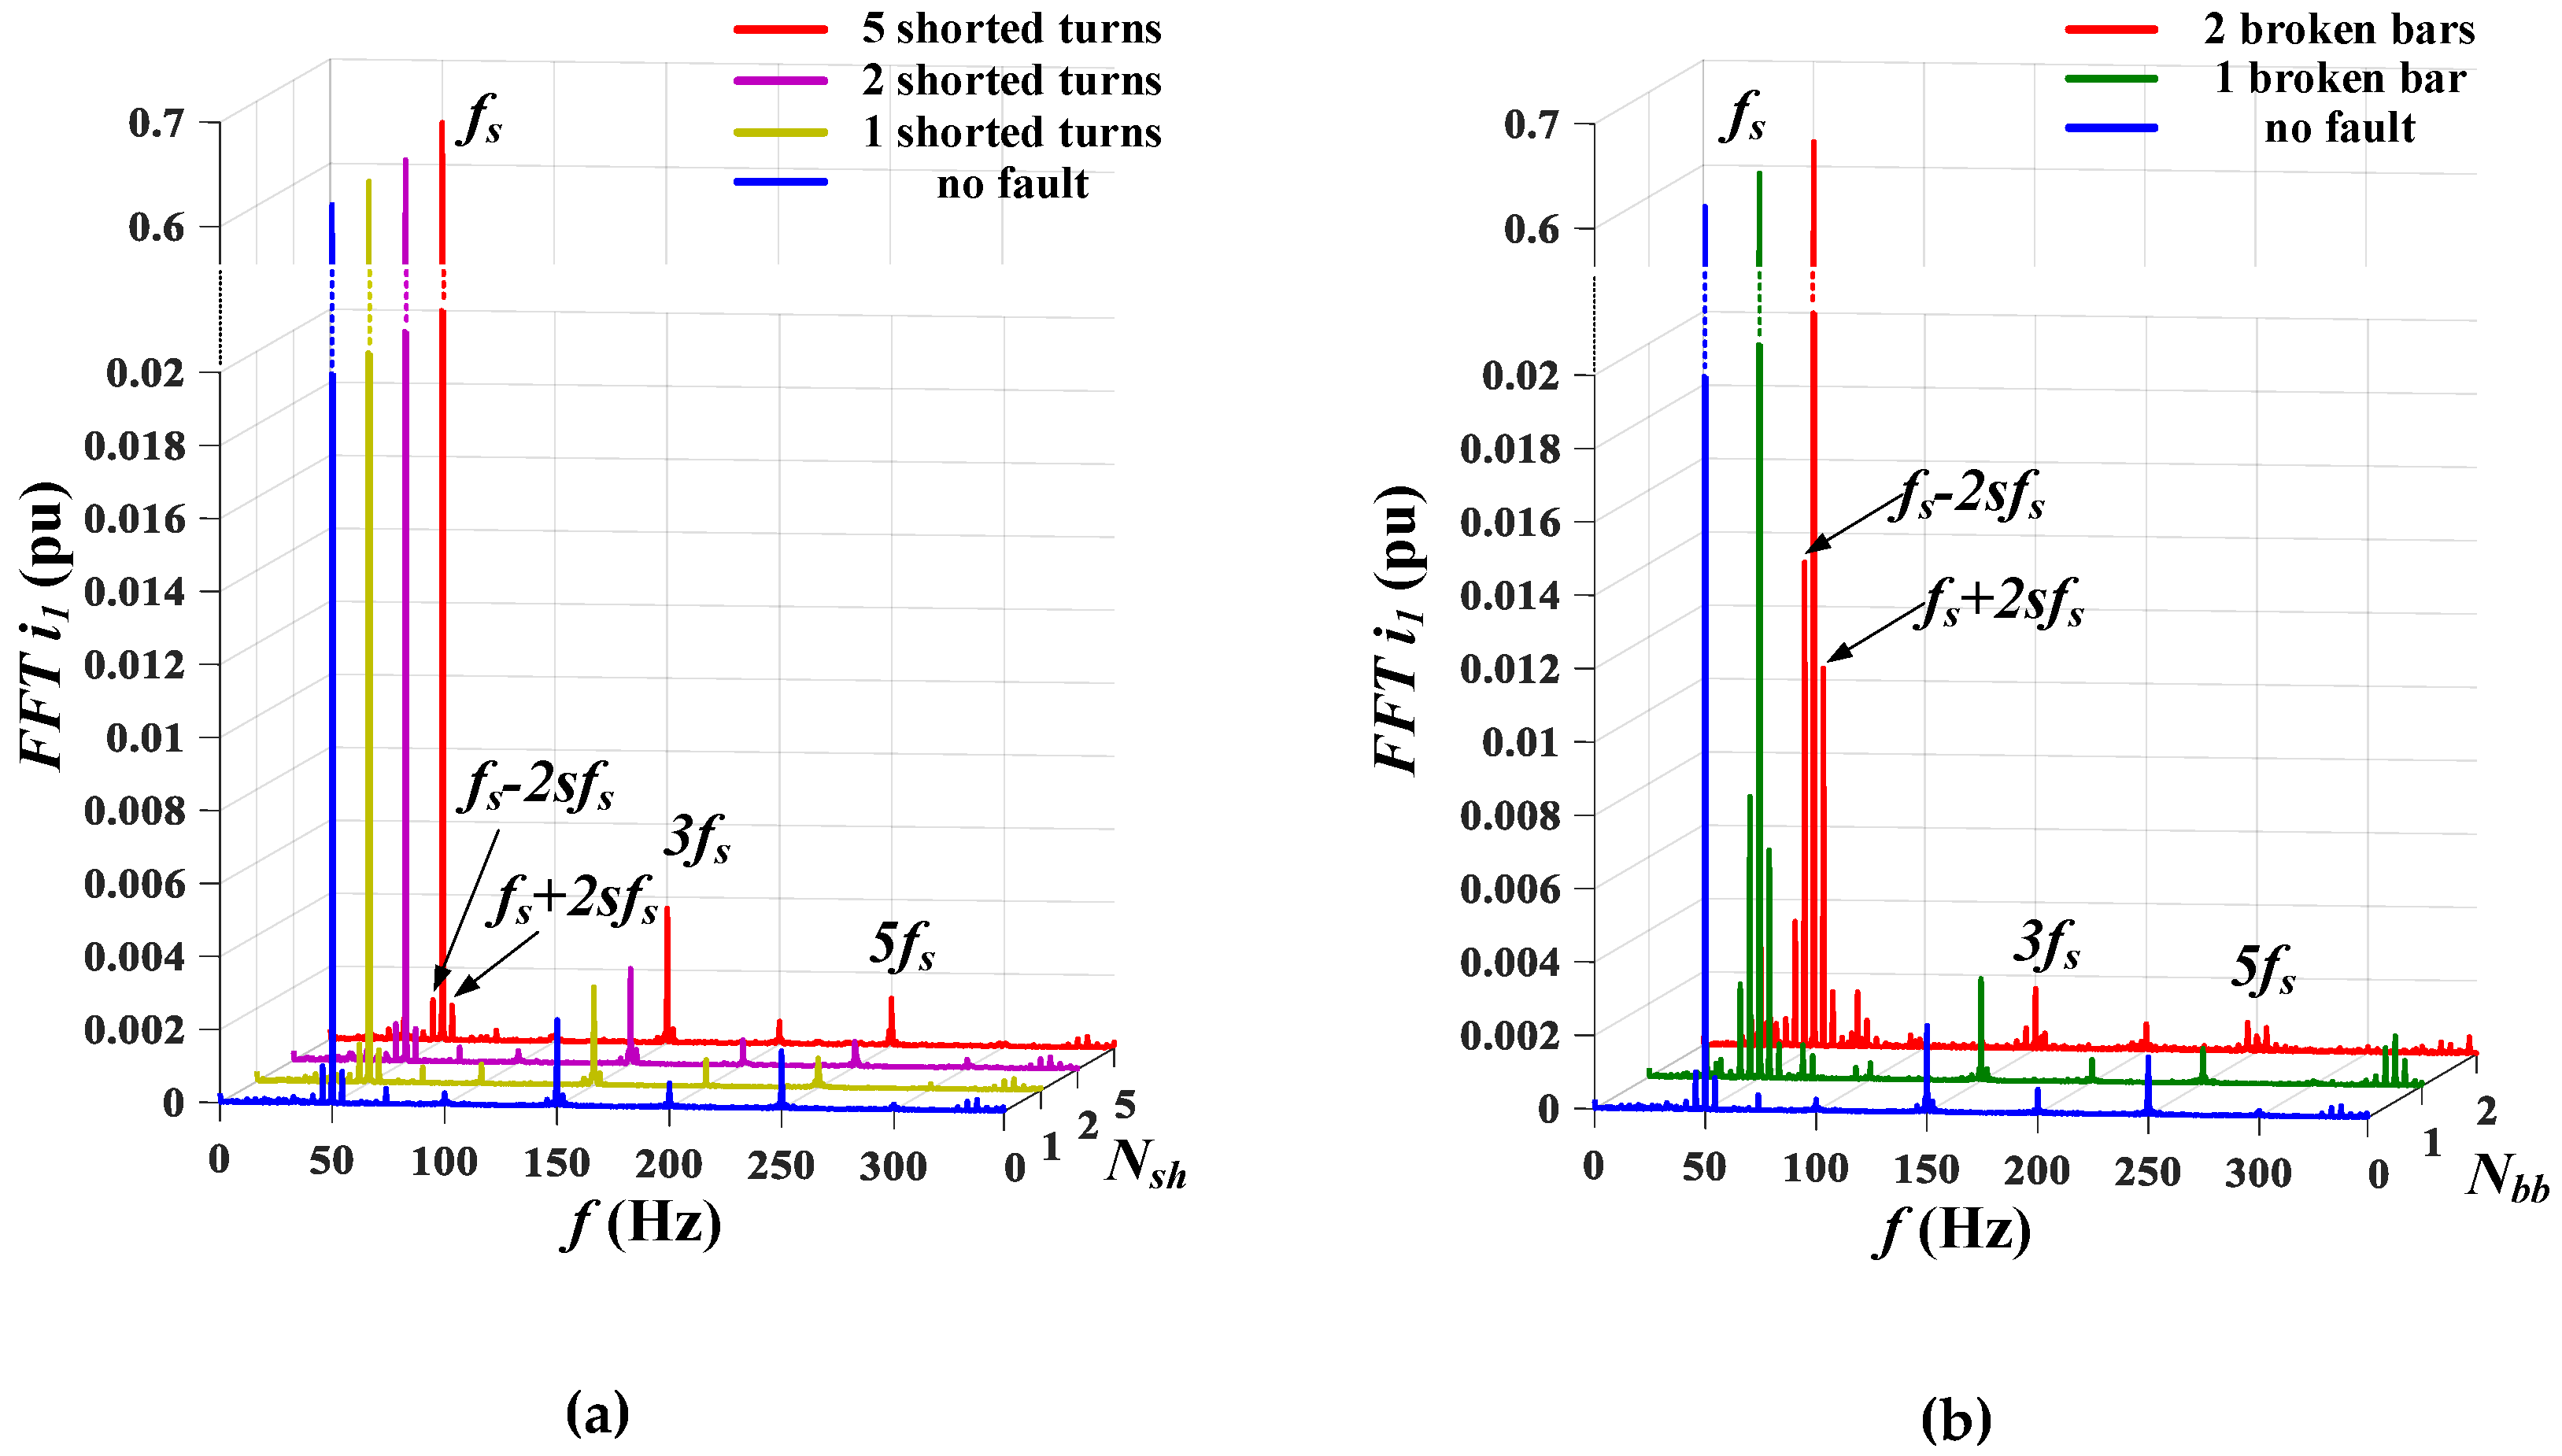
Figure 5 shows the harmonic spectra of the positive-sequence component i1 for a motor loaded with rated torque TL = TLN, under supply voltage with frequency fs = 50 Hz and various defects of the motor windings.
In the case of stator winding short-circuits (Figure 5a), only a slight increase in component fs of the positive-sequence symmetrical component i1 can be seen as a result of the increasing stator winding degradation. However, these changes are too small to be taken into account when diagnosing the stator winding. In addition, the value of the amplitude of component fs strongly depends on the changes of the load torque. The influence of the ITSCs of the stator winding is also visible for the 3fs frequency but only when the damage is relatively high (as e.g., Nsh = 5). This shows practically no changes in spectrum i1 due to the stator winding incipient faults. Thus positive-sequence component i1 does not carry important information for the case of stator winding fault or changes in the initial phase of the failure (for Nsh = 1, 2) are negligible.
In the case of broken rotor bars (Figure 5b), the so-called slip frequencies around the fundamental frequency fs appear, which are characteristic of this type of damage (see Equation (15)). Although they can also be extracted for the undamaged motor, the amplitude level of these components is very small comparing to a faulted rotor case and can be negligible, indicating a non-ideal casting of the rotor cage. However, along with the increase in the degree of damage, the amplitude values of these slip frequencies increase rapidly (for one broken rotor bar it is 10 times more than in the case of an undamaged rotor). On the contrary, the components calculated in accordance with Equation (16) are too low to be extracted directly from the spectrum shown.
Summarizing, the FFT analysis of the instantaneous positive-sequence symmetrical component i1, in particular the changes in the slip frequency amplitudes calculated according to Equation (15) for k = 1: fs − 2sfs and fs + 2sfs, can be used to diagnose the rotor windings of the squirrel cage motor. However, it should be noted that they are in close proximity to the fundamental frequency component and for low motor loads will be difficult to isolate.
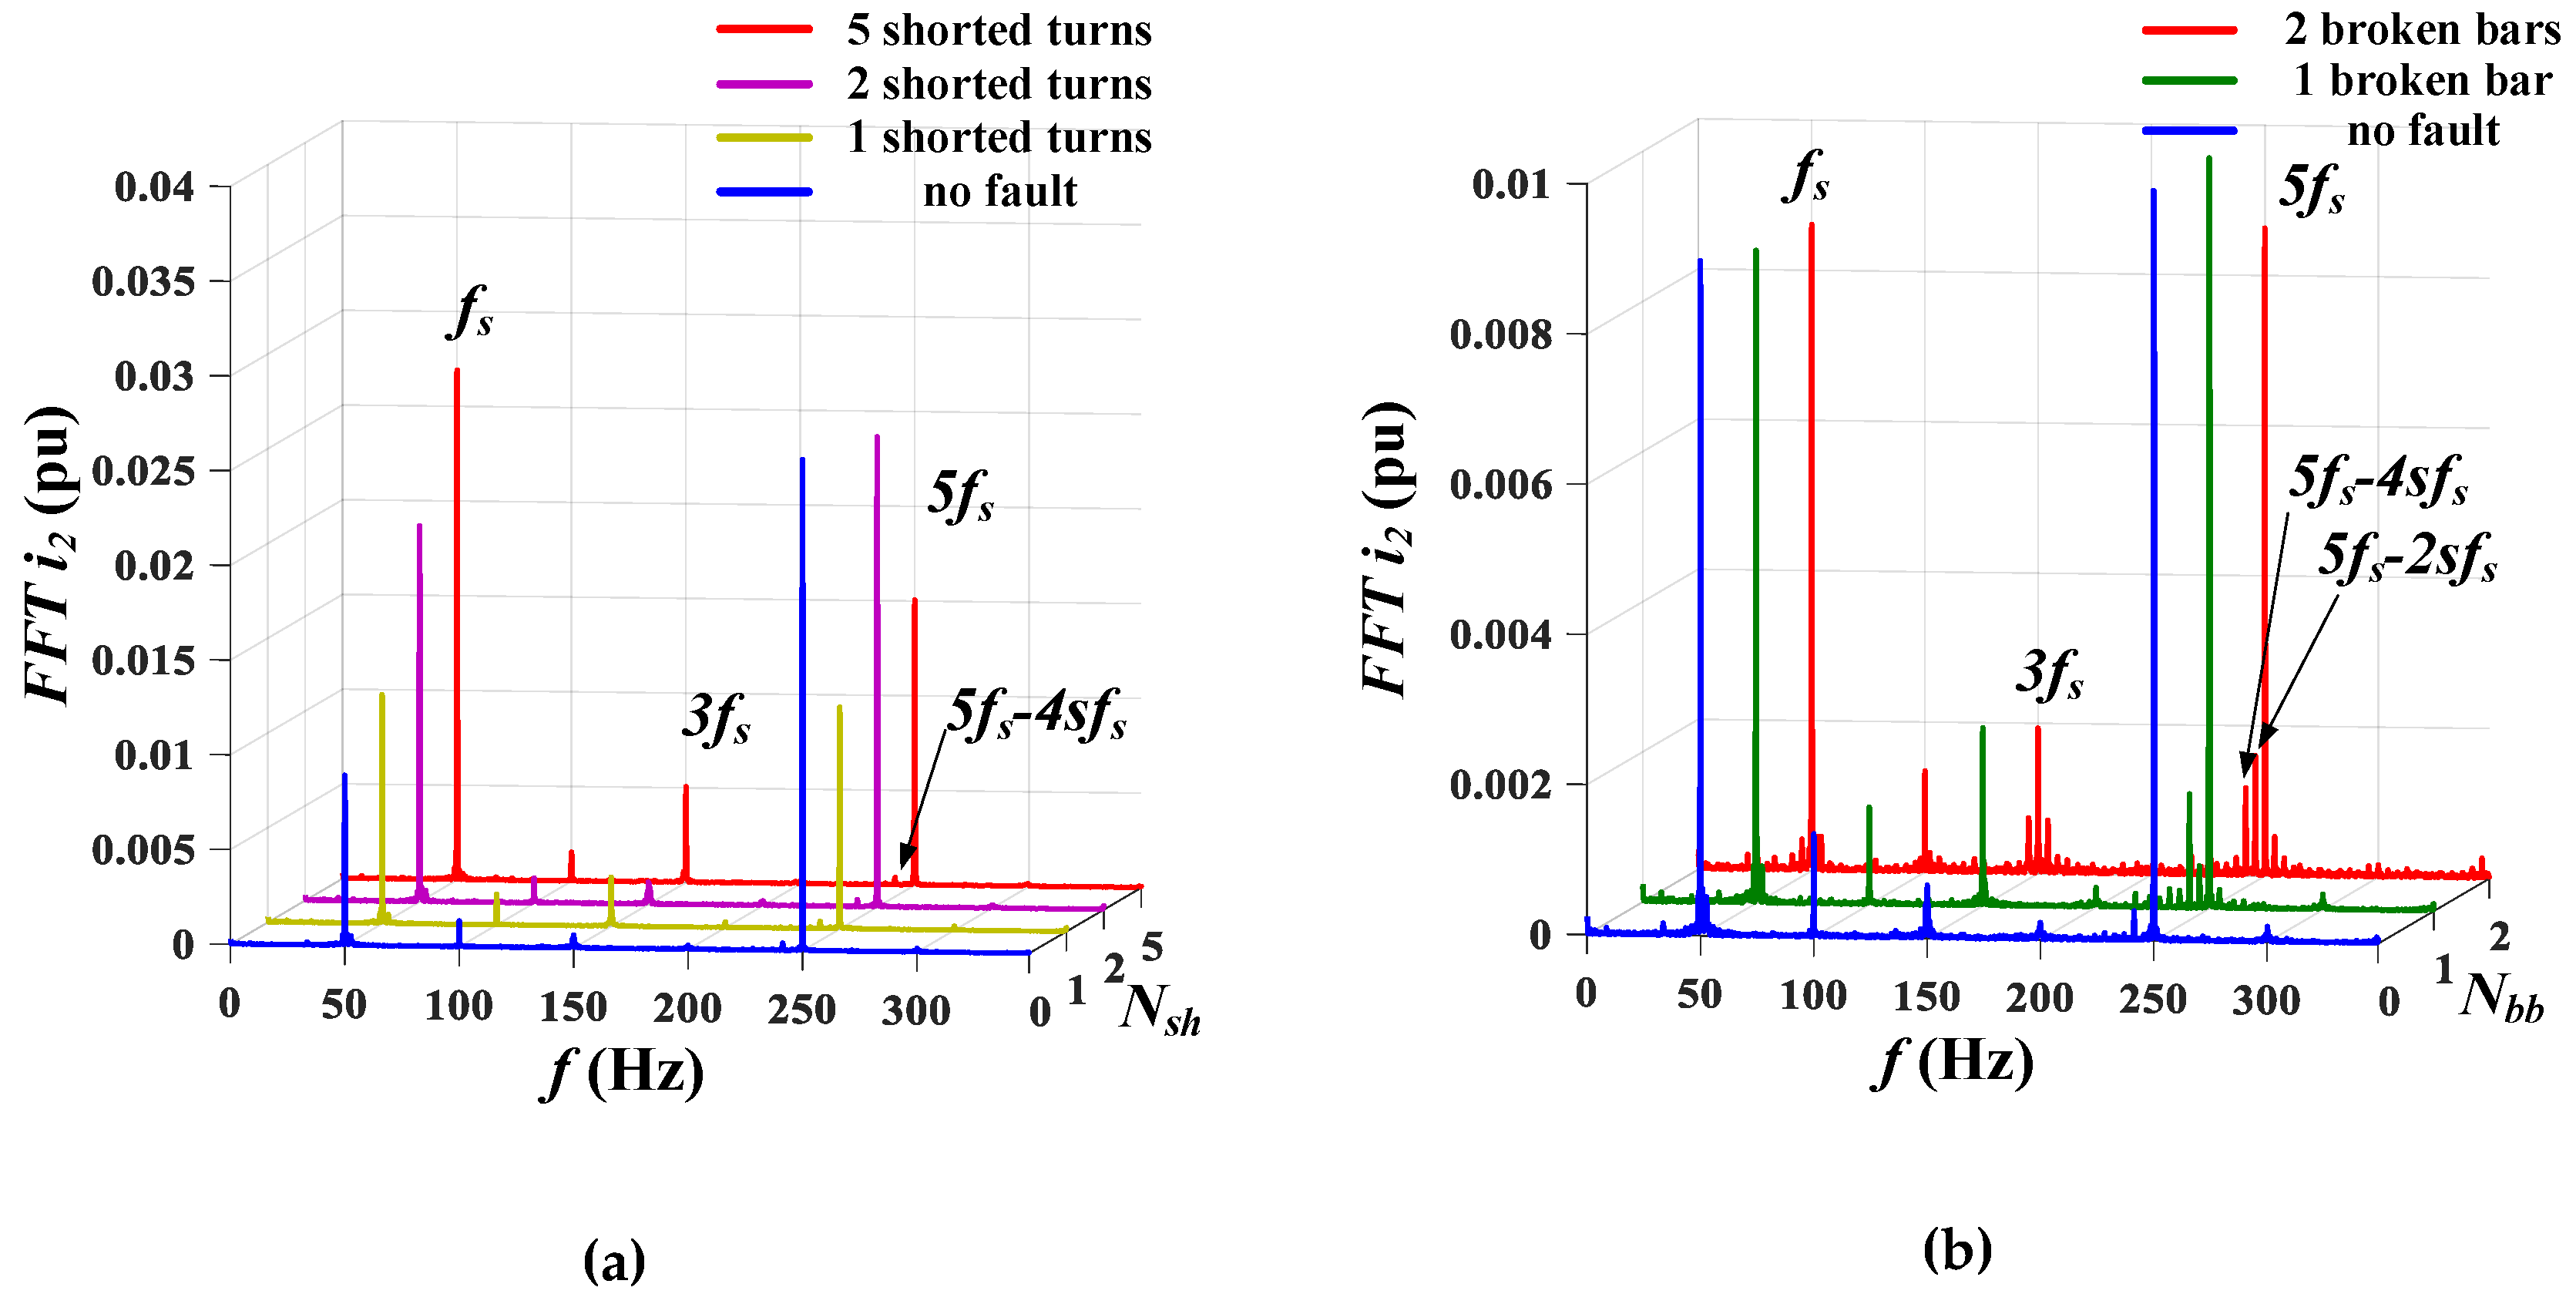
Figure 6 shows the FFT analysis of instantaneous negative-sequence symmetrical component i2 for the motor loaded with rated torque TL = TLN, the frequency of the supply voltage fs = 50 Hz and various defects of the motor windings. For the stator winding faults (Figure 6a), significant changes are especially visible in the magnitude changes of the fundamental frequency harmonics fs. With the increase in stator damage, the amplitude value of this harmonics increases strongly (almost 3-fold for Nsh = 5 compared to the healthy motor). As can be seen in Figure 6b, the failure of the rotor results in significant changes of the magnitudes calculated according to Equation (16) for k/pb = 5: 5fs − 2sfs and 5fs − 4sfs harmonics. In addition, the amplitude of the 5fs harmonic is a multiple of the fundamental frequency harmonics fs, which allows for the easy separation of slip components 2sfs and 4sfs around it, even at low motor loads.
It can therefore be concluded that the changes in the characteristic amplitudes of the harmonics specific for the stator and rotor winding faults, contained in the instantaneous negative-sequence symmetrical component i2 of the stator current, should be taken into account in the diagnostics of the electrical failures of the squirrel-cage motor. In addition, the considered damage causes changes in well-separated harmonics, thanks to which it is possible to conduct parallel diagnostics of the stator and rotor winding faults.
In Figure 7a detailed analysis of changes in characteristic frequency amplitudes for various degrees of damage to the stator winding (Figure 7a) and the rotor cage (Figure 7b,c) at different load torque and frequency changes of the supply voltage are presented.
The obtained experimental results show the impact of the motor load torque and the frequency of the supply voltage on the process of fault symptoms extracting and fault diagnostics using symmetrical component i2. It can be observed that the selected magnitudes of characteristic frequencies practically do not react to changes in the load torque. The influence of frequency changes in the supply voltage is visible for the fundamental component fs (its decrease causes a reduction in the intensity of changes under fault conditions, Figure 7a); however, it is still possible to detect the initial phase of failure even for relatively low supplying frequency fs = 20Hz. In the case of damage to the rotor bars, the impact of the supplying frequency is very small.
The results of the above analysis of the stator current signal made it possible to prepare datasets for Kohonen network training that were then used to detect and classify failures of the stator and rotor windings.
5. Experimental Tests of SOM Classifiers of IM Winding Faults
5.1. Training Pattern Selection for Self-Organizing Kohonen Network
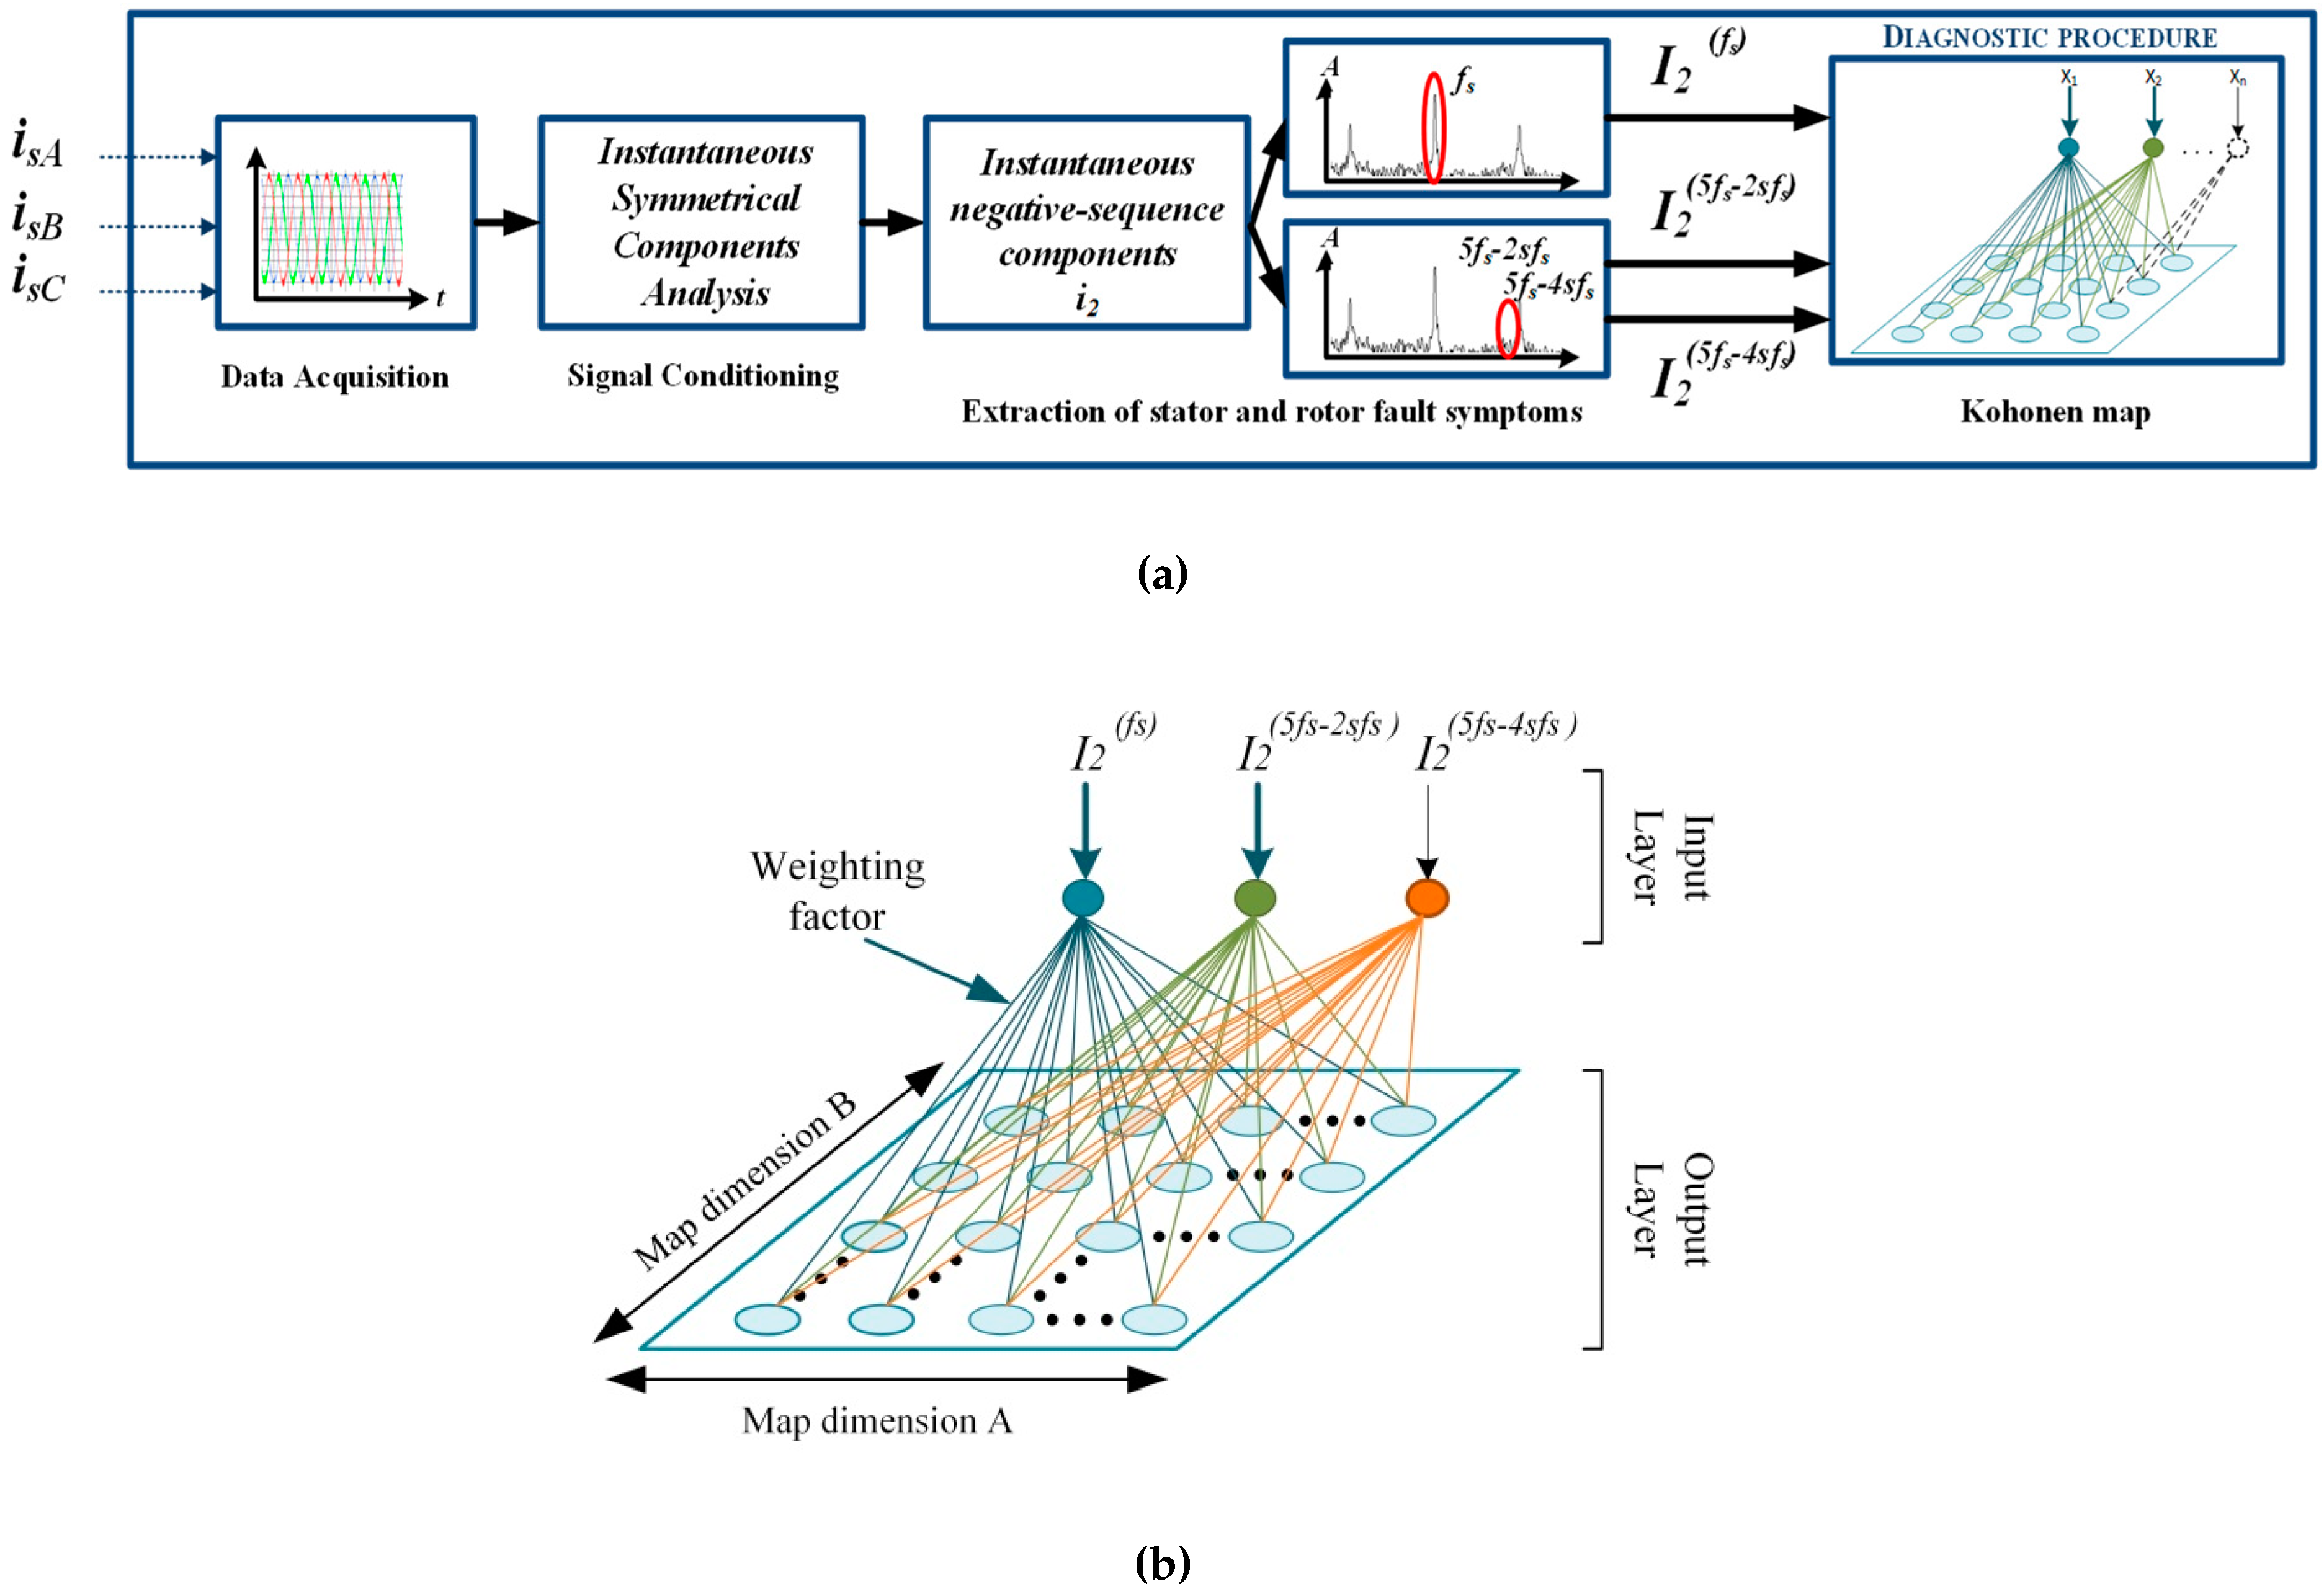
The learning process of Kohonen’s self-organizing network was carried out based on the data from 104 measurements acquired on a real drive system. The training vector of the neural network contained amplitudes of the negative-sequence instantaneous symmetrical component i2 of the stator current with frequencies fs, 5fs − 2sfs and 5fs − 4sfs. The diagram of the diagnostic procedure using ISCA and the Kohonen Network (KN) is shown in Figure 8.
The KN training vector included the above mentioned magnitudes of the instantaneous negative-sequence symmetrical component of the motor current calculated for different values of the supply voltage frequency in the range of (20 ÷ 50) Hz. The network learning process for the classification of winding faults contained information on the amplitudes of the spectrum for no load (TL = 0), half of the nominal value (TL = 0.5TLN) and the fully loaded motor (TL = TLN). In the case of the classification of the rotor bar damage, the training data included measurements for load torque changes TL = 0.5TLN and TL = TLN.
The ability to distinguish clusters is strongly dependent on topology, the number of neurons and the proximity of the Kohonen network. In practical applications, the selection of these parameters is to ensure the correct operation of the network, as well as the legibility of the solution found. In the case of a large number of patterns, and many factors affecting the values of the elements of the network input vector, it is required to use a large number of neurons in the output layer (network diagram, presented in Figure 8b). The number of neurons should allow for a clear identification of areas characteristic of particular categories. The network topology determines the type of connections between neurons. Analysing the impact of changes in the load torque, frequency of supply voltage and the number of analysed failure categories, in the conducted research it was decided to use a 20 × 20 and 10 × 10 network with a hexagonal topology.
The network learning process was carried out in accordance with the WTM method, with the Gaussian neighbourhood function. After the training process, a test data vector was given to the network input in order to evaluate the effectiveness of the classification. The test data vector contained data from 150 measurements for different values of load torque TL, the frequency of supply voltage fs, as well as for different numbers of faulted rotor bars Nbb and stator short-circuits turns Nsh of the induction motor. The summary of the self-organising network parameters used in this research is given in the Table 2.
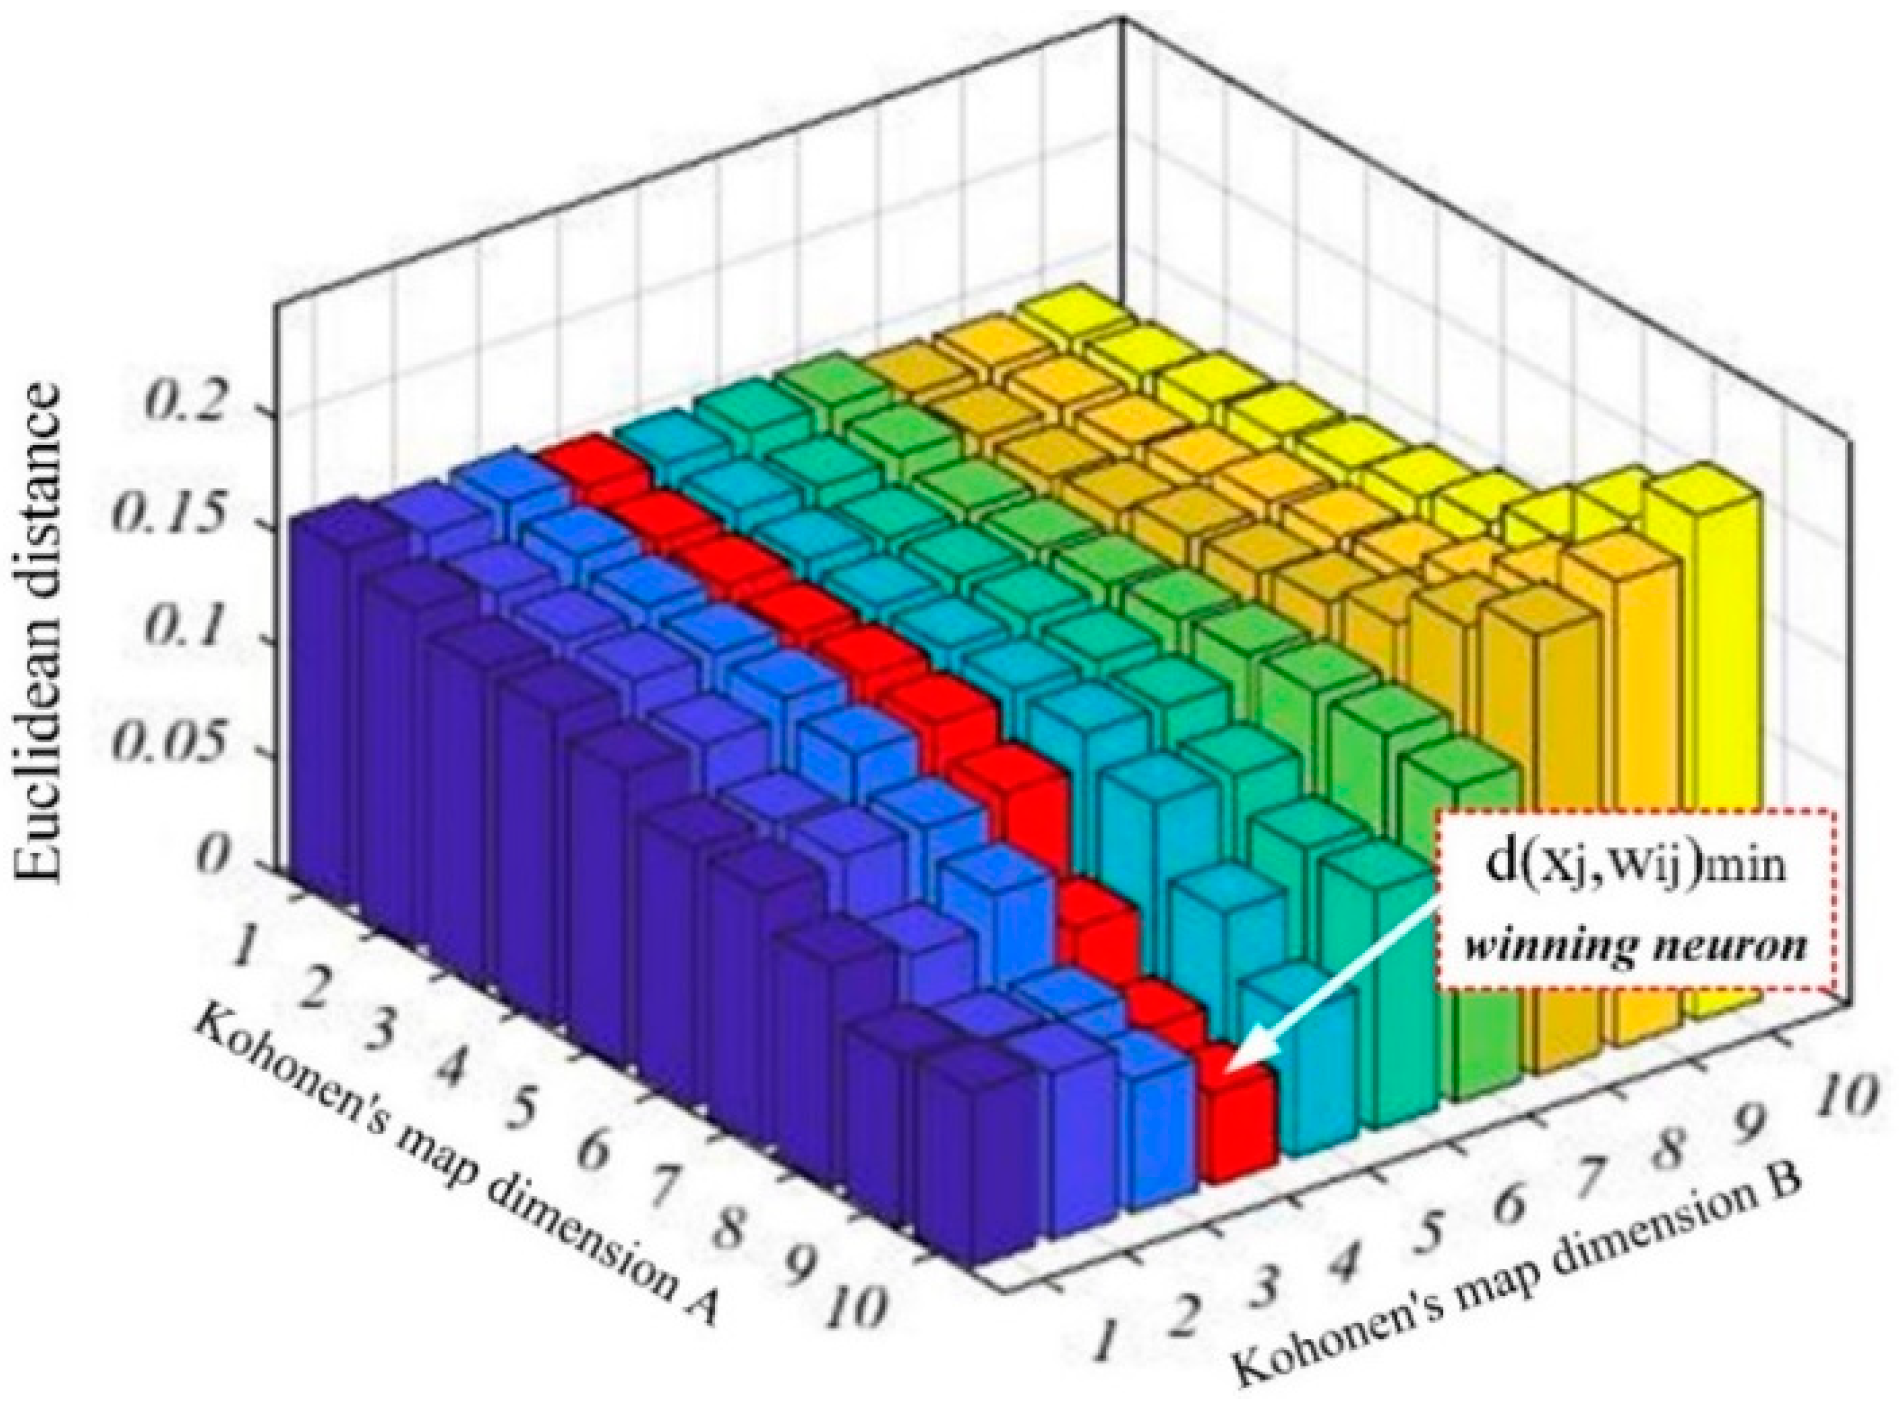
After the training process, the learning vector was given to the input of neural network. The neural network response contained information about the number of the winning neurons for each sample presented. Neurons closest to a given sample form an area characteristic of this sample. As observed in Figure 9, the reduced value of the Euclidean distance is noticeable for the winning neuron as well as neighbouring neurons (according to the WTM method, [45]). The presentation of a large amount of training data belonging to the same fault category allows us to create zones of active neurons for a given category.
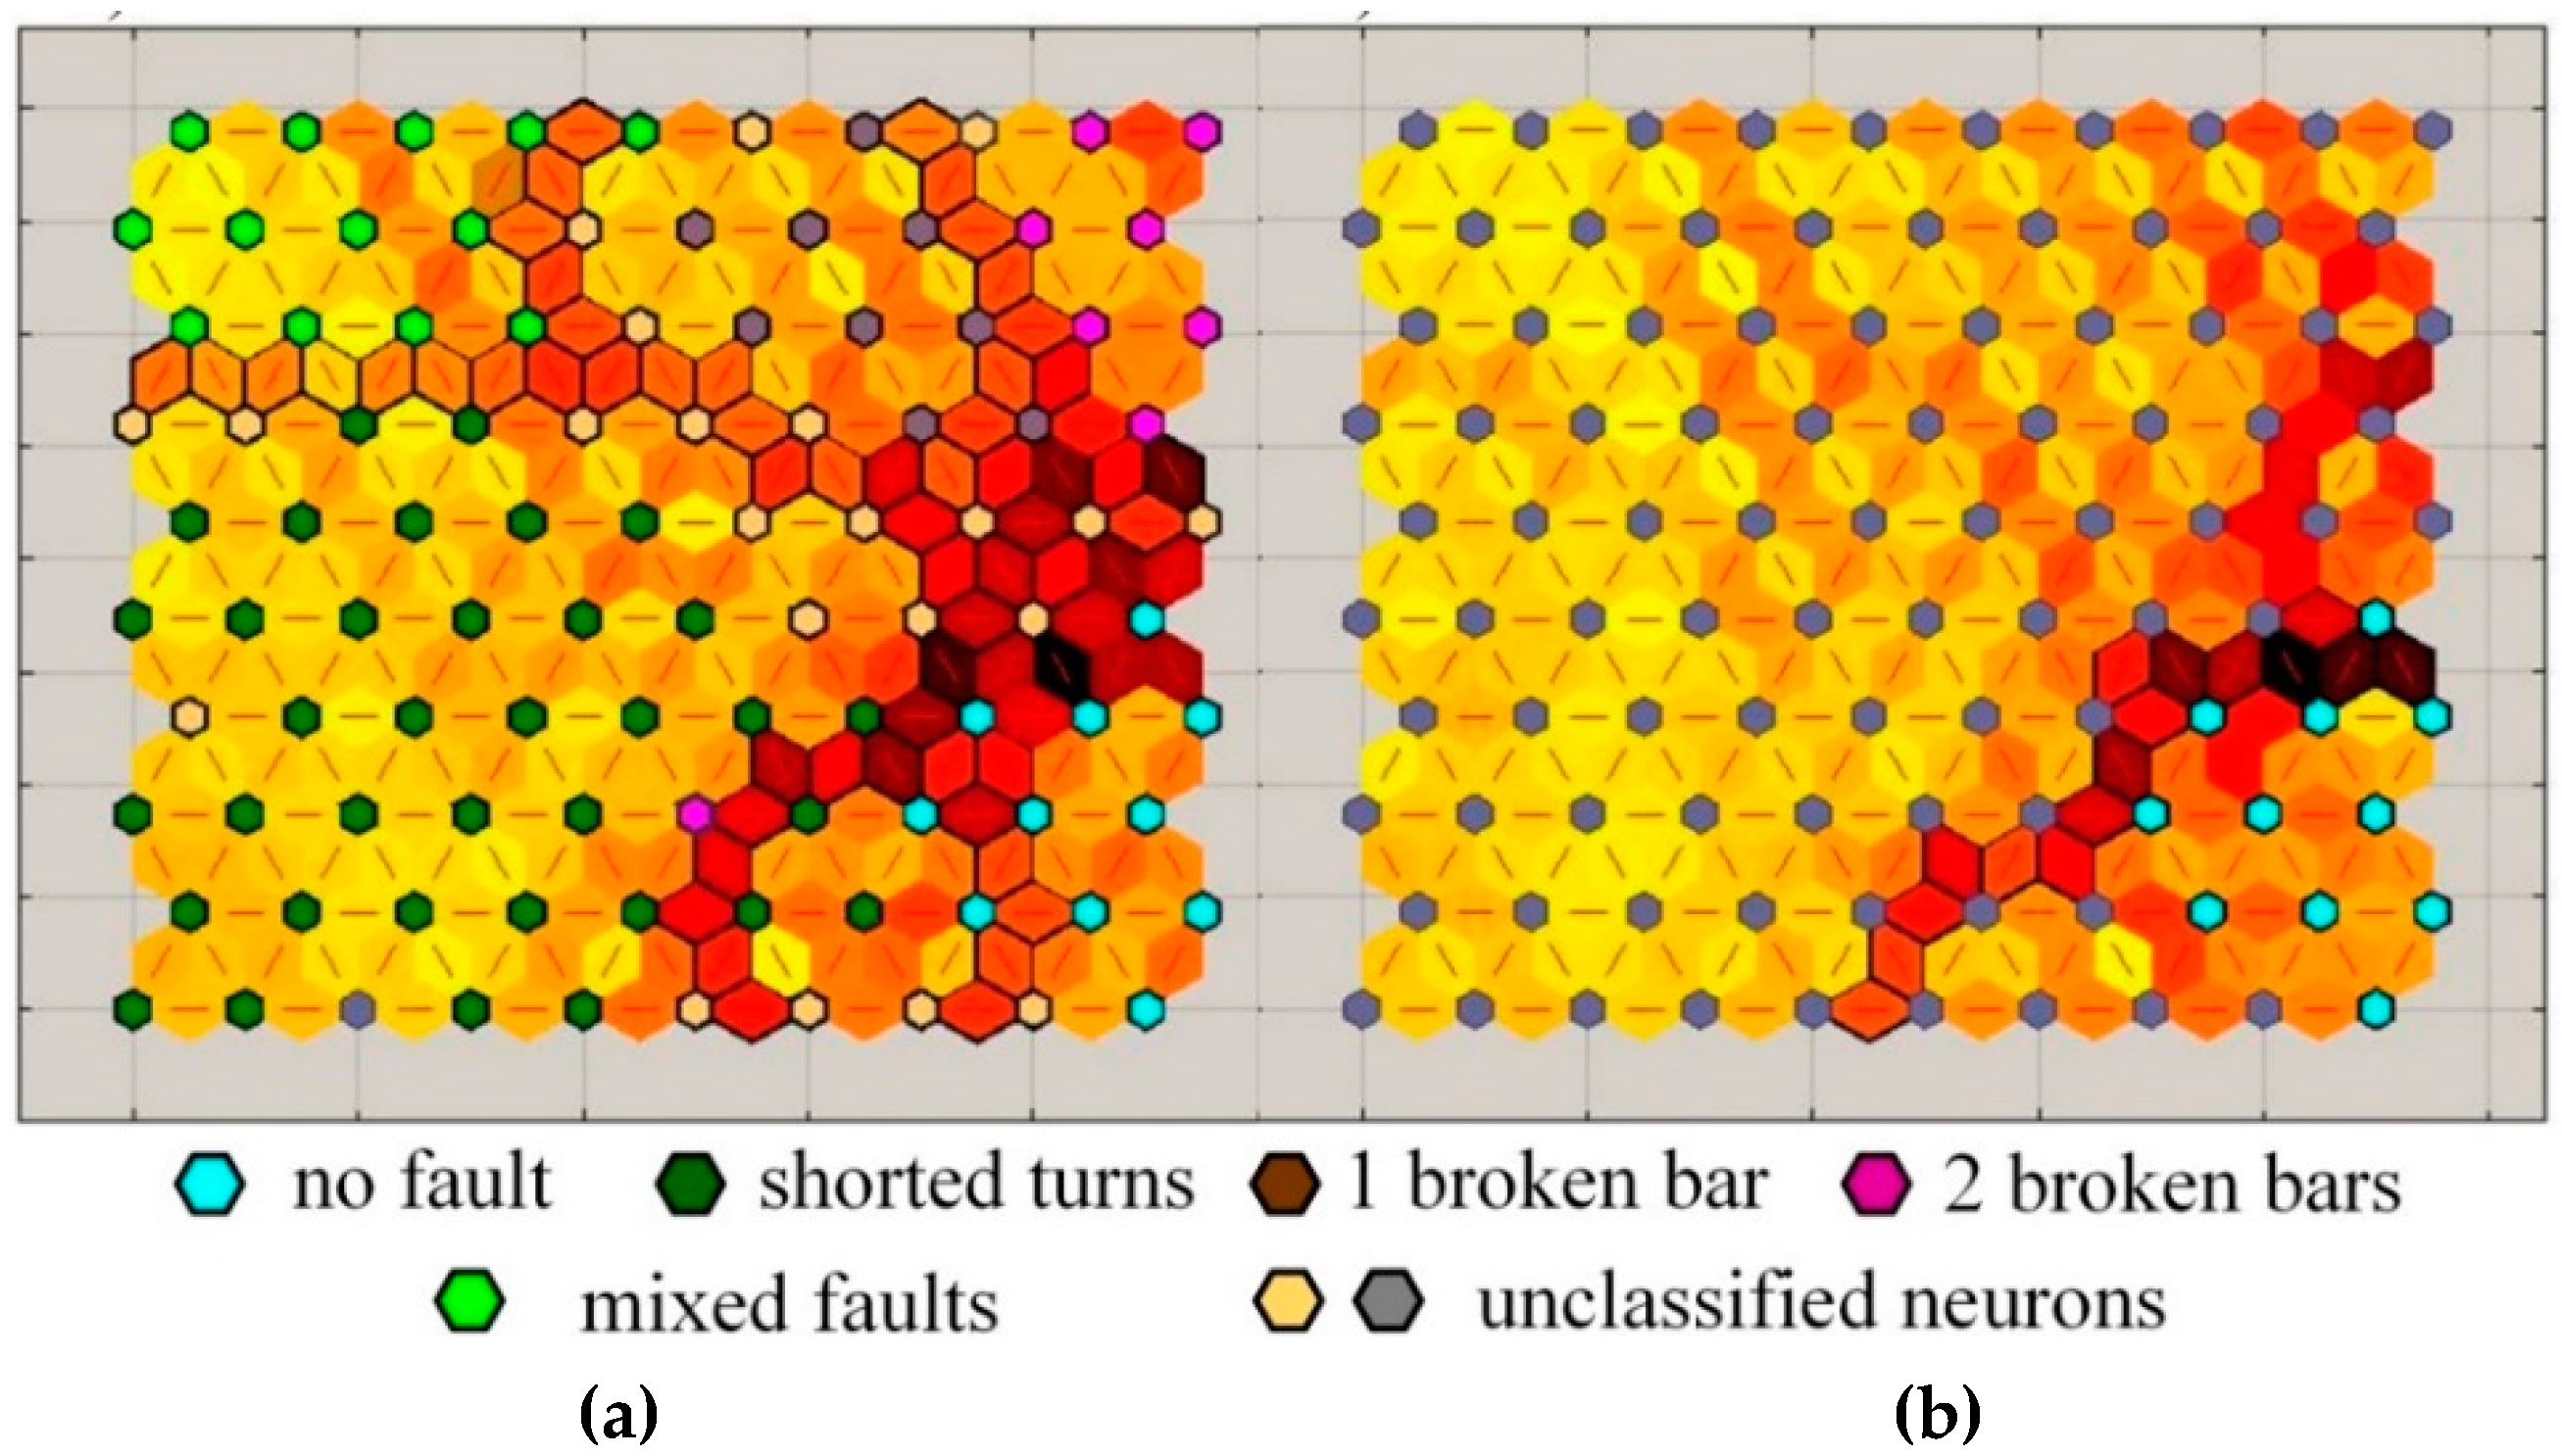
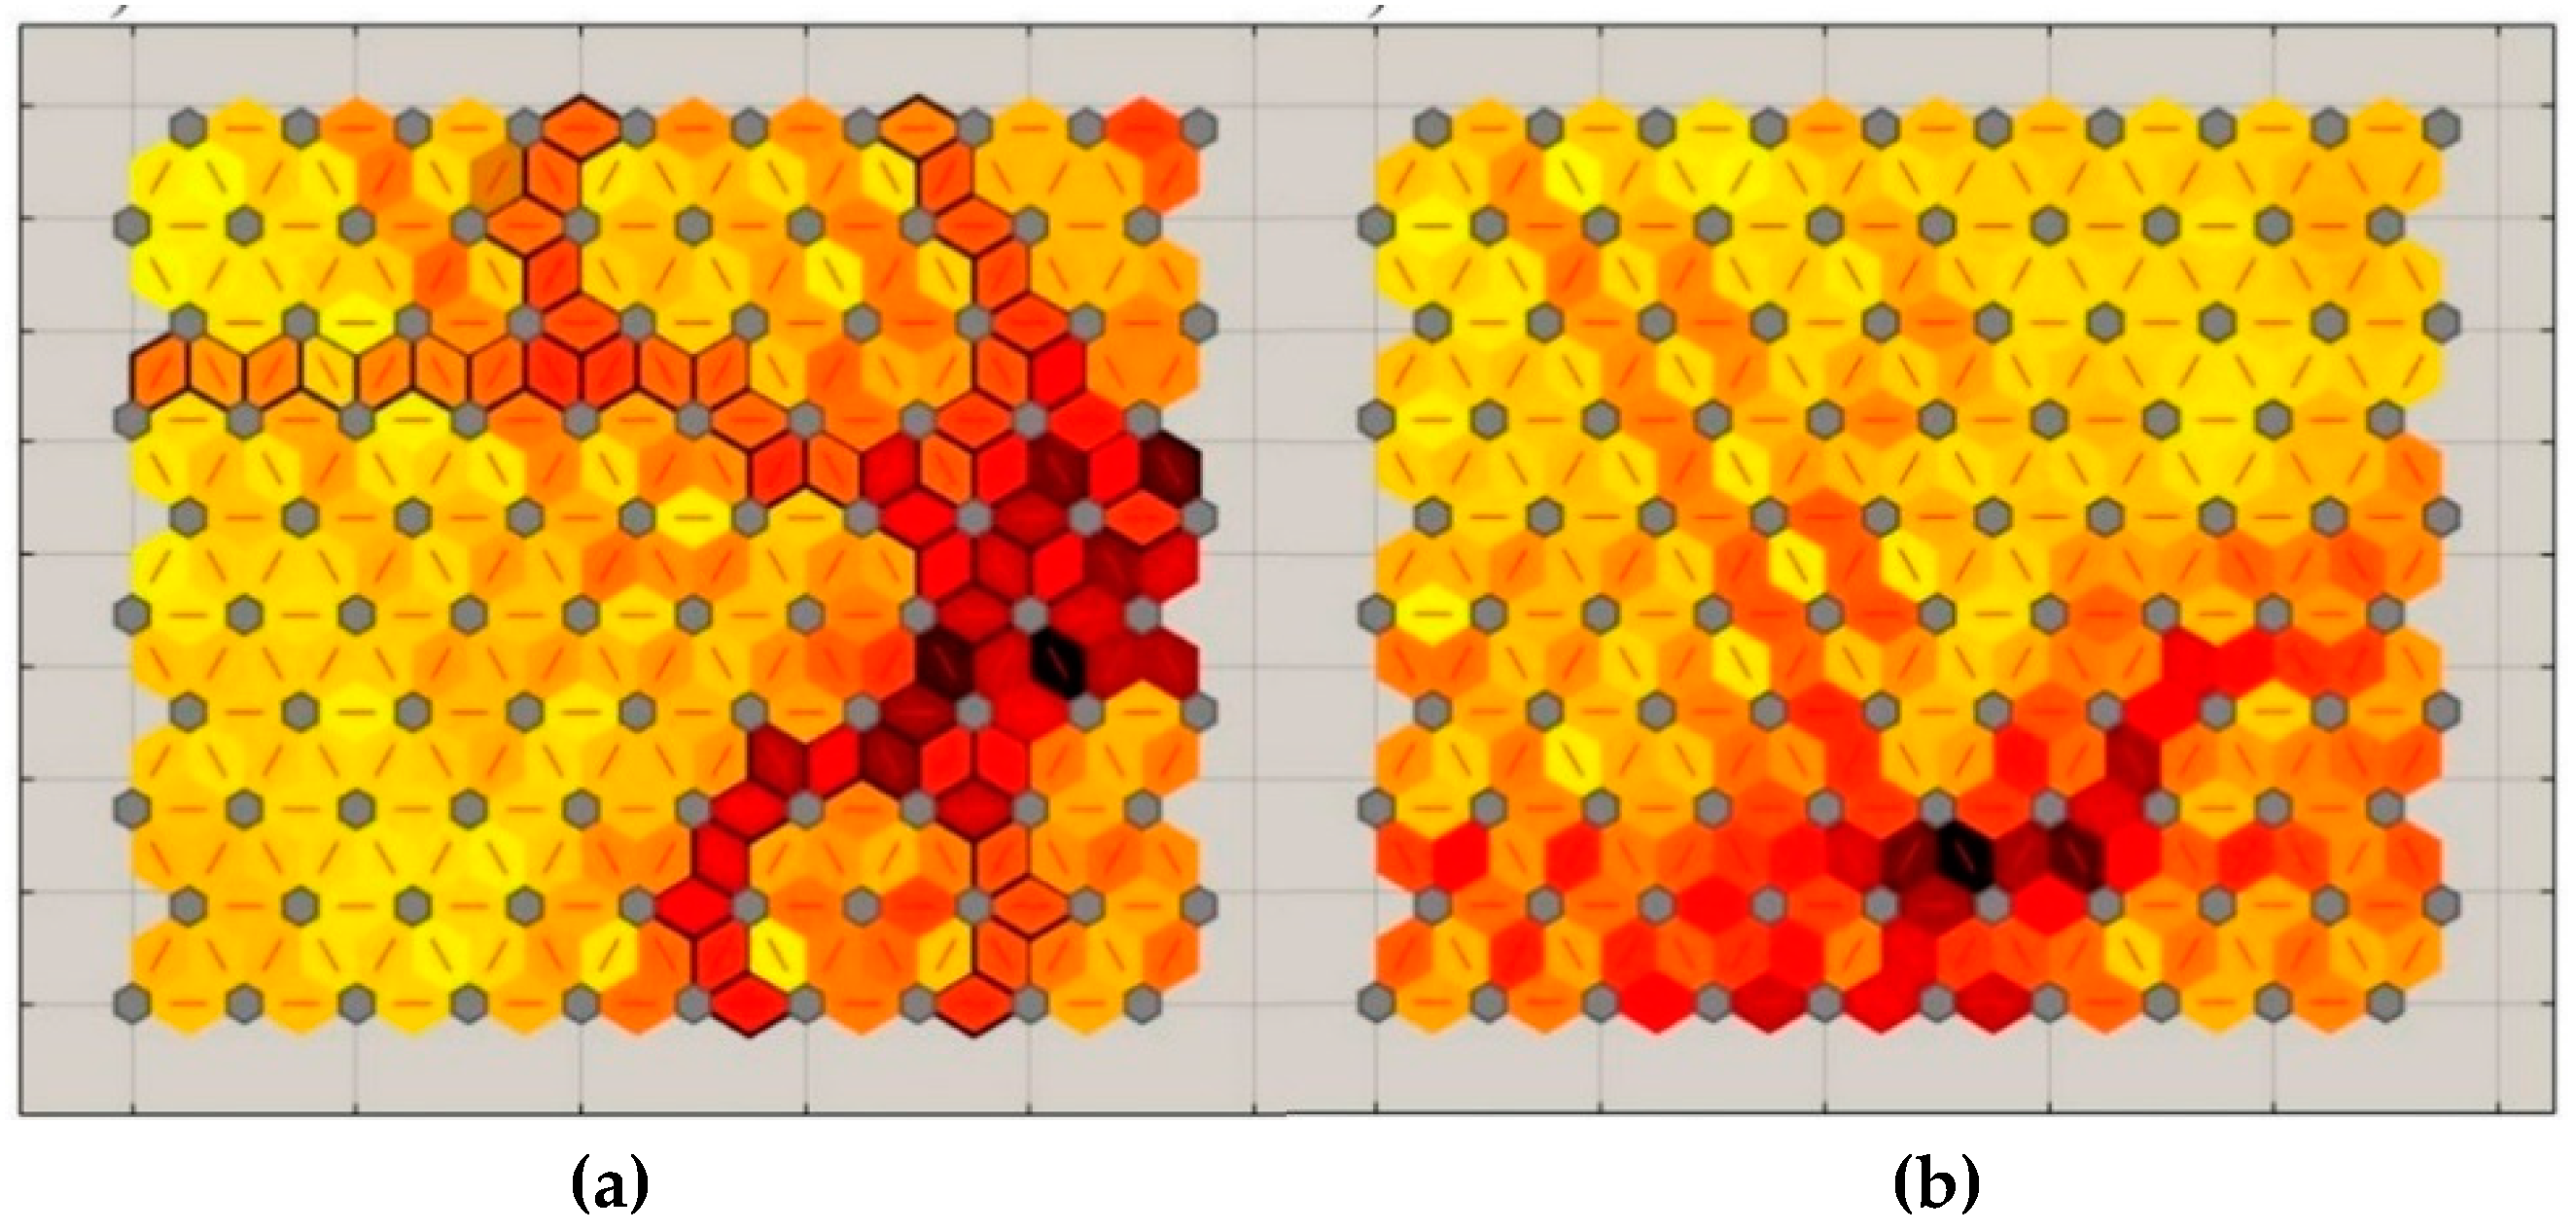
The Euclidean distance between neighbouring neurons as well as between the presented input vector and neurons is dependent on the course of the learning process. The effective selection of weights depends on the learning coefficient and the number of training epochs used in the learning process. As shown in Figure 10, an inadequate choice of the learning factor prevents us from separating the map into zones characteristic of all analysed damage. As observed in Figure 10, bands indicating a large distance between neighbouring neurons are noticeable. As noted in Figure 10a, Kohonen’s map was divided into five areas constituting five separate fault categories. In the case of an incorrect value of learning factor (Figure 10b), for the same number of training epochs, only one area was identified on the map.
The number of training epochs also has a significant influence on data classification efficiency. As observed in Figure 11, an adequate number of epochs provides a proper adaptation of the connections between the neurons. Figure 11a shows the areas characteristic of the discussed induction motor damage. The effect of an insufficient number of training epochs is shown in Figure 11b. In this case, the distances between the neurons are too small to determine the zones characteristic of each category.
Based on the analysis of the network response to the learning and test data vectors, the number of learning epochs was selected. In the case of a 20 × 20 network, the number of training epochs was 700, while for networks with a size of 10 × 10, 600 epochs. The results obtained for the bigger network were comparable with a 10 × 10 map, thus the results obtained with this less complicated map were shown in the next section. The response of the designed network to the given training vector allowed to highlight the Kohonen map zones characteristic of specific IM damage categories.
5.2. Results of Stator and Rotor Fault Classification
The experimental verification of the obtained networks was carried out for the classification of rotor and stator winding failures and for mixed damage. In addition, the effect of the no-load machine’s operation on the fault classification process of the broken rotor bars was checked. On the basis of the network response to the training vector, map zones indicating the technical condition of the electric circuits of the tested motor were highlighted.
In the following figures the responses of the KN to test data not included in the learning process are demonstrated. The data were collated in a tabular form to show the impact of motor operating conditions on the failure classification efficiency.
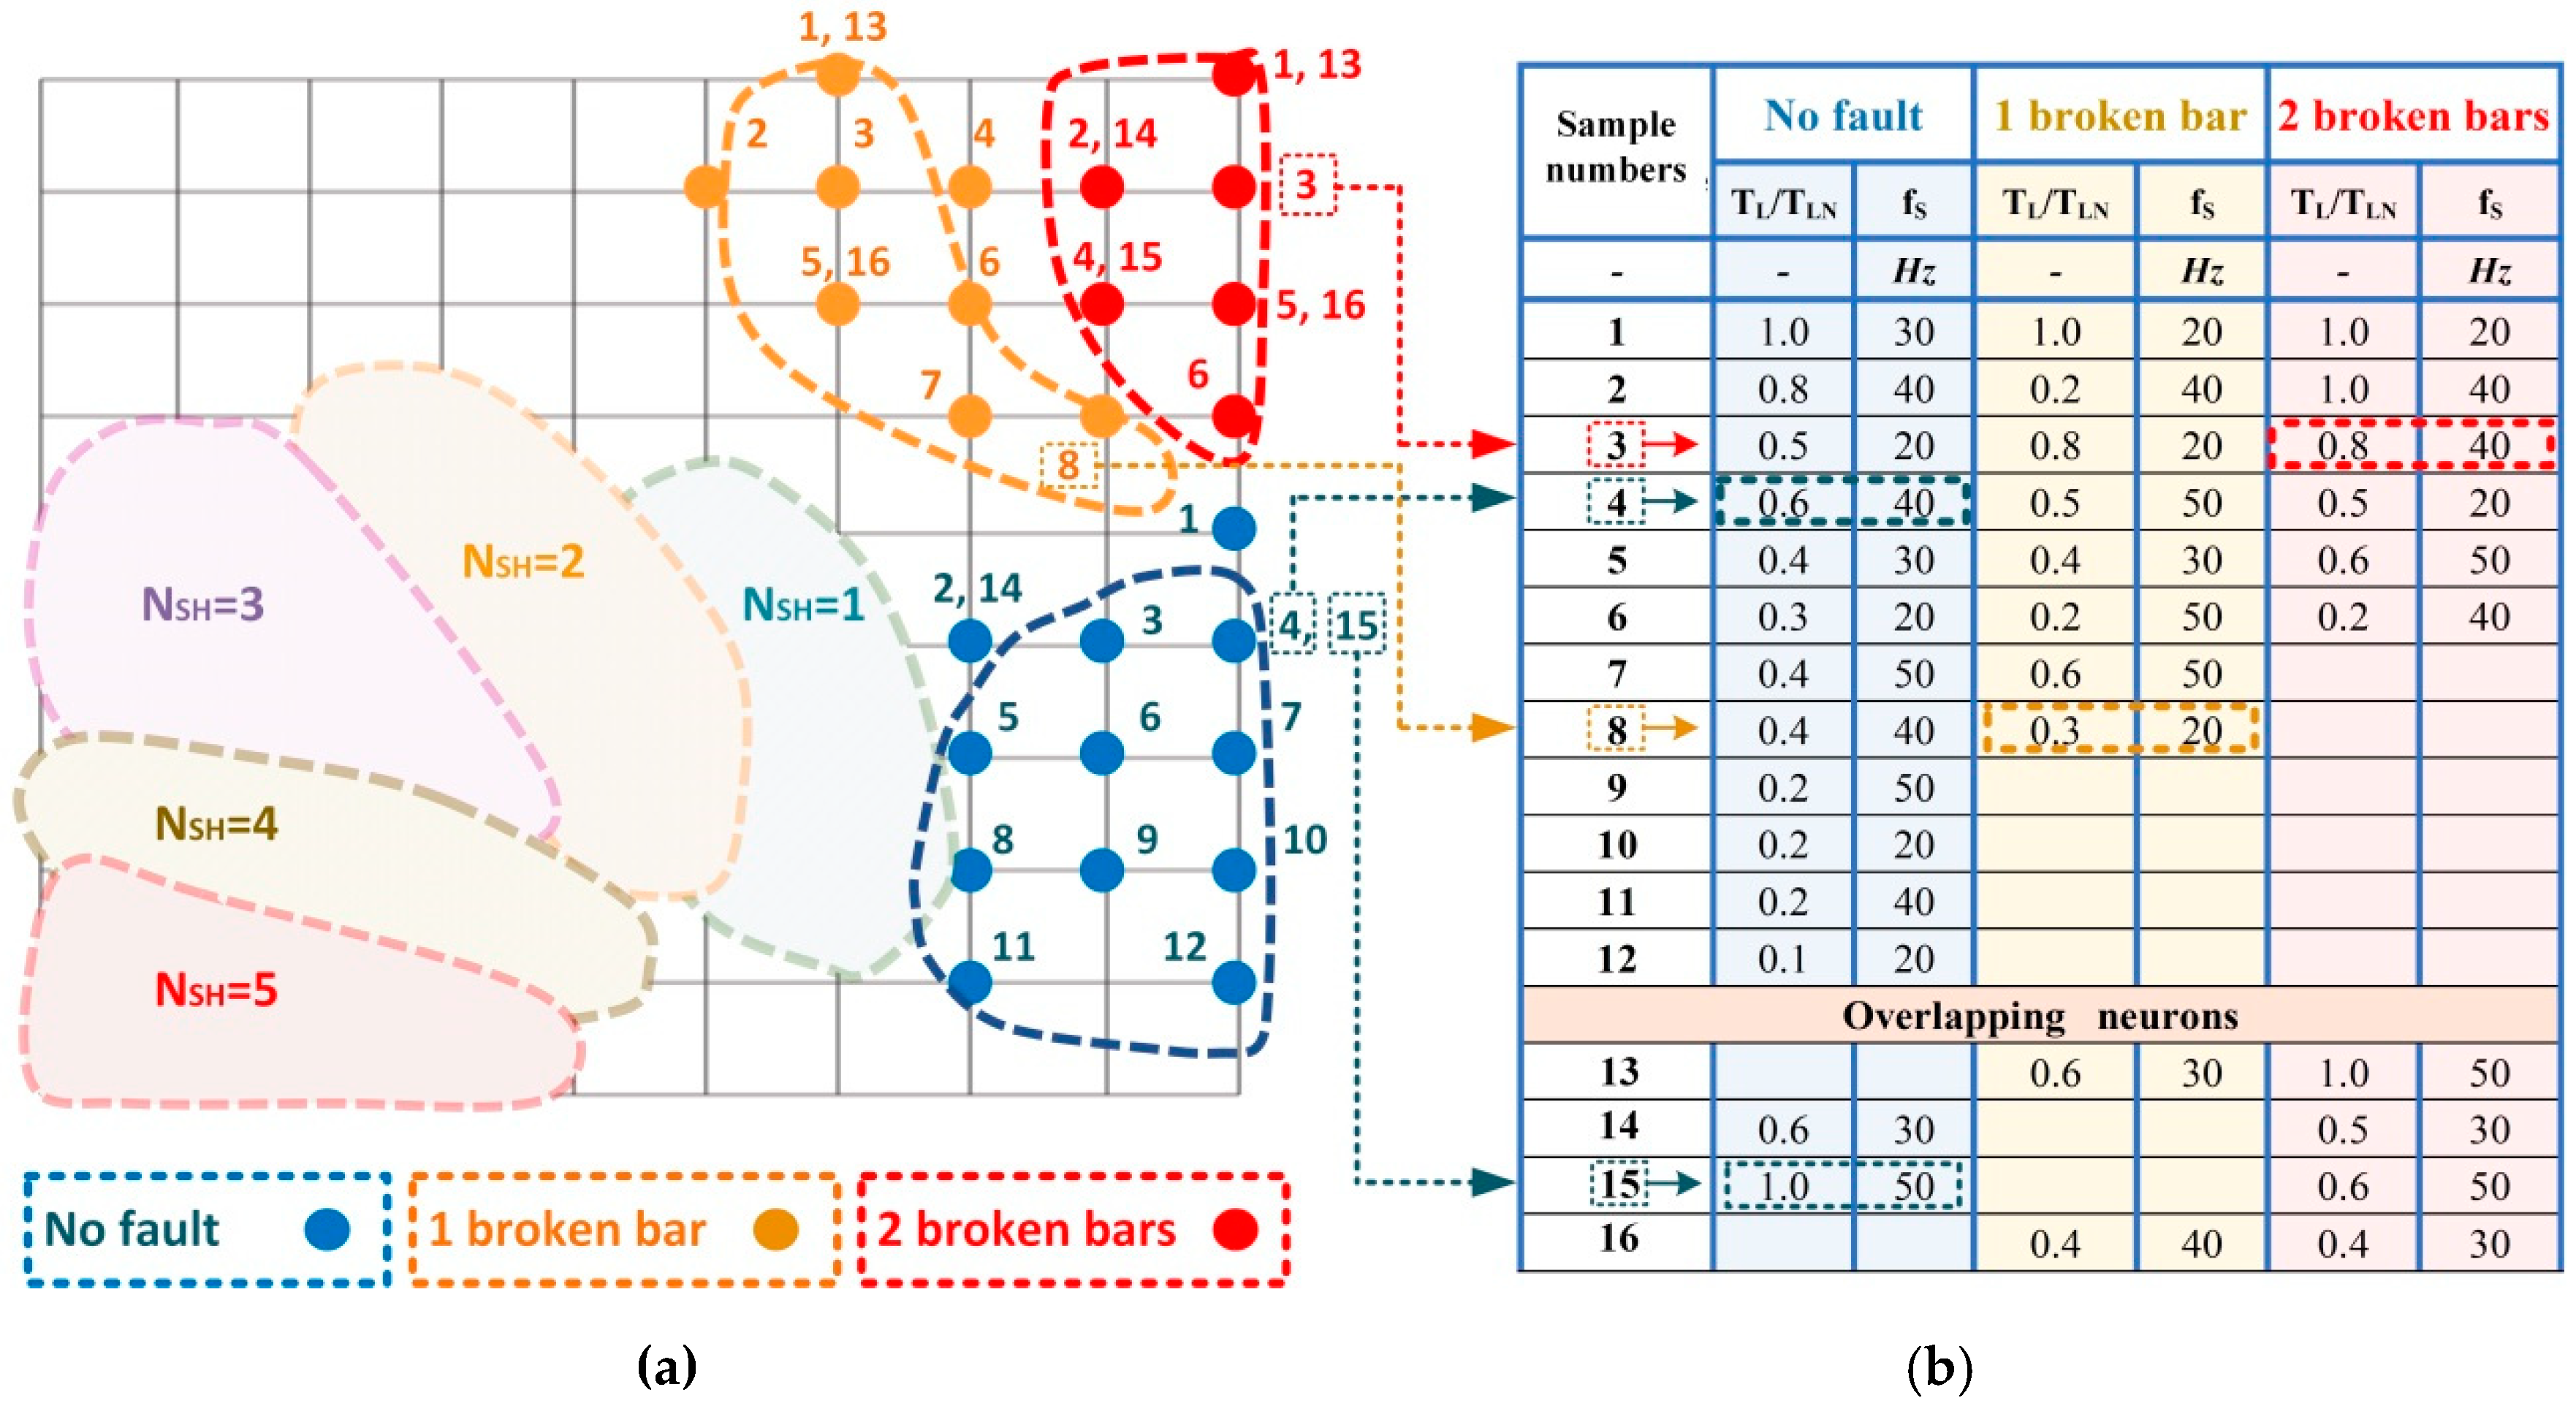
In Figure 12a the classification of the rotor cage damage of the tested IM, for different load torques and supply frequencies, using 10 × 10 map is shown. The neuron numbers (1–12) are used to read properly the test measurement parameters in the adjacent table (Figure 12b). An example of proper reading the results presented in following figures is marked at Figure 12. It can be seen that the designed SOM maintains a high level of the failure classification of the rotor bars in the case of changes in the machine’s operating conditions. It should be mentioned that as a result of the increase in the load torque, the neurons located in the upper part of the Kohonen map are active. The changes in the frequency of the supply voltage do not affect the classification process of the rotor bar damage. Active neurons are located in areas characteristic of the rotor damage. The areas of the Kohonen map marked with a dotted line do not coincide with the zones characteristic of the stator faults (hatched areas in the Figure 12a). The part of the map characteristic of the lack of motor damage was clearly distinguished. As observed in Figure 12b, some neurons were assigned to the same number despite the fact that they represent different state of machine operation. The overlapping of neurons is a result of similar changes in the signal for several incidents of damage belonging to the same category. A similar situation is observed in results of fault classification in the following figures.
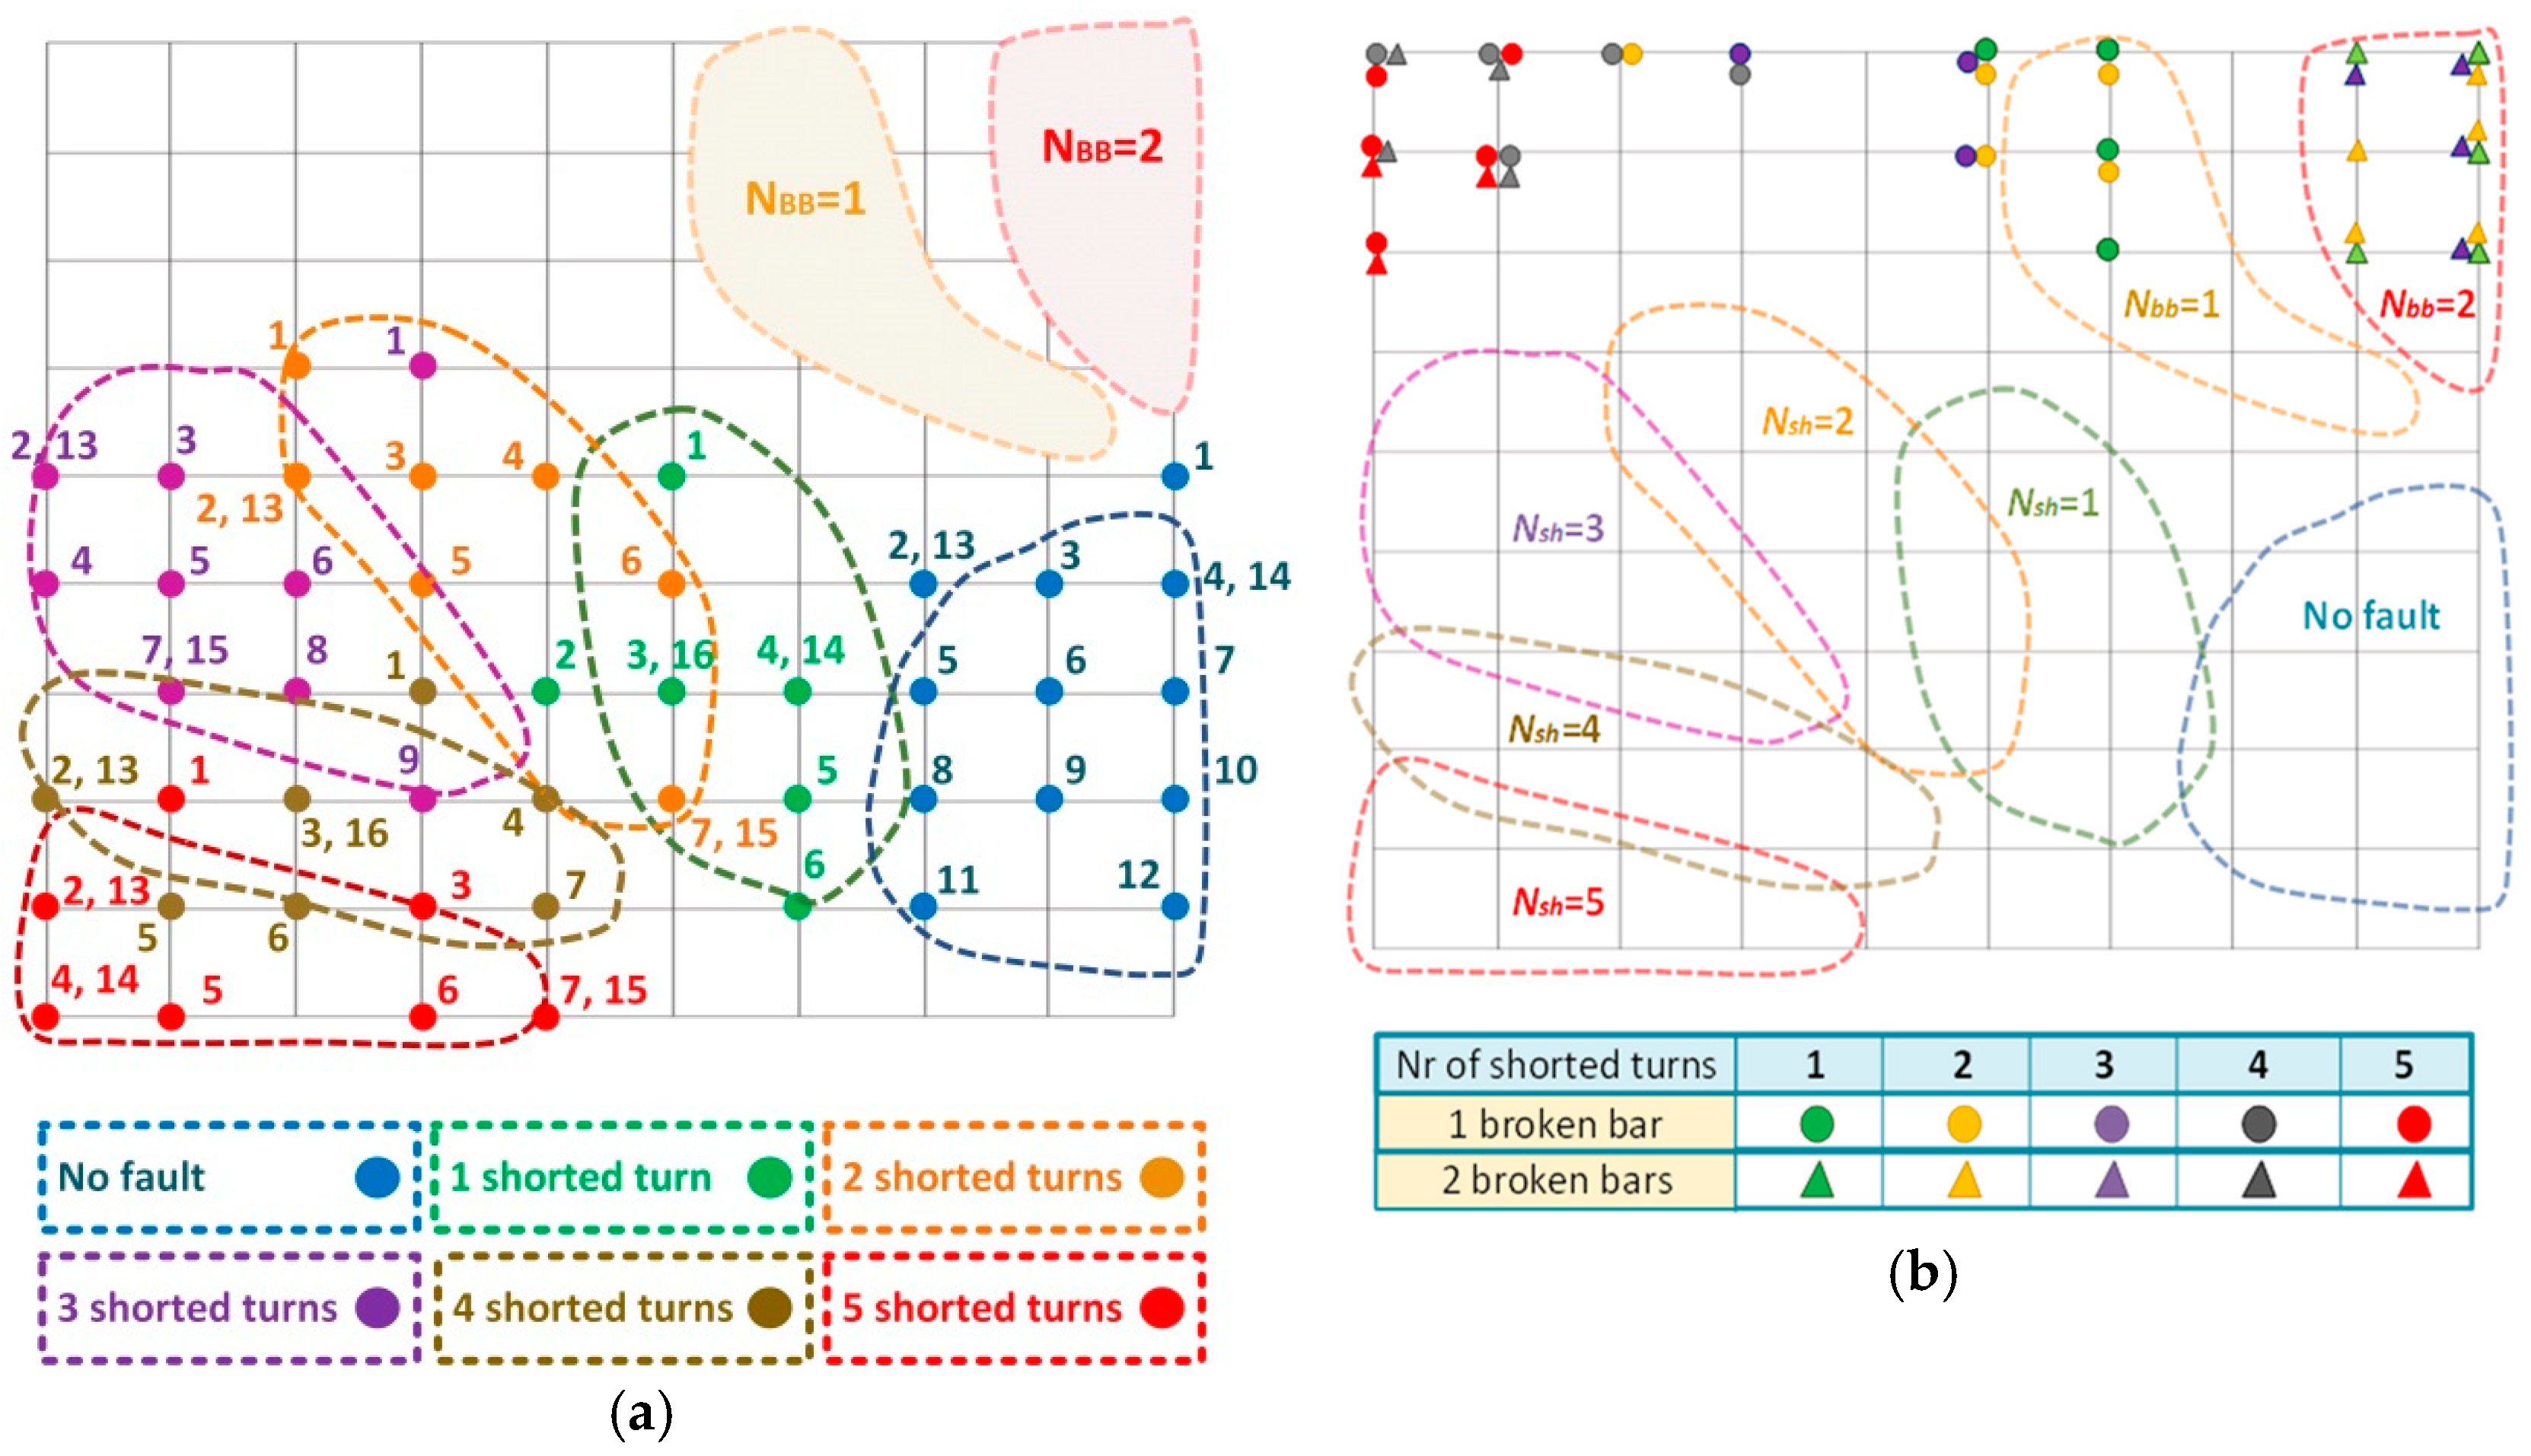
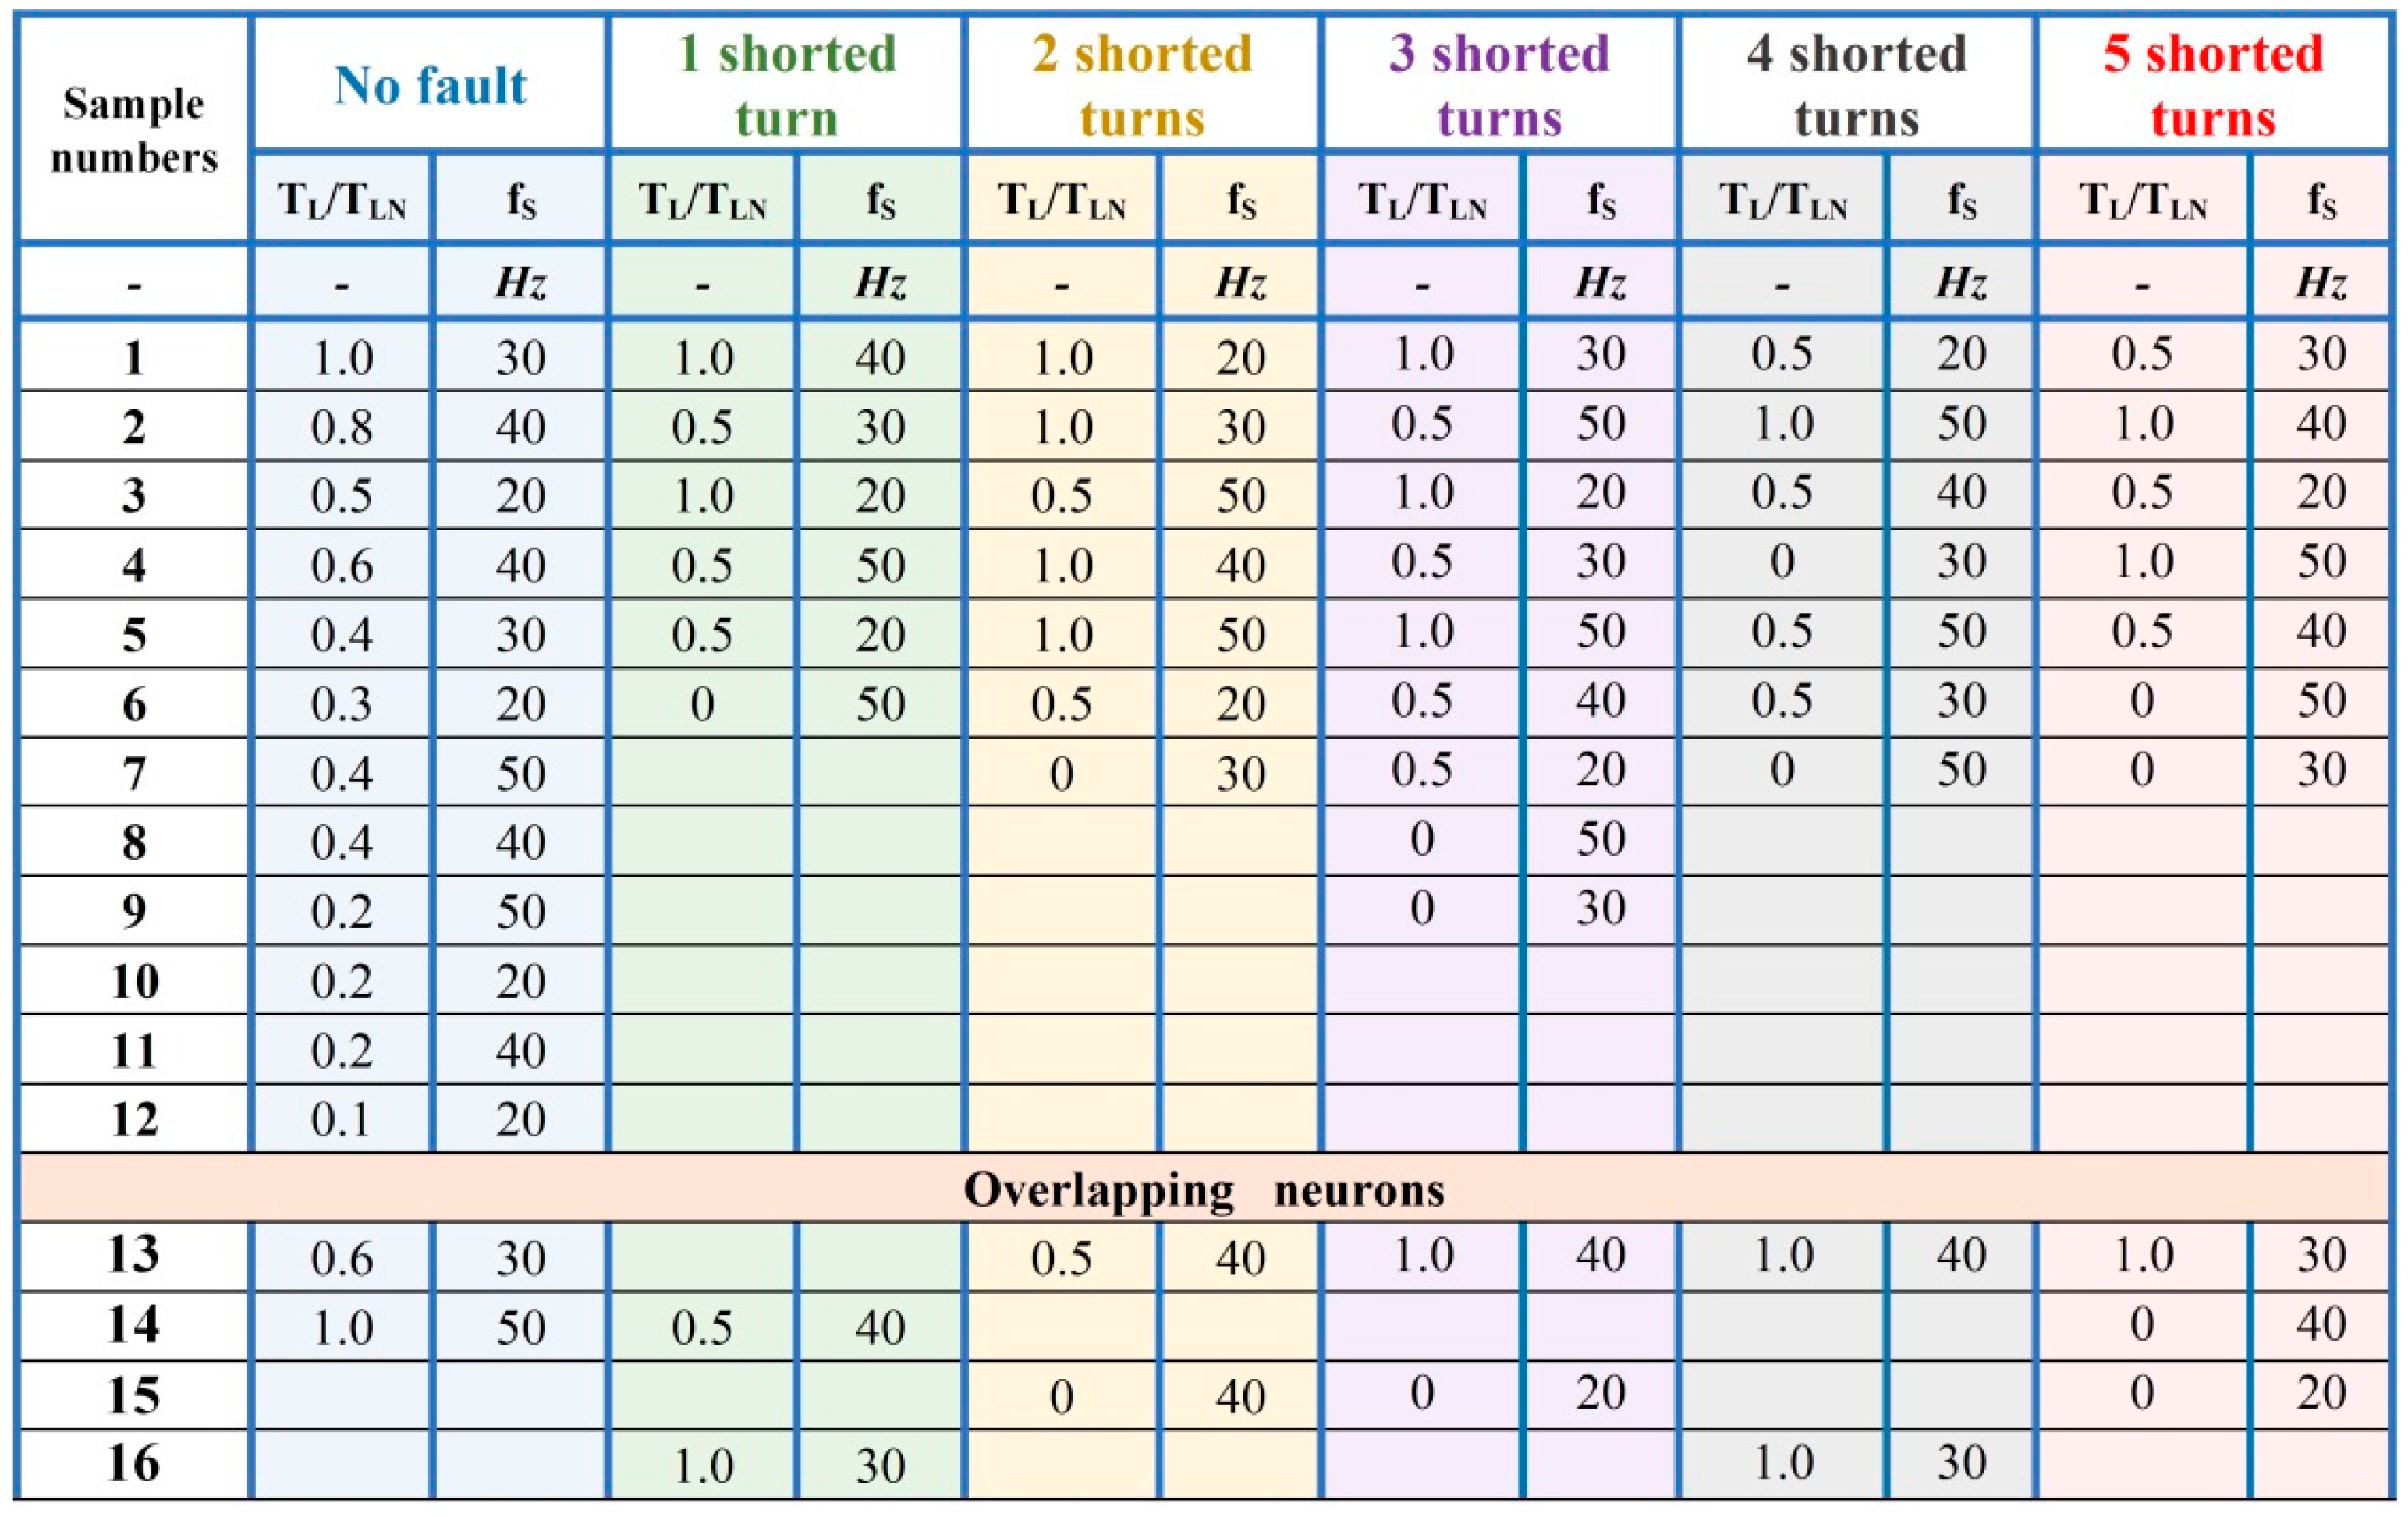
Figure 13 shows the NN responses in the case of short-circuits in the stator windings (Figure 13a) and simultaneous failure of the rotor and stator of the induction motor (Figure 13b). The conditions for the measured test data for the map shown in Figure 13a are included in the table in Figure 14. In the case of mixed damage, Figure 13b shows possible combinations of failures for the constant value of the supply voltage fs = 50 Hz and load variations in the range (TL/TLN = 0.5 ÷ 1).
The responses of the Kohonen network to the testing patterns, shown in Figure 13a in the case of ITSC faults, provide information about both the type of damage and the degradation scale of the stator windings. Similarly as in the case of responses to the training data, smooth transitions between the zones characteristic of the stator winding faults are highlighted on the map. Due to the increase in the load torque, the activity of neurons in the higher layers of the Kohonen map increases. The changes in the frequency of the supply voltage do not affect the effectiveness of the classification of the stator winding faults.
The analysis of KN responses from Figure 12a and Figure 13a allowed to find out that during the course of the learning process, two extreme failures were identified in the Kohonen network. The map areas for Nsh = 5 and Nbb = 2 were also identified from the characteristic zone for the healthy motor. This fact allowed to analyse the behaviour of the SOM in the event of simultaneous faults to the rotor and stator windings of the IM (Figure 13b). As noted in Figure 13b, mixed failures increase the activity of neurons in a zone that does not belong to any of the previously discussed ones. By analysing the map and components of a mixed failures shown in Figure 13b, it was noted that the network response depends on the contribution of a single fault in a mixed defect. Short circuits of fewer than three shorted turns (Nsh < 3) cause slight changes in the network input vector compared to the changes caused by the rotor damage. Due to the above, such mixed defects (Nsh < 3 and Nbb > 0) were classified as rotor failures by the network. Therefore, as a result of the increase in the number of short-circuit turns in the mixed faults, neurons located above the zone assigned to the separate stator failures were active.
The analysis of the received Kohonen maps allowed to assess the category and extent of damage. The map zones indicating the specific defects of the machine are clearly identified from the zone characteristic of the undamaged motor windings. This fact is an unquestionable advantage of using Kohonen self-organizing networks during the initial assessment of the motor’s condition. The risk of error will then be minimized. Analysing the obtained maps, a gradual distancing of zones characteristic of the discussed winding defects was observed due to the increase in the damage degree. The zones characteristic of the different number of ITSCs are slightly overlapping, which may be related to small changes in the stator currents due to the short circuits in case of the fully loaded motor.
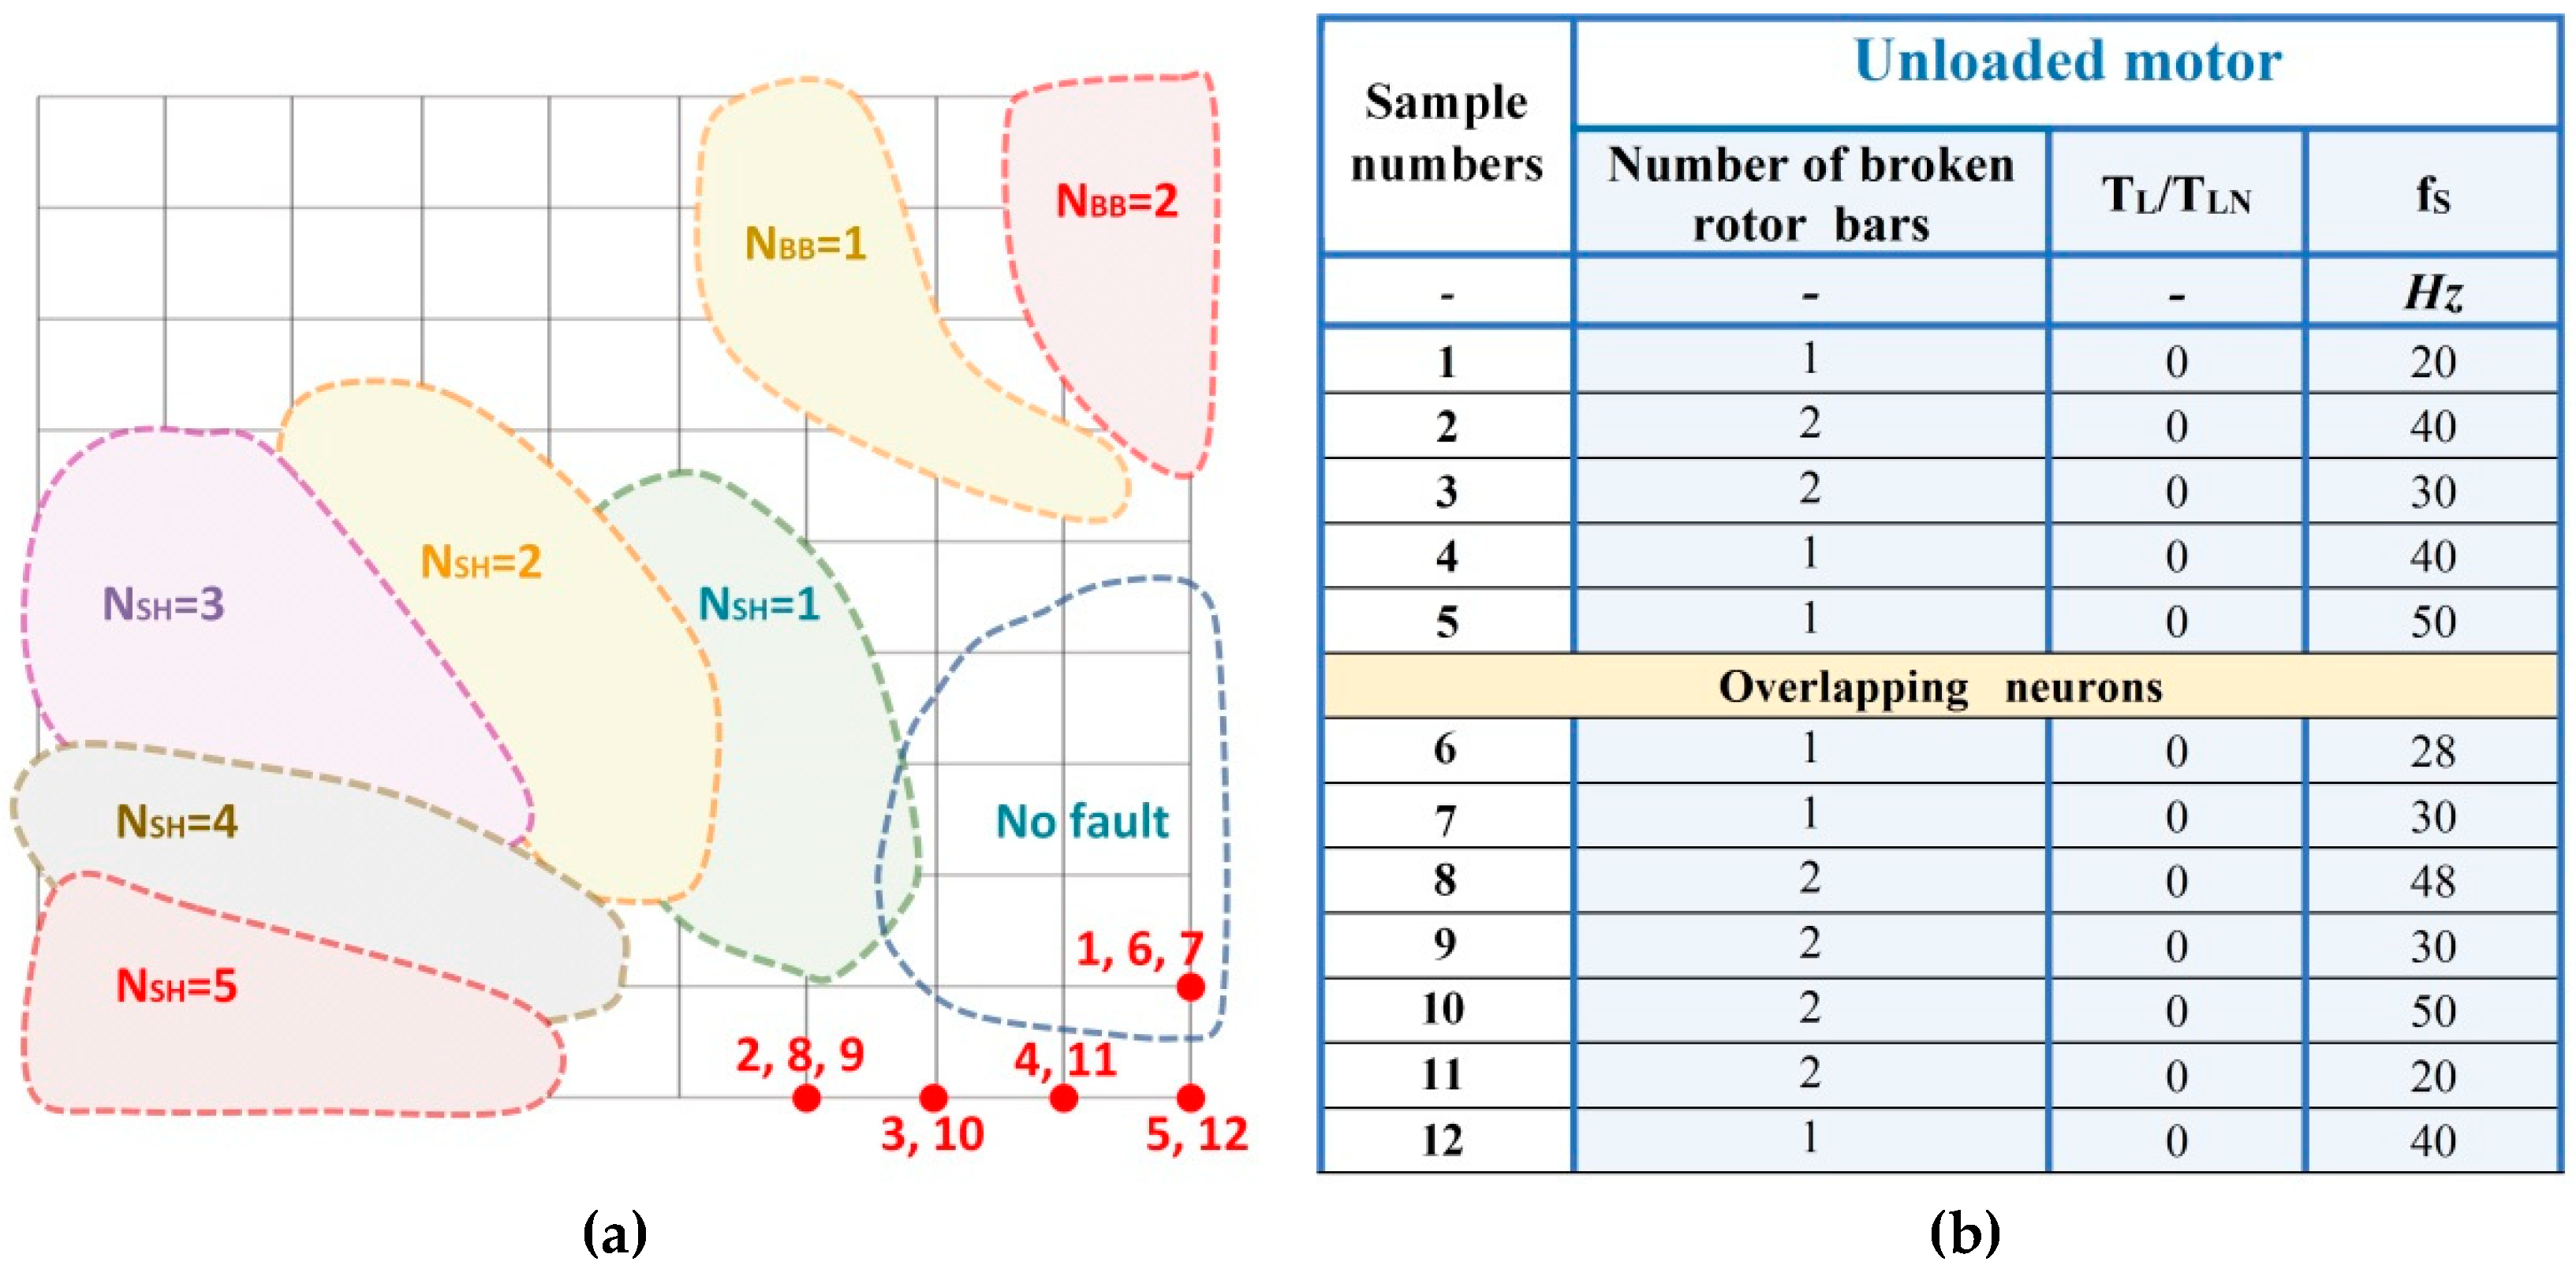
During the analysis of the SOM responses in the case of the damage of the rotor bars, stator inter-turn short-circuits as well as mixed damage, it was observed that for small values of the load torque, neurons located in the lower zones of the Kohonen map are stimulated. This fact gave the basis for testing the classification performance of the SOMs for unloaded drive (TL/TLN = 0). The results of these test are presented in Figure 14. At this stage of research, the classification tests were made only for the rotor failures. This is related to the strong relationship between motor slip and the magnitude values of the diagnostic signals for this type of machine defect.
As noted in Figure 15a, due to the lack of load torque, a part of the map that does not belong to any of the damage categories discussed earlier is separated. The Kohonen network did not allow for the classification of damage in the case of an unloaded motor, however, it provided information about an untypical situation for the tested machine. It can be used in a diagnostic procedure as a kind of alarm signal indicating the motor state.
Finally, the classification success rate was evaluated and summarized in Table 3. The analysis of the effectiveness of the self-organizing neural network was divided into two categories. As the first category, the detection effectiveness of IM individual failures (damaged/undamaged) was assessed. As can be seen from Table 3, the fault detection efficiency is on average 93% for a single fault type. The second category of KN efficiency was aimed at assessing its ability to classify a particular degree of damage. In the case of an unfaulty motor and for rotor faults the classification efficiency is similar to the fault detection accuracy (93–95%). In the case of stator faults, the classification is correct in 74% of cases. This fact is related to slight changes in diagnostic signals due to the increase of fault level. On the Kohonen map the areas characteristic of different numbers of shorted turns changed gradually (Figure 13a).
6. Conclusions
Summing up the research aimed at assessing the efficiency of the damage classification of electric circuits of an induction motor, it was found that the cooperation of SOM together with the ISCA of stator currents is an excellent diagnostic tool. The ISCA analysis makes it possible to identify symptoms of both rotor and stator damage in the spectrum of instantaneous negative–sequence component i2 of the stator current, contrary to the direct analysis of the stator current spectra. The information contained in the analysed spectrum enabled a short and effective process of learning in the Kohonen network. Due to the simplicity of implementation, and most importantly, the relatively small number of training samples necessary to ensure high reliability of SOM, this solution can be quickly introduced into automated diagnostic systems. The tests presented in the paper confirm the effectiveness of the ISCA analysis of stator currents along with the Kohonen self-organizing network in the fault detection process of the converter-fed induction motor.
We would like to emphasize that our intention was to show the possibility of categorizing two different faults using one network (classification problem). We considered three cases:
- -
- separate faults of stator winding (incipient short-turns; 1–5 turns),
- -
- separate faults of rotor winding (incipient rotor bar brakes; 1–2 bars),
- -
- simultaneous occurrence of stator and rotor incipient faults.
And it was shown in the paper that the proposed SOM network with properly pre-processed stator current signals (using the ISCA method) fulfilled our requirements. We proved that even one or two shorted turns or one broken bar (very incipient IM faults) can be recognized by our system as a faulted motor case, and the decision to disable it can be made by the service (motor operation is stopped automatically).
Despite the low power of the tested motor and the relatively weak influence of the analysed incipient electrical faults to the magnitudes of the chosen harmonics of the instantaneous symmetrical components (negative-sequence magnitude), we proved that it is possible to classify and detect those winding failures at their initial stage and to design a ready-for-use diagnostic system using AI tools, which can help end users in proper monitoring and diagnostic procedures of industrial drives.
In our opinion the AI based automatic diagnostic systems can help the end user not only in on-line diagnostics but also in preventing the faults (by trend prediction). However, to design such systems, deep expert knowledge is necessary.
Author Contributions
All the authors contributed equally to the concept of the paper. C.T.K and T.O.-K, proposed the methodology and paper organization; M.W. and M.S. carried out the measurements and analysed the experimental data (ISCA and SOM); T.O.-K. prepared the original draft and supervised the project; C.T.K. validated the obtained results; T.O.-K. revised and edited the final paper.
Funding
This research was partly supported by the National Science Centre Poland under grant number 2017/27/B/ST7/00816 and by statutory funds of the Faculty of Electrical Engineering of the Wroclaw University of Science and Technology (2018-2019).
Conflicts of Interest
The authors declare no conflict of interest.
References
- Capolino, G.A.; Antonino-Daviu, J.A.; Riera-Guasp, J.A.M. Modern diagnostics techniques for electrical machines, power electronics, and drives. IEEE Trans. Ind. Electron. 2015, 62, 1738–1745. [Google Scholar] [CrossRef]
- Henao, H.; Capolino, G.-A.; Fernandez-Cabanas, M.; Filippetti, F.; Bruzzese, C.; Strangas, E.; Pusca, R.; Estima, J.; Riera-Guasp, M.; Hedayati-Kia, S. Trends in Fault Diagnosis for Electrical Machines: A Review of Diagnostic Techniques. IEEE Ind. Electron. Mag. 2014, 8, 31–42. [Google Scholar] [CrossRef] [Green Version]
- Orłowska-Kowalska, T.; Kowalski, C.T.; Dybkowski, M. Fault-Diagnosis and Fault-Tolerant-Control in Industrial Processes and Electrical Drives. In Advanced Control of Electrical Drives and Power Electronic Converters; Studies in Systems, Decision and Control Series; Kabzinski, J., Ed.; Springer International Publishing: Cham, Switzerland, 2017; Volume 75, pp. 101–120. ISBN 978-3-319-45734-5. [Google Scholar]
- IEEE Motor Reliability Working Group. Report of large motor reliability survey of industrial and commercial installation, Part I–III. IEEE Trans. Ind. Appl. 1985, 21, 853–872. [Google Scholar]
- Electric Power Research Institute. Motor and Generator Insulation Life Estimation; EPRI Reports; Electric Power Research Institute: Palo Alto, CA, USA, 1992; Volume 1000185. [Google Scholar]
- Tavner, P.; Ran, L.; Penman, J.; Sedding, H. Condition Monitoring of Rotating Electrical Machines, 2nd ed.; IET Power and Energy Series; IET: London, UK, 2008; Volume 59. [Google Scholar]
- Thomson, W.T. A review of on-line condition monitoring techniques for three-phase squirrel-cage induction motors—Past, present and future. In Proceedings of the IEEE International Symposium on SDEMPED 1999, Gijón, Spain, 1–3 September 1999; pp. 3–18. [Google Scholar]
- Nussbaumer, P.; Mitteregger, A.; Wolbank, T.M. Online Detection of Insulation Degradation in Inverter Fed Drive Systems Based on High Frequency Current Sampling. In Proceeding of the 37th Annual Conference of the IEEE Inductrial Electronics Society (IECON 2011), Melbourne, Australia, 7–10 November 2011; pp. 1883–1888. [Google Scholar]
- Pinjia, Z.; Younsi, K.; Neti, V.A. Novel Online Stator Ground-Wall Insulation Monitoring Scheme for Inverter-Fed AC Motors. IEEE Trans. Ind. Appl. 2015, 51, 2201–2207. [Google Scholar]
- Grubic, S.; Aller, J.M.; Bin, L.; Habetler, T.G. A Survey on Testing and Monitoring Methods for Stator Insulation Systems of Low-Voltage Induction Machines Focusing on Turn Insulation Problems. IEEE Trans. Ind. Electron. 2008, 12, 4127–4136. [Google Scholar] [CrossRef]
- Zhang, P.; Du, Y.; Habetler, T.G.; Lu, B.A. Survey of condition monitoring and protection methods for medium-voltage induction motors. IEEE Trans. Ind. Appl. 2011, 47, 34–46. [Google Scholar] [CrossRef]
- Stone, G.C. Condition monitoring and diagnostics of motor and stator windings—A review. IEEE Trans. Dielectr. Electr. Insul. 2013, 20, 2073–2080. [Google Scholar] [CrossRef]
- Tallam, R.M.; Lee, S.B.; Stone, G.C.; Kliman, G.B.; Yoo, J.; Habetler, T.G.; Harley, R.G. A Survey of Methods for Detection of Stator-Related Faults in Induction Machine. IEEE Trans. Ind. Appl. 2007, 43, 920–933. [Google Scholar] [CrossRef]
- Nandi, S.; Toliyat, H.A.; Li, X. Condition monitoring and fault diagnosis of electrical motors—A review. IEEE Trans. Energy Convers. 2005, 20, 719–729. [Google Scholar] [CrossRef]
- Tallam, R.M.; Habetler, T.G.; Harley, R.G. Stator Winding Turn-Fault Detection for Closed-Loop Induction Motor Drives. IEEE Trans. Ind. Appl. 2003, 39, 720–724. [Google Scholar] [CrossRef]
- Wolkiewicz, M.; Tarchala, G.; Orlowska-Kowalska, T.; Kowalski, C.T. On-line stator inter-turn short circuits monitoring in the DFOC induction motor drive. IEEE Trans. Ind. Electron. 2016, 63, 2517–2528. [Google Scholar] [CrossRef]
- Kowalski, C.T.; Wierzbicki, R.; Wolkiewicz, M. Stator and rotor faults monitoring of the inverter-fed induction motor drive using state estimators. Automatika 2013, 54, 348–355. [Google Scholar] [CrossRef]
- Sharifi, R.; Ebrahimi, M. Detection of stator winding faults in induction motors using three-phase current monitoring. ISA Trans. 2011, 50, 14–20. [Google Scholar] [CrossRef]
- Kowalski, C.T.; Orlowska-Kowalska, T.; Wierzbicki, R.; Wolkiewicz, M. Analysis of the Inter-turn Fault Symptoms for the Converter-Fed Induction Motor Based on the Phase-Shift Calculation. In Proceedings of the 36th Annual Conference on IEEE Industrial Electronics Society (IECON), Glendale, AZ, USA, 7–10 November 2010; pp. 760–765. [Google Scholar]
- Mirzaeva, G.; Saad, K.I.; Jahromi, M.G. Comprehensive diagnostics of induction motor faults based on measurement of space and time dependencies of air gap flux. IEEE Trans. Ind. Appl. 2017, 53, 2657–2666. [Google Scholar] [CrossRef]
- Driff, M.; Cardoso, A.J.M. Stator fault diagnosis in squirrel cage three-phase induction motor drives using instantaneous active and reactive power signature analyses. IEEE Trans. Ind. Inform. 2014, 10, 1348–1360. [Google Scholar] [CrossRef]
- Tsypkin, M. Induction motor condition monitoring: Vibration analysis technique—A twice line frequency component as a diagnostic tool. In Proceedings of the IEEE International Electric Machines and Drives Conference (IEMDC), Chicago, IL, USA, 12–15 May 2013; pp. 117–124. [Google Scholar]
- Bouzid, M.; Champenois, G.A. Novel reliable indicator of stator windings fault in induction motor extracted from the symmetrical components. In Proceedings of the 20th IEEE International Symposium on Industrial Electronics (ISIE), Gdansk, Poland, 27–30 June 2011; pp. 1–7. [Google Scholar]
- Bouzid, M.B.K.; Champenois, G.; Tnani, S. Reliable stator fault detection based on the induction motor negative sequence current compensation. Electr. Power Energy Syst. 2018, 95, 490–498. [Google Scholar] [CrossRef]
- Kowalski, C.T.; Wolkiewicz, M. Stator faults of the converter-fed induction motor using symmetrical components and neural network. In Proceedings of the 13th European Conference on Power Electronics and Applications EPE, Barcelona, Spain, 8–10 September 2009; pp. 1–6. [Google Scholar]
- Wolkiewicz, M.; Kowalski, C.T. Incipient stator fault detector based on neural networks and symmetrical components analysis for induction motor drives. In Proceedings of the 2016 Selected Issues of Electrical Engineering and Electronics (WZEE), Rzeszow, Poland, 4–8 May 2016; pp. 1–7. [Google Scholar]
- García, P.; Briz, F.; Degner, M.W.; Diez, A.B. Diagnostics of Induction Machines using the Zero Sequence Voltage. In Proceedings of the 39th IAS Annual Meeting 2004 IEEE Industry Applications Conference, Seattle, WA, USA, 3–7 October 2004; pp. 735–742. [Google Scholar]
- Dahi, K.; El Hani, S.; Ouachtouk, I. Reliable Detection of Rotor Faults in IM using Frequency Tracking and Zero Sequence Voltage. Adv. Electr. Electron. Eng. 2017, 15, 136–145. [Google Scholar] [CrossRef]
- Kowalski, C.T.; Orlowska-Kowalska, T. Neural Networks Application for the Induction Motor Faults Detection. Math. Comput. Simul. 2003, 63, 435–448. [Google Scholar]
- Mehrjou, M.R.; Mariun, N.; Marhaban, M.H.; Norhisam, M. Rotor fault condition monitoring techniques for squirrel-cage induction machine—A review. Mech. Syst. Signal Process. 2011, 25, 2827–2848. [Google Scholar] [CrossRef]
- Benbouzid, M.A. Review of Induction Motors Signature Analysis as a Medium for Faults Detection. IEEE Trans. Ind. Electron. 2000, 47, 984–993. [Google Scholar] [CrossRef]
- Liu, Y.; Bazzi, A.M. A review and comparison of fault detection and diagnosis methods for squirrel-cage induction motors: State of the art. ISA Trans. 2017, 70, 400–409. [Google Scholar] [CrossRef]
- Kowalski, C.T.; Orlowska-Kowalska, T. Application of Neural Networks for the Induction Motor Faults Detection. Trans. IMACS Math. Comput. Simul. 2003, 63, 435–448. [Google Scholar] [CrossRef]
- Bellini, A.; Filippetti, F.; Tassoni, C.; Capolino, G.A. Advances in Diagnostic Techniques for Induction Machines. IEEE Trans. Ind. Electron. 2008, 55, 4109–4125. [Google Scholar] [CrossRef]
- Asfani, D.A.; Muhammad, A.K.; Syafaruddin; Purnomo, M.H.; Hiyama, T. Temporary short circuit detection in induction motor winding using combination of wavelet transform and neural network. Expert Syst. Appl. 2012, 39, 5367–5375. [Google Scholar] [CrossRef] [Green Version]
- Wolkiewicz, M.; Kowalski, C.T. On-line Neural Network based Stator Fault Diagnosis system of the Converter-Fed Induction Motor Drive. In Proceedings of the 39th Annual Conference of the IEEE Industrial Electronics Society (IECON 2013), Vienna, Austria, 10–13 November 2013; pp. 5561–5566. [Google Scholar]
- Khalfaoui, N.; Salah Salhi, M.; Amiri, H. The SOM tool in mechanical fault detection over an electric asynchronous drive. In Proceedings of the 2016 4th International Conference on Control Engineering & Information Technology (CEIT 2016), Hammamet, Tunisia, 16–18 December 2016; pp. 1–6. [Google Scholar]
- Sid, O.; Menaa, M.; Hamdani, S.; Touhami, O.; Ibtiouen, R. Self-organizing map approach for classification of electricals rotor faults in induction motors. In Proceedings of the 2nd International Conference on Electric Power and Energy Conversion Systems (EPECS 2011), Sharjah, UAE, 15–17 November 2011; pp. 1–6. [Google Scholar]
- Germen, E.; Basaran, M.; Fidan, M. Sound based induction motor fault diagnosis using Kohonen self-organizing map. Mech. Syst. Signal Process. 2014, 46, 45–58. [Google Scholar] [CrossRef]
- Paap, G.C. Symmetrical components in the time domain and their application to power network calculations. IEEE Trans. Power Syst. 2000, 15, 522–528. [Google Scholar] [CrossRef] [Green Version]
- Hsu, J.S. Instantaneous phasor method for obtaining instantaneous balanced fundamental components for power quality control and continuous diagnostics. IEEE Trans. Power Deliv. 1998, 13, 1494–1500. [Google Scholar] [CrossRef] [Green Version]
- Chen, C.C.; Hsu, Y.Y. A novel approach to the design of a shunt active filter for an unbalanced three-phase four-wire system under nonsinusoidal conditions. IEEE Trans. Power Deliv. 2000, 15, 1258–1264. [Google Scholar] [CrossRef]
- Iravani, M.R.; Karimi-Ghartemani, M. Online estimation of steady state and instantaneous symmetrical components. IEE Proc. Gener. Transm. Distrib. 2003, 150, 616–622. [Google Scholar] [CrossRef]
- Freeman, J.A.; Skapura, D.M. Neural Networks Algorithms. Applications and Programming Techniques; Addison-Wesley Publishing Company: Boston, MA, USA, 1992; pp. 263–289. ISBN 0-201-51376-5. [Google Scholar]
- Demuth, H.; Beale, M. Neural Network Toolbox—User’s Guide; Version 4; The MathWorks, Inc.: Natick, MA, USA, 2004. [Google Scholar]
Figure 1.
Procedure of stator and rotor fault symptoms analysis using instantaneous symmetrical components of the stator current. FFT: Fast Fourier Transform.
Figure 1.
Procedure of stator and rotor fault symptoms analysis using instantaneous symmetrical components of the stator current. FFT: Fast Fourier Transform.

Figure 2.
Schematic diagram of the Kohonen network.

Figure 3.
Experimental setup: (a) block diagram; (b) real view. PWM: pulse width modulation.

Figure 4.
Illustration of the physical modelling of stator and rotor fault: (a) connection of the stator winding for inter-turn short-circuit modelling; (b) broken bars modelling in squirrel-cage rotor.
Figure 4.
Illustration of the physical modelling of stator and rotor fault: (a) connection of the stator winding for inter-turn short-circuit modelling; (b) broken bars modelling in squirrel-cage rotor.

Figure 5.
FFT analysis of the positive-sequence instantaneous symmetrical component i1 of the stator current for nominal load torque and fs = 50 Hz with (a) different number of shorted turns Nsh; (b) different number of broken bars Nbb.
Figure 5.
FFT analysis of the positive-sequence instantaneous symmetrical component i1 of the stator current for nominal load torque and fs = 50 Hz with (a) different number of shorted turns Nsh; (b) different number of broken bars Nbb.

Figure 6.
FFT analysis of the negative-sequence instantaneous symmetrical component i2 of the stator current for nominal load torque and fs = 50 Hz with (a) different number of shorted turns Nsh; (b) different number of broken bars Nbb.
Figure 6.
FFT analysis of the negative-sequence instantaneous symmetrical component i2 of the stator current for nominal load torque and fs = 50 Hz with (a) different number of shorted turns Nsh; (b) different number of broken bars Nbb.

Figure 7.
Changes of the amplitude value of negative-sequence instantaneous symmetrical component i2 of the stator current with frequencies: fs (a), 5fs − 2sfs (b), and 5fs − 4sfs (c), for different number of shorted turns Nsh (a), different number of broken bars Nbb (b,c), and different load torque TL and supplied frequency fs.

Figure 8.
Procedure of stator and rotor windings diagnosis using ISCA and Kohonen network (SOM): (a) flow chart of the signal processing; (b) scheme of the SOM network with the analysed inputs (in our case SOM size is 10 × 10).
Figure 8.
Procedure of stator and rotor windings diagnosis using ISCA and Kohonen network (SOM): (a) flow chart of the signal processing; (b) scheme of the SOM network with the analysed inputs (in our case SOM size is 10 × 10).

Figure 9.
Illustration of the behaviour of the Kohonen Network (KN) under training.

Figure 10.
Influence of the learning rate to the SOM neighbourhood distances: (a) η = 0.8; (b) η = 0.3.
Figure 10.
Influence of the learning rate to the SOM neighbourhood distances: (a) η = 0.8; (b) η = 0.3.

Figure 11.
Influence of the number of training epochs to the SOM neighbourhood distances: (a) 600 training epochs; (b) 200 training epochs.
Figure 11.
Influence of the number of training epochs to the SOM neighbourhood distances: (a) 600 training epochs; (b) 200 training epochs.

Figure 12.
Classification of the rotor cage damage of the induction motor: (a) Kohonen map 10 × 10: dotted lines—IM damage categories involved in the classification, hatched areas—IM damage categories not involved in the classification; (b) specification of test data parameters; TL—load torque, TLN—rated motor torque, fs—frequency of the supply voltage, Nsh —number of shorted turns in the stator winding. IM: induction motor.

Figure 13.
Classification of the induction motor failures: (a) stator windings faults: dotted lines—IM damage categories involved in the classification, hatched areas—IM damage categories not involved in the classification; (b) mixed faults: dotted lines—IM damage categories not involved in the classification; 10 × 10 SOM; Nsh—number of shorted turns in the stator winding, Nbb—number of broken rotor bars.

Figure 14.
Specification of the test data parameters for the classification of the stator winding faults with 10 × 10 SOM; TL—load torque, TLN—rated motor torque, fs—frequency of the supply voltage.
Figure 14.
Specification of the test data parameters for the classification of the stator winding faults with 10 × 10 SOM; TL—load torque, TLN—rated motor torque, fs—frequency of the supply voltage.

Figure 15.
Classification of the rotor failures for no-load operation mode: (a) Kohonen map 10 × 10: dotted lines—IM damage categories involved in the classification, hatched areas—IM damage categories not involved in the classification; Nsh—number of shorted turns in the stator winding, Nbb—number of broken rotor bars; (b) specification of test data parameters; TL—load torque, TLN—rated motor torque, fs—frequency of the supply voltage.


Table 1.
Rated parameters of the tested induction motor.
| Name of the Parameter | Symbol | Units | |
|---|---|---|---|
| Power | PN | 1500 | [W] |
| Torque | MN | 10.16 | [Nm] |
| Speed | NN | 1410 | [r/min] |
| Stator phase voltage | UsN | 230 | [V] |
| Stator current | IsN | 3.5 | [A] |
| Frequency | fsN | 50 | [Hz] |
| Pole pairs number | pp | 2 | [-] |
| Number of rotor bars | Nr | 26 | [-] |
| Number of stator turns in each phase | Ns | 312 | [-] |
Table 2.
Parameters of the self-organising neural network.
| Training Vector Size | 104 | |
| Test Vector Size | 150 | |
| Number of Faults Categories | Shorted turns: 5 Broken bars: 3 | |
| Neural Network Inputs | I2(fs), I2(5 s − 2fbb), I2(5fs − fbb) | |
| Training Method | WTM (Winner Takes Most) | |
| Neural Network Structure | 20 × 20 | 10 × 10 |
| Number of Training Epochs | 700 | 600 |
| Neural Network Topology | hexagonal | |
| Neighbourhood Function | Gaussian | |
| Neighbourhood Radius | 2 | |
| Learning Rate | 0.8 | |
Table 3.
Effectiveness of Kohonen network in fault detection and classification.
| Shorted Turns | Broken Cars | Mixed Faults | No Fault | |
|---|---|---|---|---|
| Approximate effectiveness of faults detection | 90 % | 93% | 72% | 95% |
| Approximate effectiveness of faults classification | 74% | 93% | - | 95% |
© 2019 by the authors. Licensee MDPI, Basel, Switzerland. This article is an open access article distributed under the terms and conditions of the Creative Commons Attribution (CC BY) license (http://creativecommons.org/licenses/by/4.0/).
Share and Cite
MDPI and ACS Style
Skowron, M.; Wolkiewicz, M.; Orlowska-Kowalska, T.; Kowalski, C.T. Application of Self-Organizing Neural Networks to Electrical Fault Classification in Induction Motors. Appl. Sci. 2019, 9, 616. https://doi.org/10.3390/app9040616
AMA Style
Skowron M, Wolkiewicz M, Orlowska-Kowalska T, Kowalski CT. Application of Self-Organizing Neural Networks to Electrical Fault Classification in Induction Motors. Applied Sciences. 2019; 9(4):616. https://doi.org/10.3390/app9040616
Chicago/Turabian StyleSkowron, Maciej, Marcin Wolkiewicz, Teresa Orlowska-Kowalska, and Czeslaw T. Kowalski. 2019. "Application of Self-Organizing Neural Networks to Electrical Fault Classification in Induction Motors" Applied Sciences 9, no. 4: 616. https://doi.org/10.3390/app9040616
Note that from the first issue of 2016, this journal uses article numbers instead of page numbers. See further details here.