Aerodynamic Design and Off-design Performance Analysis of a Multi-Stage S-CO2 Axial Turbine Based on Solar Power Generation System


1
Shaanxi Provincial Engineering Laboratory of Turbomachinery and Power Equipment, School of Energy and Power Engineering, Xi’an Jiaotong University, Xi’an 710049, China
2
MOE Key Laboratory of Thermo-Fluid Science and Engineering, School of Energy and Power Engineering, Xi’an Jiaotong University, Xi’an 710049, China
*
Author to whom correspondence should be addressed.
Appl. Sci. 2019, 9(4), 714; https://doi.org/10.3390/app9040714
Submission received: 17 January 2019
/
Revised: 15 February 2019
/
Accepted: 15 February 2019
/
Published: 19 February 2019
(This article belongs to the Special Issue Green Energy and Applications)
Abstract
:Featured Application
This research synthesizes the advantage of clean energy solar energy and the special physical properties of supercritical carbon dioxide, which provides a theoretical basis for the application of the S-CO2 turbine in the field of solar power generation.
Abstract
Solar energy is an inexhaustible source of clean energy. Meanwhile, supercritical carbon dioxide has excellent characteristics such as easy access to critical conditions, high density, and low viscosity, making it one of the most popular circulating working fluids in solar power generation technology. However, solar power generation systems are severely affected by geographical distribution, seasonal variations and day-night cycles. Therefore, efficient and adaptable turbine design is the key to realize supercritical carbon dioxide solar power generation technology. In this paper, the initial thermodynamic design of 10 MW S-CO2 three-stage axial turbine is completed by self-developed thermodynamic design software, and the key thermodynamic and structural parameters are obtained. The optimal design of turbine and its aerodynamic performance at rated operating conditions are obtained by using a three-dimensional aerodynamic numerical analysis and optimization method. At last, nine off-design conditions are analyzed in detail. The results show that the designed turbine output power is 10.37 MW and the total-total efficiency is 91.60%. It can operate efficiently and steadily in the range of output power from 16.2% to 155.9%. It can adapt to the variable operating conditions of solar power generation system and meet the design requirements.
1. Introduction
In addition to the excellent properties of supercritical fluid, supercritical carbon dioxide (S-CO2) is characterized by a lower critical temperature of 31.1 °C and a critical pressure of 7.38 MPa [1], which is an accessible critical condition. Meanwhile, supercritical carbon dioxide is colorless, odorless, non-toxic, and chemically inert. It is an environmentally friendly natural working fluid with characters of non-flammable, non-explosive, safe, cheap, low values of ozone depletion potential and climate warming potential [2,3]. The Brayton cycle power generation system using this working fluid has the advantages of compact structure, high cycle efficiency and low cost [4,5], which makes supercritical carbon dioxide receive extensive attention in the field of solar power generation in recent years.
For the S-CO2 Brayton cycle, E.G. Fehert [6] proposed the use of supercritical cycles to substitute the Rankine cycle and the regenerative Brayton cycle as early as 1968. He pointed out that the supercritical cycle working fluid can be any fluid, especially indicating that S-CO2 has many advantages as a working fluid. Some scholars [7,8] compared the S-CO2 cycle under different boundary conditions with the He Brayton cycle and the water vapor Rankine cycle system, and found that the S-CO2 cycle system has certain advantages in terms of economy and efficiency. In the use of solar energy, Osorio, J.D. et al. [9] studied the concentrated solar S-CO2 cycle under different season conditions. They optimized the parameters of the system and found the optimization efficiency was 21%, and the maximum output power was 1.6 MW. Luu, M. T. et al. [10] proposed a “combination“ cycle including recompression, reheating, and intercooling in order to adapt the concentrated solar S-CO2 cycle to fluctuations in available solar intensity. Fahad A. et al. [11] studied the thermodynamic performance of five S-CO2 Brayton cycles integrated with solar towers using an evolutionary algorithm. The study concluded that the highest thermal efficiency was achieved by recompression Brayton cycle at noon in June. The maximum integrated system thermal efficiency is 40%.
In the theoretical design and experimental research of the S-CO2 turbine, the US Sandia National Laboratory (SNL) [12,13] developed the S-CO2 turbine with a power of 92 kW in 2010, which can test various cycles including a regenerative cycle, intercooling and recompression cycle. Schmitt et al. [14] designed a 6-stage S-CO2 turbine with power up to 100 MW and inlet temperature up to 1350 K, and optimized the parameters of each velocity triangle.. Based on the Sunshot project, the Southwest Research Institute of the United States [15] established a supercritical carbon dioxide closed recompression Brayton cycle system using solar energy, and designed an efficient multi-stage axial turbine for the S-CO2 Brayton cycle. H Zhang et al. [16] designed a single-stage MW-stage S-CO2 axial and radial turbine. The axial turbine power is 15 MW, the rotational speed is 10,000 rpm, the total static efficiency is 83.96%. The radial turbine power is 1.5 MW, the rotational speed is 45,000 rpm, and the total static efficiency is 80.02%. Zhang et al. [17] achieved the non-design effect of S-CO2 radial turbine by changing the diameter of the leading edge of the nozzle, and carried out comprehensive numerical analysis to obtain the non-design performance of the radial turbine. J. Lee et al. [18] proposed an improved method for mechanical design of S-CO2 turbines using programming methods, and compared the thermal performance of axial turbines and radial turbines under the same conditions. Hiroshi Hasuike et al. [19] designed an S-CO2 gas turbine with a net output power of 10 kW and a working fluid recirculation flow rate of 1.2 kg/s, and conducted a principle and demonstration test. The radial turbine speed is 100,000 rpm, and preliminary results show that the compressor consumes less power in the S-CO2 gas turbine.
In summary, the application of efficient and compact S-CO2 Brayton cycle system to solar power generation is a new development direction of green energy. As the key equipment of the whole power cycle, the aerodynamic performance and the off-design performance of the turbine have a decisive influence on the cycle efficiency. Therefore, the S-CO2 turbine is the core to promote the green power generation technology. The output power of the axial turbine varies over a larger range than the radial turbine. Besides, multi-stage turbine has higher operating efficiency than single-stage one. However, there are three main difficulties in the design of multi-stage S-CO2 axial turbines at present: (1) the structure of the multi-stage axial turbine is complicated and the design is difficult; (2) based on the special physical properties of S-CO2, the conventional axial turbine design principles and methods are no longer applicable, which makes the design difficulty further increased; (3) solar power generation systems are severely affected by geographical distribution, seasonal variations and day-night cycles, good off-design performance of turbines is the most critical factor. Based on the research background above, this paper designs a 10 MW three-stage axial turbine for solar energy S-CO2 Brayton cycle power generation system, and studies its aerodynamic performance and off-design performance. It provides a theoretical basis for the application of S-CO2 turbines in the field of solar power generation.
2. Research Objects and Numerical Methods
In this paper, the MW-stage S-CO2 axial turbine used in solar power generation system is studied, and the one-dimensional thermal design and the three-dimensional geometric design are carried out. The aerodynamic performance and the off-design performance are analyzed. The overall research ideas are shown in Figure 1. Firstly, the initial parameters of the turbine design are determined. Secondly, the thermal design software developed by independent design is used to carry out the thermal design, and the thermal parameters and structural parameters of the key position of nozzle and rotor are obtained. Then, the three-dimensional modeling software ANSYS-BladeGen is adopted to design and optimize the nozzle and the rotor, and the fluid domain model of the turbine cascade is generated. The designed turbine is subjected to three-dimensional steady aerodynamic analysis by the CFD numerical analysis software NUMECA. Next, the turbine design parameters are optimized based on numerical results and generating new designs. Finally, the three-dimensional aerodynamic analysis and the off-design condition analysis are performed on the optimal turbine design.
2.1. Thermal Design
The turbine’s thermal calculation is done by self-developed design software (S-CO2TBTD) designed by Visual Basic 6.0 and Intel Fortran 2013. The software consists of five modules: (1) Data Input: input parameters, and exchange data with computing program after processed by data management module. (2) Core Calculation: calculate the state parameters and input power of the compressor by one-dimensional thermal design method, then output the calculation results after convergence. (3) Data Output: after calculating each module, the main contents are exported to the software interface, also supporting the derivation of the result files. (4) Drawing: showing the relation curves between the investigation parameters when designing the turbine and the operating parameters, also supporting the derivation of the result files. (5) Secondary Exploration: for user extension functions, such as adding more performance impact parameters and more available working materials, designing more detailed computing processes, and even adding optimization processes for specific parameters.
According to the one-dimensional flow theory, the main ideas and methods of Core Calculation are as follows:
- The series z and Reaction coefficient Ω are determined to obtain the enthalpy drop distribution of each row of cascades.where is enthalpy drop in rotor cascade, is total stagnation enthalpy drop.
- The ideal speed cs of the stage is determined by the enthalpy drop of the stage, and the speed ratio xa is prefabricated in the optimum range to obtain the wheel circumference velocity U.
- The outlet velocities of nozzles (c1) and rotor blades (c2) are obtained by prefabricating the speed coefficient and prefabricating the inlet and outlet flow angle in the optimum range.
- The average diameter dm of the stage is preliminarily determined by the wheel circumference velocity U.
- Calculating the circumference loss and the actual loss of the whole machine.The efficiency of the wheel periphery :where relative loss of nozzle , relative loss of rotor , exit losses .
- Determining relative internal efficiency of the turbine.where is structural loss coefficient, is friction loss coefficient.
- Checking the speed coefficient and flow coefficient μ, and revising the speed ratio xa and the inlet and outlet flow angle in the optimum range to obtain the optimum turbine efficiency.
- According to the aerodynamic parameters of each stage, the geometric parameters of the nozzle and impeller are obtained.
Firstly, entering the five determined initial design parameters in the thermal design software: power, rotation speed, total inlet pressure, total inlet temperature, and static outlet pressure, as shown in Table 1.
Secondly, according to the existing published literature, empirical formula and experimental curve, the five pre-fetch parameters including the speed coefficient, reaction coefficient, flow coefficient, installation angle and relative pitch of each stage cascade are pre-fetched and input into the thermal design software. The specific value is shown in Table 2.
By using the initial design parameters and pre-fetch parameters as input variables, taking 50% blade height section as the research object, regarding turbine efficiency and axial exhaust as the design goal, and then using the thermal design software to iteratively calculate the aerodynamic parameters such as inlet speed, exit speed and airflow angle of each cascade, a set of reasonable turbine key structural parameters are finally output, as shown in Table 3. This work provides the basis for subsequent 3D geometric design.
2.2. Structural Design
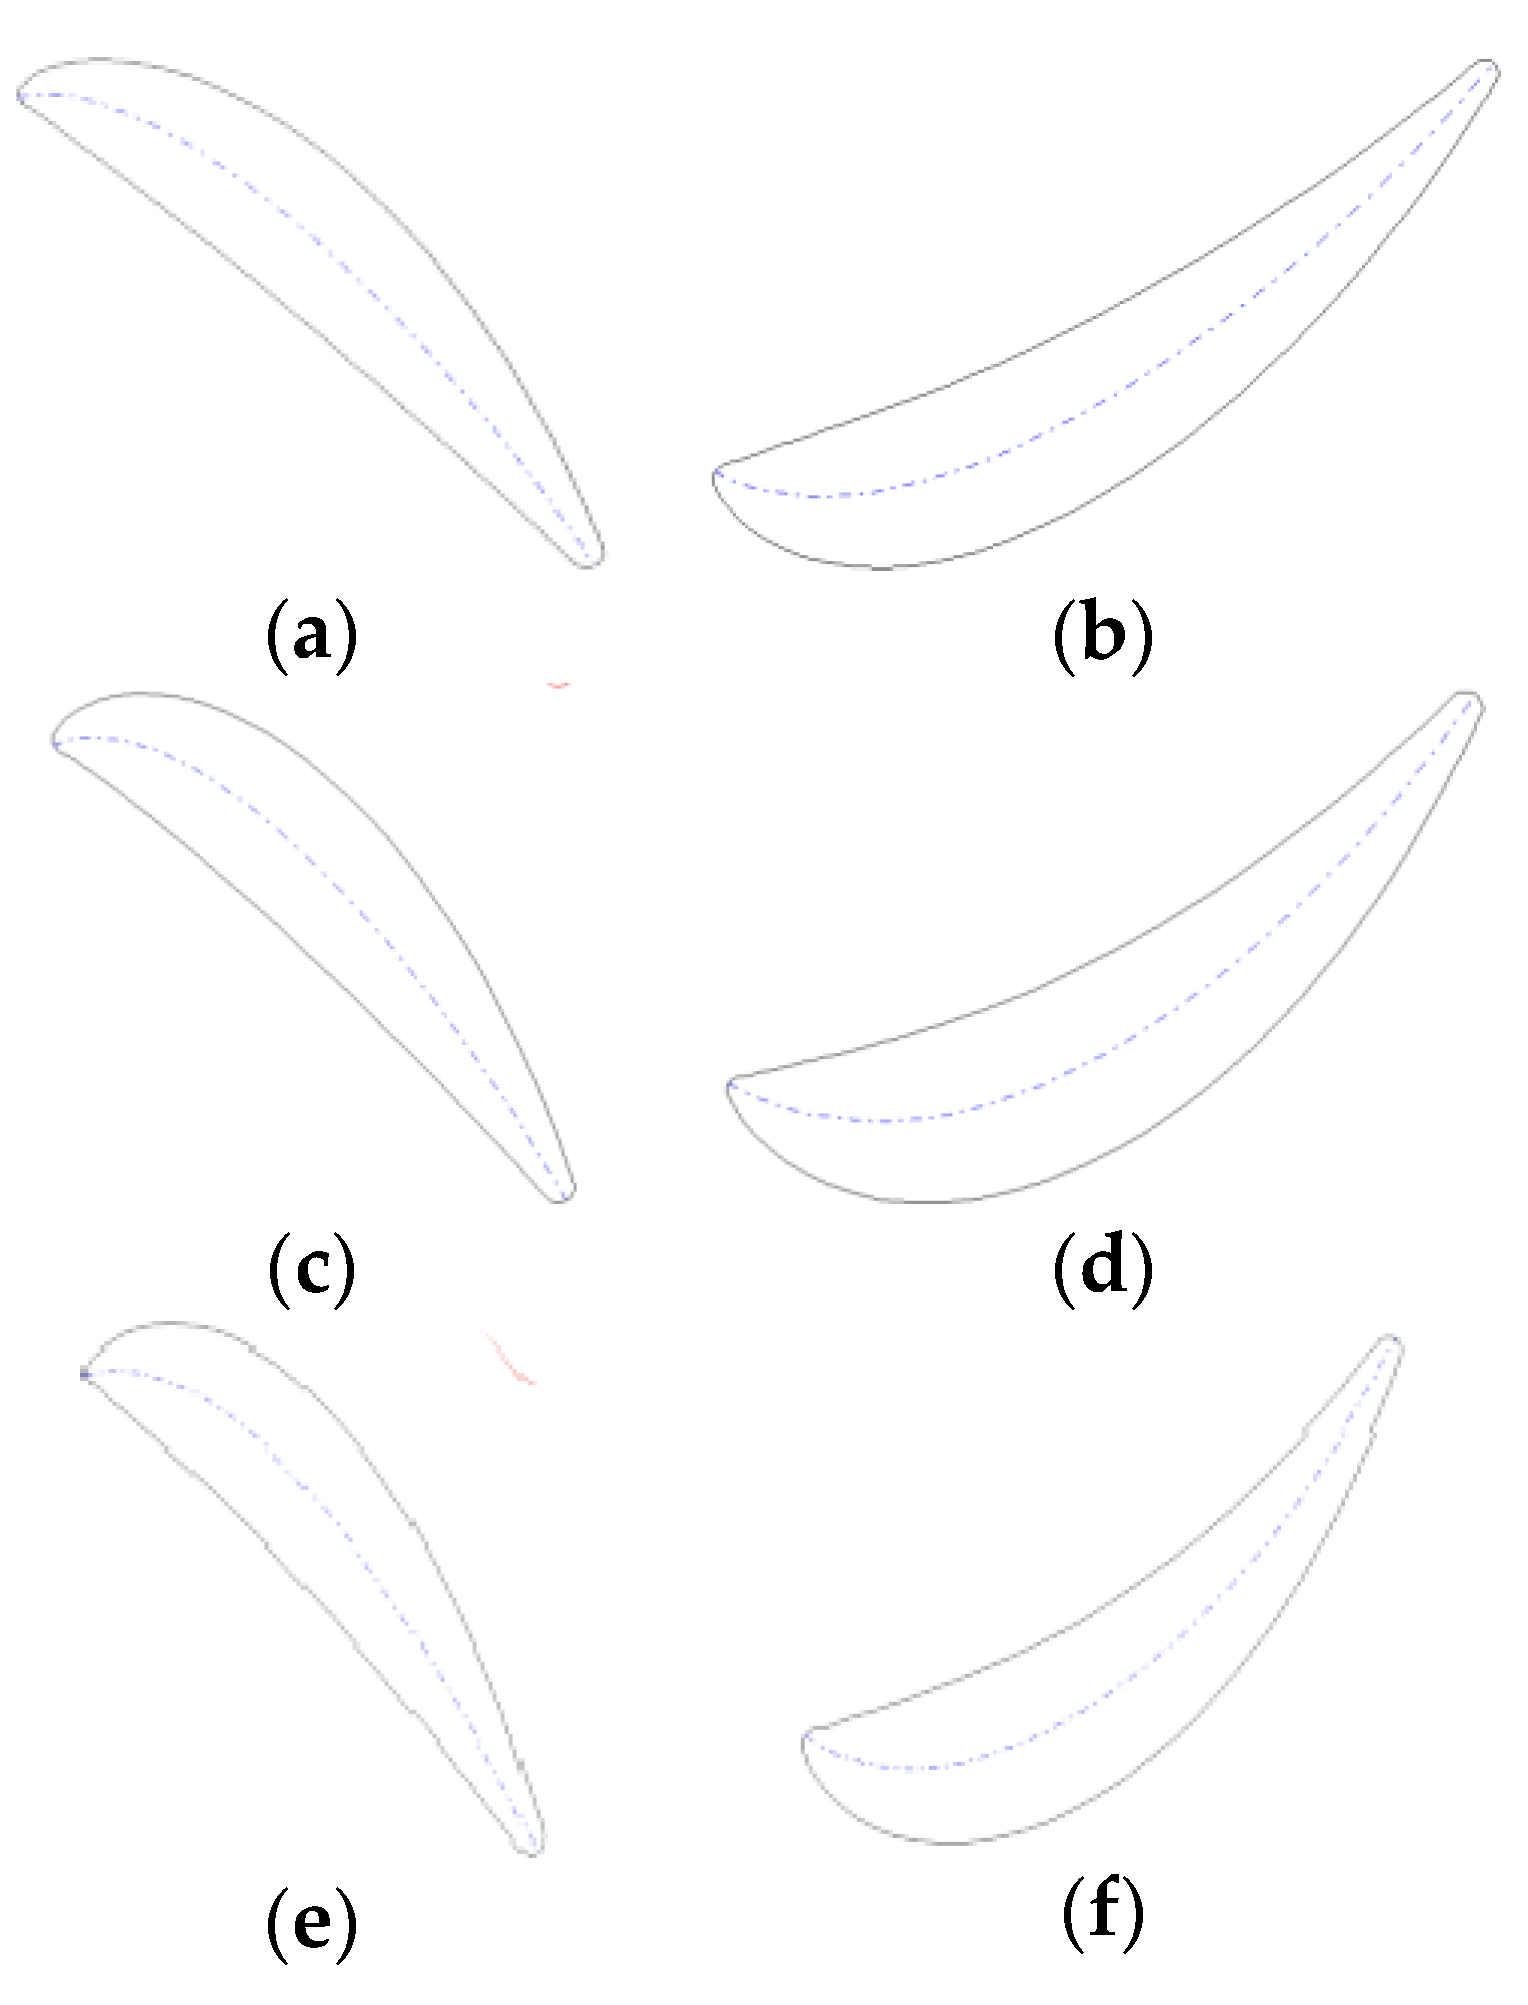
The structural design of the nozzles and rotors of the S-CO2 turbine is done in 3D modeling software ANSYS-BladeGen. The blade profile has different optimal design shapes for different types of turbomachinery, inlet parameters, working fluids, geometrical parameters of cascade, etc. Although the physical parameters of S-CO2 are quite different from those of gas and steam, researchers have accumulated sufficient experience in blade design of gas turbine and steam turbine for many years. Considering that S-CO2 is close to gaseous fluid in tension and viscosity, we can still refer to their classical blades as a reference for blade design. The blade design in this study takes the form of straight blades, and the blade profile remains constant along the blade height. In order to reduce the flow loss of working fluid on the pressure side, the pressure side profile was linearized. In addition, the radian of the suction side is also reduced to improve the flow separation of the boundary layer on the suction side. The maximum thickness is about 40% of the leading edge of the midline. The geometry angles of the inlet and outlet of the cascade of the turbine initial design are determined by the reference to the thermal design results. Then according to the flow condition of three-dimensional aerodynamic analysis of the initial design, the geometrical angles of the inlet and outlet of the rear row cascade are corrected stage by stage, which makes the aerodynamic efficiency of the S-CO2 turbine optimal. Figure 2a–f show schematic diagrams of the final profiles of the nozzles and rotors of each stage.
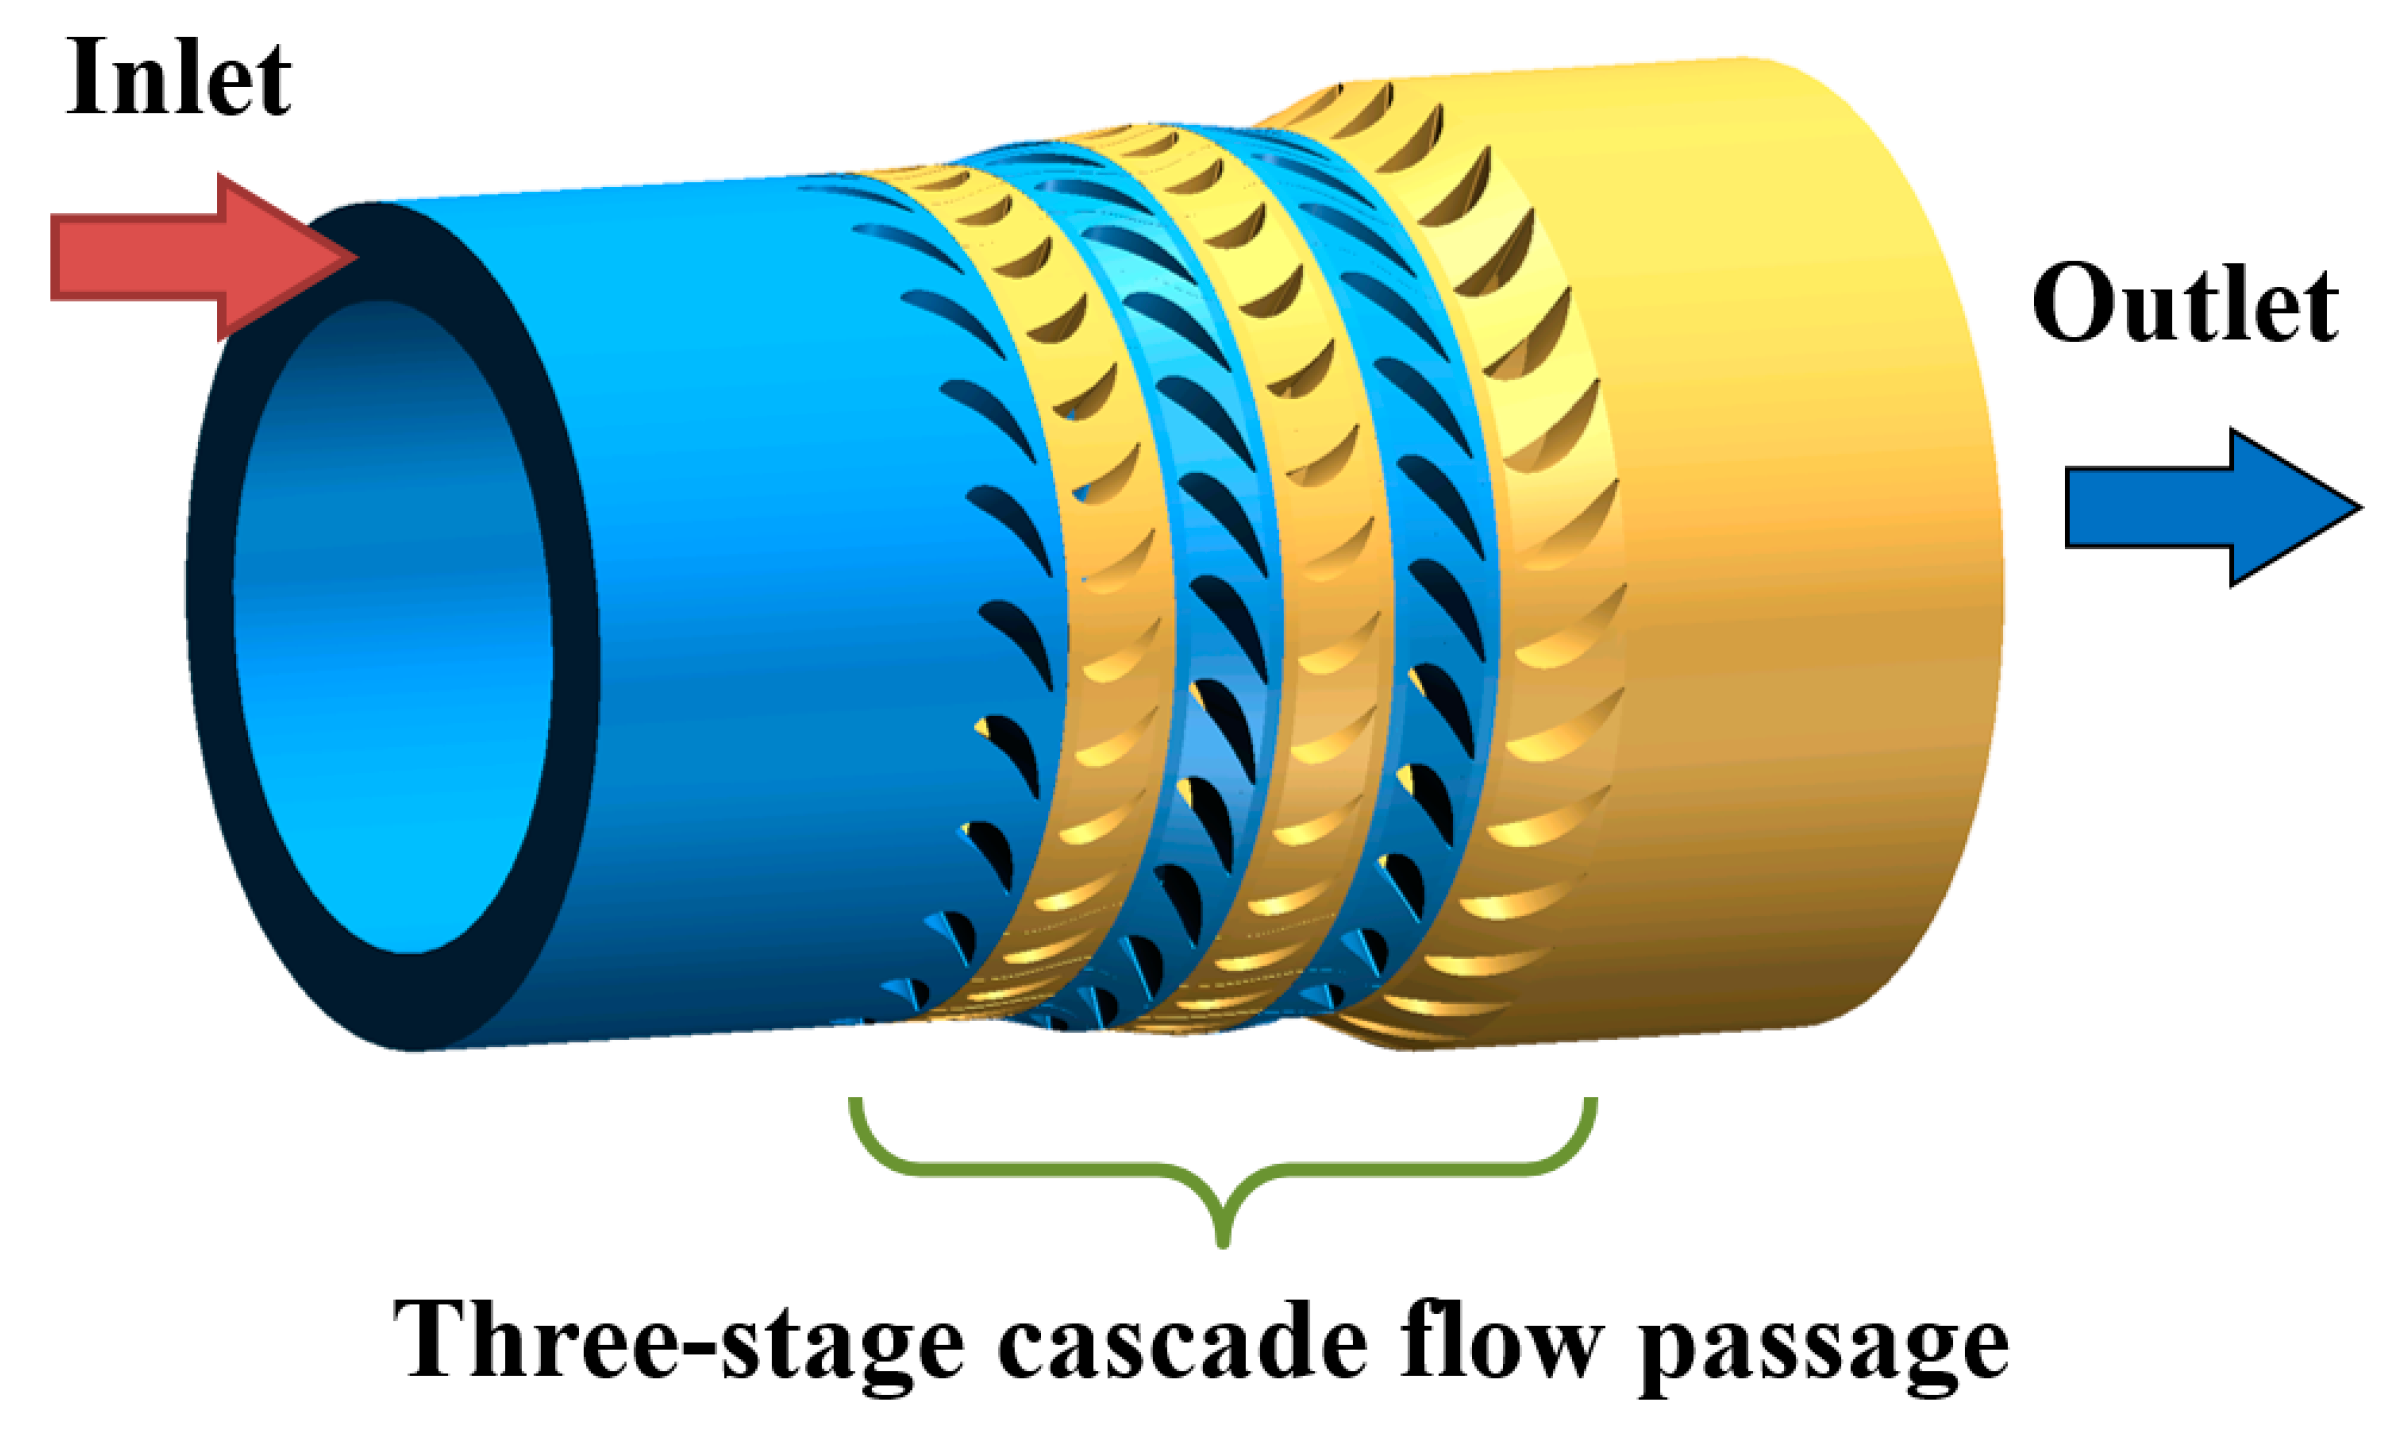
According to the profiles and flow passage of the key geometric parameters of turbine cascades, a three-dimensional geometric modeling of the fluid domain of the designed three-stage axial turbine is completed, including inlet extension, three-stage cascade flow passage and outlet extension, as shown in Figure 3.
2.3. Governing Equation and Turbulence Model
The governing equations mainly include mass conservation equations, momentum conservation equations and energy conservation equations. The governing equations for its main variables can be expressed in the following general forms:
where ρ is density, t is time, U is speed, ΓΦ is generalized diffusion coefficient, SΦ is the generalized source term. Φ is a general variable, and Φ = 1 in mass equation. In the momentum equation, let Φ take u, v, w respectively. In the energy equation, Φ = T. And in the mass equation, let SΦ take 0.
A two-equation k-ω SST turbulence model is taken, which has a faster calculation speed and higher calculation accuracy for complex flows such as boundary layer flow. This model combines the advantages of the k-ε turbulence model and k-ω turbulence model. Other scholars [20,21] have compared the numerical results of this turbulence model with the experimental results in the process of turbomachinery research, and the results show that they are in good agreement. k equation and ω equation are as follows [22,23].
k equation:
where k is the unit mass fluid turbulent pulsating kinetic energy, Pk is the turbulent energy generation, β* is the turbulence model coefficient, ω is the turbulent kinetic energy dissipation rate, μ is the kinematic viscosity coefficient, μt is the turbulent viscosity coefficient, σk is the k equation coefficient.
ω equation:
where γ and β are turbulence model coefficients, νt is vortex viscosity, σω is the ω equation coefficient. F1 is the functional function with 1 at the near wall and 0 at the far surface.
2.4. Physical Properties and Boundary Conditions
Three-dimensional steady aerodynamic calculation of the designed S-CO2 axial turbine is completed by CFD software NUMECA, in which a single flow channel is adopted. In this paper, in order to accurately simulate the physical properties of the working fluid, the explicit equations in the Helmholtz energy equation, the modified Benedict–Webb–Rubin equation of state (abbreviated as MBWR equation) and the extended corresponding state (ECS) model are used to describe the characteristic parameters of the state points, based on a large amount of carbon dioxide physical property data. The MBWR equation contains 32 parameters, the accuracy of fitting pure fluids is high, the pressure deviation and density deviation are small, and the pressure and temperature applications are wide. The improved Benedict–Webb–Rubin state equation is as follows [24].
where (ρc is the critical density). an (n = 1,2…15) is temperature-related characteristic parameters.
The Kriging surrogate model is used to construct the physical property library within the calculation range (5 MPa–20 MPa). Since the physical properties of carbon dioxide change very sharply near the critical point, the difference point near the critical point is locally encrypted.
A total pressure of 15 MPa and a total temperature of 773.15 K are set for the first stage nozzle inlet as the boundary conditions, and a static pressure of 9.5 MPa is set for the third stage rotor outlet. The rotational speed of the rotor fluid zone at each stage was set at 10,000 rpm. The interface between the nozzle and the impeller is set as the coupling interface, and the mixed model Full Non Matching Mixing Plane is used to couple the flow of the stator and rotor. The nozzle wall surface of the whole model is set absolutely static, the impeller wall surface of the whole model is set relatively static. The upper and lower walls of all areas are insulated walls, meeting the no-slip flow conditions.
The double-precision numerical method is used to solve the three-dimensional Reynolds average N-S equation. The CFL value (Courant–Friedrich–Levy number) of the calculation model is set to two, and the convergence criterion number is 10−6. In addition, acceleration techniques such as implicit residual smoothing, multi-grid and full multi-grid are used in the calculation process, which greatly improves the convergence speed of the calculation [25].
2.5. Meshing and Independence Verification
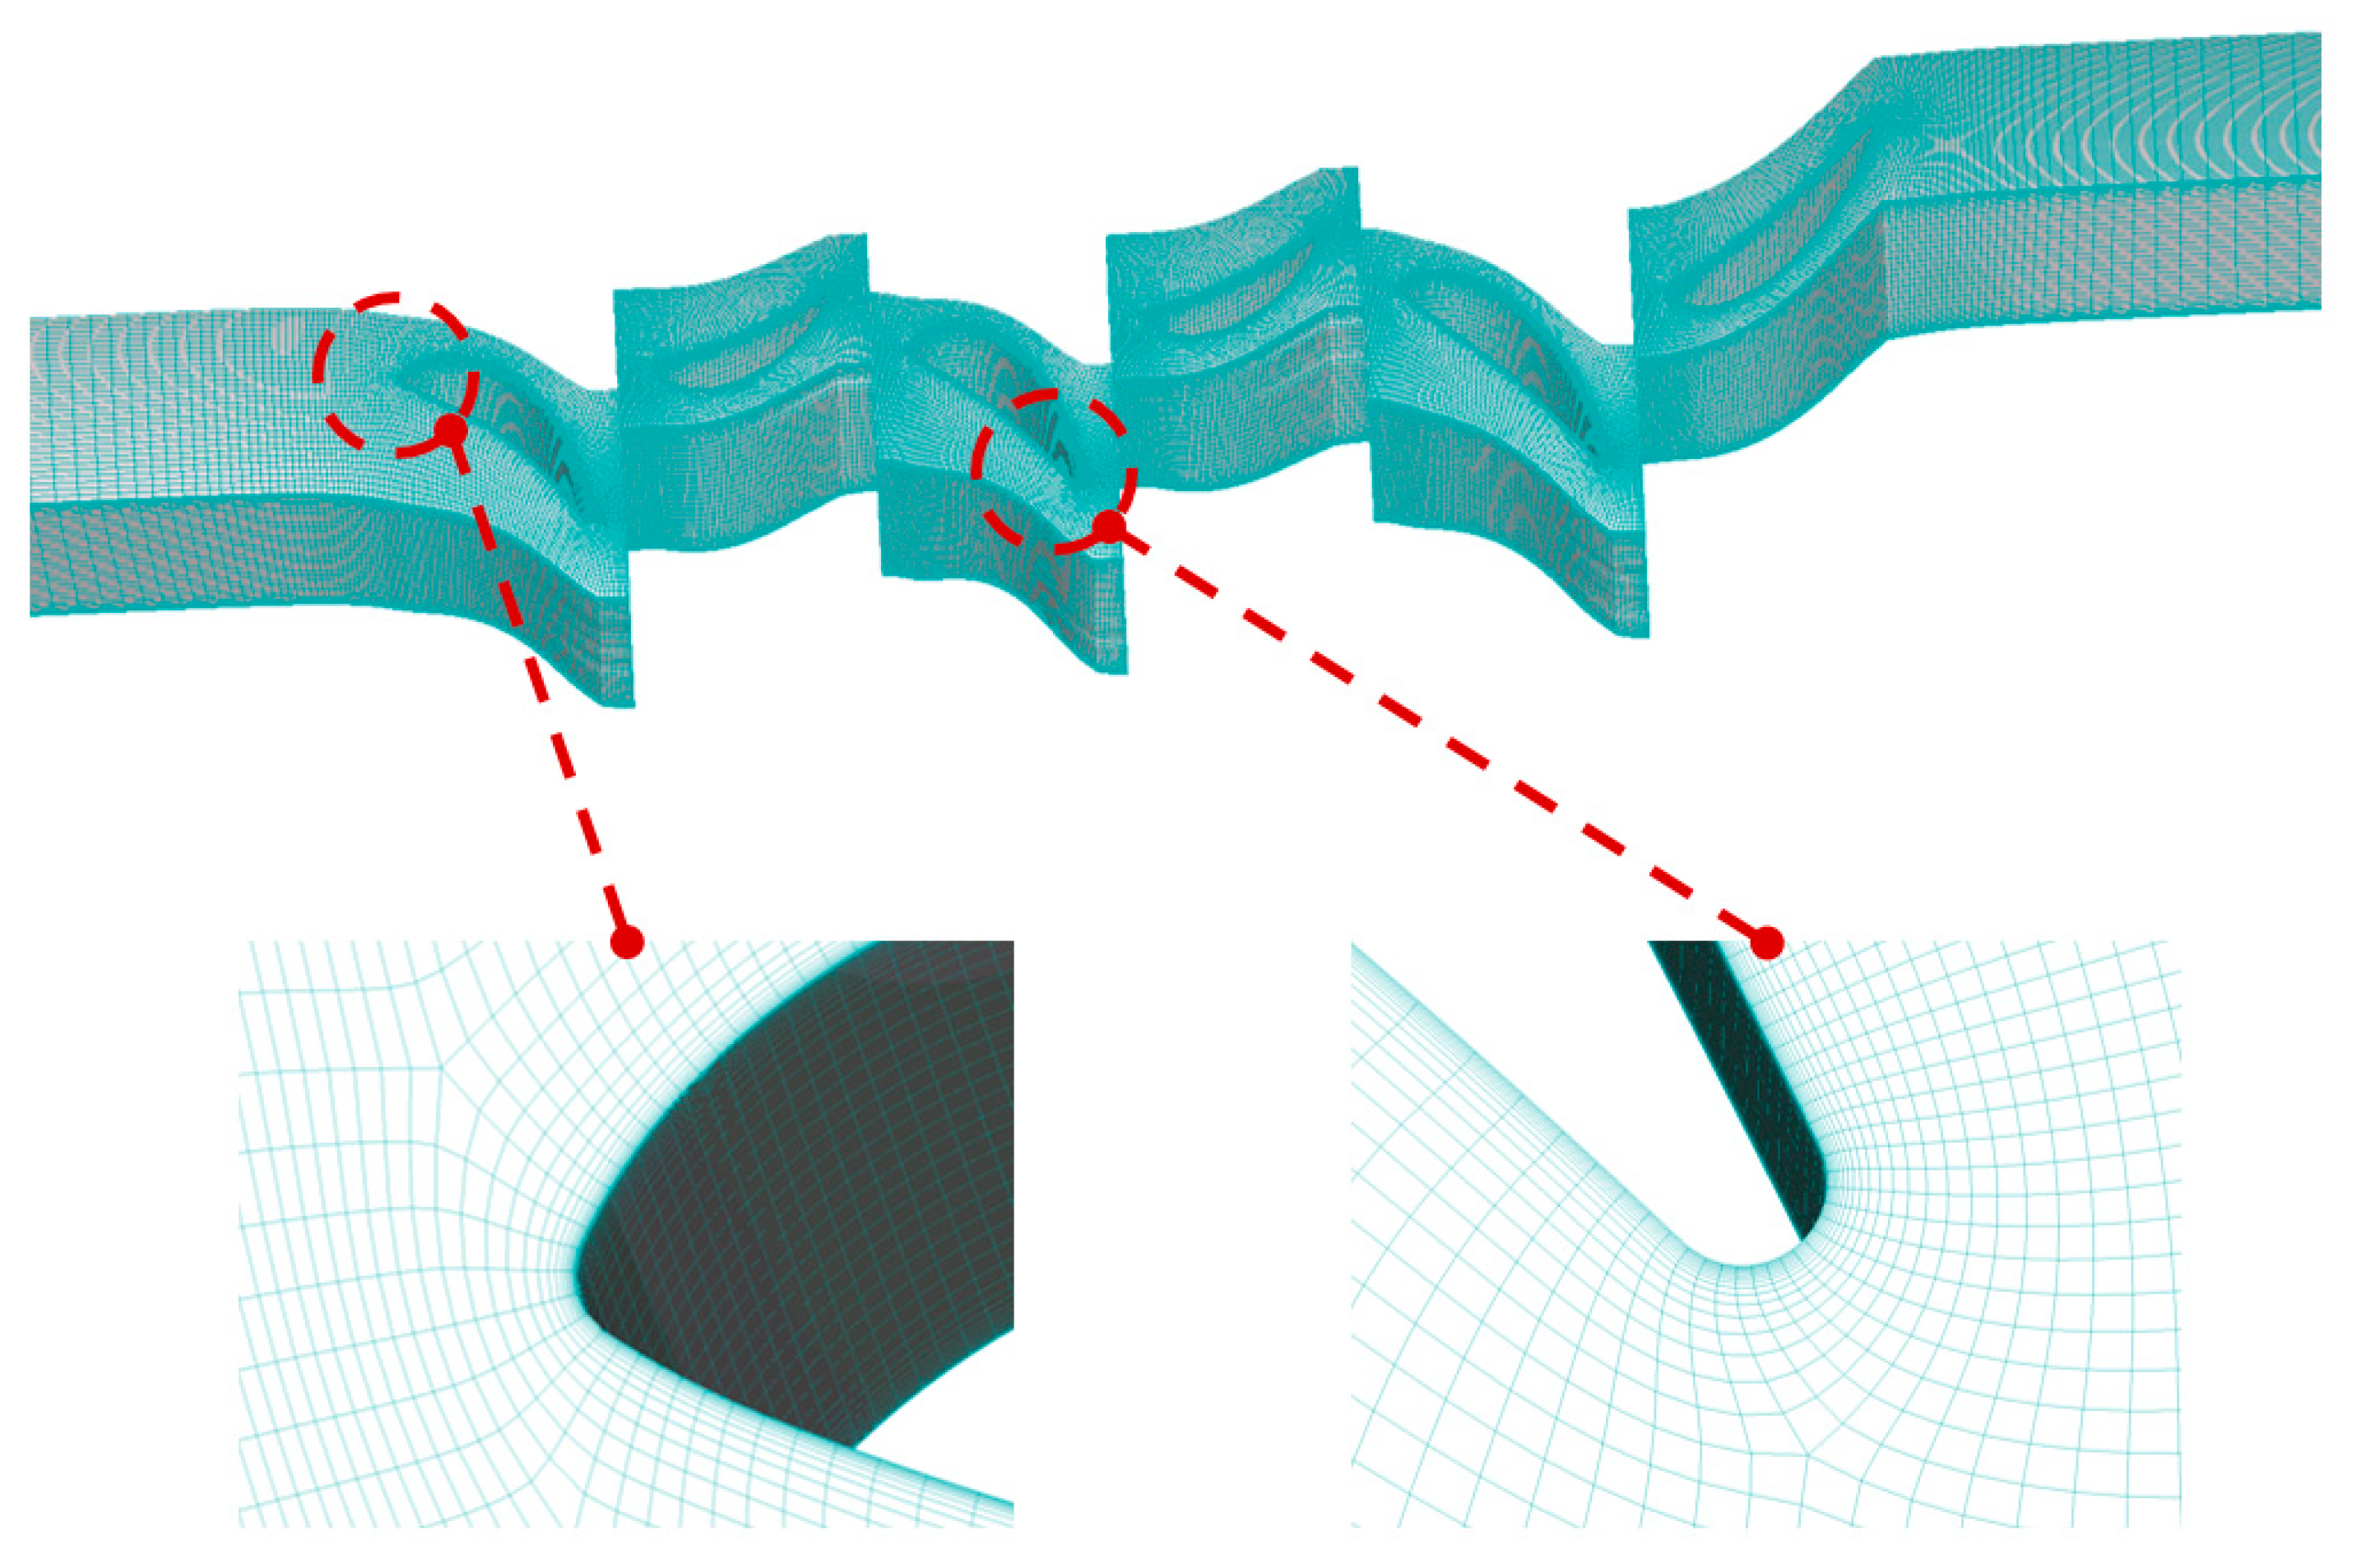
In order to guarantee the mesh quality of the blade body, the first stage nozzle inlet extension and the third stage impeller outlet extension are meshed by H-type grid, the stator and rotor of each stage are meshed by O-type grid. Grid encryption is made near each boundary layer to ensure the accuracy of the calculation. Meanwhile, taking into consideration the calculation accuracy and efficiency, a grid-independence test for a three-stage axial single-channel model is completed. Taking the total efficiency of the whole machine as the verification standard, the calculation models of different grid densities of 500,000, 1.5 million, 2.2 million and 2.8 million grids are numerically calculated. The verification results are shown in Table 4. The total efficiency difference calculated by the number of 2.8 million and 2.2 million grids is less than 1%, so the number of grids is finally selected as about 2.2 million. Figure 4 shows the diagram of grid generation for a single passage of the three-stage axial turbine.
The total-total efficiency in Table 4 is the performance evaluation standard for the S-CO2 axial turbine. The specific calculation method is as follows.
where h represents the enthalpy of the working fluid, subscript T represents the total parameter, subscript in represents the inlet of the first stage nozzle, and subscript out represents the outlet of the third stage impeller.
3. Results and Discussion
3.1. Aerodynamic Performance
Figure 5 shows the distribution of the streamline on the 50% blade height section and a partial enlargement of the leading and trailing edges of the cascades of each stage. The S-CO2 working fluid with high temperature and high pressure first enters the tapered nozzle flow path of first stage for expansion and acceleration, and then changes its own flow direction along the flow path. Since the first-stage nozzle suction surface has a large curvature, the fluid on the suction side has a higher flow velocity. After being mixed with the fluid on the pressure surface side near the trailing edge of the first-stage nozzle, the mixed fluid enters the first-stage rotor inlet. When the fluid flows through the leading edge of the first stage rotor, the sharp curvature change causes a local acceleration phenomenon on the suction side. There is a small range of stagnation areas at the leading edges of nozzles and rotors of the second and third stage, where the fluid has a lower flow velocity. It is easy to see from the streamline distribution that the outlet velocity of each cascade is significantly larger than the inlet velocity. Because the working fluid expands in the cascade, the enthalpy decreases, and part of it is converted into fluid kinetic energy. In general, there is no serious flow separation in the entire cascade flow channel, and the flow field is relatively uniform.
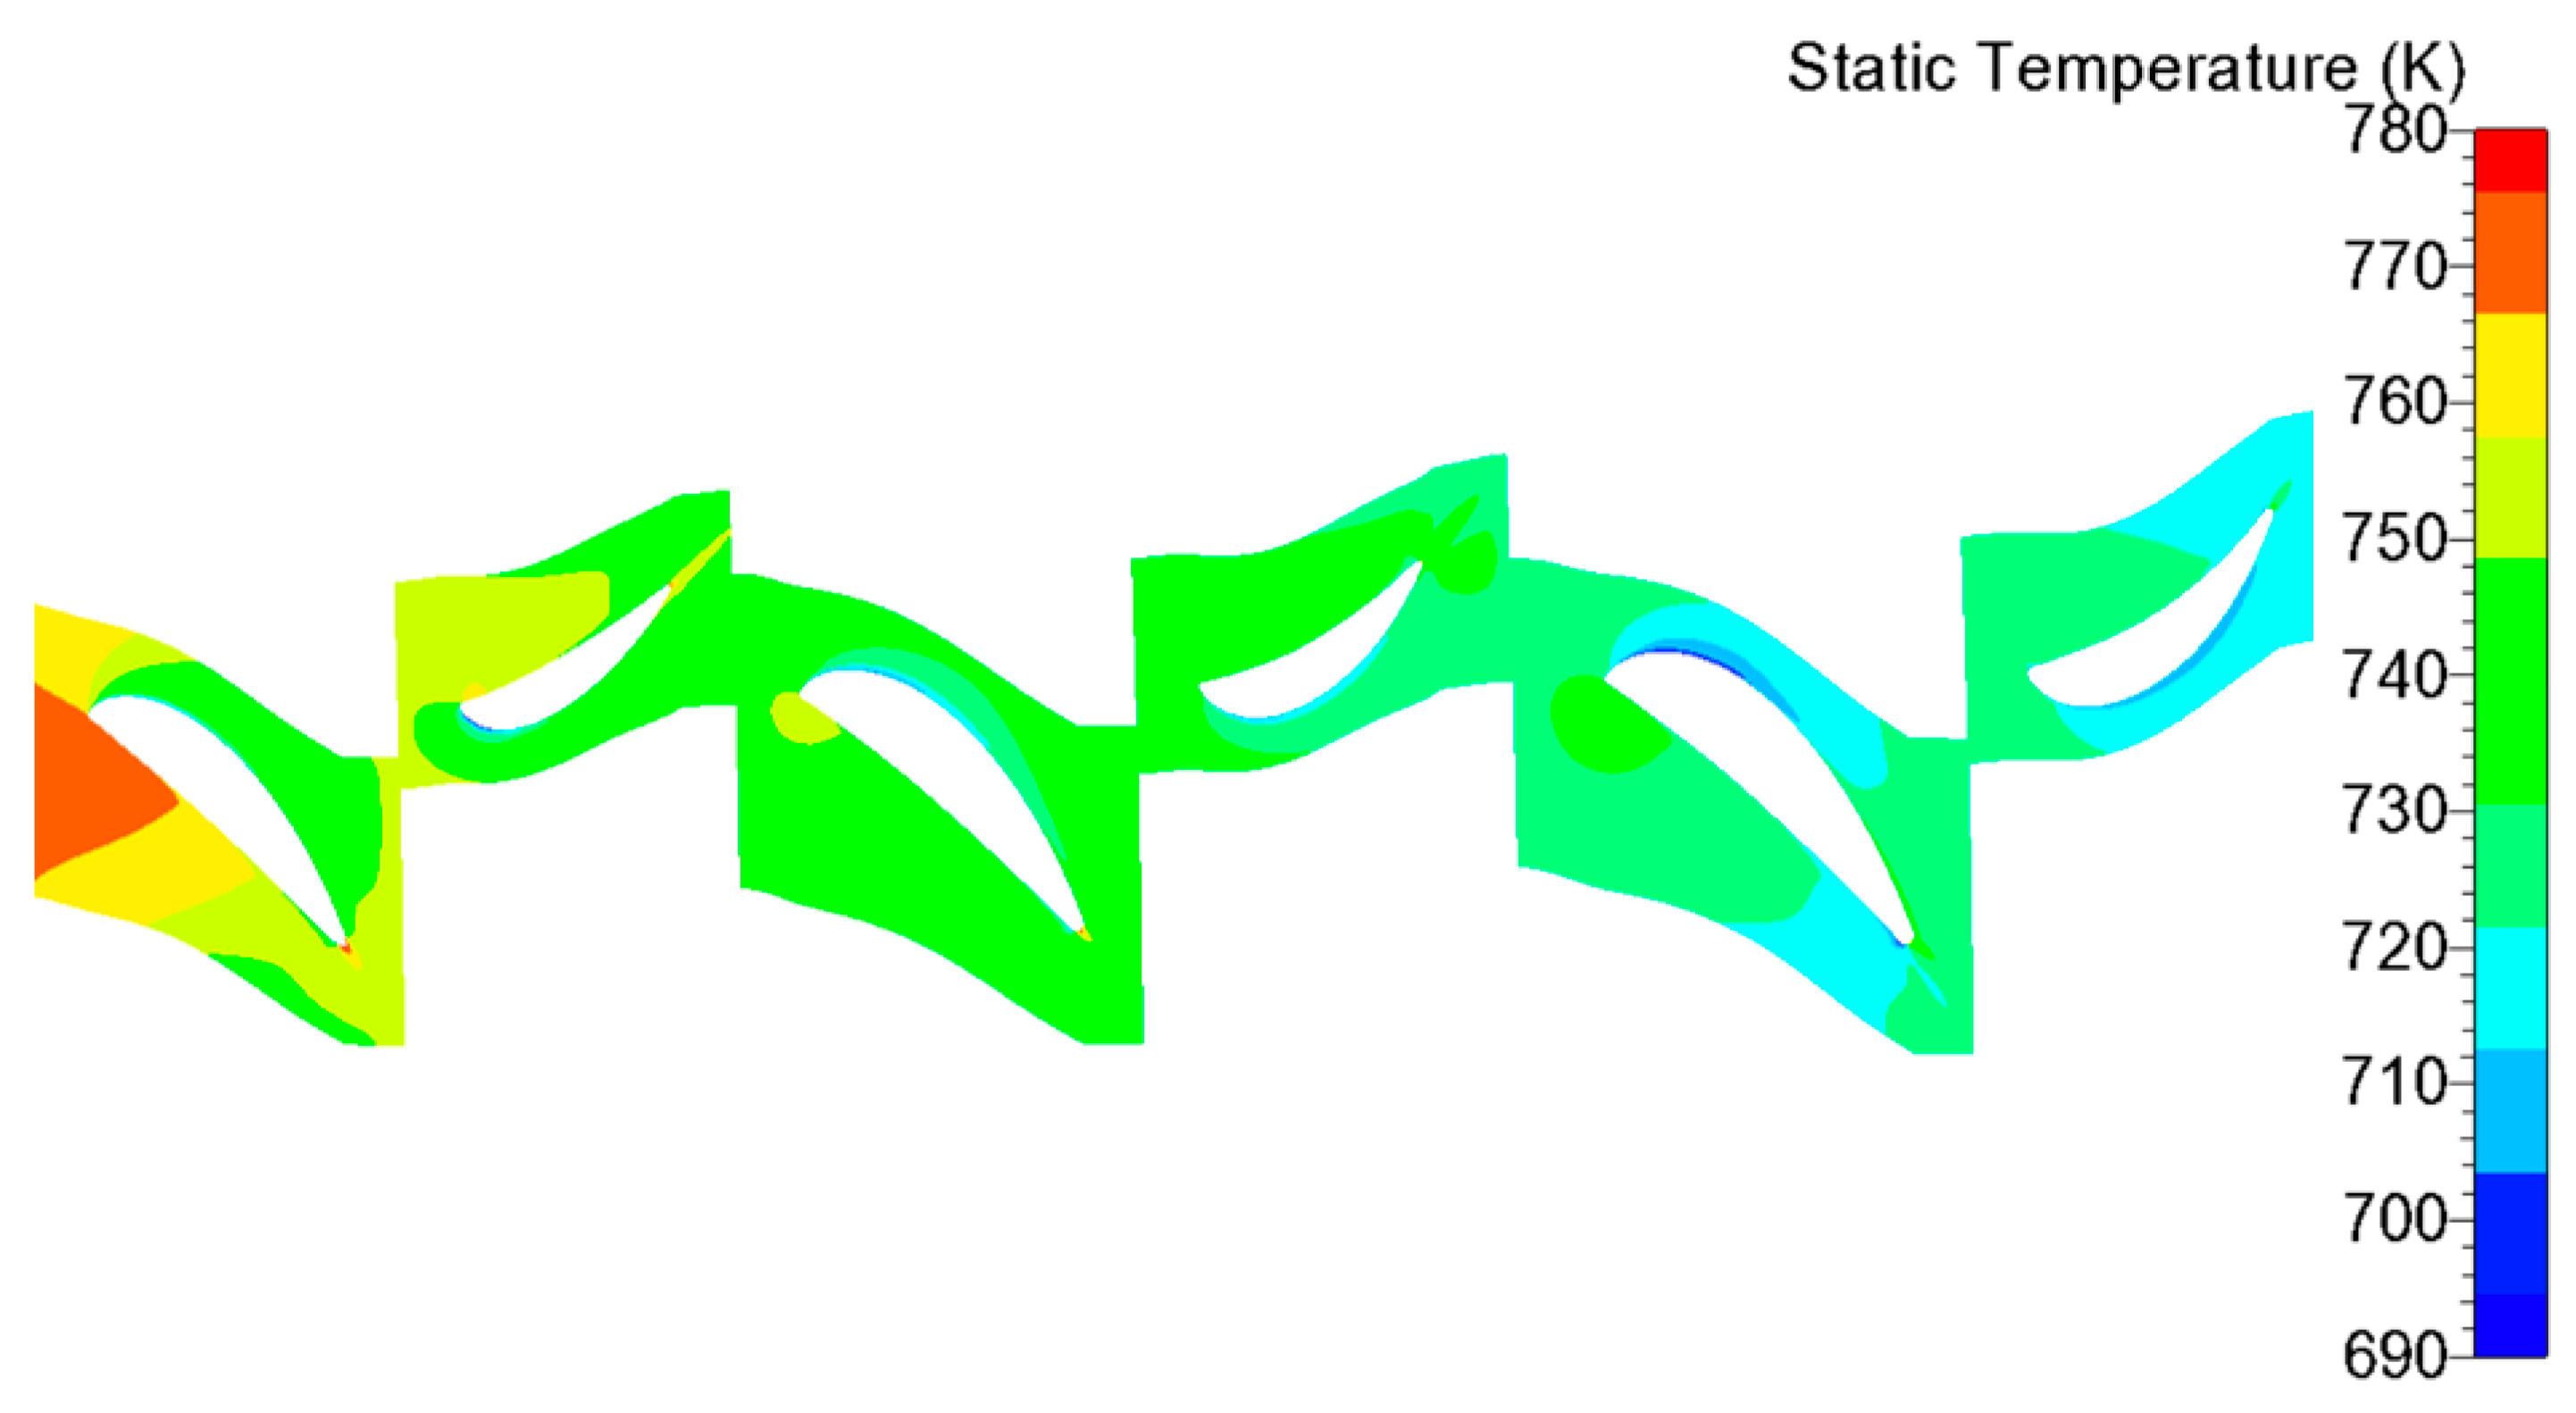
The temperature and pressure distribution nephograms at the 50% blade height section are shown in Figure 6 and Figure 7, respectively. It can be seen from the overall distribution that from the inlet of the first stage nozzle to the outlet of the third stage rotor, the temperature and pressure show a downward trend. The temperature and pressure distributions at the outlet of each cascade are uniform. In the rotor cascade of each stage, the pressure on the pressure surface is higher than that on the suction surface, thus generating effective differential pressure power, driving the impeller to rotate and output work externally. In the first stage nozzle, since the fluid on the suction side has a higher velocity, the temperature and pressure here are lowered, and after the fluid is mixed with that on the pressure side at the outlet, they rise again. The temperature and pressure on the pressure side have a uniform gradient, which gradually decreases from the inlet to the outlet. In the first stage rotor, the temperature and pressure of the fluid on the pressure side are more uniform, and the fluid on the suction side has a significant temperature and pressure drop only near the leading edge, and then remains substantially unchanged. As the fluid flows toward the rear cascade, the blending of various vortices gradually reduces the uniformity of the gas flow, resulting in local low temperature and low pressure regions on the suction side of the third stage nozzle and rotor.
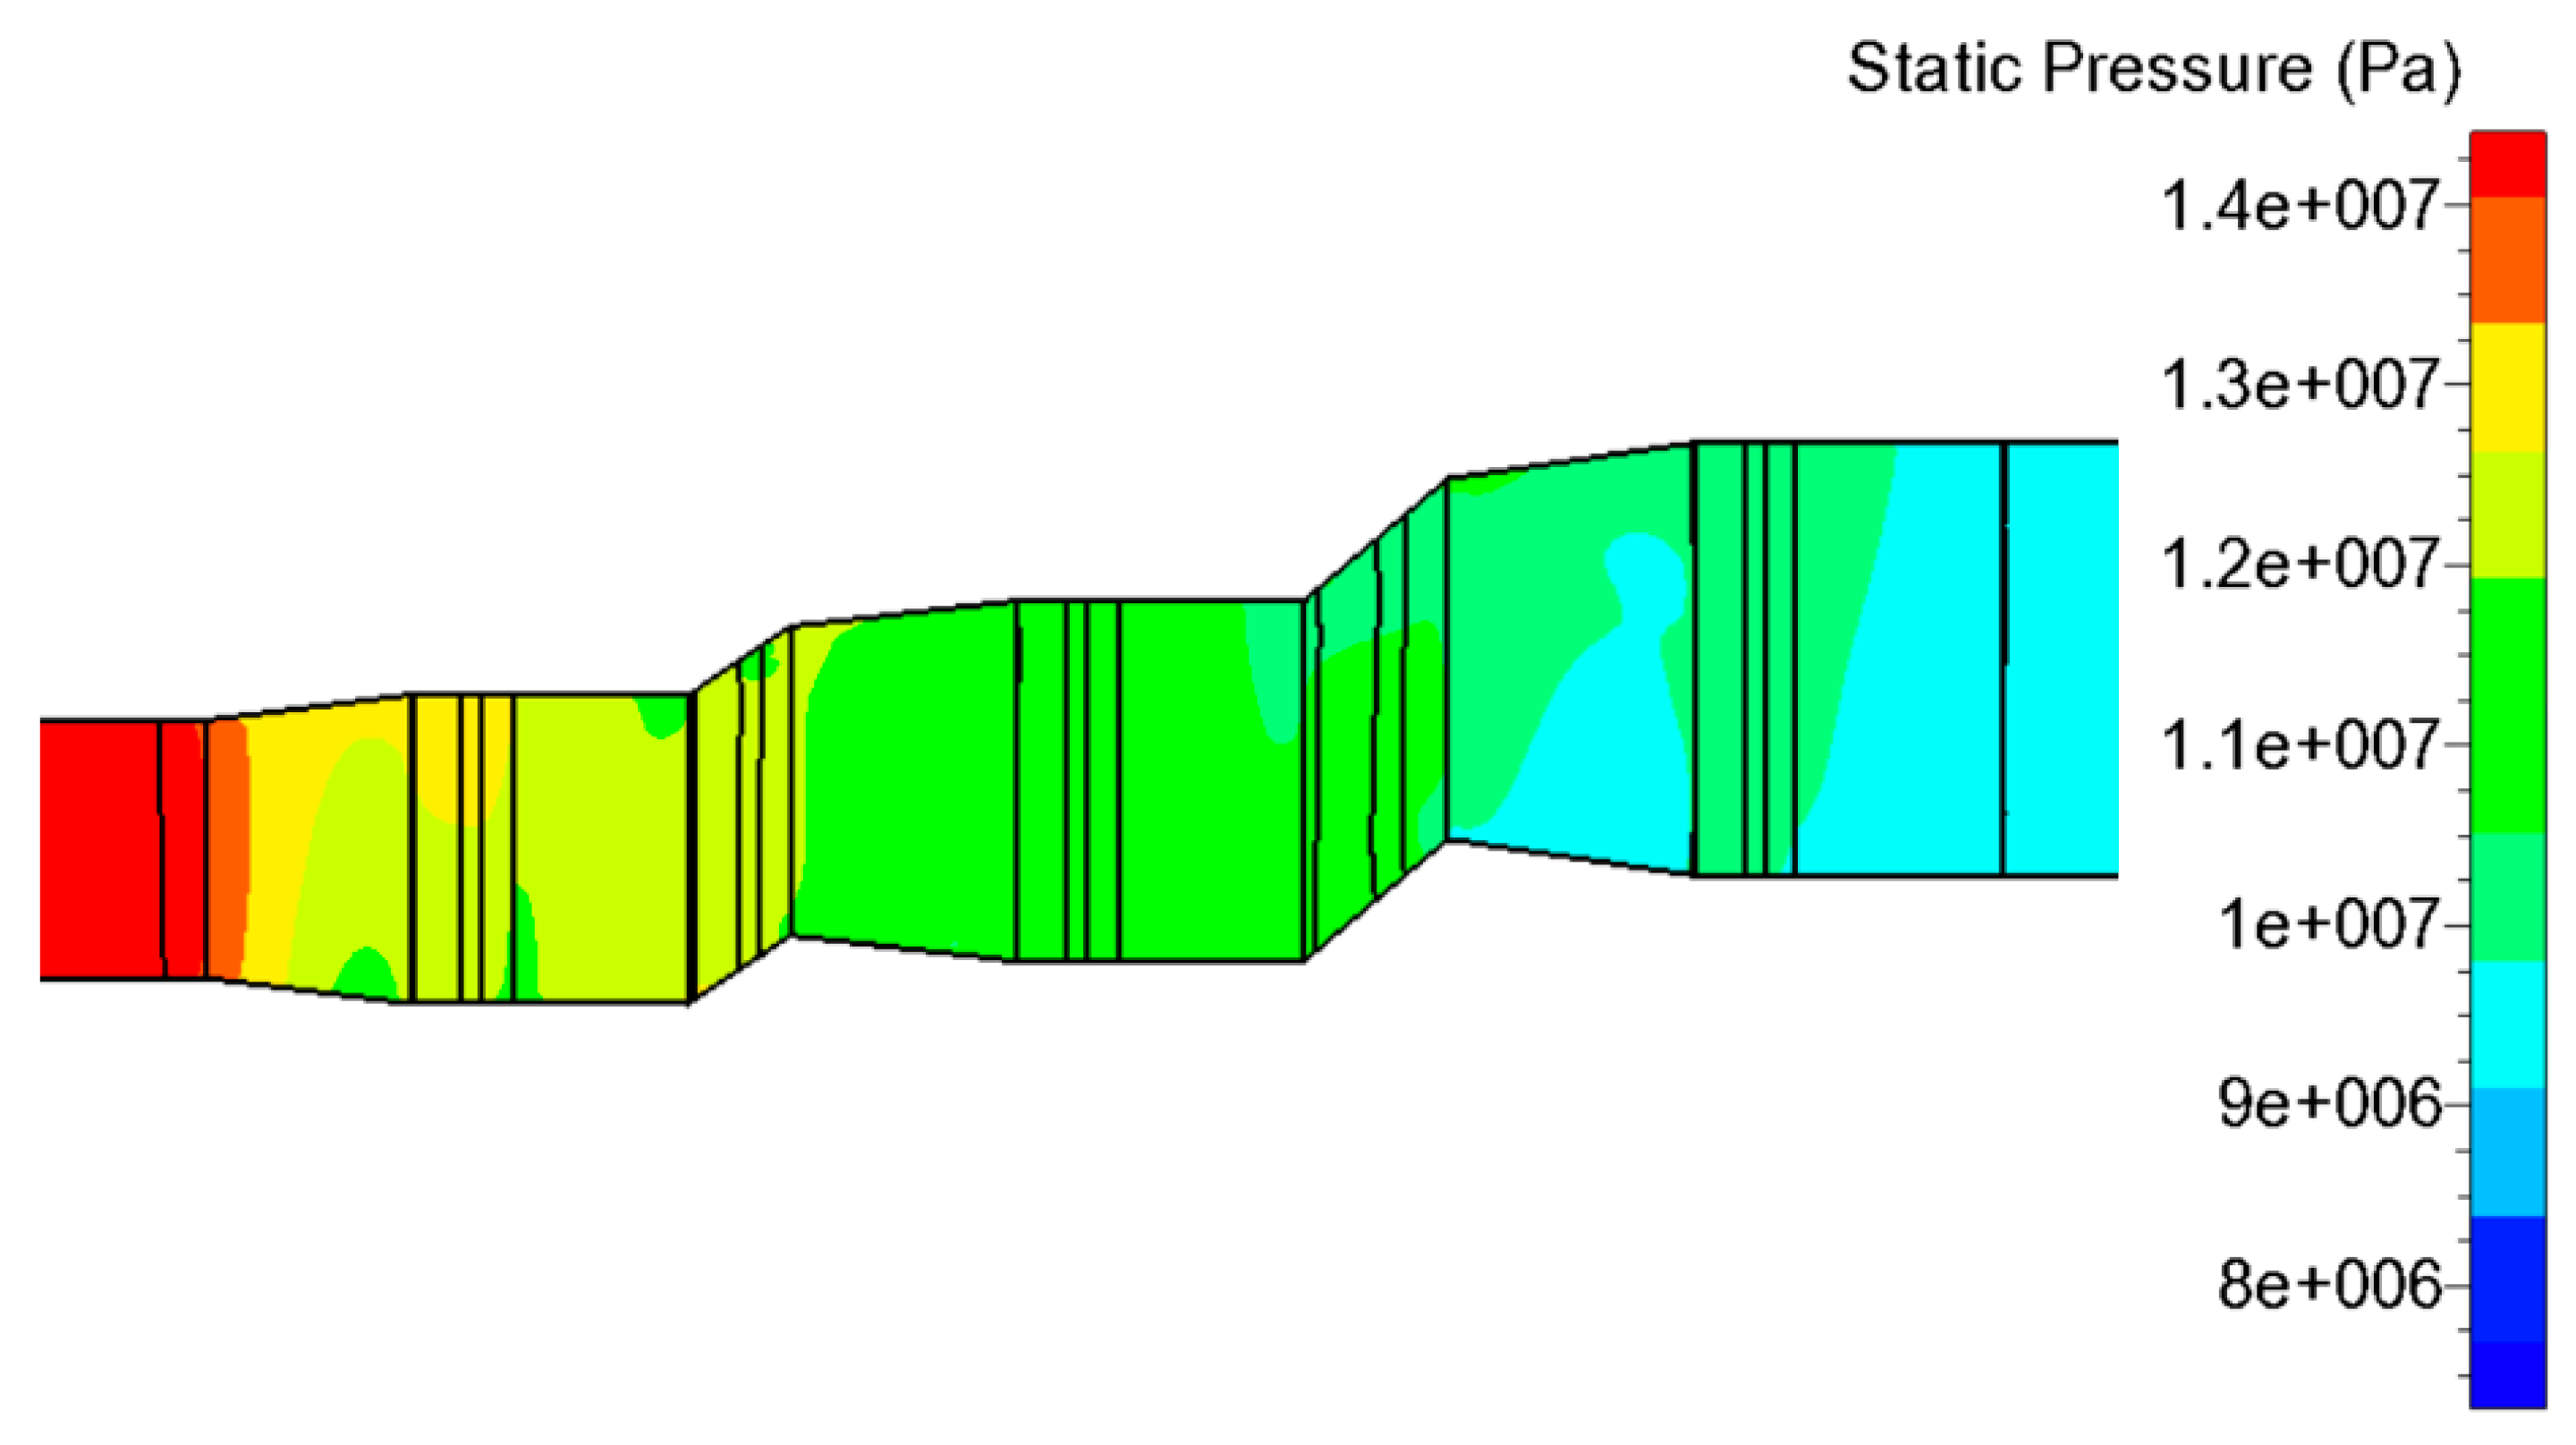
The static pressure distribution of the S-CO2 turbine three-stage cascade meridian plane is shown in Figure 8. In general, the working fluid expands along the flow direction, and the pressure gradually decreases, reaching a set back pressure of 9.5 MPa at the outlet of the third stage rotor. Meanwhile, the pressure distribution of the cascades along the blade height direction is relatively uniform. Only a low-pressure region is generated near the blade root of the third stage stator, which is caused by the mixing of the shedding vortex on the suction side of the blade with the flow separation of the rim boundary layer. In addition, since the diameter of the third-stage impeller is the largest, the flow field in the flow passage is greatly affected by the centrifugal force, thus the fluid is concentrated to the tip position, generating a pressure gradient along the blade height direction. Therefore, in the first half of the third stage rotor flow path, the pressure near the tip of the blade is slightly higher than the vicinity of the blade root.
In order to quantify the pressure change trend in the cascade channel, the pressure distribution curve of the S-CO2 turbine three-stage cascade meridian plane at the 50% blade height is shown in Figure 9. It can be clearly seen from the figure that the pressure of the working fluid gradually decreases from 14.3 MPa at the turbine inlet to 9.5 MPa, which is the design outlet pressure. It is worth noting that there is a small increase in pressure near the nozzle outlets of each stage. This is due to the gradient between the high velocity fluid on the suction surface and the low velocity fluid on the pressure surface of the nozzle, and these two kinds of fluid are vigorously blended at the trailing edge. The trailing edge will be affected by its front boundary layer, producing a wake vortex.
For the S-CO2 turbine, the shedding vortex generated by local acceleration will produce obvious low-temperature and low-pressure regions, making the transcritical phenomenon in the channel difficult to avoid. Minimizing the transcritical region is the key to improving turbine aerodynamic efficiency. Multi-stage axial turbines have more cascade stages than single-stage centrifugal turbines. As the working fluid flows to the rear cascade, the complex flow field structure makes the flow uniformity more difficult to control, so in addition to the leading edge and trailing edge of the cascade, the flow separation phenomenon is more likely to occur in the channel, and even the transcritical phenomenon appears. In order to clearly show the transcritical region of the designed S-CO2 multi-stage axial turbine, the pressure upper limit of the cloud icon ruler of the surface pressure distribution of the third-stage cascade blade is adjusted to the critical pressure of carbon dioxide of 7.38 MPa, as shown in Figure 10.
Since the carbon dioxide in the whole flow is always at a high temperature, which is much higher than the critical temperature, therefore, it is only necessary to judge whether the carbon dioxide is transcritical by judging whether the pressure is lower than the critical pressure. It can be seen from the figure that the transcritical region is mainly distributed at three locations, the area close to the blade root at the leading edge of the first stage rotor (A), the area near the blade root of the leading edge on the suction side of the third stage stator (B), and the outlet side of the trailing edge of the third stage stator (C). The minimum pressure is about 3.5 MPa, which is located at the bottom of the blade root of the A region, and the range is extremely small and negligible. The pressure in the remaining transcritical areas is higher than 6 MPa. The mixing of the complex vortex system affected by the front cascade and the change of the blade shape curvature of the suction side trigger the flow acceleration. As a result, a large-area transcritical phenomenon occurs on the third-stage stator suction side, as shown in the B region in Figure 10.
3.2. Overall Performance
Table 5 shows the key performance parameters for the thermal and aerodynamic analysis of the S-CO2 three-stage axial turbine. It can be found from the table that the flow rate obtained by turbine aerodynamic analysis is 184 kg/s and the output power is 10.37 MW. Compared with the thermal design, the flow rate only differs by about 1 kg/s, and the output power differs by only 0.37 MW. The results are in good agreement. It is worth noting that the total-total efficiency of the turbine obtained by aerodynamic analysis is 91.60%, which is 6.6% higher than the estimated efficiency of 85%. This shows that the S-CO2 three-stage axial turbine designed in this paper has good aerodynamic performance to meet design requirements.
3.3. Off-Design Performance
By changing the static pressure of the third stage impeller outlet, the turbine designed was analyzed. Nine kinds of non-design conditions are analyzed for outlet static pressure of 7.5 MPa, 8 MPa, 9 MPa, 10 MPa, 11 MPa, 12 MPa, 13 MPa, 13.5 MPa and 14 MPa. The variation curve of turbine output power with outlet static pressure is shown in Figure 11. It can be found that the curve shows a monotonous decreasing trend because when the outlet pressure of the turbine increases, the inlet and outlet expansion ratios of the turbine decrease, and the flow capacity decreases, resulting in a decrease in the mass flow rate of the throughflow portion. Meanwhile, the increase of turbine outlet pressure makes the enthalpy of the outlet working fluid larger, and the enthalpy drops of the whole turbine at the inlet and outlet are decreased. The output power of the turbine is proportional to the mass flow and the inlet and outlet enthalpy drop. Therefore, the turbine’s working capacity will gradually decrease as the outlet pressure increases.
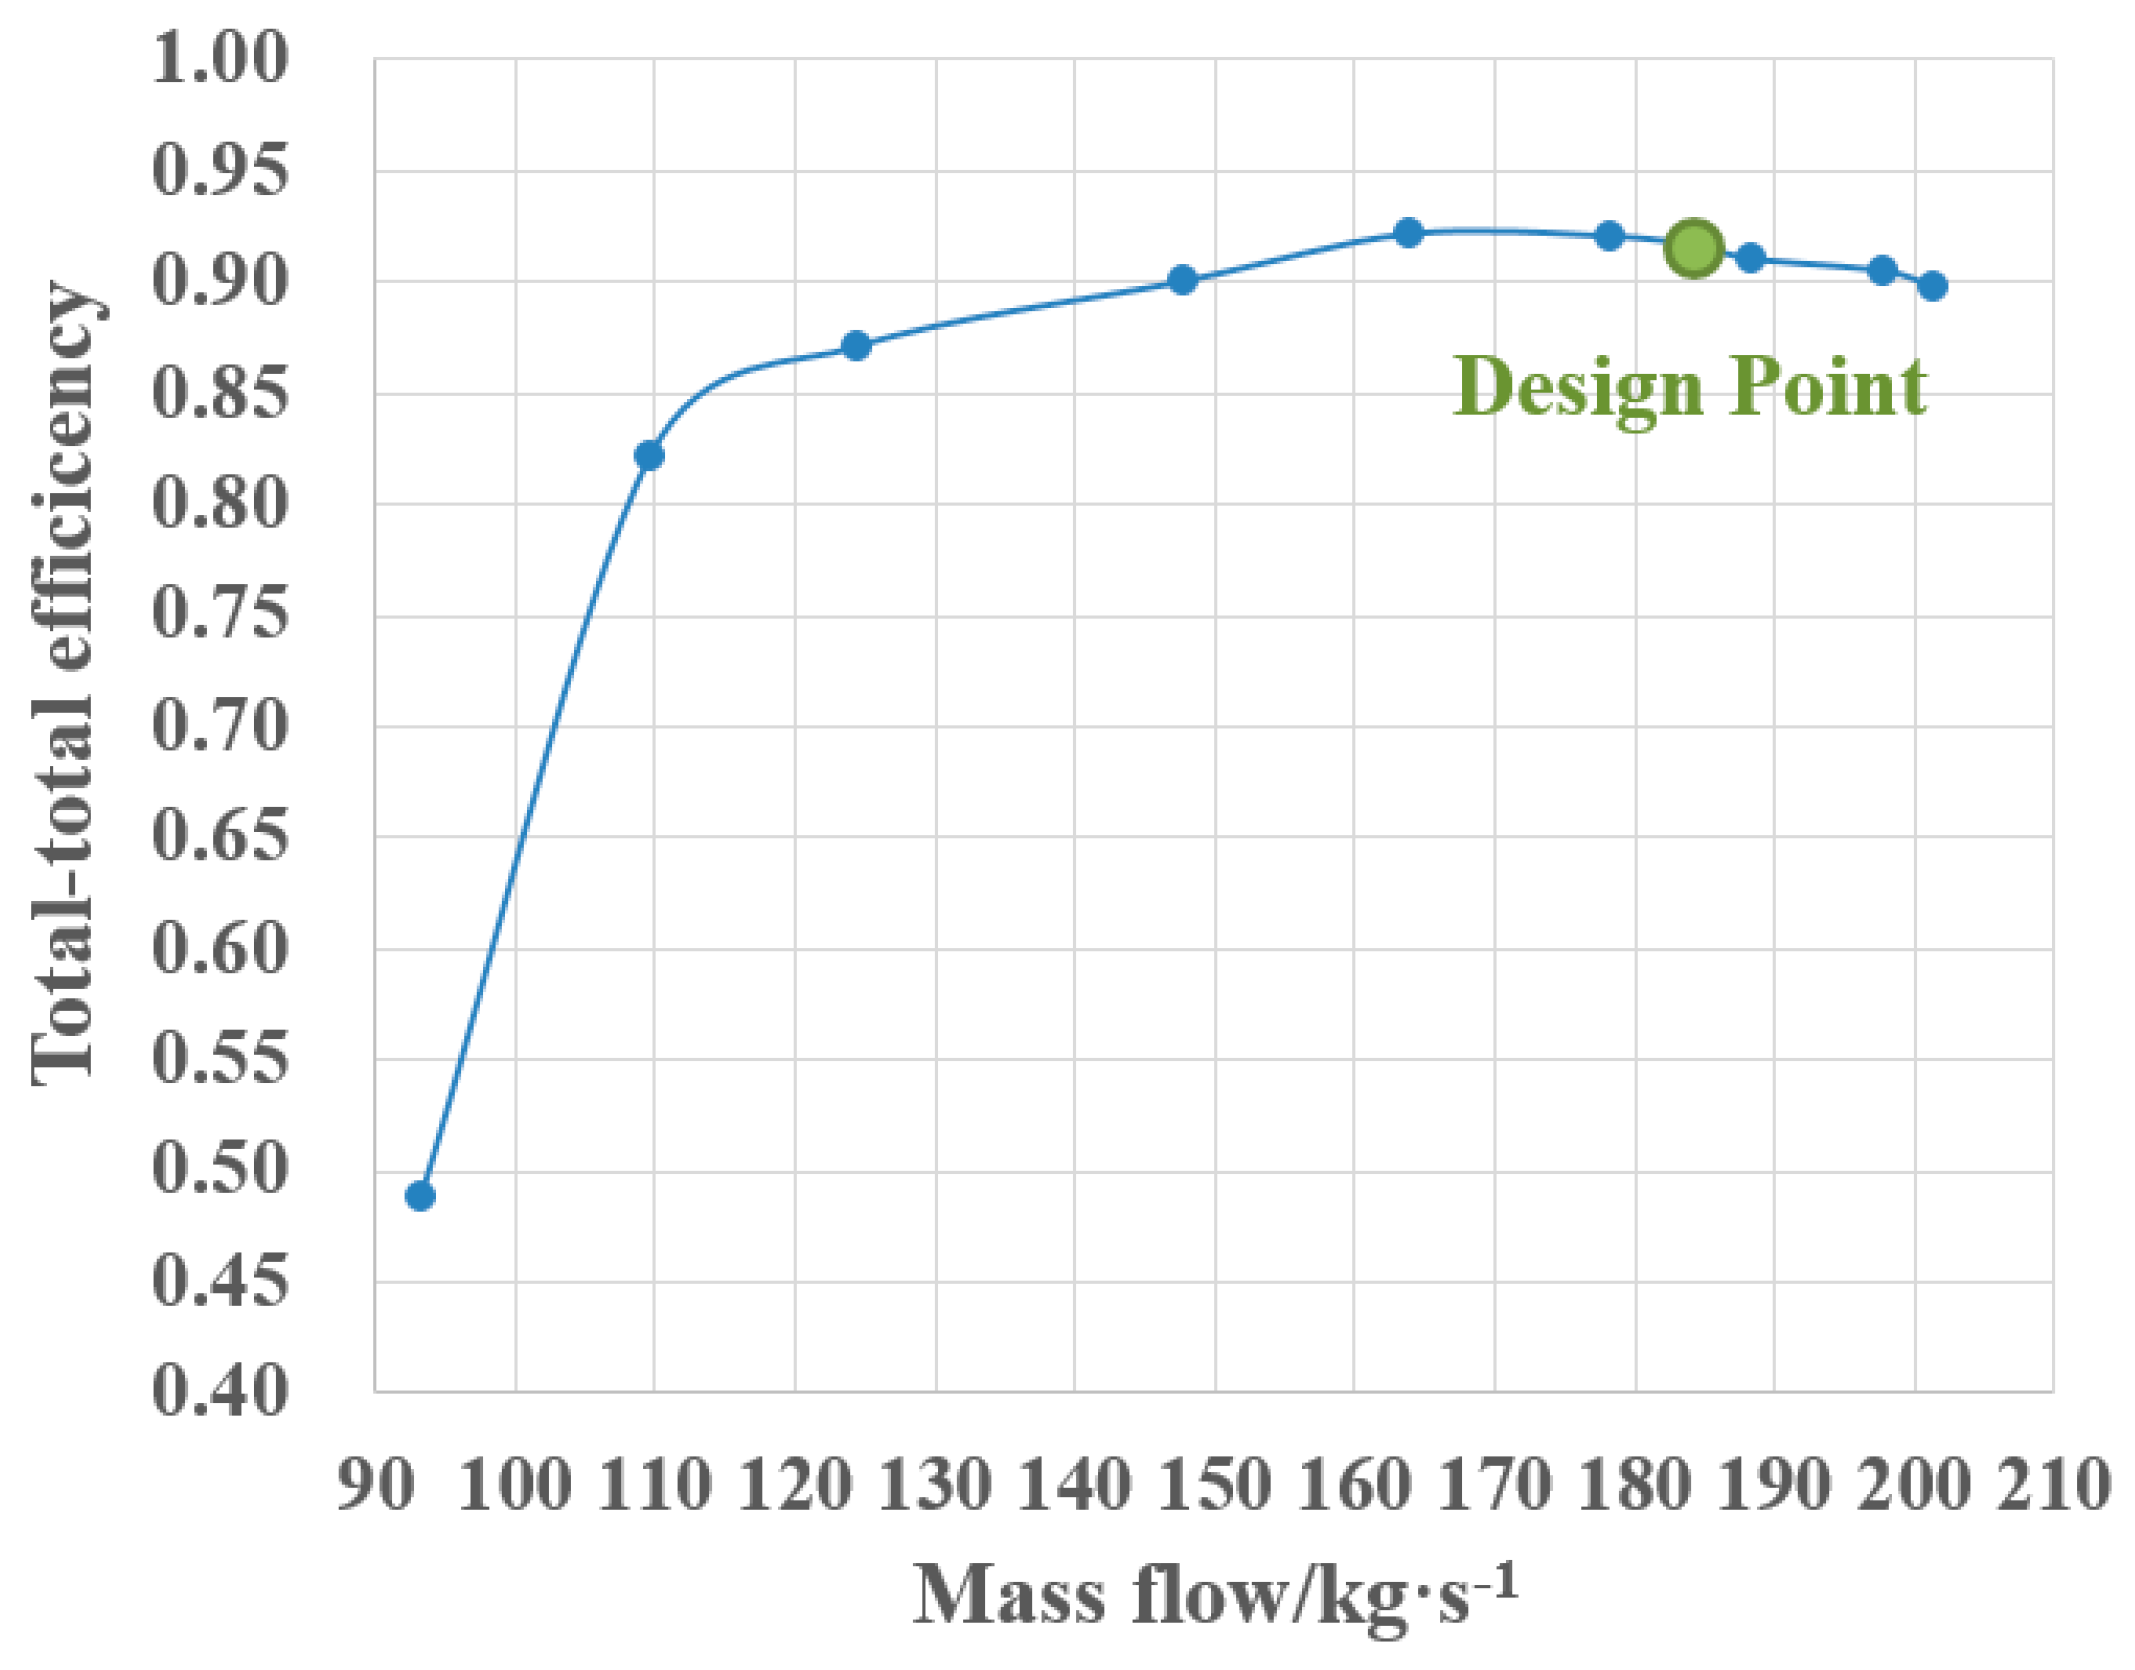
The variation curve of total-total efficiency with mass flow rate is shown in Figure 12. It can be found from the diagram that when mass flow rate is less than 184.3 kg/s under design conditions, the total-total efficiency increases slightly with the decrease of mass flow rate. When the mass flow rate is about 164 kg/s, the turbine has the highest total-total efficiency of 92.12%, which is about 0.5% higher than that under design conditions. With the continuous decrease of the mass flow rate, the turbine efficiency decreases gradually in the range of 115 kg/s to 164 kg/s, and the change curve is relatively smooth. When the mass flow rate is less than 115 kg/s, the expansion ratio is too small and the outlet pressure becomes larger, which leads to gas reflux at the outlet of the turbine. Turbine efficiency becomes very sensitive to the change of mass flow rate, thus small flow rate changes will lead to a significant reduction of turbine efficiency. In order to keep the carbon dioxide in supercritical state in the turbine, the minimum pressure at the outlet is set to 7.5 MPa in off-design condition analysis. At this time, the maximum flow capacity of the turbine is reached, which is 201.3 kg/s. When the flow rate ranges from 184.3 kg/s to 201.3 kg/s, the turbine efficiency decreases with the increase of mass flow rate. Generally speaking, the designed S-CO2 three-stage axial turbine can operate steadily and efficiently in the range of mass flow from 115 kg/s to 201.3 kg/s (i.e., its output power ranges from 16.2% to 155.9%). This means the designed turbine has excellent performance with wide range of off-design operation. Therefore it can be adapted to the variable condition characteristics of solar power generation system affected by geographical distribution, seasonal variation and day-night alternation to some extent.
4. Conclusions
In this paper, the thermodynamic design of a 10 MW S-CO2 three-stage axial turbine applied in solar power generation system is completed by using self-developed thermodynamic design software. The aerodynamic performance and off-design performance are analyzed in detail by using three-dimensional aerodynamic design and optimization method. The specific conclusions are as follows.
- Thermodynamic and structural parameters of key positions of nozzles and rotor blades in initial design of turbines are obtained through thermal design. The designed output power is 10 MW and the flow rate is 185 kg/s.
- Based on the three-dimensional aerodynamic numerical analysis and optimization method, the optimal design and aerodynamic performance of turbines are obtained. The designed turbine has uniform flow field, reasonable pressure, temperature distribution, and a small transcritical region. The output power is 10.37 MW, and the flow rate is 184 kg/s. The turbine has good aerodynamic performance.
- Nine off-design working conditions are analyzed. The output power decreases with the increase of outlet static pressure, and the total-total efficiency increases first and then decreases with the increase of mass flow rate. When the mass flow rate is 164 kg/s, the total-total efficiency is the highest, which is 92.12%. The designed S-CO2 three-stage axial-flow turbine can operate steadily and efficiently in the range of mass flow rate from 115 kg/s to 1.3 kg/s, that is to say its output power ranges from 16.2% to 155.9%. It has excellent performance with a wide range of off-design operation and meets the design requirements.
Author Contributions
Conceptualization, D.S., Y.X. and D.Z.; investigation, D.S. and L.Z.; methodology, D.S. and D.Z.; resources, Y.X. and D.Z.; software, D.S., and Y.X.; supervision, Y.X. and D.Z.; validation L.Z. and D.Z.; writing—original draft preparation, D.S. and L.Z.; writing—review and editing, D.S., and L.Z.
Funding
This research was funded by the Foundation of the Key Laboratory of Thermal Power Technology, grant number TPL2016BA001.
Conflicts of Interest
The authors declare no conflict of interest.
References
- Gil, L.; Otin, S.F.; Embid, J.M.; Gallardo, M.A.; Blanco, S.; Artal, M.; Velasco, I. Experimental setup to measure critical properties of pure and binary mixtures and their densities at different pressures and temperatures Determination of the precision and uncertainty in the results. J. Supercrit. Fluid 2008, 44, 123–138. [Google Scholar] [CrossRef]
- Feng, Z.P.; Zhao, H.; Zhang, H.Z.; Deng, Q.H. Research progress on supercritical carbon dioxide power cycle system and its power unit. Therm. Turb. 2016, 45, 85–94. [Google Scholar]
- Crespi, F.; Gavagnin, G.; Sanchez, D.; Martinez, G.S. Supercritical carbon dioxide cycles for power generation: A review. Appl. Energy 2017, 195, 152–183. [Google Scholar] [CrossRef]
- Gao, F.; Sun, R.; Liu, S.G. Introduction of supercritical sCO2 power generation technology. J. Nav. Univ. Eng. 2015, 12, 92–96. [Google Scholar]
- Kimball, K.J.; Clementoni, E.M. Supercritical carbon dioxide Brayton power cycle development overview. In Proceedings of the Asme Turbo Expo 2012: Turbine Technical Conference & Exposition, Copenhagen, Denmark, 11–15 June 2012; pp. 931–940. [Google Scholar]
- Feher, E.G. The supercritical thermodynamic power cycle. Energy Convers. 1968, 8, 85–90. [Google Scholar] [CrossRef]
- Dostal, M.; Hejzlar, P.; Driscoll, M.J. The supercritical carbon dioxide power cycle: Comparison to other advanced power cycles. Nucl. Technol. 2006, 154, 283–301. [Google Scholar] [CrossRef]
- Garg, P.; Kumar, P.; Srinivasan, K. Supercritical carbon dioxide Brayton cycle for concentrated solar power. J. Supercrit. Fluid 2013, 76, 54–60. [Google Scholar] [CrossRef]
- Osorio, J.D.; Hovsapian, R.; Ordonez, J.C. Dynamic analysis of concentrated solar supercritical CO2-based power generation closed-loop cycle. Appl. Therm. Eng. 2016, 93, 920–934. [Google Scholar] [CrossRef]
- Luu, M.T.; Milani, D.; McNaughton, R.; Abbas, A. Analysis for flexible operation of supercritical CO2 Brayton cycle integrated with solar thermal systems. Energy 2017, 124, 752–771. [Google Scholar] [CrossRef]
- Sulaiman, F.A.A.; Atif, M. Performance comparison of different supercritical carbon dioxide Brayton cycles integrated with a solar power tower. Energy 2015, 82, 61–71. [Google Scholar] [CrossRef]
- Zhang, X.R.; Yamaguchi, H.; Uneno, D.; Fujima, K.; Enomoto, M.; Sawada, N. Analysis of a novel solar energy-powered Rankine cycle for combined power and heat generation using supercritical carbon dioxide. Renew. Energy 2006, 31, 1839–1854. [Google Scholar] [CrossRef]
- Fuller, R.; Preuss, J.; Noall, J. Turbomachinery for supercritical CO2 power cycles. In Proceedings of the ASME Turbo Expo 2012: Turbine Technical Conference and Exposition. American Society of Mechanical Engineers, Copenhagen, Denmark, 11–15 June 2012; pp. 961–966. [Google Scholar]
- Schmitt, J.; Willis, R.; Amos, D.; Kapat, J.; Custer, C. Study of a Supercritical CO2 Turbine with TIT of 1350 K for Brayton Cycle with 100 MW Class Output: Aerodynamic Analysis of Stage 1 Vane. In Proceedings of the ASME Turbo Expo: Turbine Technical Conference and Exposition. American Society of Mechanical Engineers, Dusseldorf, Germany, 16–20 June 2014; p. V03BT36A019. [Google Scholar]
- Kalra, C.; Hofer, D.; Sevincer, E.; Moore, J.; Brun, K. Development of high efficiency hot gas turbo-expander for optimized CSP supercritical CO2 power block operation. In Proceedings of the 4th International Symposium-Supercritical CO2 Power Cycles, Pittsburgh, PA, USA, 9–10 September 2014. [Google Scholar]
- Zhang, H.; Zhao, H.; Deng, Q.; Feng, Z. Aerothermodynamic Design and Numerical Investigation of Supercritical Carbon Dioxide Turbine. In Proceedings of the ASME Turbo Expo 2015: Turbine Technical Conference and Exposition, Montreal, QC, Canada, 15–19 June 2015; p. V009T36A007. [Google Scholar]
- Zhang, D.; Wang, Y.; Xie, Y. Investigation into off-design performance of a s-CO2 turbine based on concentrated Solar Power. Energy 2018, 11, 3014. [Google Scholar] [CrossRef]
- Lee, J.; Lee, J.I.; Ahn, Y.; Yoon, H. Design Methodology of Supercritical CO2 Brayton Cycle Turbomachineries. In Proceedings of the ASME Turbo Expo 2012: Turbine Technical Conference and Exposition, Copenhagen, Denmark, 11–15 June 2012; pp. 975–983. [Google Scholar]
- Hasuike, H.; Yamamoto, T.; Fukushima, T.; Watanabe, T.; Utamura, M.; Aritomi, M. Test plan and preliminary test results of a bench scale closed cycle gas turbine with super-critical CO2 as working fluid. In Proceedings of the Asme Turbo Expo: Power for Land, Sea, & Air, Glasgow, UK, 14–18 June 2010; pp. 485–492. [Google Scholar]
- Sinkwitz, M.; Winhart, B.; Engelmann, D.; di Mare, F.; Mailach, R. Experimental and Numerical Investigation of Secondary Flow Structures in an Annular Low Pressure Turbine Cascade Under Periodic Wake Impact—Part 2: Numerical Results. J. Turbomach. 2019, 141. [Google Scholar] [CrossRef]
- Mojaddam, M.; Hajilouy-Benisi, A.; Moussavi-Torshizi, S.A.; Movahhedy, M.R.; Durali, M. Experimental and numerical investigations of radial flow compressor component losses. J. Mech. Sci. Technol. 2014, 28, 2189–2196. [Google Scholar] [CrossRef]
- Menter, F.R. Two-equation eddy-viscosity turbulence models for engineering applications. AIAA J. 1994, 32, 1598–1605. [Google Scholar] [CrossRef] [Green Version]
- Menter, F.R.; Kuntz, M.; Langtry, R. Ten years of industrial experience with the SST turbulence model. Turbul. Heat Mass Transf. 2003, 4, 625–632. [Google Scholar]
- Ely, J.F.; Magee, J.W.; Haynes, W.M. Thermophysical Properties for Special High CO2 Content Mixtures; Research Report RR-110; Gas Processors Association: Tulsa, OK, USA, 1987. [Google Scholar]
- Yao, Z.; Chen, K.M. Review on the commercial CFD softwares. J. Univ. Shanghai Sci. Technol. 2002, 24, 137–144. [Google Scholar]
Figure 1.
Research flow chart.

Figure 2.
Profiles of blades: (a) 1st stator; (b) 1st rotor; (c) 2nd stator; (d) 2nd rotor; (e) 3rd stator; (f) 3rd rotor.
Figure 2.
Profiles of blades: (a) 1st stator; (b) 1st rotor; (c) 2nd stator; (d) 2nd rotor; (e) 3rd stator; (f) 3rd rotor.

Figure 3.
Geometric model of fluid domain.

Figure 4.
Grid schematic.

Figure 5.
The distribution of the streamline on the 50% blade height section.

Figure 6.
Temperature distribution at the 50% blade height section.

Figure 7.
Pressure distribution at the 50% blade height section.

Figure 8.
Static pressure distribution on the meridian plane.

Figure 9.
Pressure distribution curve of each cascade meridian plane at the 50% blade height.

Figure 10.
Sketch of transcritical region on blade surface.

Figure 11.
The variation curve of turbine output power with outlet static pressure.

Figure 12.
The variation curve of total-total efficiency with mass flow rate.


Table 1.
Initial design parameters.
| Parameter | Value |
|---|---|
| Power/MW | 10 |
| Rotation speed/rpm | 10,000 |
| Total inlet pressure/MPa | 15 |
| Total inlet temperature/K | 773.15 |
| Static outlet pressure/MPa | 9.5 |
Table 2.
Pre-fetched parameters.
| NO. | Parameter | 1st Stator | 1st Rotor | 2nd Stator | 2nd Rotor | 3rd Stator | 3rd Rotor |
|---|---|---|---|---|---|---|---|
| 1 | Speed coefficient | 0.96 | 0.96 | 0.96 | 0.96 | 0.96 | 0.96 |
| 2 | Reaction coefficient | - | 0.1 | - | 0.15 | - | 0.18 |
| 3 | Flow coefficient | 0.95 | 0.95 | 0.95 | 0.95 | 0.95 | 0.95 |
| 4 | Installation angle/° | 40 | 55 | 40 | 50 | 45 | 50 |
| 5 | Relative pitch | 0.75 | 0.74 | 0.76 | 0.74 | 0.762 | 0.70 |
Table 3.
Key structural parameters.
| NO. | Parameter | 1st Stator | 1st Rotor | 2nd Stator | 2nd Rotor | 3rd Stator | 3rd Rotor |
|---|---|---|---|---|---|---|---|
| 1 | Number of blades | 28 | 40 | 27 | 41 | 30 | 43 |
| 2 | Axial width/mm | 20 | 17 | 22 | 18 | 24 | 20 |
| 3 | Blade height/mm | 25.88 | 41.05 | 23.62 | 35.15 | 23.19 | 32.26 |
| 4 | Pitch/mm | 23.84 | 15.36 | 26.57 | 17.39 | 25.86 | 18.28 |
| 5 | Average diameter of stage/mm | 212.10 | 225.35 | 249.02 | |||
| 6 | Inlet geometric angle/° | 80 | 50 | 35 | 60 | 60 | 30 |
| 7 | Outlet geometric angle/° | 30 | 30 | 30 | 35 | 20 | 30 |
Table 4.
Independence verification.
| NO. | Number of Grids/×104 | Total-Total Efficiency/% | Relative Error/% |
|---|---|---|---|
| 1 | 50 | 92.12 | - |
| 2 | 100 | 91.89 | 0.25 |
| 3 | 150 | 91.74 | 0.16 |
| 4 | 220 | 91.60 | 0.15 |
| 5 | 280 | 91.55 | 0.05 |
Table 5.
Performance parameters.
| Parameters | Thermal Design | Aerodynamic Analysis |
|---|---|---|
| Flow rate/kg∙s−1 | 185 | 184 |
| Efficiency/% | 85 (estimated efficiency) | 91.60 (total-total efficiency) |
| Output power/MW | 10 | 10.37 |
© 2019 by the authors. Licensee MDPI, Basel, Switzerland. This article is an open access article distributed under the terms and conditions of the Creative Commons Attribution (CC BY) license (http://creativecommons.org/licenses/by/4.0/).
Share and Cite
MDPI and ACS Style
Shi, D.; Zhang, L.; Xie, Y.; Zhang, D. Aerodynamic Design and Off-design Performance Analysis of a Multi-Stage S-CO2 Axial Turbine Based on Solar Power Generation System. Appl. Sci. 2019, 9, 714. https://doi.org/10.3390/app9040714
AMA Style
Shi D, Zhang L, Xie Y, Zhang D. Aerodynamic Design and Off-design Performance Analysis of a Multi-Stage S-CO2 Axial Turbine Based on Solar Power Generation System. Applied Sciences. 2019; 9(4):714. https://doi.org/10.3390/app9040714
Chicago/Turabian StyleShi, Dongbo, Lei Zhang, Yonghui Xie, and Di Zhang. 2019. "Aerodynamic Design and Off-design Performance Analysis of a Multi-Stage S-CO2 Axial Turbine Based on Solar Power Generation System" Applied Sciences 9, no. 4: 714. https://doi.org/10.3390/app9040714
Note that from the first issue of 2016, this journal uses article numbers instead of page numbers. See further details here.