Study on the Wellbore Flow for Carbon Dioxide Fracturing

1
College of Petroleum Engineering, Yangtze University, Wuhan 430100, China
2
Oil and Gas Technology Research Institute Changqing Company, CNPC, Xi’an 710018, China
3
State Engineering Laboratory of Low Permeability Oil & Gas Reservoir Exploration and Development, Xi’an 710018, China
4
School of Petroleum Engineering, China University of Petroleum (East China), Qingdao 266580, China
*
Author to whom correspondence should be addressed.
Appl. Sci. 2019, 9(9), 1864; https://doi.org/10.3390/app9091864
Submission received: 1 April 2019
/
Revised: 25 April 2019
/
Accepted: 29 April 2019
/
Published: 7 May 2019
(This article belongs to the Special Issue Green Energy and Applications)
Abstract
:CO2 fracturing has unparalleled advantages in the reservoir reform which can significantly improve oil and gas recovery in unconventional oil and gas resources. The wellbore flow behavior is one of the fundamental issues of CO2 fracturing. A model of flow and heat transfer in the wellbore is developed in this paper, and wellbore temperature and pressure are coupled using an iterative method. The model is validated by measured data from the field. Wellbore pressure, temperature, CO2 properties, and phase state along depth are observed and a sensitivity study is conducted to analyze the controlling factors for CO2 fracturing. Results show that displacement is the key factor affecting CO2 flow behavior in the wellbore and injection temperature has greater influence on CO2 flow behavior than injection pressure and geothermal gradient; however, excess injection temperature brings enormous cost in wellbore pressure. CO2 phase state is related to working parameters and it tends to stay in liquid state under higher displacement, which is matched with field tests. This study can help optimize the working parameters of CO2 fracturing.
1. Introduction
Carbon dioxide (CO2) is an environmentally friendly waterless working fluid for fracturing [1]. CO2 fracturing has been studied since the 1960s under the background of growing oil and gas demand. So far, CO2 fracturing has been applied in many countries such as America, Canada, Germany, and China [2,3,4], showing unexceptionable advantages especially in unconventional oil and gas resources. Firstly, the mechanical properties of reservoir rock are changed after CO2 immersion [5], which can reduce the breakdown pressure and facilitate secondary cracking. Secondly, the waterless CO2 inhibits the swelling of clay mineral and eliminates water sensitivity [6], improving the permeability of the reservoir to some extent, which gives this technology enormous prospects. Thirdly, the low additive content in CO2 fracturing fluid leads to the high flowback rate. Last but not least, CO2 can increase the mobility of oil and replace the adsorbed CH4 [6,7,8], enhancing oil and gas recovery (EOR). Furthermore, the mitigation of greenhouse gases such as CO2 has become an increasing global demand in recent years [9], and CO2 fracturing has the potential of improving the development of carbon capture [10,11,12,13], utilization, and storage (CCUS), which has both environmental and economic benefits.
Compared with traditional hydraulic fracturing, the pressure at the wellhead of CO2 fracturing increases slowly and fluctuates, as shown in Figure 1, which is related to the compressibility of CO2. The temperature–pressure condition and the properties of CO2 are coupled in the wellbore due to the compressibility of CO2. Therefore, the wellbore flow and heat transfer behaviors are essential conditions to optimize the operating parameters during CO2 fracturing.
Many studies have been conducted on fluid flow and heat transfer in the wellbore since the 1950s. Ramey [14] proposed a semisteady model which only considered the unsteady heat transfer in the stratum outside the wellbore and first used the overall heat transfer coefficient to solve the equation. A number of later semisteady wellbore flow models were mostly improvements to Ramey’s model. Raymond [15] developed a nonsteady model for temperature distribution during drilling fluid circulation, which was the basis of later nonsteady wellbore flow models. Eickmeier [16] presented a finite difference model for the early transient temperature performance in the wellbore during injection and production, appropriate for short-term operations such as fracturing. Hasan and Kabir [17,18,19] presented a solution to continuity, momentum, and energy conservation equations, and developed wellbore heat transfer models for various situations. Wang et al. [20] quantified the heat generated by the flow friction of high-yield production wells. As for CO2 flow in the wellbore, the sensitivity of CO2 properties to temperature and pressure results in the complexity of flowing temperature and pressure calculation. Plenty of research is devoted to the coupling of temperature and pressure during the CO2 injection or circulation process in the wellbore. Cranshaw [21] developed a numerical model of CO2 nonisothermal flow for production or injection wellbores, which matched single- or two-phase flow of CO2. Gupta [22] first proposed drilling with supercritical CO2 and established a simplified model of CO2 circulation in the wellbore. Al-Adwani [23] quoted the high-precision Span–Wagner state equation for thermodynamic properties of CO2 and improved the heat transfer model for supercritical CO2 wellbore circulation. Many researchers [24,25,26,27] adopted the compressible fluid control equations to describe CO2 flow in the wellbore in recent years, realizing the coupling of CO2 properties with flow conditions such as temperature and pressure under different working environments to a large extent. Furthermore, a flow friction coefficient model considering CO2 compressibility was developed which improves the accuracy of the pressure.
In this study, a wellbore flow model coupling CO2 properties and temperature–pressure condition for CO2 fracturing is developed. The model is solved by an iterative method. The temperature, pressure, and CO2 properties profiles are analyzed based on the calculation results and the calculation is verified by data from CO2 fracturing field test. Finally, the sensitivity analysis on the wellbore flow field is conducted.
2. Mathematic Model of Wellbore Flow
During CO2 fracturing, hypothermic liquid CO2 is pumped into the wellbore from the wellhead and gets heated [26,27] due to thermal absorption from the stratum. The compressibility of CO2 leads to the coupling of CO2 physical parameters with wellbore temperature–pressure conditions. Therefore, a theoretical model is proposed to describe the wellbore flow of the CO2 fracturing injection process.
The mathematical models are based on the following assumptions: ①the unsteady-state heat transfer exists only in the stratum outside the hole wall; ②the fluid flow and heat transfer in the wellbore are in steady state; ③the effects of longitudinal heat transfer and radiative heat transfer are ignored. The Hasan Equation shown in Appendix A is mostly used to deal with the unsteady-state heat transfer.
2.1. Temperature Field Model
The differential element of the wellbore is shown in Figure 2. The origin of coordinates is at the wellhead and the forward direction is downward along the axis. The steady-state mass conservation equation and energy conservation equation [28] in the z direction are as follows:
where h is the specific enthalpy of the fluid, J/kg; v is the fluid velocity, m/s; t is circulation time, s; z is the depth, m; ρ is density of CO2, kg/m3; A is cross-sectional area, m2; q is the heat transfer per unit time, W; θ is the deviation angle, rad; g is acceleration of gravity, m/s2.
Substituting the continuity equation into the energy equation, Equation (2) can be simplified as:
where M is mass flow rate, kg/s.
According to the fundamental laws of thermodynamics, the expression of enthalpy change is
where cp is the specific heat capacity of fluid, J/(Kg·K); Jt is Joule–Thomson coefficient, K/MPa; p is the pressure of fluid, MPa.
The temperature increment in a finite element can be obtained by combining Equations (3) and (4):
The heat transfer between CO2 and the stratum outside the wellbore is
where Te is the formation temperature, K; Tf is fluid temperature in the wellbore, K; Ref is thermal resistance of formation to the wellbore fluid. The expression of Ref is shown in Appendix B.
2.2. Pressure Field Model
The pressure drop can be derived from the momentum conservation equation of compressible fluid. On the basis of assumptions, when the wellbore flow is in steady state, the pressure drop of fluid is given by:
where p is the pressure of fluid, MPa; ρ is the density of fluid, kg/m3; v is flow velocity, m/s; di is the inner diameter of the pipe, m; f is the friction coefficient of fluid, dimensionless.
Thanks to the low viscosity of CO2 and the large fluid mass flow rate during CO2 fracturing, it is easy to reach turbulence in the wellbore. Regarding the calculation of the friction coefficient, the formula proposed by Z.Y. Wang [29] was chosen:
where is the absolute roughness, m; de is equivalent diameter, m; Re is Reynolds number, dimensionless.
3. Solution Procedure
Compared with traditional hydraulic fracturing fluid, the properties of CO2 are no longer constant for CO2 fracturing. To avoid the calculated errors accumulating with well depth, the physical property model with high accuracy is selected and a coupling computation method is adopted.
3.1. Physical Properties of CO2
The properties of CO2 are sensitive to the change of temperature and pressure. Tiny changes in temperature and pressure may cause significant fluctuations in CO2 properties, and the phase change of CO2 could also be reflected by fluctuations in CO2 properties, so it is important to calculate properties of CO2 accurately.
The Span–Wagner equation [30] has high accuracy in calculating thermodynamic properties of CO2, especially in supercritical areas. Therefore, the Span–Wagner equation is chosen to calculate thermodynamic properties of CO2 including density, specific heat capacity, Joule–Thomson coefficient, and specific enthalpy in this paper. For transfer properties of CO2, the Vesovic model [31] is used to calculate the heat conductivity of CO2, and the Fenghour model [32] is used to calculate the viscosity of CO2.
3.2. Coupling Computation Methodology
During the injection process of CO2 fracturing, the temperature and pressure in the wellbore and CO2 properties are coupled with each other. Both temperature and pressure vary with well depth along with CO2 flow. Therefore, the calculation of temperature, pressure, and CO2 properties must be coupled in the process of iteration.
The wellbore is divided into N units along the direction of well depth. To ensure the calculation unit is much shorter than the well depth, the CO2 properties of each and every calculation unit can be considered as constant. The injection temperature (T0) and pressure (p0) are regarded as initial conditions.
For the ith calculation unit, the iterative method is as follows:
(1) The temperature and pressure of (i-1)th calculation unit are used as the starting of the iteration, marked as Ti0, pi0, so the temperature (dT) and pressure (dp) increment can be estimated according to Equation (5) and Equation (7). Then, temperature and pressure of ith calculation unit, marked as Ti1, pi1, can be obtained.
(2) The new temperature and pressure increment, dT’ and dp’, also can be calculated with the known of Ti1, pi1.
(3) The calculated dT’ and dp’ are compared with the initial dT and dp. If the differences between the calculated values are within the error tolerance, the calculation ends and the calculation of the next unit begins; if not, replace Ti0and pi0 with new values and return to (1).
4. Results and Discussion
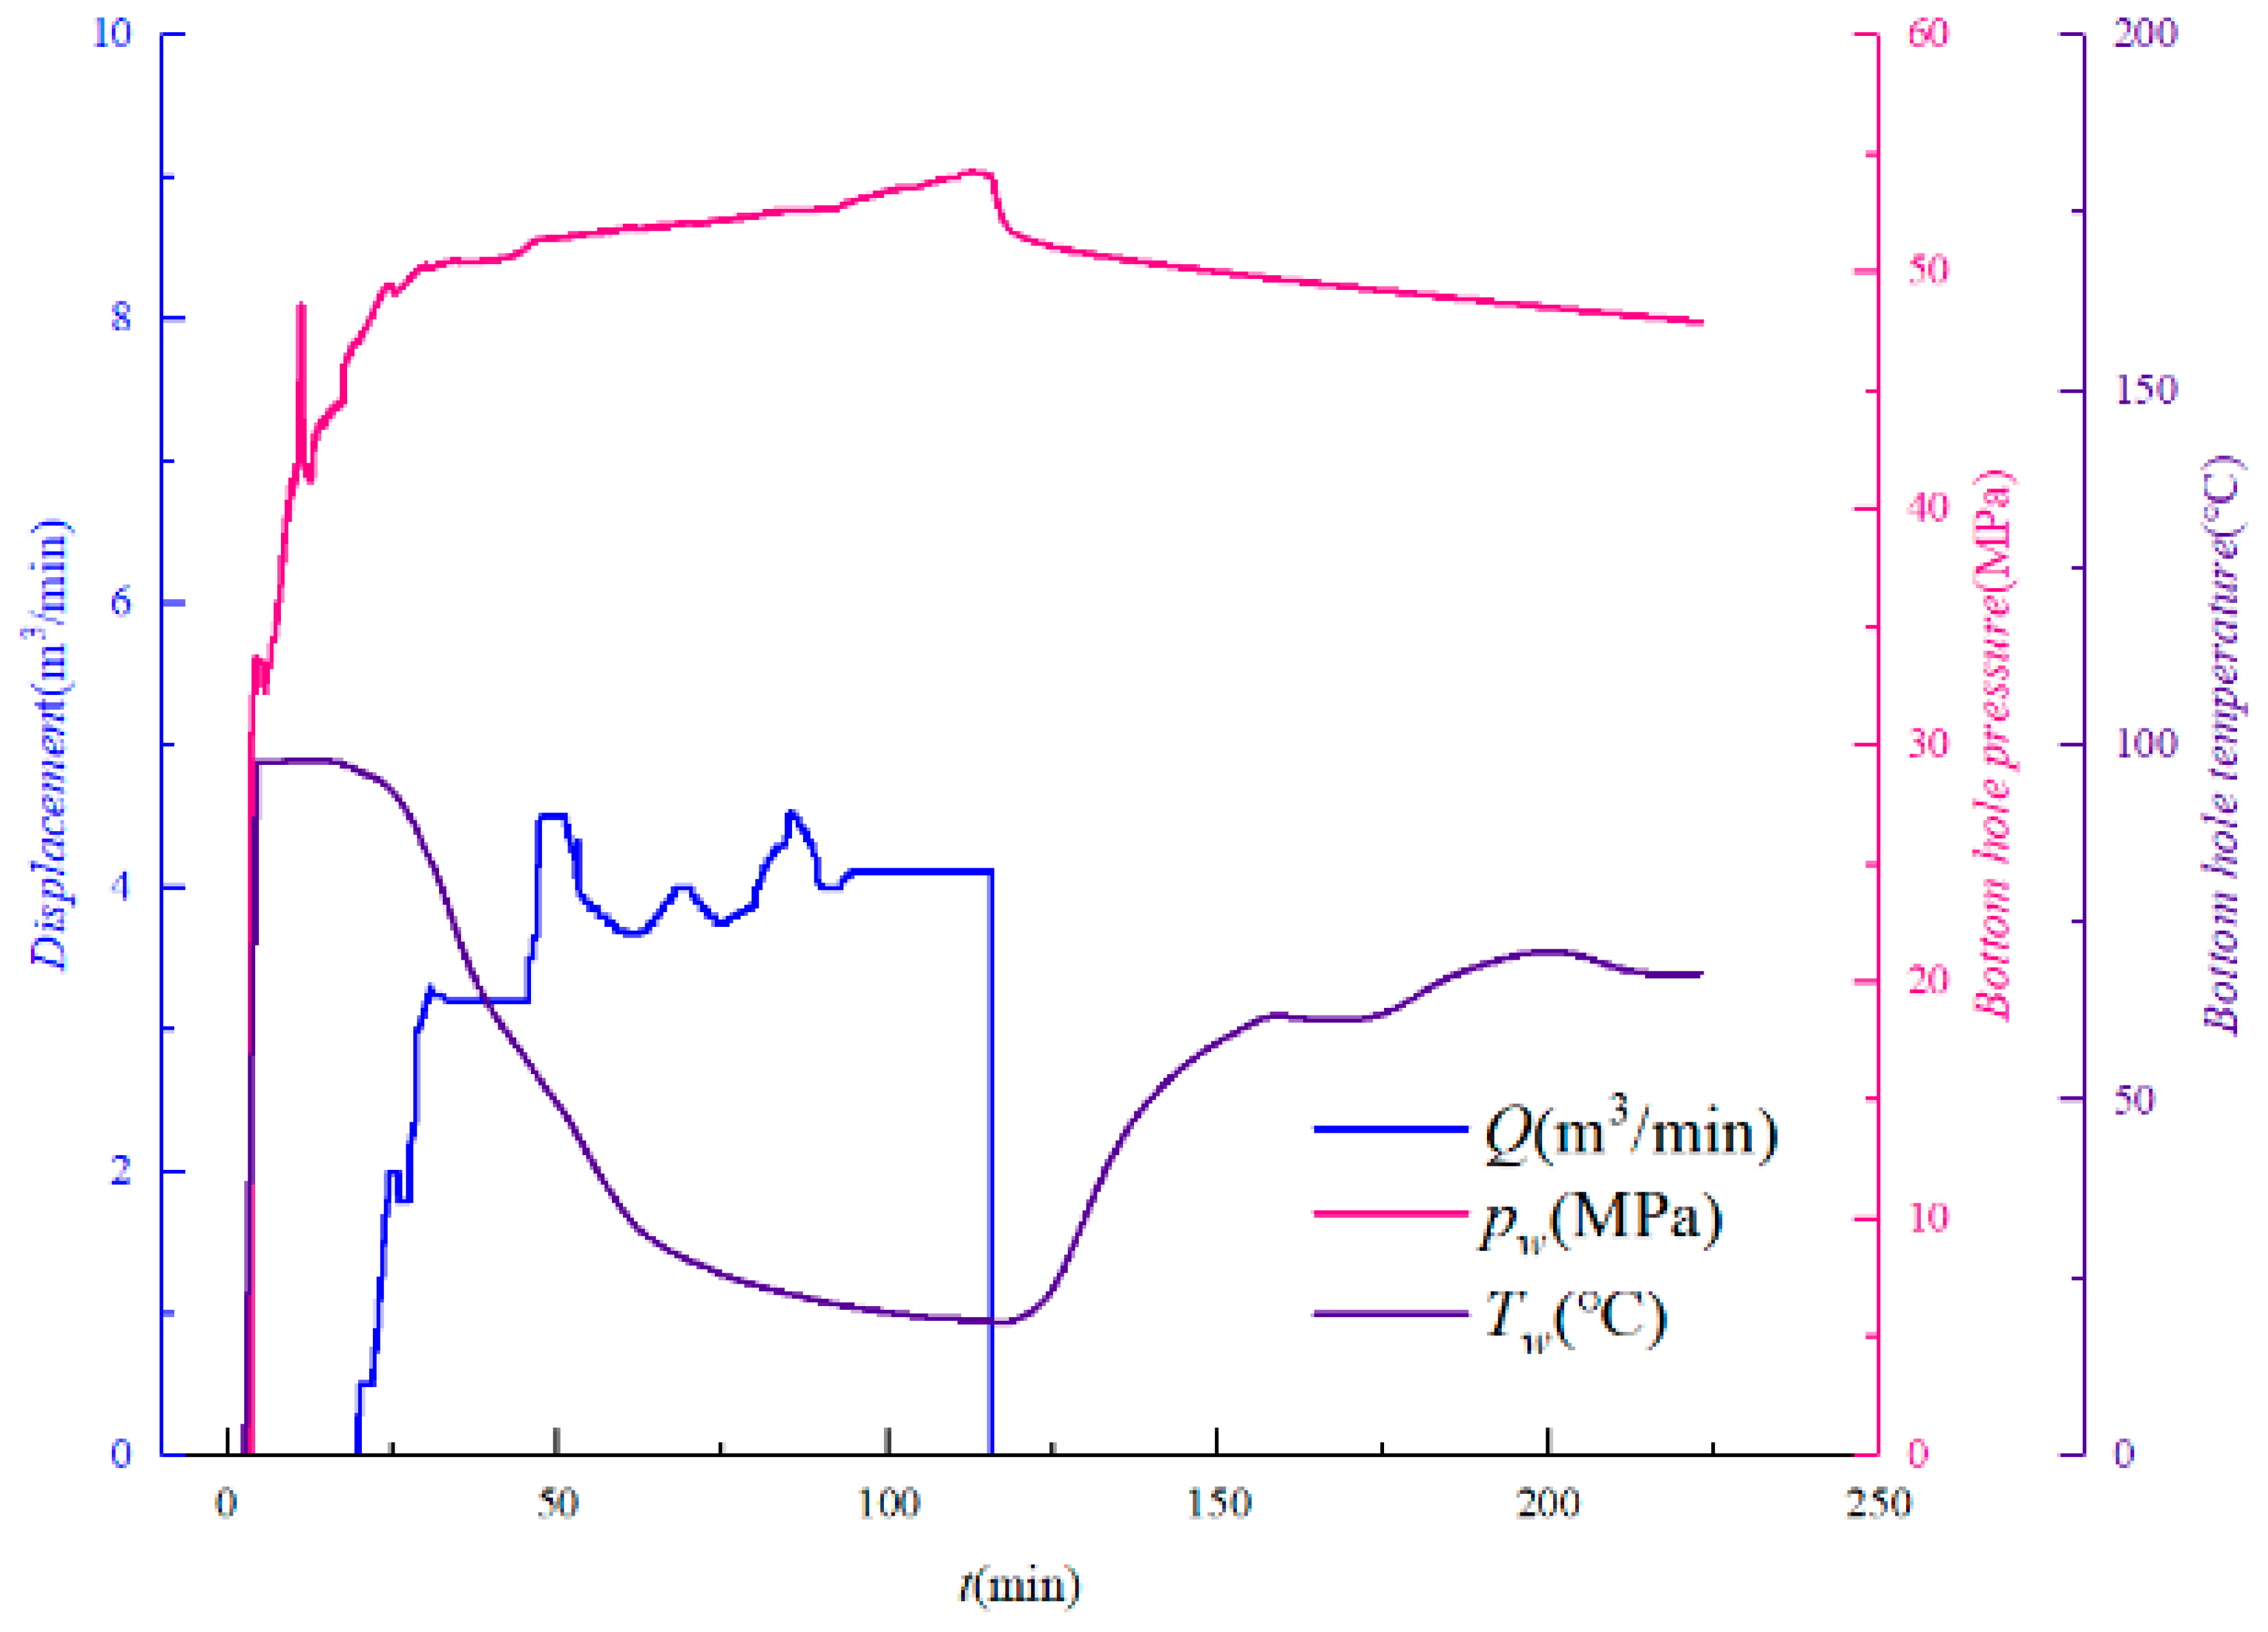
The original parameters used in the model are shown in Table 1, and the wellbore configuration is shown in Figure 3. All above conditions are from a well which actually conducted CO2 fracturing in the Sulige gas field Sudong block. The measured data at the bottom hole, such as injecting displacement, bottom hole pressure, and bottom hole temperature, are exhibited in Figure 4. In order to match the actual CO2 fracturing, tubing and annulus synchronous injection is applied as the injection mode during the calculation in this paper, noted as casing injection.
4.1. Model Validation and Wellbore Temperature–Pressure Distribution
The measured bottom hole temperature decreases with the injection of CO2 as shown in Figure 4. In order to verify the reliability of the model, the data point with an injection time of 2 h is chosen. The displacement of CO2 is 4 m3/min and the injection temperature and pressure are 258 K and 26.21 MPa, respectively. The measured and calculated values of bottom hole temperature and pressure are displayed in Table 2, while the errors are within 1%, which proves the rationality of wellbore temperature and pressure calculation.
Previous studies have shown that displacement [27] is the key factor affecting temperature and pressure of CO2 in the wellbore. The calculations of wellbore temperature and pressure distributions under difference displacement are shown in Figure 5 and Figure 6.
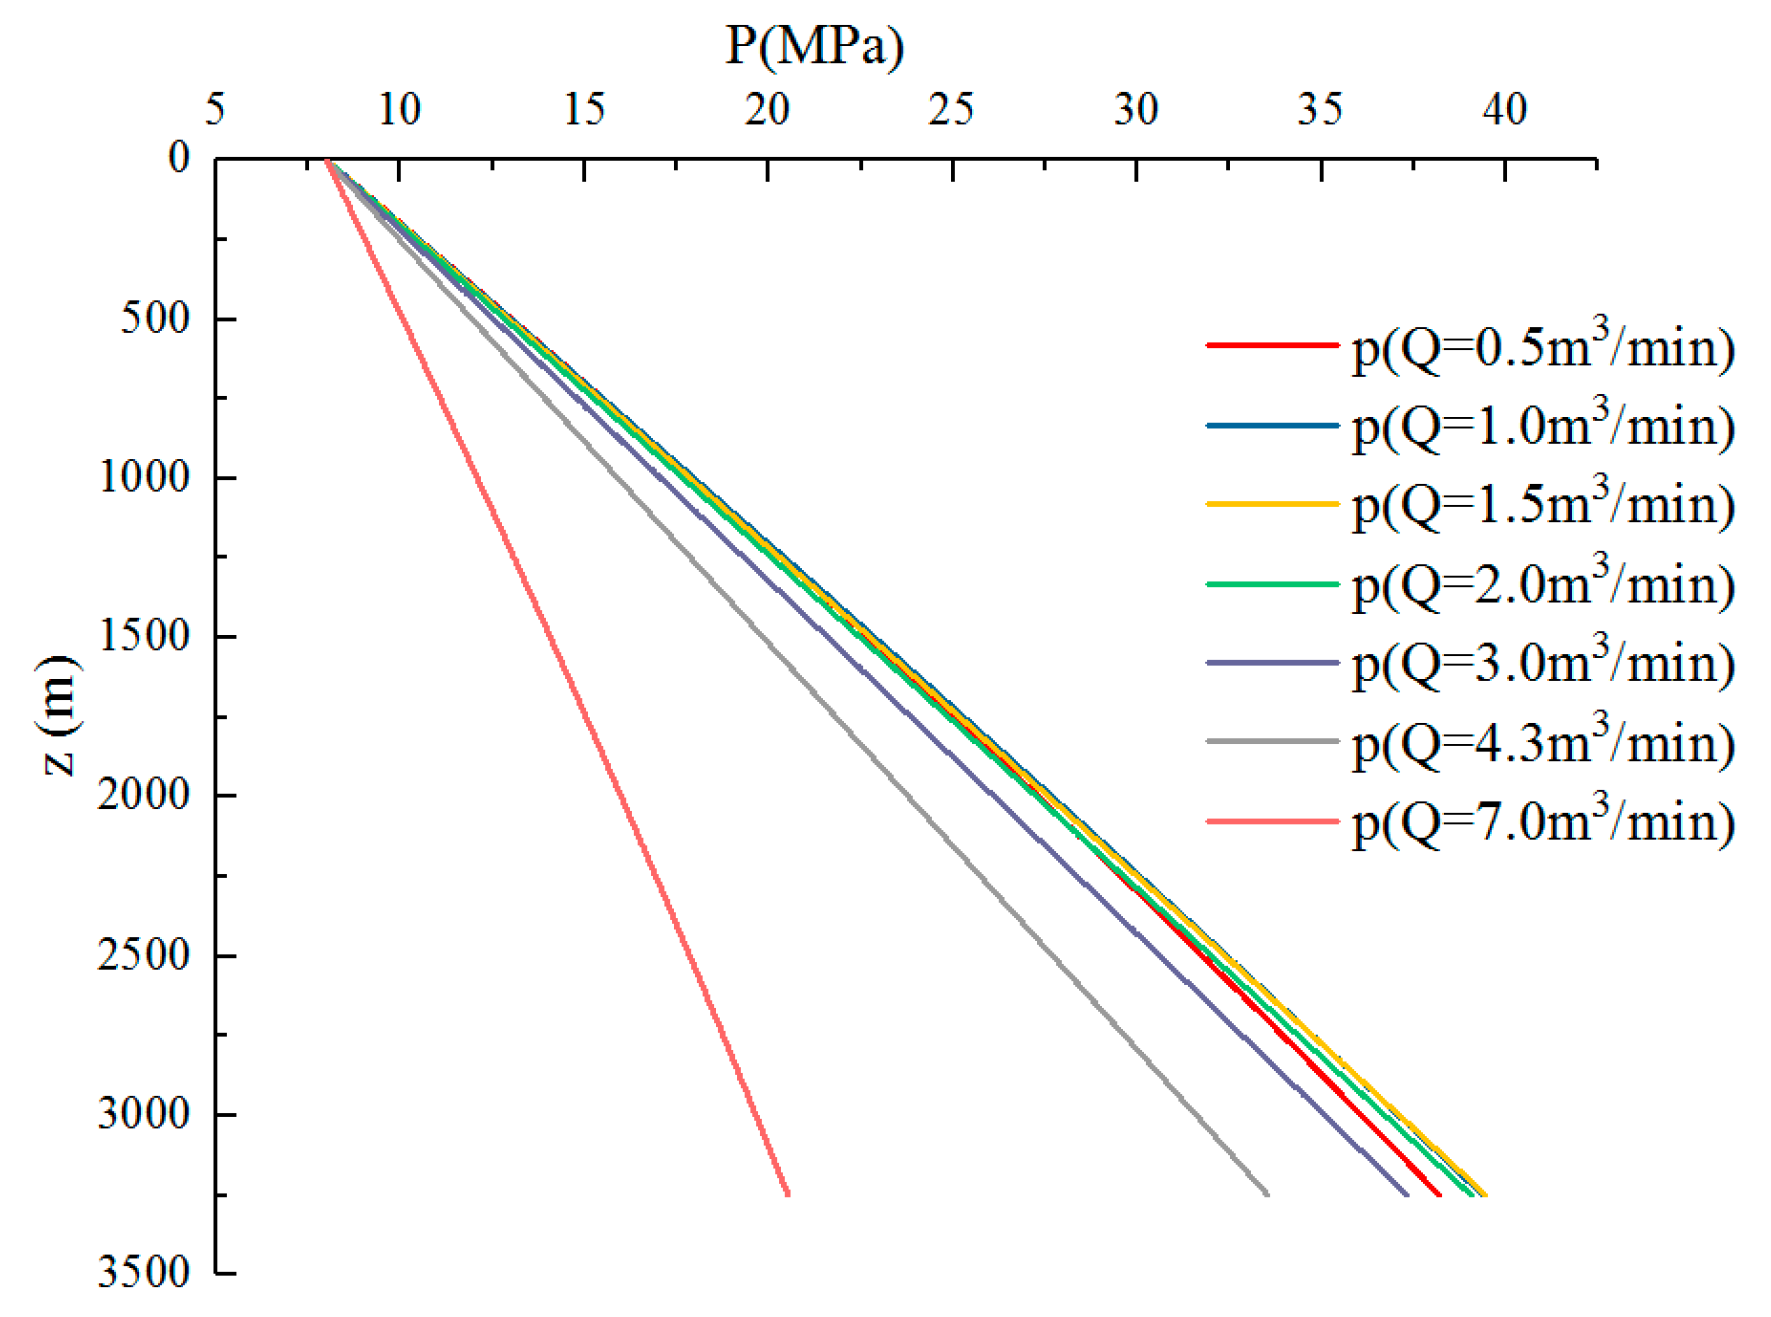
The pressure distribution in the wellbore under different displacement can be seen in Figure 5. It can be seen that the wellbore pressure increases linearly with well depth increasing, while pressure gradient increases first and then decreases with the increase of CO2 displacement; as demonstrated in Figure 7, the bottom hole pressure increases first and then decreases with displacement increasing. This is because wellbore pressure is affected by both the gravity head and the flow friction. With the increase of displacement, the magnitude of pressure increment caused by gravity head and flow friction dominates the change of pressure gradient. According to Figure 5 and Figure 7, when CO2 displacement is up to 7 m3/min, wellbore pressure grows slowly with well depth due to the excessive flow friction.
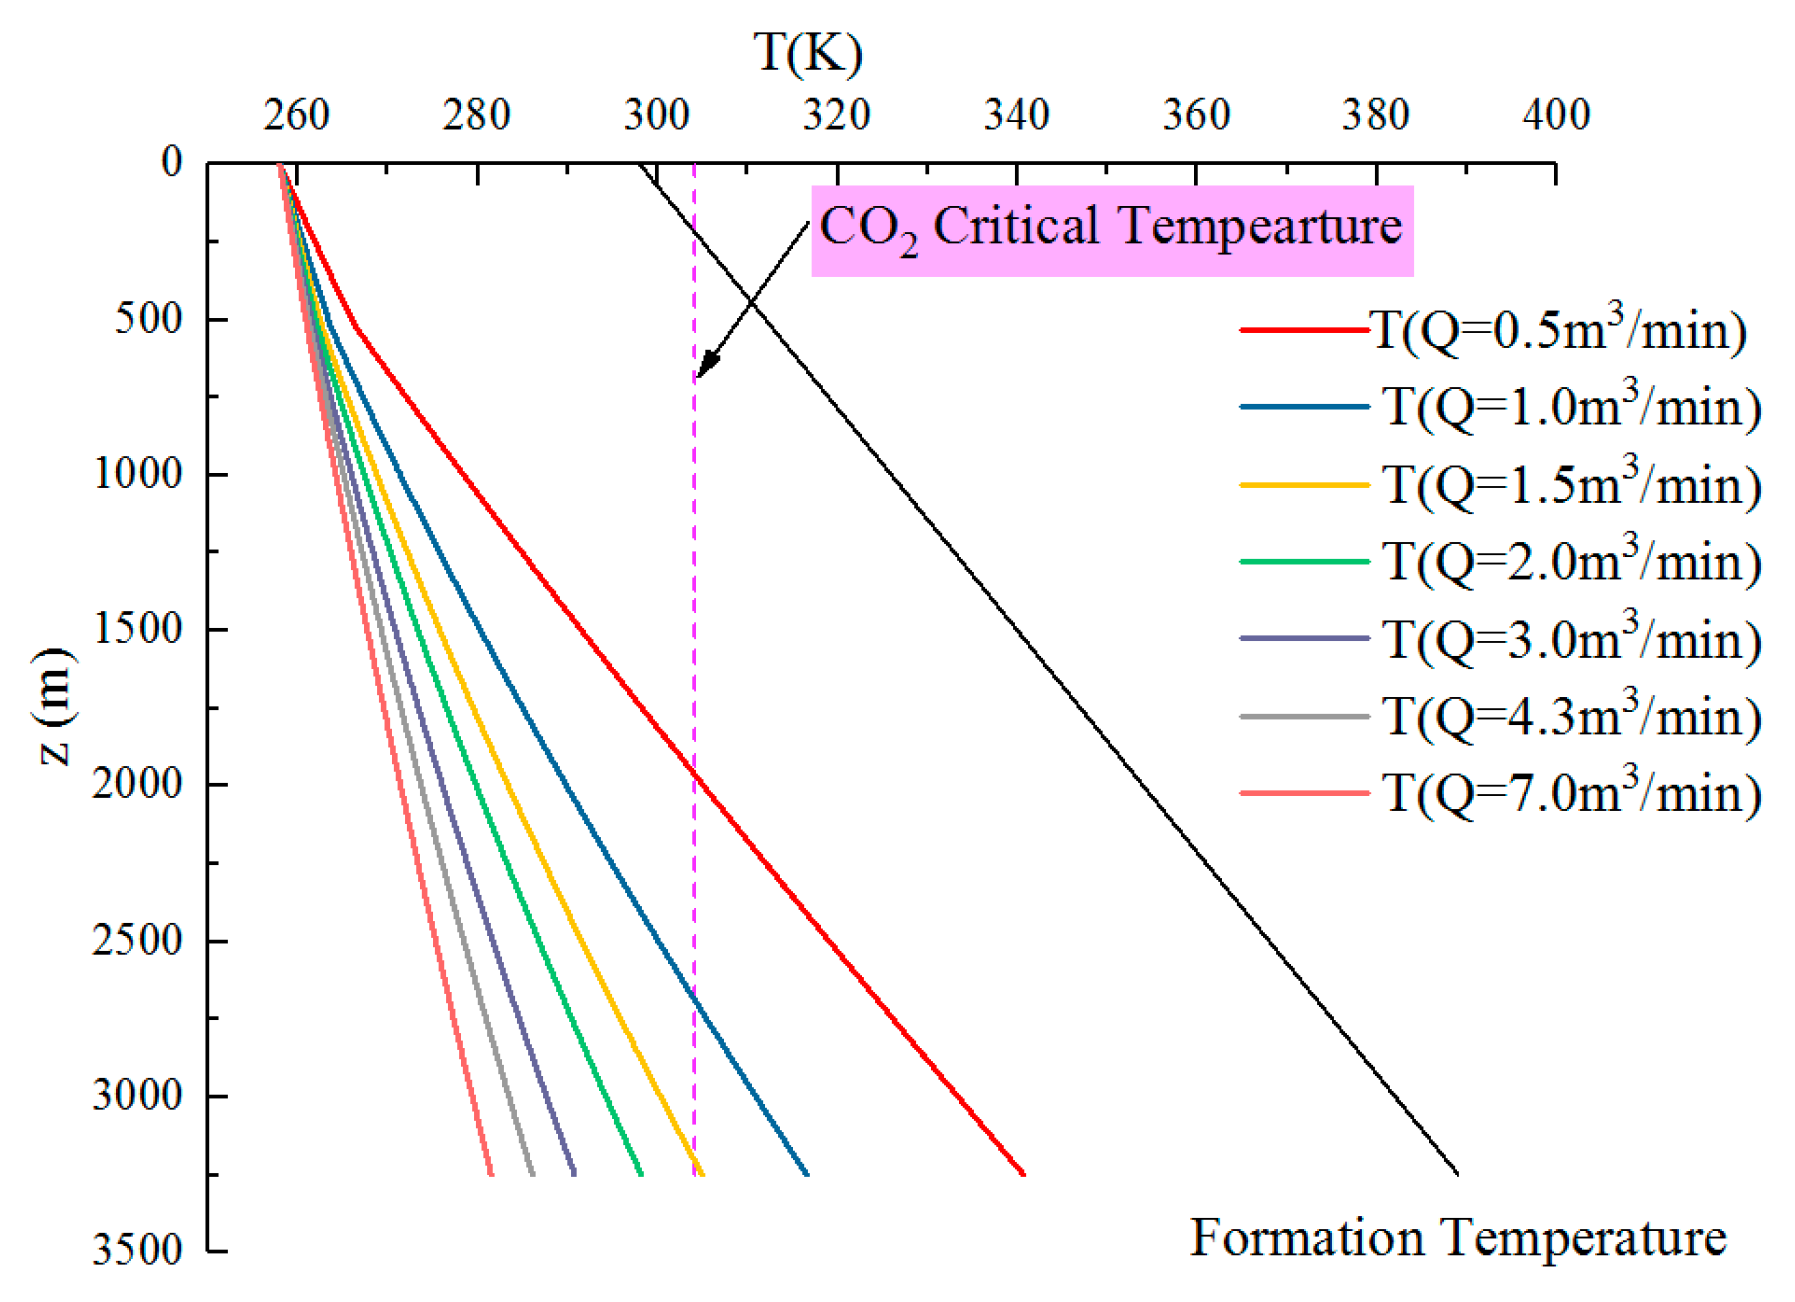
Figure 5 demonstrates the temperature distribution in the wellbore under different displacement. It can be seen that the temperature increases with the increase of well depth, while the bottom hole temperature decreases with displacement increasing, as shown in Figure 7. According to Figure 6 and Figure 7, CO2 turns from liquid state into supercritical state under low displacement; however, it stays in liquid state until reaching the bottom hole under high displacement. This phenomenon has been verified in field tests, as shown in Figure 4.
4.2. CO2 Phase State and Physical Properties Distribution
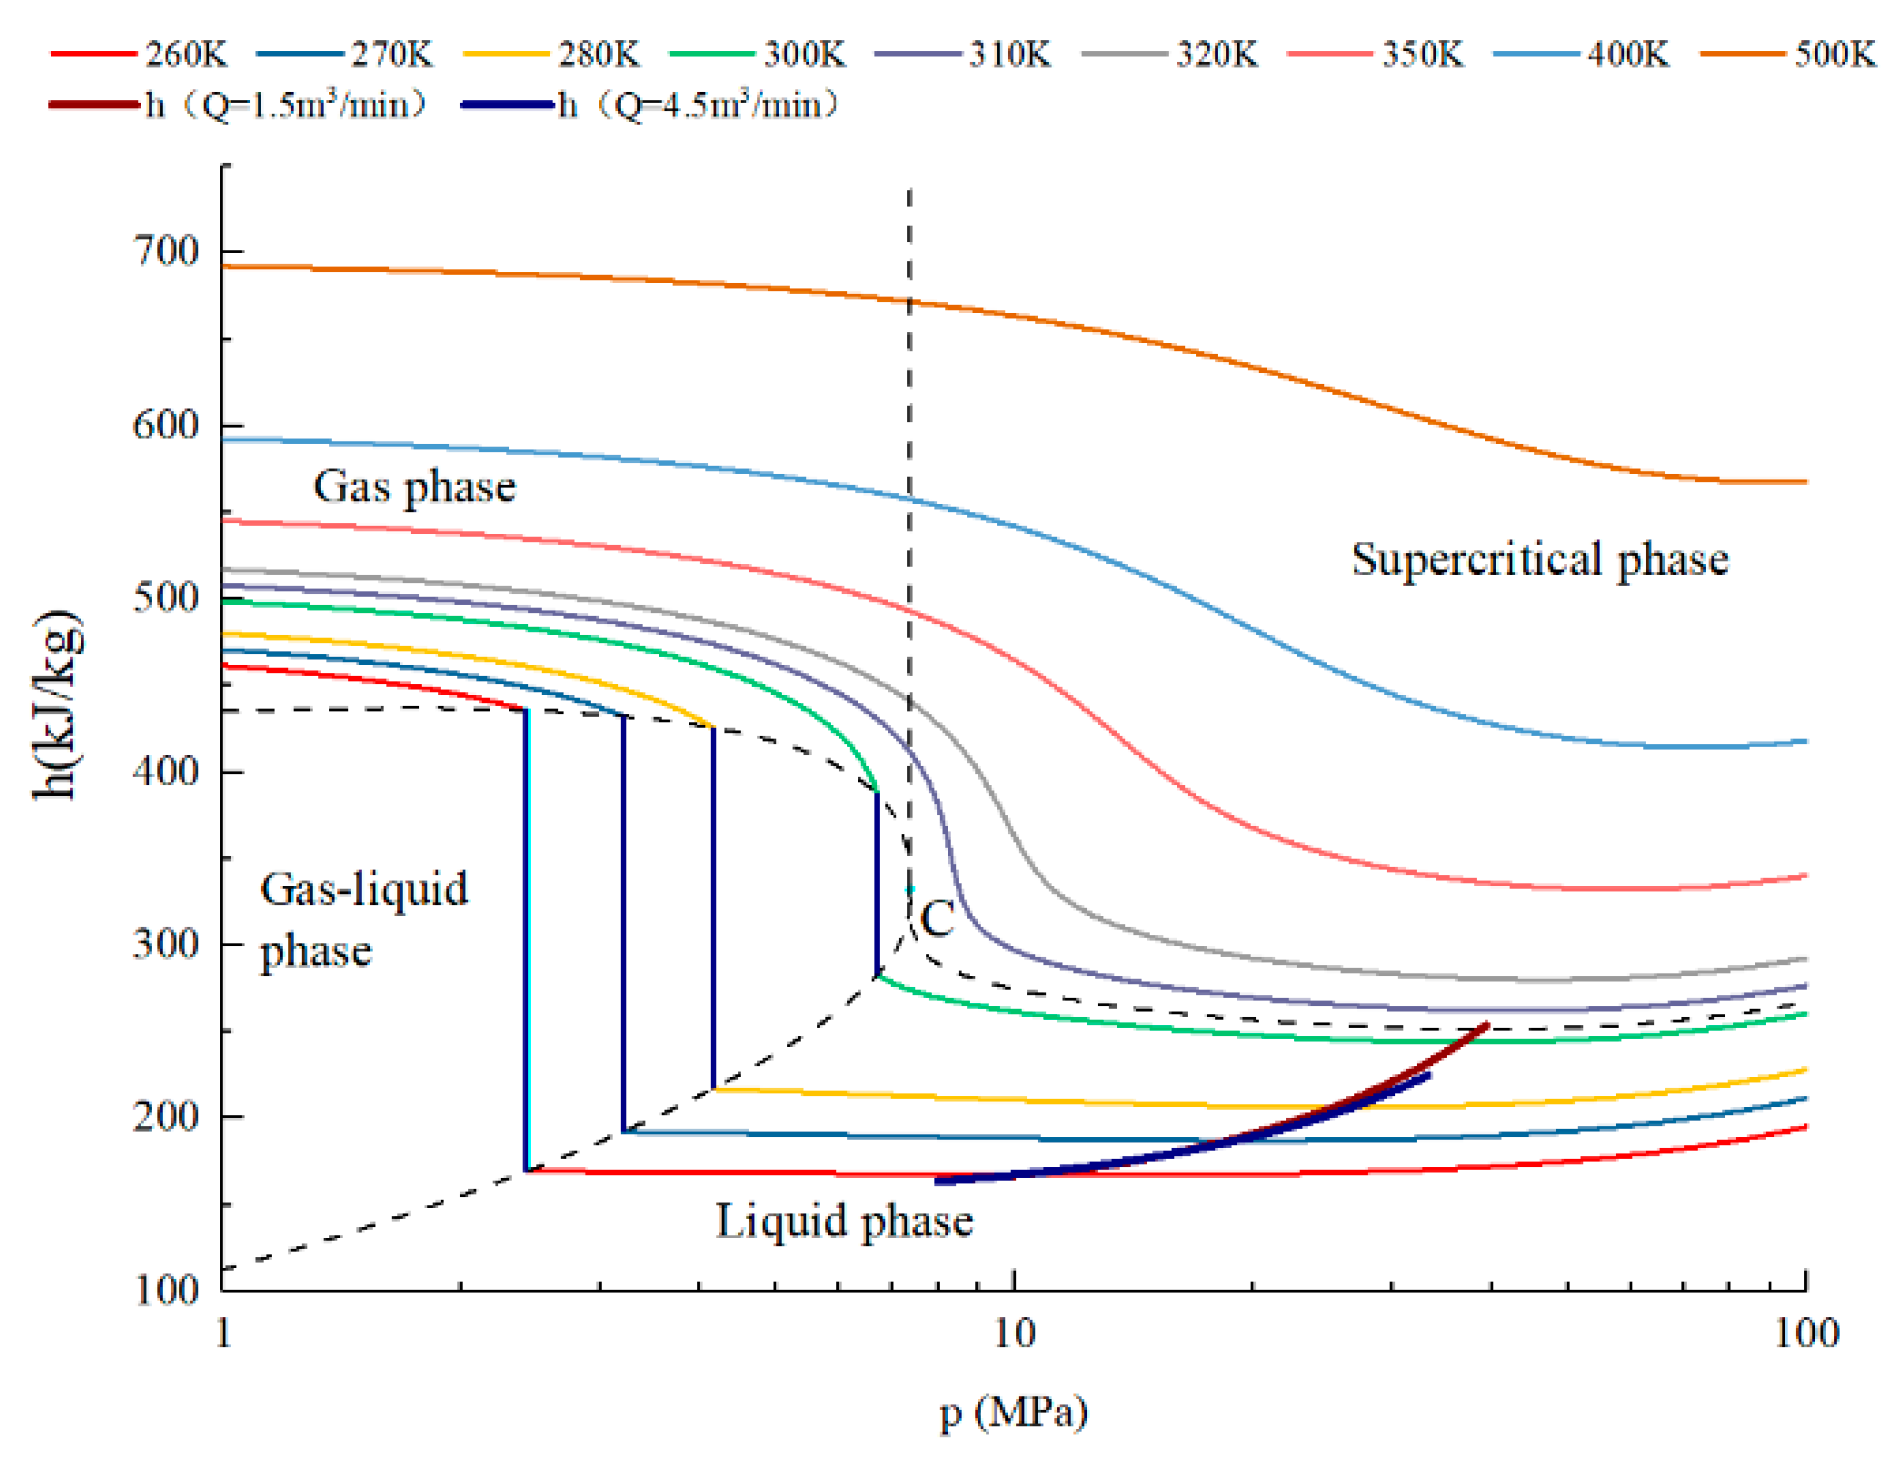
Because of the large difference between the injected fluid and geothermal temperature during CO2 fracturing, CO2 would absorb heat and might undergo phase change as approaching the bottom hole. A pressure–enthalpy diagram is adopted to analyze the phase transition process in the wellbore for CO2 fracturing, as presented in Figure 8. During the flow process from the wellhead to the bottom hole, CO2 transforms from liquid state into supercritical state under lower displacement, while it stays in liquid state under higher displacement, which is consistent with the conclusion drawn from Figure 6 and Figure 7.
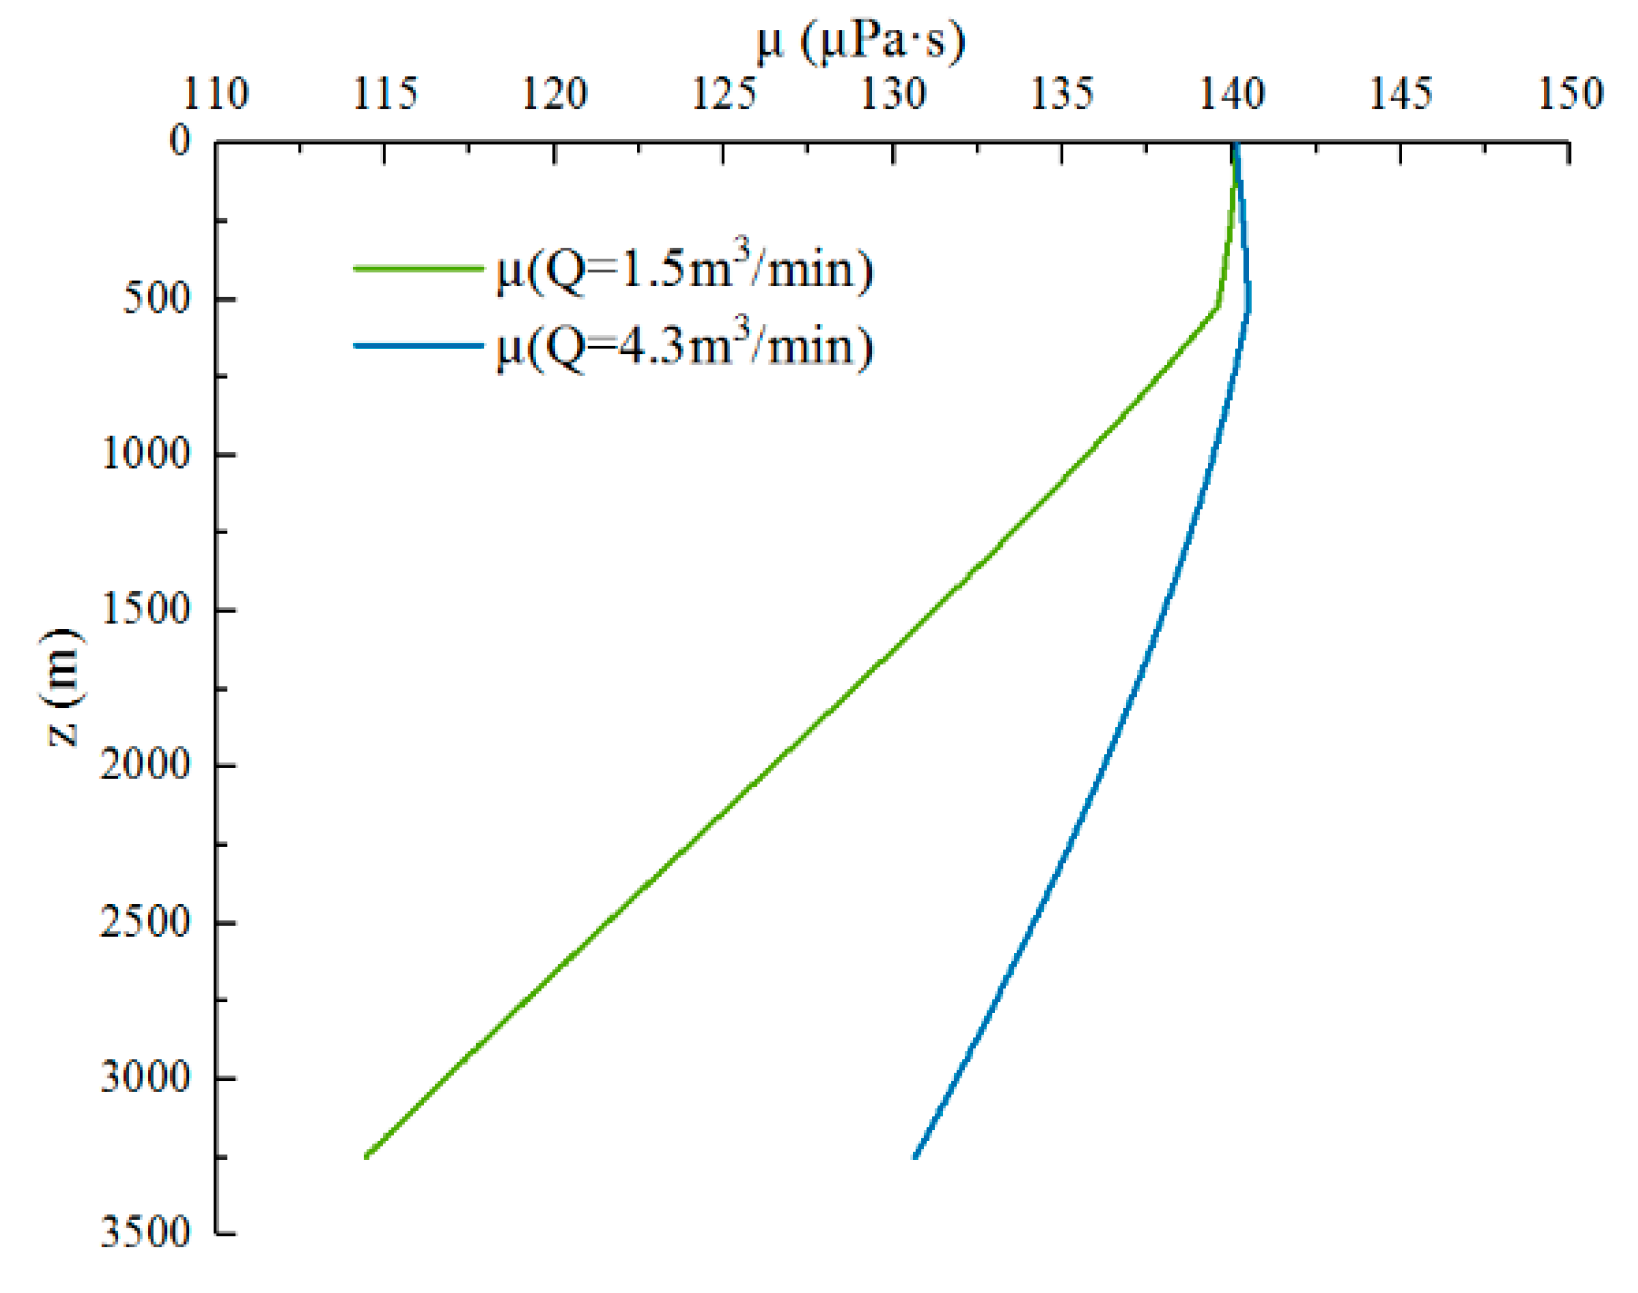
CO2 density and viscosity profiles are illustrated by Figure 9 and Figure 10. It can be seen from the diagrams that the trends of the density and viscosity of CO2 in the wellbore are matching. The density and viscosity of CO2 both tend to rise first and then reduce along the flow direction under different displacement, and the density and viscosity under the displacement of 1.5 m3/min are lower than those under the displacement of 4.5 m3/min. This is related to the undulation of heat exchange and flow friction caused by displacement increasing.
4.3. Sensitivity Analyses on Controlling Factors for CO2 Fracturing
During CO2 fracturing, the displacement, injection temperature, and pressure can be adjusted directly. The temperature and pressure distribution under different displacement have been analyzed in Section 4.1, so the influence of injection temperature and pressure on wellbore flow behavior of CO2 will be discussed in this section. Geothermal gradient is usually within a certain limit in one block; for the Sudong block where the working well is located, the measured geothermal gradient is 2.7–3.2 K/100 m. Therefore, the effect of geothermal gradient on wellbore temperature and pressure distribution is also considered in this section.
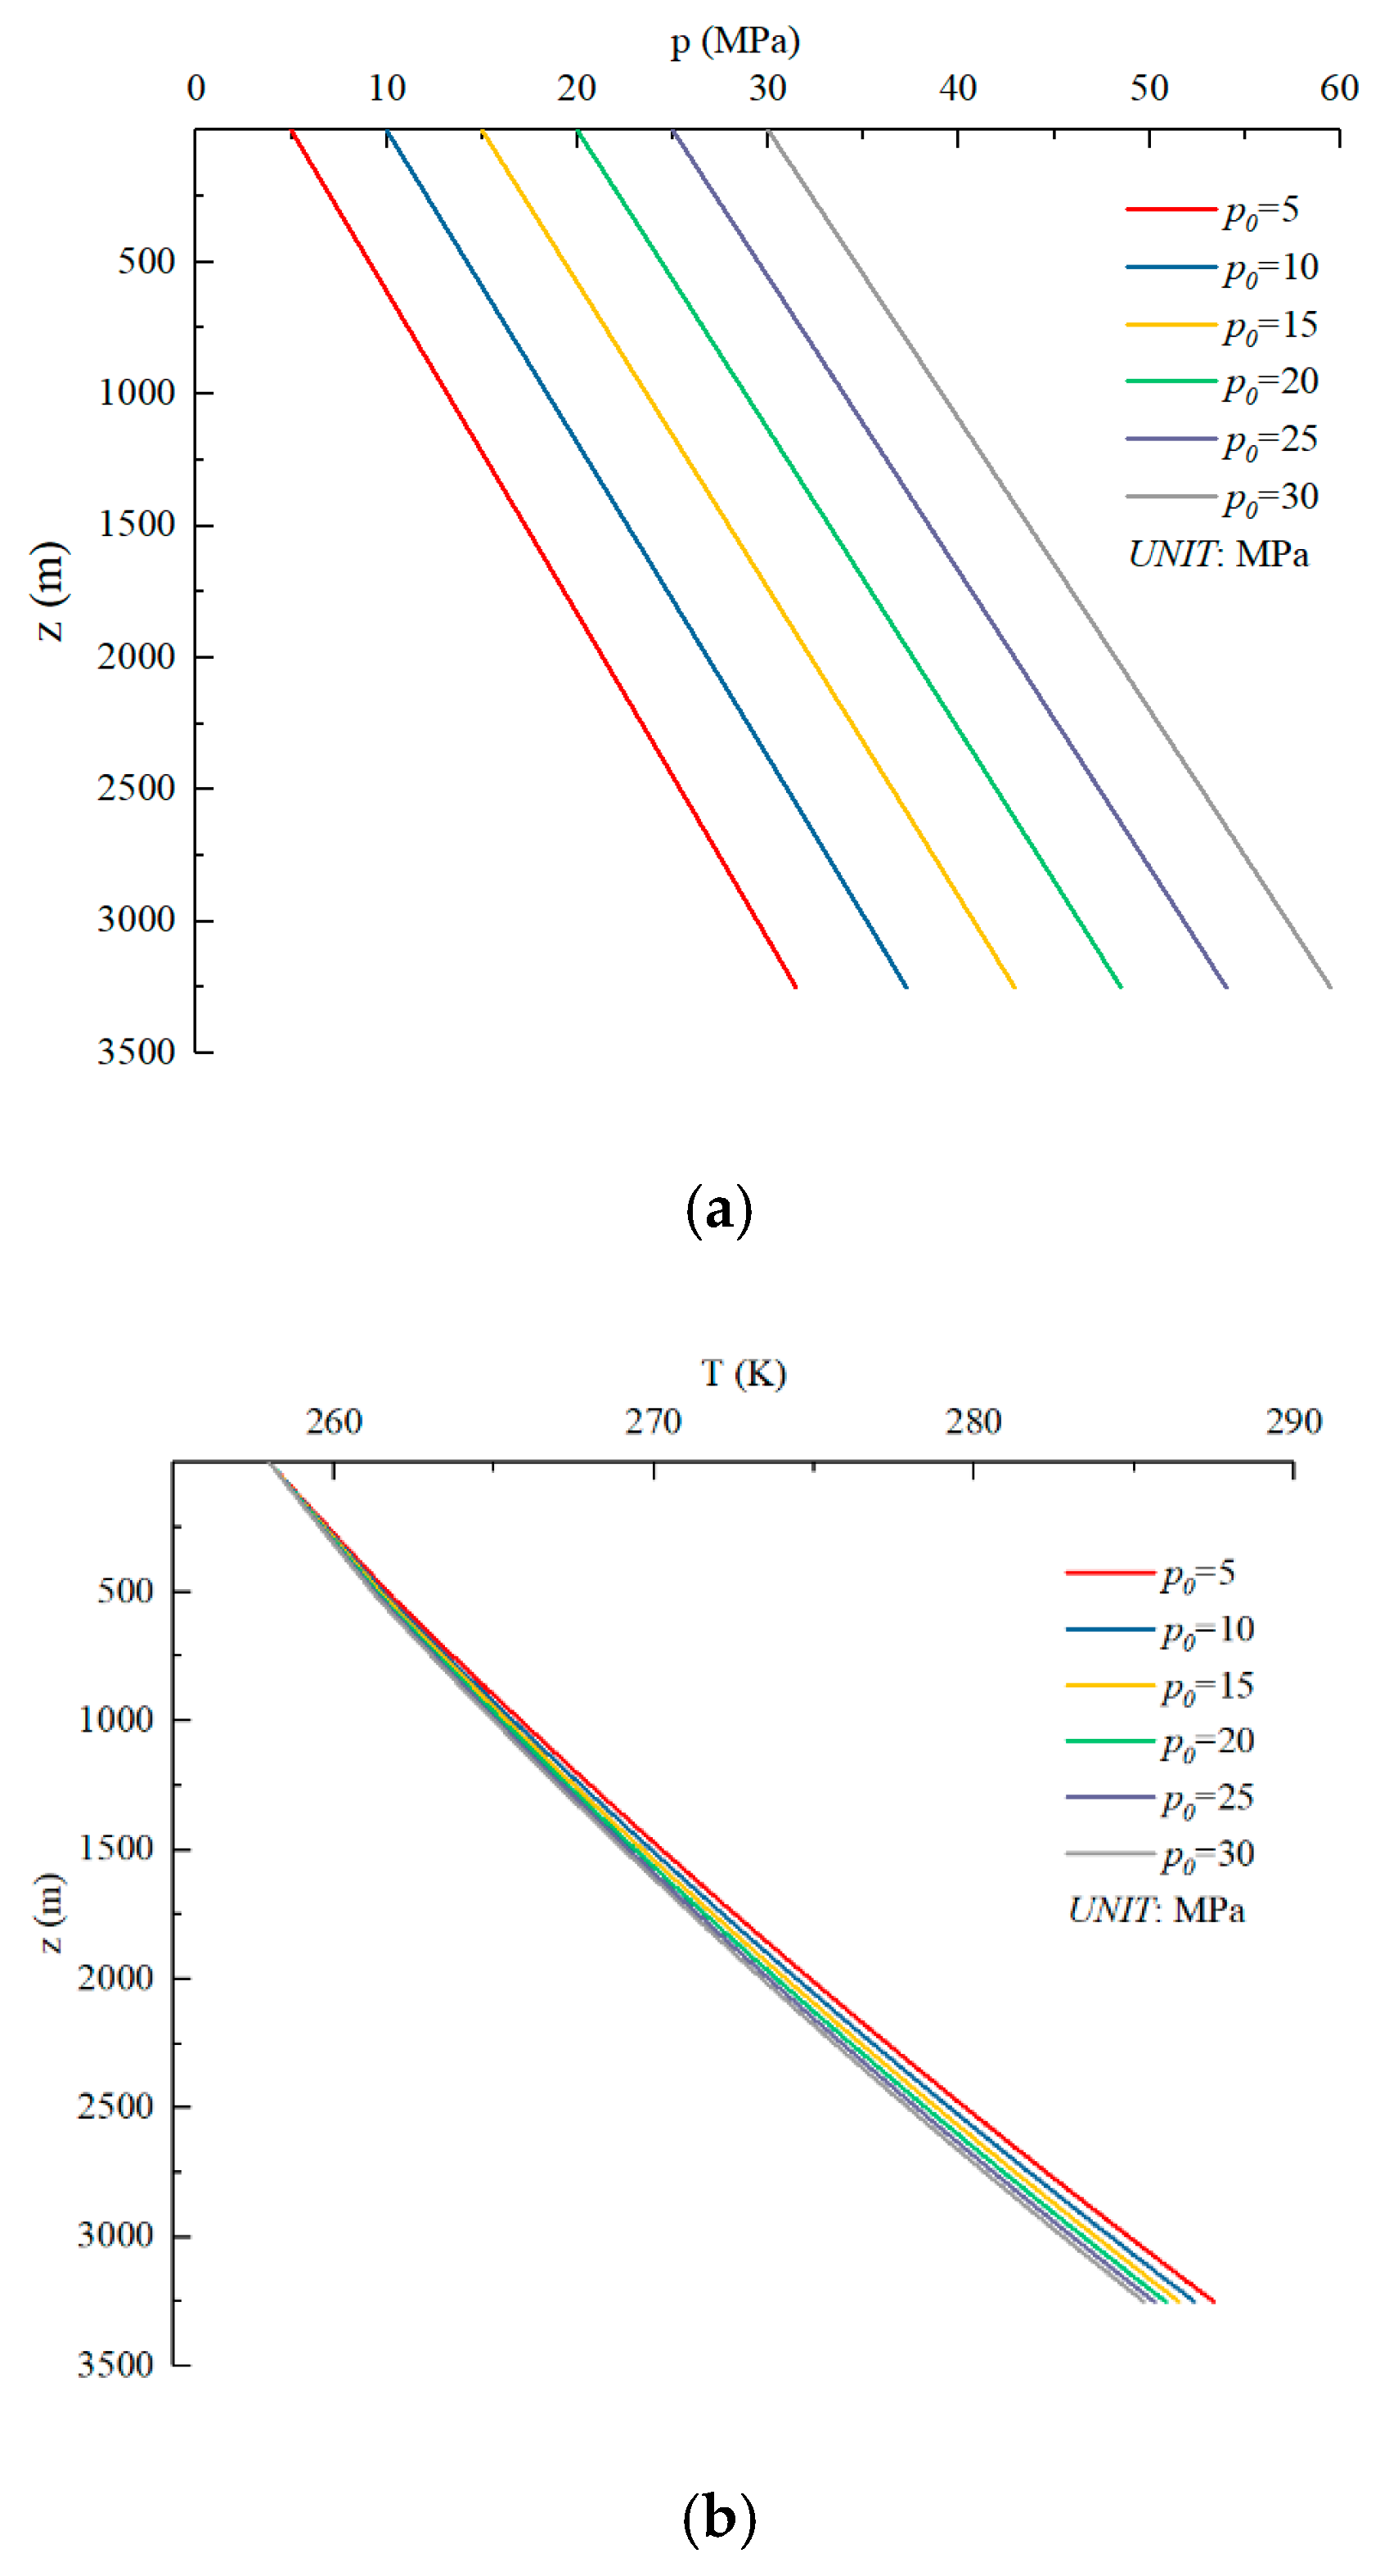
Figure 11 shows the influence of injection temperature on pressure and temperature distribution of CO2 fracturing. As can be seen in Figure 11b, there is an overall rise in wellbore temperature with the increase of injection temperature, while the temperature gradient in the wellbore almost remains unchanged. In addition, the injection temperature is in negative correlation with wellbore pressure, which means the pressure gradient in the wellbore reduces as injection temperature rises, as demonstrated in Figure 11a.
As a whole, the supercritical well depth (i.e., the well depth for CO2 reaching supercritical phase) decreases with the increase of injection temperature, and when injection temperature exceeds critical temperature (304.13 K), CO2 maintains supercritical state in the wellbore. However, excess injection temperature brings enormous cost in wellbore pressure, hence, it needs to be seriously considered whether to raise the injection temperature during CO2 fracturing.
The effect of injection pressure on pressure and temperature distribution during CO2 fracturing is shown in Figure 12. The increase of injection pressure would lead to a rise of the whole wellbore pressure and the pressure gradient remains unchanged according to Figure 12a. As exhibited in Figure 12b, the whole wellbore temperature reduces as injection pressure increases, but the change is very small.
Moreover, it can be drawn from Figure 11 and Figure 12 that the rising temperature has a greater impact on the wellbore flow behavior of CO2 compared to the rising pressure. This is because the physical properties, especially density and viscosity, fluctuate sharply with a great temperature rise under the temperature–pressure condition of CO2 fracturing.
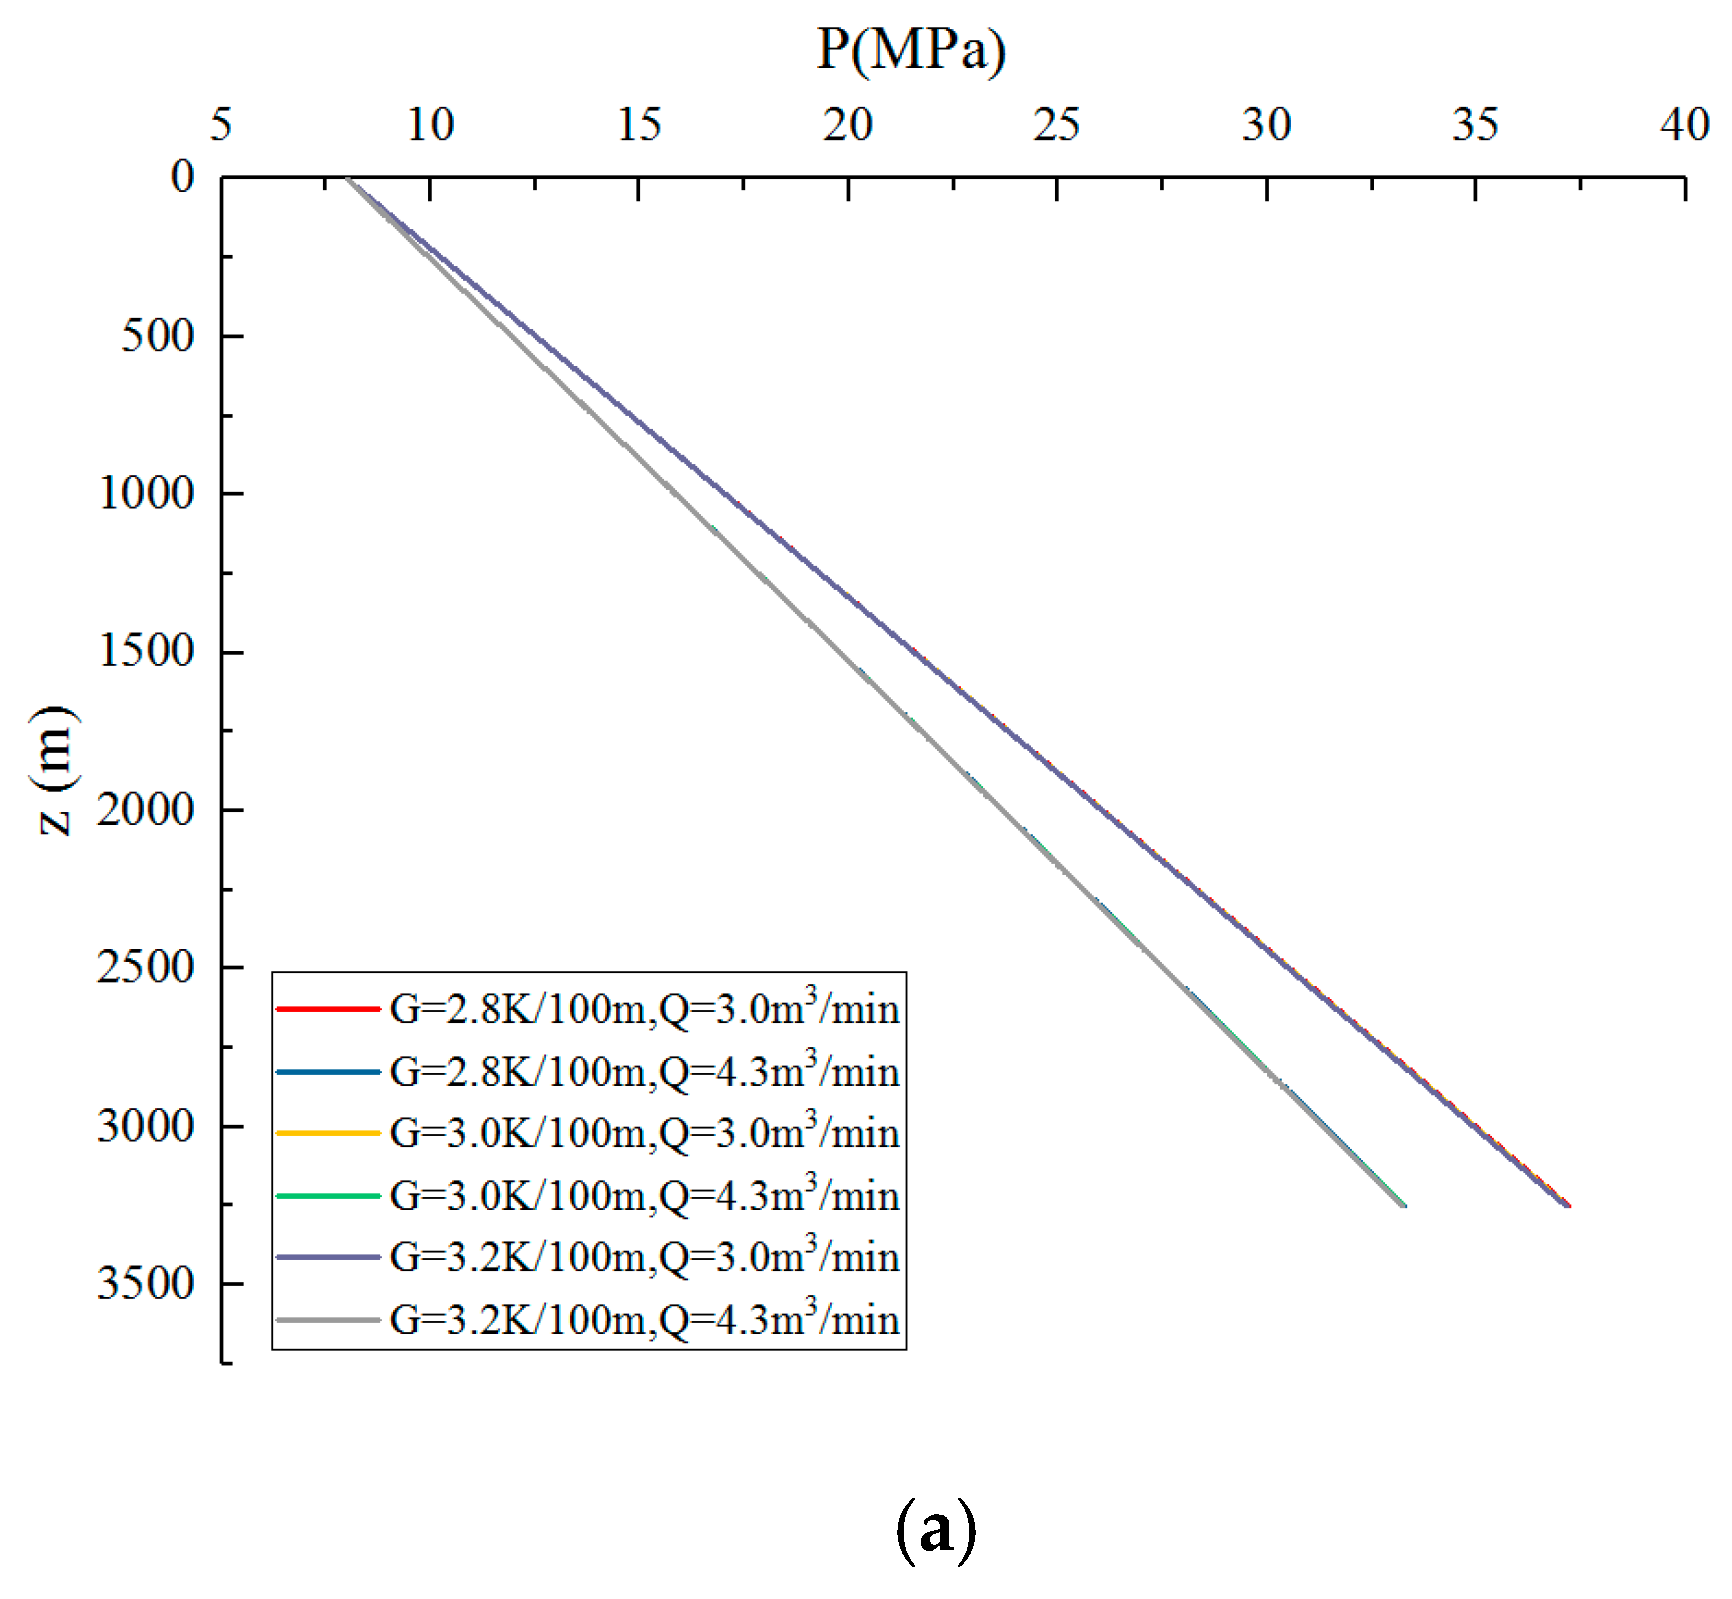
Figure 13 presents the influence of the geothermal gradient on the pressure and temperature distribution in the process of CO2 flow in the wellbore. As can be seen in Figure 13, there is little impact of geothermal gradient on wellbore pressure. Although wellbore temperature increases with the increase of geothermal gradient, as shown in Figure 13, the increase is not obvious. The reason for this phenomenon is that higher displacement will weaken the heat exchange between the stratum and CO2 in the wellbore, and the temperature increment caused by geothermal gradient needs to be accumulated with well depth, which makes the increase of fluid temperature in the wellbore insufficient to change the wellbore pressure.
In general, the displacement and injection temperature have greater impact on CO2 flow behavior and phase state than injection pressure under the temperature–pressure condition of CO2 fracturing. Nevertheless, excess injection temperature has an adverse effect on wellbore pressure, so displacement is the key factor affecting CO2 flow behavior in the wellbore during CO2 fracturing. Moreover, the influence of thermal gradient on wellbore flow is not obvious within one block during CO2 fracturing.
5. Conclusions
A coupled model is proposed to predict the flow field of CO2 fracturing in this paper. The model is based on compressible fluid flow equations and solved by coupling temperature and pressure with an iterative method. According to the calculated results, wellbore pressure, temperature, CO2 properties, and phase state along depth are gained and a sensitivity study is conducted to analyze the controlling factors for CO2 fracturing. The conclusions are as follows:
(1) The bottom hole pressure increases first and then decreases, and the bottom hole temperature decreases with an increase in displacement. The bottom hole temperature tends to keep a lower level under sustained high displacement, which has been verified in field tests.
(2) Both the pressure and temperature are highly coupled with physical properties of CO2. CO2 turns from liquid state into supercritical state under low displacement, while it tends to maintain liquid state in the whole wellbore under high displacement.
(3) Under the temperature–pressure condition of CO2 fracturing, the injection temperature has a greater impact on the wellbore flow behavior of CO2 compared to the injection pressure, whereas excess injection temperature is adverse to pressure rising in the wellbore. Besides, the influence of thermal gradient on wellbore flow is not obvious within one block during CO2 fracturing.
(4) Displacement is the key factor affecting CO2 flow behavior in the wellbore during CO2 fracturing.
Because of the good compressibility and high permeability of CO2, it is easy for CO2 to intrude into the reservoir rock and cause rock damage. And the pressure and temperature distributions in the wellbore significantly affect the fracture initiation and propagation in the reservoir. According to CO2 flow behavior in the wellbore, the fracture initiation and propagation under the real bottom hole temperature–pressure condition can be analyzed for further research.
Author Contributions
Model developed and solved, C.X. and J.B.; field measurement data acquisition and processing, J.B. and C.M.; calculated results analysis, C.X., J.B., and C.M.; writing—original draft preparation, C.X.; writing—review and editing, J.B., C.M., and L.Z.; funding acquisition, J.B. and C.M.
Funding
This research was funded by [the Wellbore Sand-Carrying and Flow of CO2 Fracturing] grant number [CQYT-SLGYJZX-2017-JS-1513].
Acknowledgments
The financial supports from the Wellbore Sand-Carrying and Flow of CO2 Fracturing Project of Oil and Gas Research Institute in Changqing Oilfield. We sincerely thank our colleagues at the Water Jet Research Centre in China University of Petroleum (East China) for collaborating the theory research.
Conflicts of Interest
The authors declare no conflict of interest.
Appendix A. Semianalytical Method for Formation Heat Transfer
The Hasan Equation [33] is the most widely used semianalytical method for the unsteady heat transfer in the stratum.
The dimensionless temperature is used to represent the unsteady heat transmission of the formation in the Hasan Equation,
where is dimensionless time; a is thermal diffusion coefficient of formation, m2/s; t is time, s; Re is radius of the interface between the formation and wellbore, m.
Appendix B. Thermal Resistance of Wellbore
In order to ensure the sand-carrying and fracturing scale, annulus synchronously injecting is the most used injection mode for CO2 fracturing.
The expressions of thermal resistance between the stratum and annulus fluid, and between the annulus and tubing fluid, are as follows, respectively,
where TD is dimensionless temperature, for characterizing the formation temperature distribution during the circulation; λe is the heat conductivity of formation, W/(m·K); hao is the heat convection coefficient of the outer wall in the annulus, W/(m2·K); hti is the heat convection coefficient of the inner wall of tubing, W/(m2·K); hto is the heat convection coefficient of the outer wall of tubing, W/(m2·K); λce is the heat conductivity of the cement ring, W/(m·K); λca is the heat conductivity of casing, W/(m·K); λt is the heat conductivity of tubing, W/(m·K); db is the diameter of the barefoot hole, m; dci is the inner diameter of casing, m; dco is the outer diameter of casing, m; dti is the inner diameter of tubing, m; dto is outer diameter of tubing, m.
The heat convection coefficient can be obtained by calculating the fluid Nusselt number. The expressions of Nu at the inner wall of tubing, Equation (A4), outer wall of tubing, Equation (A5), and outer wall of annulus, Equation (A6), are as follows.
where Pr is Prandtl number, dimensionless; D1 and D2 are the inner and outer diameters of the annular, m, respectively. All the expressions of Nu are derived from the Dittus–Boelter formula [34].
With the sufficient displacement of CO2 fracturing, the thermal resistance between the stratum and annulus fluid is much smaller than that between the annulus and tubing fluid, according to the calculation, Rat is less than 1% of Rea. Therefore, the temperature difference between the fluid in the annulus and tubing can be ignored (i.e., the fluid temperature in the wellbore can be regarded as a whole).
References
- Bullen, R.S.; Lillies, A.T. Carbon Dioxide Fracturing Process and Apparatus. U.S. Patent 4,374,545, 22 February 1983. [Google Scholar]
- Mazza, R.L. Liquid-Free CO2/Sand Stimulations: An Overlooked Technology-Production Update. In Proceedings of the SPE Eastern Regional Meeting, Canton, OH, USA, 17–19 October 2001. [Google Scholar]
- Middleton, R.; Viswanathan, H.; Currier, R.; Gupta, R. CO2 as a fracturing fluid: Potential for commercial-scale shale gas production and CO2 sequestration. Energy Procedia 2014, 63, 7780–7784. [Google Scholar] [CrossRef]
- Asadi, M.; Scharmach, W.; Jones, T.; Sampayo, A.; Chesney, E.; Unruh, D. Water-Free Fracturing: A Case History. In Proceedings of the SPE Eastern Regional Meeting, Morgantown, WV, USA, 13–15 October 2015. [Google Scholar]
- Li, M.; Ni, H.; Wang, R.; Xiao, C. Comparative simulation research on the stress characteristics of supercritical carbon dioxide jets, nitrogen jets and water jets. Eng. Appl. Comput. Fluid Mech. 2017, 11, 357–370. [Google Scholar] [CrossRef] [Green Version]
- Wang, H.; Li, G.; Shen, Z. A feasibility analysis on shale gas exploitation with supercritical carbon dioxide. Energy Sources Part A 2012, 34, 1426–1435. [Google Scholar] [CrossRef]
- Chung, F.T.H.; Jones, R.A.; Burchfield, T.E. Recovery of viscous oil under high pressure by CO2 displacement: A laboratory study. In Proceedings of the International Meeting on Petroleum Engineering, Tianjin, China, 1–4 November 1988. [Google Scholar]
- Zhang, L.; Ezekiel, J.; Li, D.; Pei, J.; Ren, S. Potential assessment of CO2 injection for heat mining and geological storage in geothermal reservoirs of China. Appl. Energy 2014, 122, 237–246. [Google Scholar] [CrossRef]
- Wang, J.; Lv, K.; Bian, Y.; Cheng, Y. Energy efficiency and marginal carbon dioxide emission abatement cost in urban China. Energy Policy 2017, 105, 246–255. [Google Scholar] [CrossRef]
- Dai, Z.; Middleton, R.; Viswanathan, H.; Fessenden-Rahn, J.; Bauman, J.; Pawar, R.; Lee, S.Y.; McPherson, B. An integrated framework for optimizing CO2 sequestration and enhanced oil recovery. Environ. Sci. Technol. Lett. 2014, 1, 49–54. [Google Scholar] [CrossRef]
- Dai, Z.; Viswanathan, H.; Middleton, R.; Pan, F.; Ampomah, W.; Yang, C.; Jia, W.; Xiao, T.; Lee, S.Y.; McPherson, B.; et al. CO2 accounting and risk analysis for CO2 sequestration at enhanced oil recovery sites. Environ. Sci. Technol. Lett. 2016, 50, 7546–7554. [Google Scholar] [CrossRef]
- Balch, R.; McPherson, B. Integrating enhanced oil recovery and carbon capture and storage projects: a case study at farnsworth field, Texas. In Proceedings of the SPE Western Regional Meeting, Anchorage, AK, USA, 23–26 May 2016; Society of Petroleum Engineers. [Google Scholar]
- Ampomah, W.; Balch, R.S.; Rose-Coss, D.; Will, R.; Cather, M.; Dai, Z.; Soltanian, M.R. Optimal Design of CO2 Storage and Oil Recovery under Geological Uncertainty. Appl. Energy 2017, 195, 80–92. [Google Scholar] [CrossRef]
- Ramey, H.J. Wellbore heat transmission. J. Pet. Technol. 1962, 14, 427–435. [Google Scholar] [CrossRef]
- Raymond, L.R. Temperature distribution in a circulating drilling fluid. J. Pet. Technol. 1969, 21, 333–341. [Google Scholar] [CrossRef]
- Eickmeier, J.R.; Ersoy, D.; Ramey, H.J. Wellbore temperatures and heat losses during production or injection operations. J. Pet. Technol. 1970, 9. [Google Scholar] [CrossRef]
- Hasan, A.R.; Kabir, C.S. Aspects of wellbore heat transfer during two-phase flow. SPE Prod. Facil. 1994, 9, 211–216. [Google Scholar] [CrossRef]
- Hasan, A.R.; Kabir, C.S. Wellbore heat-transfer modeling and applications. J. Pet. Technol. 2012, 86, 127–136. [Google Scholar] [CrossRef]
- Kabir, C.S.; Hasan, A.R.; Kouba, G.E.; Ameen, M. Determining circulating fluid temperature in drilling, workover, and well-control operations. SPE Drill. Complet. 1996, 11, 74–79. [Google Scholar] [CrossRef]
- Gao-Feng, W.; Yong-Le, H.U.; Zhi-Ping, L.I.; Wei, Y.; Yu-Wei, J. Modification and Application of Ramey’s Wellbore Heat Transmission. J. Southwest Pet. Univ. 2011, 33, 5. [Google Scholar]
- Cronshaw, M.B.; Bolling, J.D. A numerical model of the non-isothermal flow of carbon dioxide in wellbores. In Proceedings of the SPE California Regional Meeting, San Francisco, CA, USA, 24–26 March 1982. [Google Scholar]
- Gupta, A.P.; Langlinais, J. Feasibility of supercritical carbon dioxide as a drilling fluid for deep underbalanced drilling operating. In Proceedings of the SPE Annual Technical Conference and Exhibition, Dallas, TX, USA, 9–12 October 2005. [Google Scholar]
- Al-Adwani, F.; Langlinais, J.; Hughes, R. Modeling of an underbalanced-drilling operation using supercritical carbon dioxide. SPE Prod. Facil. 2009, 24, 599–610. [Google Scholar] [CrossRef]
- Wang, H.; Shen, Z.; Li, G. A wellbore flow model of coiled tubing drilling with supercritical carbon dioxide. Energy Sources Part A 2012, 34, 1347–1362. [Google Scholar] [CrossRef]
- Wang, Z.; Sun, B.; Sun, X.; Li, H.; Wang, J. Phase state variations for supercritical carbon dioxide drilling. Greenh. Gases Sci. Technol. 2016, 6, 83–93. [Google Scholar] [CrossRef]
- Lindeberg, E. Modelling pressure and temperature profile in a CO2 injection well. Energy Procedia 2011, 4, 3935–3941. [Google Scholar] [CrossRef]
- Song, W.; Ni, H.; Wang, R.; Sun, B.; Shen, Z. Pressure transmission in the tubing of supercritical carbon dioxide fracturing. J. CO2 Util. 2017, 21, 467–472. [Google Scholar] [CrossRef]
- Anderson, J.D.; Wendt, J. Computational Fluid Dynamics; McGraw-Hill: New York, NY, USA, 1995. [Google Scholar]
- Wang, Z.; Sun, B.; Wang, J.; Hou, L. Experimental study on the friction coefficient of supercritical carbon dioxide in pipes. Int. J. Greenh. Gas Control 2014, 25, 151–161. [Google Scholar] [CrossRef]
- Span, R.; Wagner, W. A New Equation of State for Carbon Dioxide Covering the Fluid Region from the Triple-point Temperature to 1100 K at Pressures up to 800 MPa. J. Phys. Chem. Ref. Data 1996, 25, 1509–1596. [Google Scholar] [CrossRef]
- Vesovic, A.; Wakeham, W.A. The transport properties of carbon dioxide. J. Phys. Chem. Ref. Data 1990, 19, 763–808. [Google Scholar] [CrossRef]
- Fenghour, A.; Wakeham, W.A. The viscosity of carbon dioxide. J. Phys. Chem. Ref. Data 1998, 27, 31–44. [Google Scholar] [CrossRef]
- Hasan, A.R.; Kabir, C.S. Heat transfer during two-Phase flow in Wellbores; Part I—Formation temperature. In Proceedings of the SPE Annual Technical Conference and Exhibition, Dallas, TX, USA, 6–9 October 1991. [Google Scholar]
- Dittus, F.W.; Boelter, L.M.K. Heat transfer in automobile radiator of the tubular type. Int. Commun. Heat Mass Transf. 1930, 12, 3–22. [Google Scholar] [CrossRef]
Figure 1.
(a) Fracturing curve of CO2 fracturing; (b) fracturing curve of traditional hydraulic fracturing.
Figure 1.
(a) Fracturing curve of CO2 fracturing; (b) fracturing curve of traditional hydraulic fracturing.
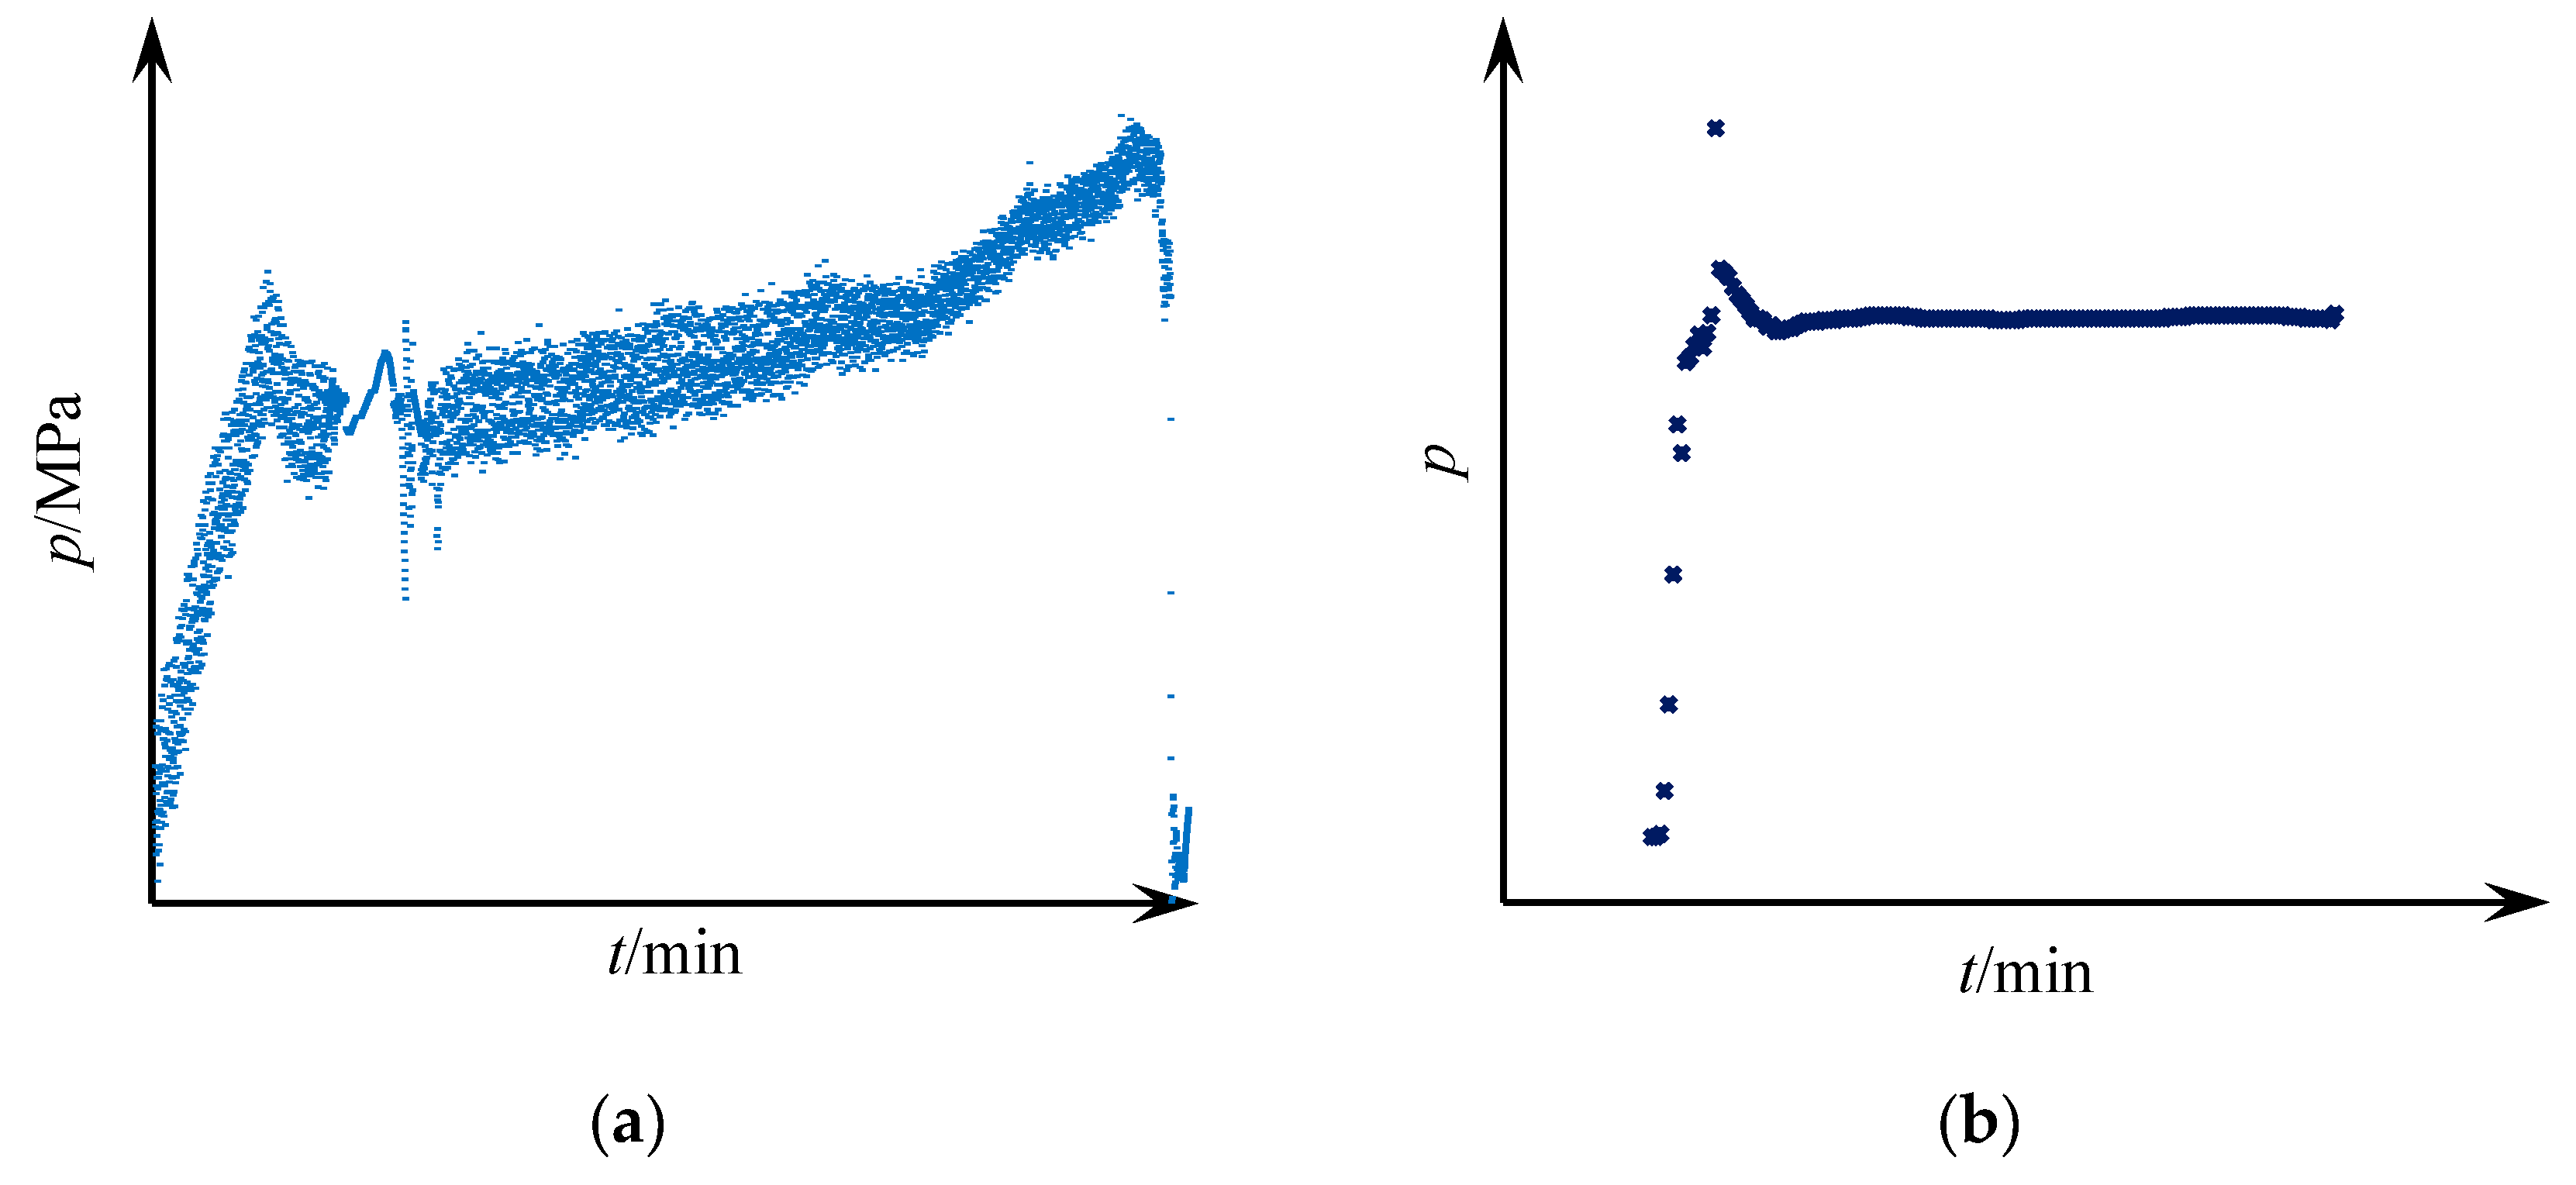
Figure 2.
A finite element in wellbore.
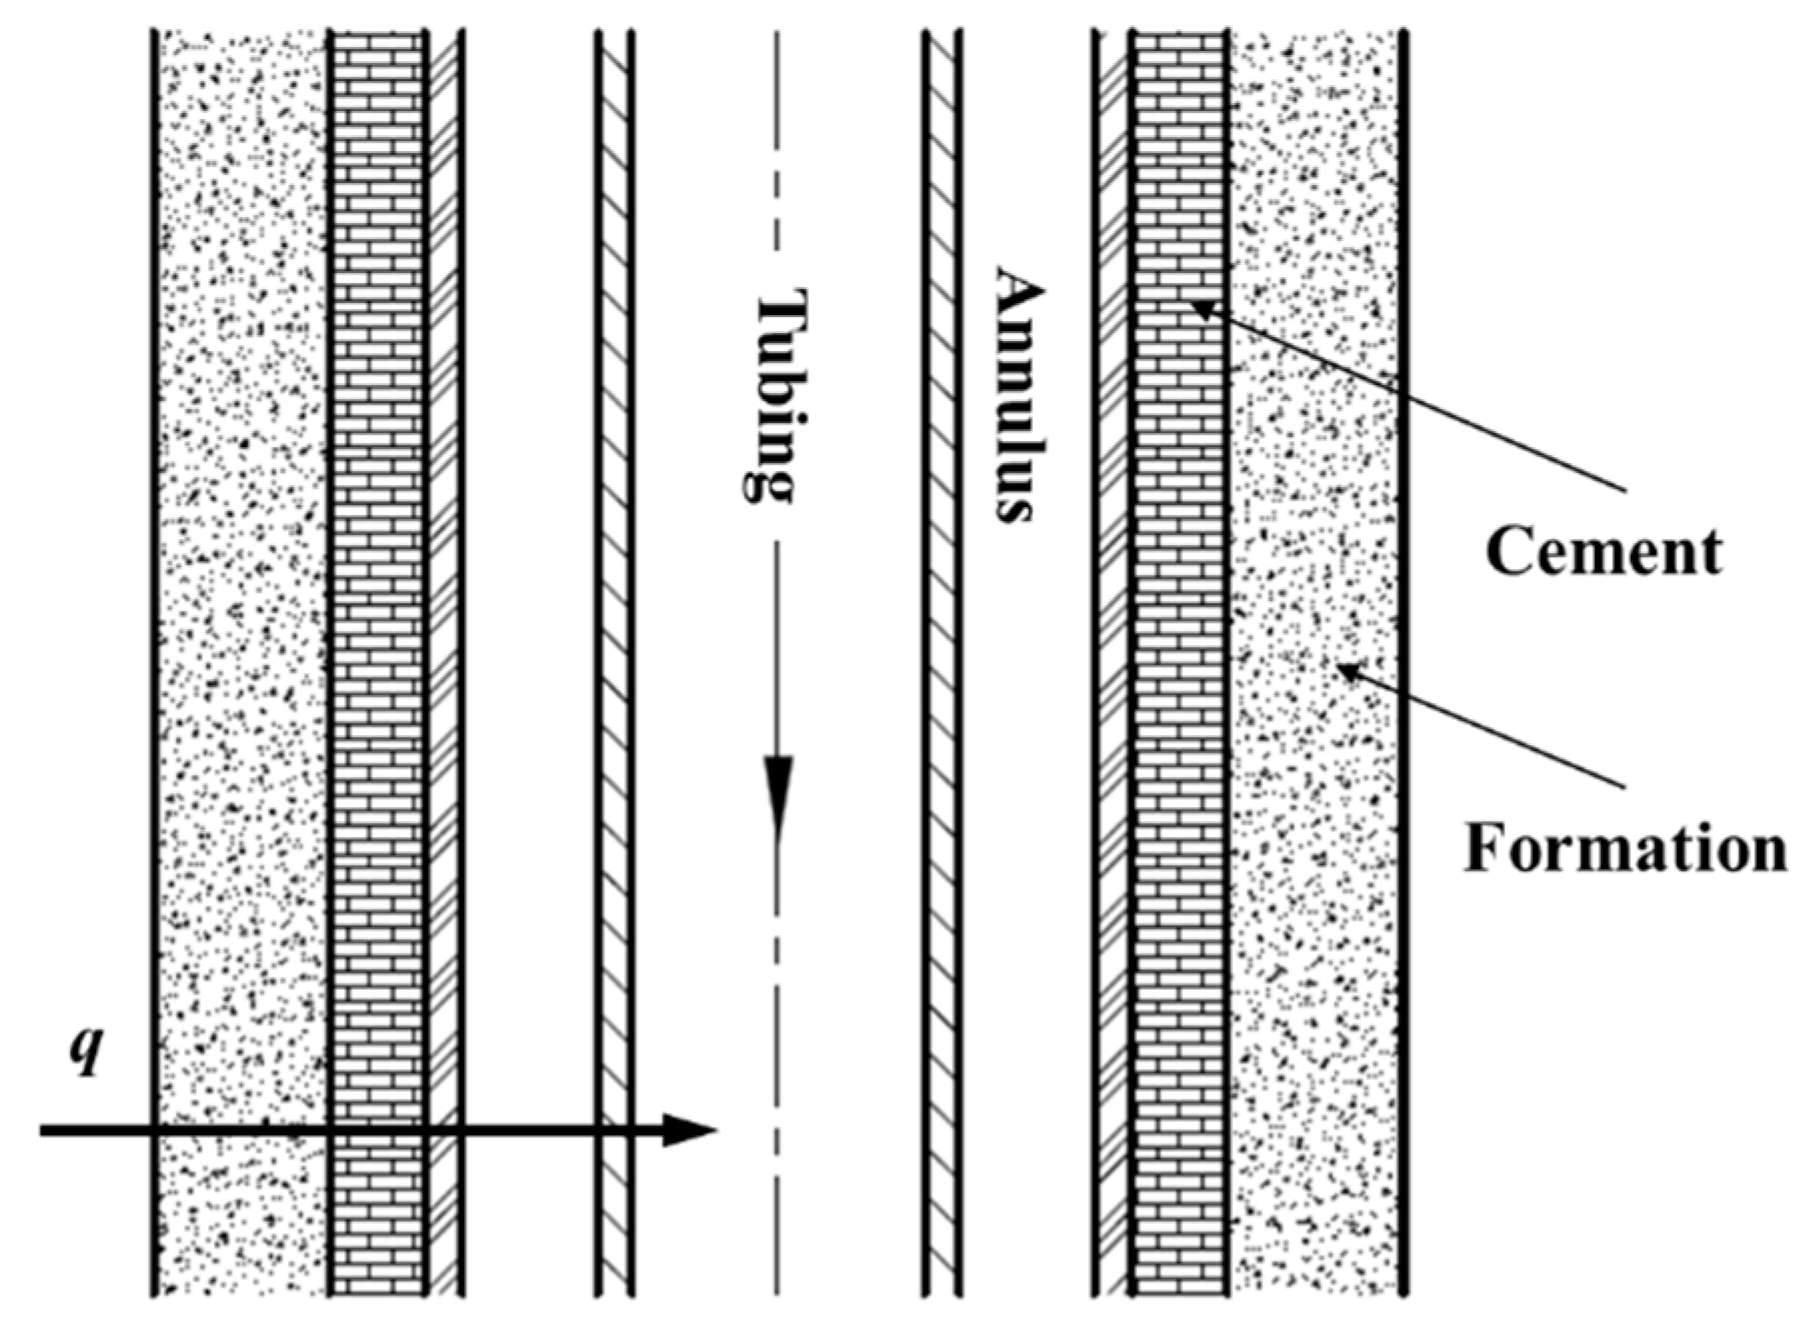
Figure 3.
Wellbore configuration chart.

Figure 4.
Curve of measured data at bottom hole during CO2 fracturing.
Figure 5.
Pressure distribution under different displacement.
Figure 6.
Temperature distribution under different displacement.
Figure 7.
Bottom hole pressure and temperature under different displacement.
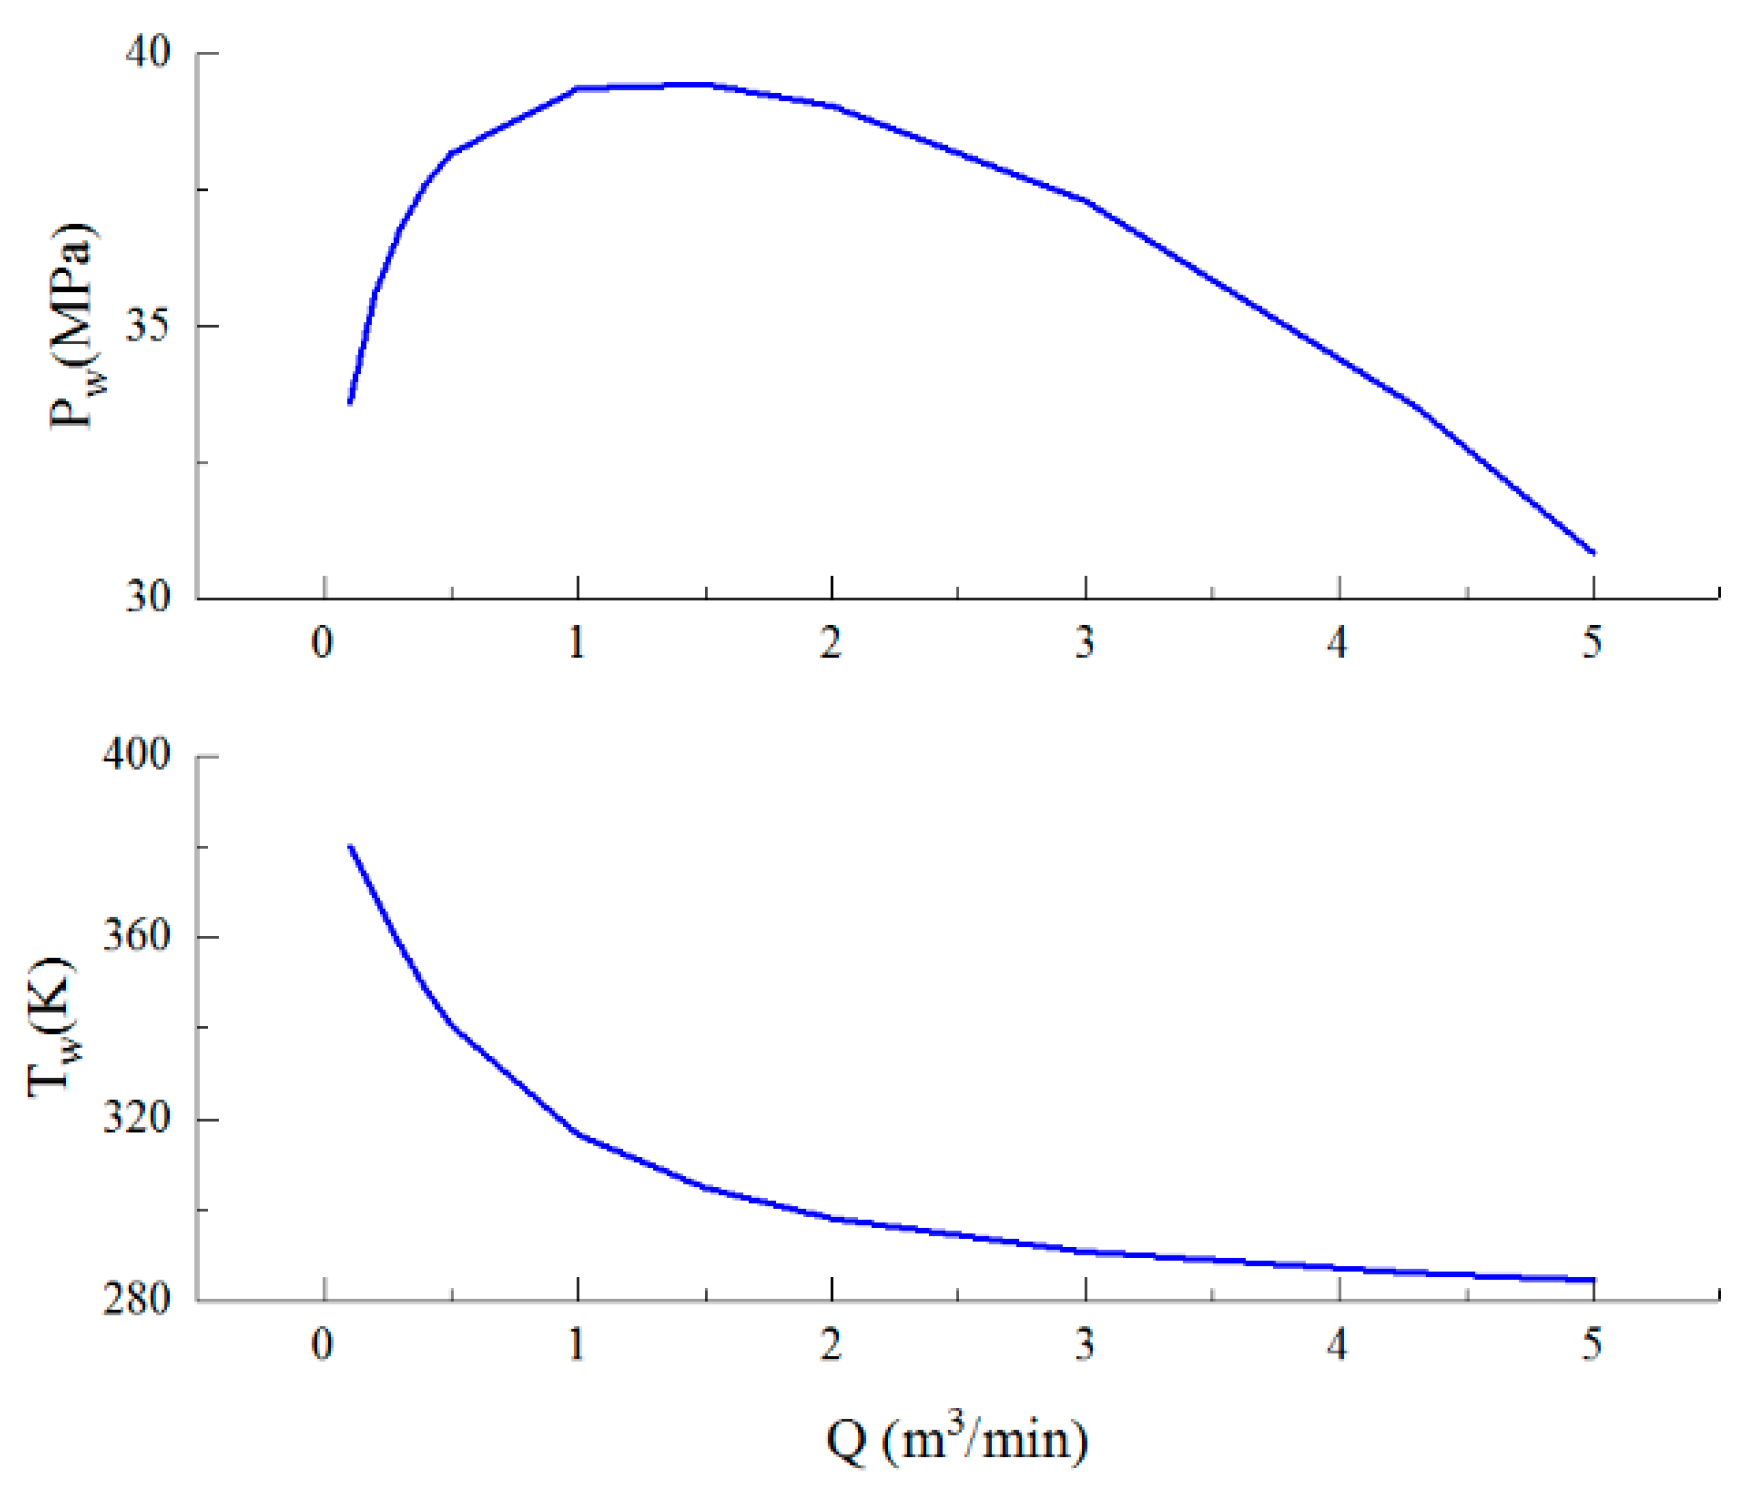
Figure 8.
CO2 phase distribution in the wellbore.
Figure 9.
Density profile in the wellbore.

Figure 10.
Viscosity profile in the wellbore.
Figure 11.
Effect of injection temperature: (a) CO2 pressure profile; (b) CO2 temperature profile.
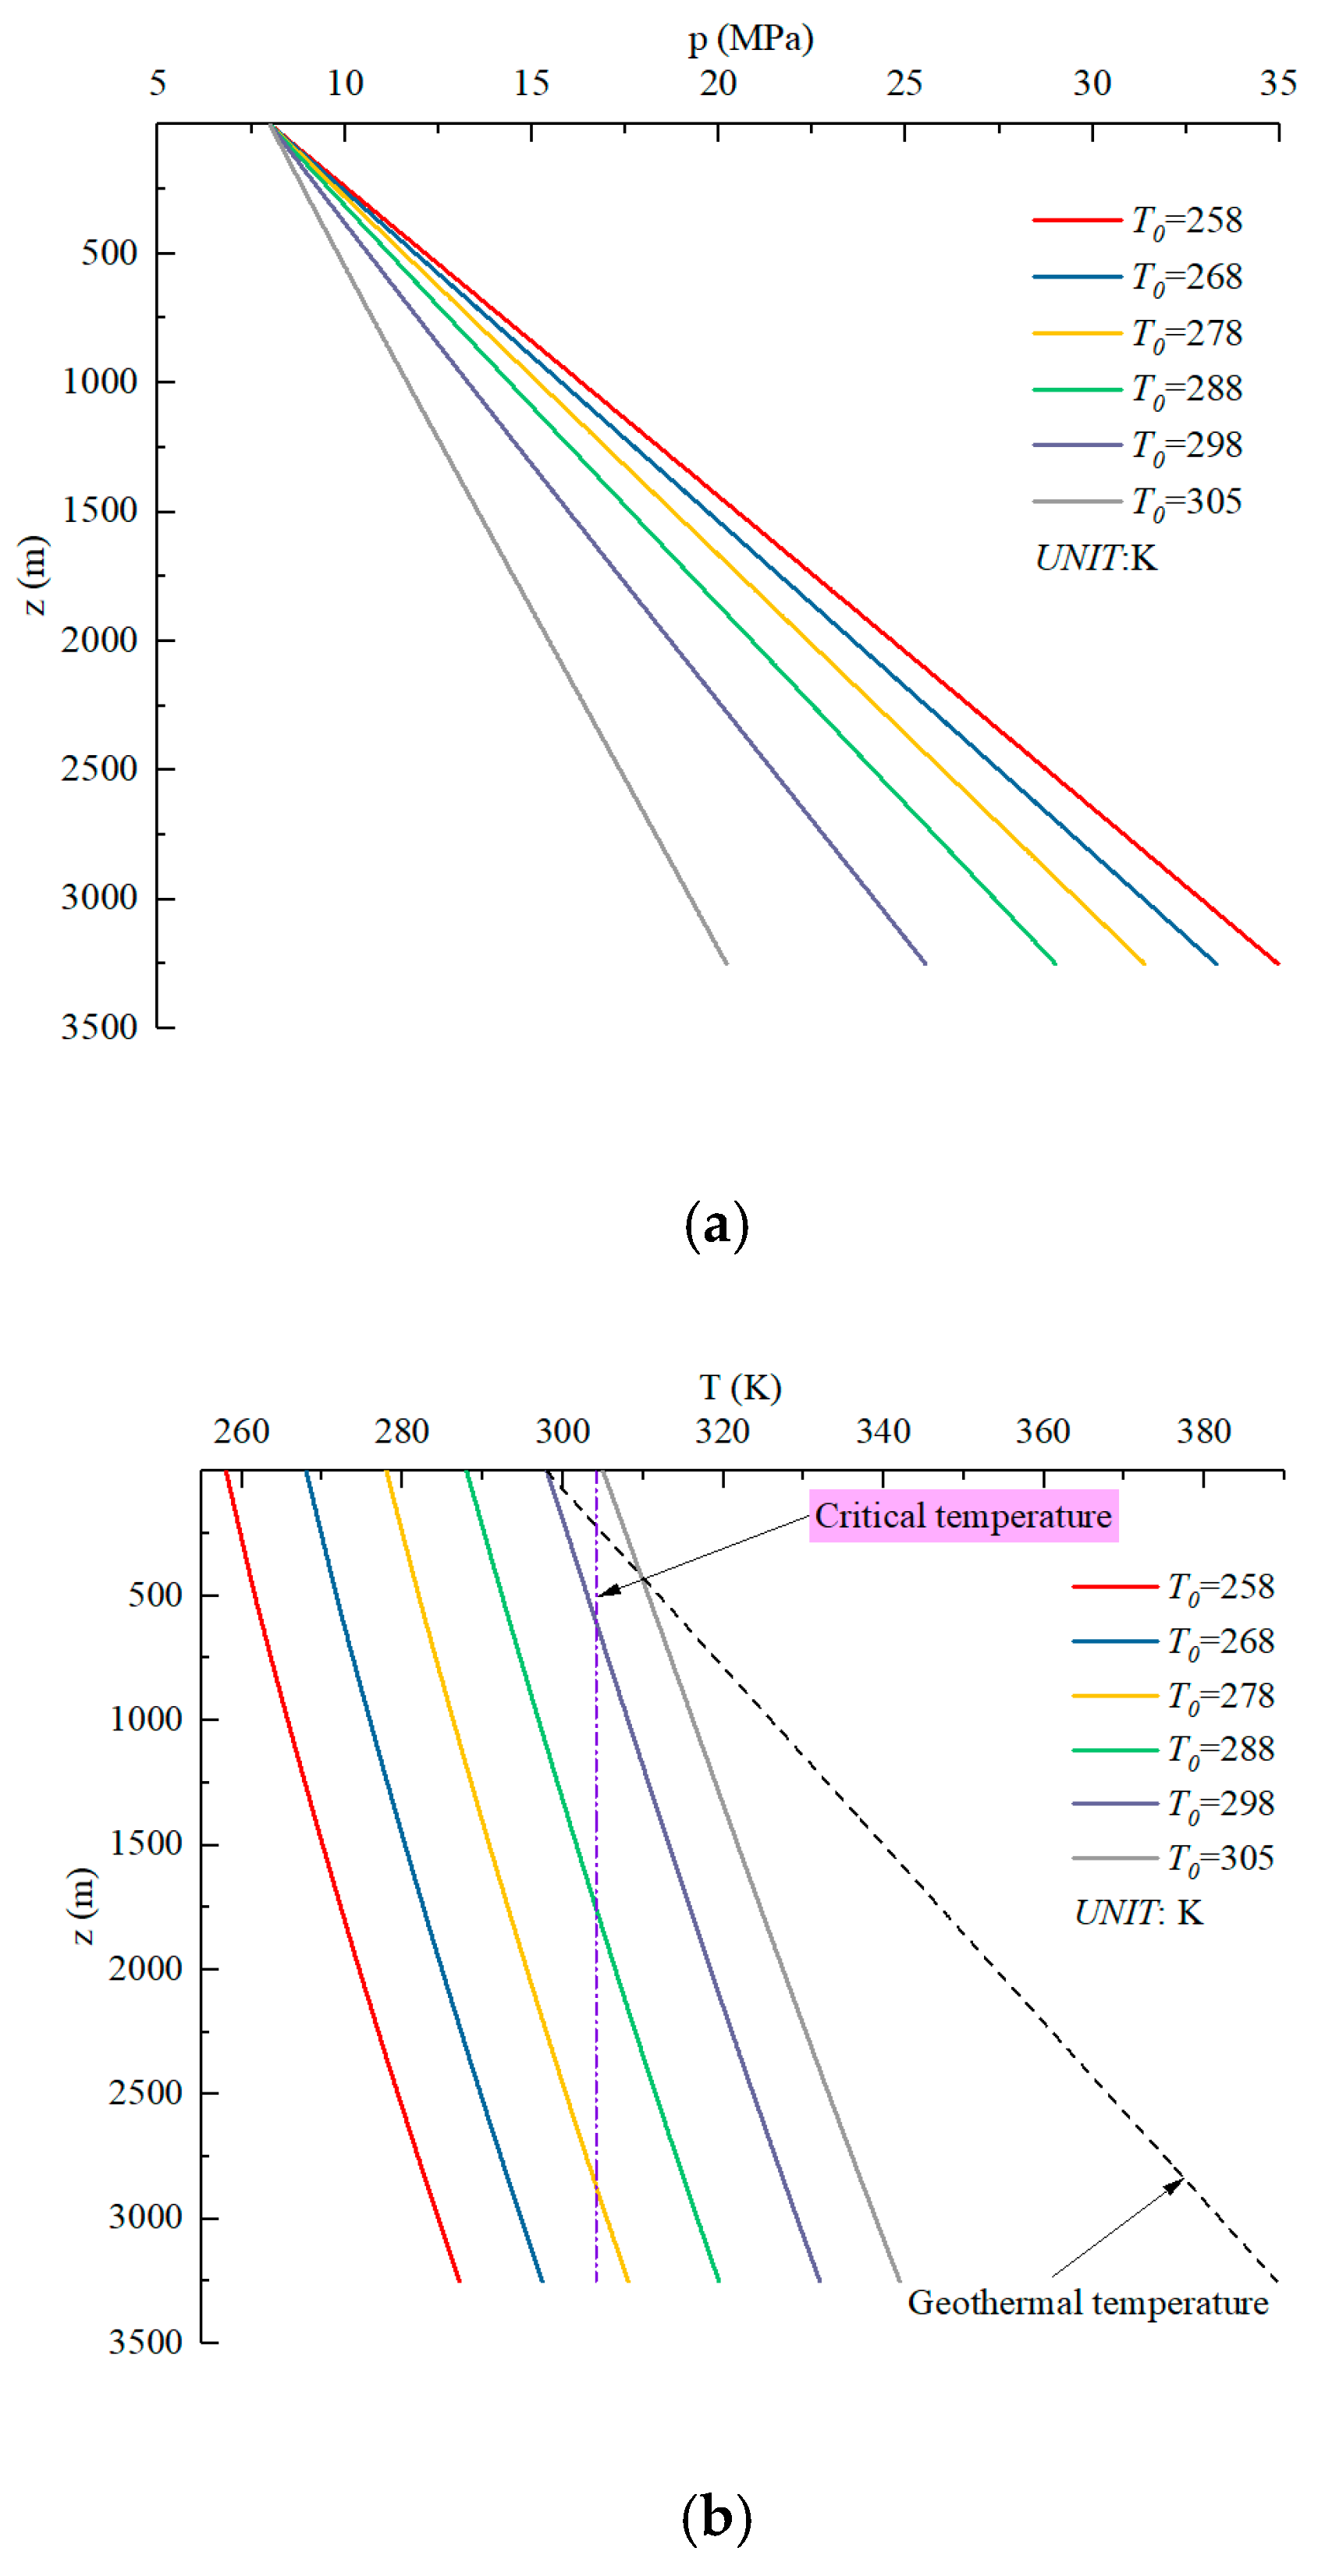
Figure 12.
Effect of injection pressure: (a) CO2 pressure profile; (b) CO2 temperature profile.

Figure 13.
Effect of geothermal gradient: (a) CO2 pressure profile; (b) CO2 temperature profile.

Table 1.
Basic parameters for the model.
| No. | Variables | Symbol | Value | Unit |
|---|---|---|---|---|
| 1 | Well depth | H | 3250 | m |
| 2 | Borehole diameter | dw | 0.121 | m |
| 3 | Formation pore pressure | ppo | 28.16 | MPa |
| 4 | Surface temperature | Teo | 298 | K |
| 5 | Injection temperature | T0 | 258 | K |
| 6 | Injection pressure | p0 | 8 | MPa |
| 7 | Geothermal gradient | G | 2.8 | K/100m |
| 8 | Initial breakdown pressure | pf | 66.02 | MPa |
| 9 | Initial formation compressible strength | σc | 135.077 | MPa |
| 10 | Tensile strength | σt | σc/12 | MPa |
| 11 | Initial elastic modulus | E | 18.7070 | GPa |
| 12 | Thermal expansion coefficient of rock | σm | 3 × 10⁻⁵ | K−1 |
| 13 | Initial Poisson ratio | ν | 0.242 | - |
| 14 | Porosity | φ | 0.05 | - |
| 15 | Maximum horizontal in situ stress gradient | σH | 1.9 | g/cm3 |
| 16 | Minimum horizontal in situ stress gradient | σh | 1.45 | g/cm3 |
| 17 | Overburden gradient | σv | 2.3 | g/cm3 |
| 18 | Biot’s parameter | α | 1.0 | - |
Table 2.
Model validation of wellbore flow model (injection pressure is 26.21MPa).
| Q (m3/min) | Comparison Items | Measured Values | Calculated Values | Error (%) |
|---|---|---|---|---|
| 4.0 | Bottom hole temperature (K) | 288.75 | 287.10 | 0.57 |
| Bottom hole pressure (MPa) | 52.81 | 53.22 | 0.78 |
© 2019 by the authors. Licensee MDPI, Basel, Switzerland. This article is an open access article distributed under the terms and conditions of the Creative Commons Attribution (CC BY) license (http://creativecommons.org/licenses/by/4.0/).
Share and Cite
MDPI and ACS Style
Bai, J.; Xiao, C.; Mu, C.; Zheng, L. Study on the Wellbore Flow for Carbon Dioxide Fracturing. Appl. Sci. 2019, 9, 1864. https://doi.org/10.3390/app9091864
AMA Style
Bai J, Xiao C, Mu C, Zheng L. Study on the Wellbore Flow for Carbon Dioxide Fracturing. Applied Sciences. 2019; 9(9):1864. https://doi.org/10.3390/app9091864
Chicago/Turabian StyleBai, Jianwen, Caiyun Xiao, Chunguo Mu, and Lihui Zheng. 2019. "Study on the Wellbore Flow for Carbon Dioxide Fracturing" Applied Sciences 9, no. 9: 1864. https://doi.org/10.3390/app9091864
Note that from the first issue of 2016, this journal uses article numbers instead of page numbers. See further details here.