Article

Assessment of Energy Saving Potential by Replacing Conventional Materials by Cross Laminated Timber (CLT)—A Case Study of Office Buildings in China

1
School of Architecture, Harbin Institute of Technology, Harbin 150001, China
2
Key Laboratory of Cold Region Urban and Rural Human Settlement Environment Science, Ministry of Industry and Information Technology, Harbin 150001, China
*
Author to whom correspondence should be addressed.
Appl. Sci. 2019, 9(5), 858; https://doi.org/10.3390/app9050858
Submission received: 30 January 2019 / Revised: 11 February 2019 / Accepted: 22 February 2019 / Published: 27 February 2019
(This article belongs to the Special Issue Zero-Energy Buildings)

Abstract

:
This research evaluates the operational heating and cooling energy consumption of cross-laminated timber (CLT) office buildings in China. The evaluations involve a comparison of the energy consumption of a reference RC structure and CLT system office buildings. Computational simulation results are based on IES-VE 2019 and show that the estimated heating energy saving ratio of CLT buildings in Harbin, Beijing, Shanghai, and Kunming to the reference structure are 11.97%, 22.11%, 30.94%, and 23.30% respectively. However, the CLT buildings consume more energy for cooling in the summer. The results of the research show significantly higher heating energy reductions for CLT buildings in the Cold Region and Severe Cold Regions of China. Thus, the application of the CLT system is better suited to northern China than southern China. The results of the research can be used in further assessment of the use of CLT systems in different climatic regions in China.

1. Introduction

Energy demand has increased significantly across the globe over the last decades and the building industry is a notable contributor to this increased energy consumption [1]. Energy used in the building industry accounts for approximately 33% of final energy demand and one-third of energy-related CO2 emissions across the globe [2]. 23% of global primary energy and 30% of global electricity are required for activities related to the building industry [3]. The International Energy Agency (IEA) reports that energy demand in the building industry would grow by around 50% in 2050 in comparison to 2013 if there are no additional controls applied [4]. Urge-Vorsatz also suggests that energy consumption in existing buildings will grow by 110% in 2050 when compared with 2013. Increased energy consumption has led to an increase in the combustion of the fossil fuels, which directly increases Green House Gas (GHG) emissions. These GHG have an impact on climate change and contribute to global warming.
When considering this together with the significant increase in energy consumption by the global building industry, GHG emissions from buildings will increase by over 200% from 2013 to 2033 if nothing is done [5]. It is clear that decision-makers must focus on emissions from the building sector in order to meet GHG reduction targets, and this should be the cornerstone of every national climate change strategy [5].

1.1. Energy Consumption and Carbon Emissions in the Building Sector Worldwide

Energy use in the building industry contributes to a large proportion of overall energy use in developed countries. Building energy consumption in the EU was 37% of final energy in 2004, and increasing at a rate of 1.5% per annum [6]. Energy use in commercial and residential buildings accounts for 40% of primary energy consumption and is responsible for 24% of GHG emissions [7]. Energy use in the building industry accounted for 39% of overall energy use in the UK in 2004 and the proportion has been increasing annually at a rate of 0.5% since then [6]. The situation with energy consumption in the building industry in other European countries is broadly similar to that in the UK. The energy consumption of the building industry in Spain in 2004 was 23% of total energy use, and the energy demand in the building industry has continued to increase at rate of 4.2% annually [6]. Materials in the construction industry are responsible for 50% of total waste in Germany [8].
Energy consumption in the building sector accounts for 46% of total energy consumption in France [9]. The Department of Energy (DOE) in the United States announced that 41% of primary energy is consumed in the building sector, compared to 30% in the industrial sector and 29% in the transportation sector, whilst the latter are generally considered to be the two major areas of energy consumption [10]. The DOE also reports that building energy consumption is increasing at a rate of 1.9% annually [6]. When considering global energy consumption by the building industry, the energy consumption relating to non-domestic buildings accounts for a huge proportion of the energy use of human activities [11]. The global energy consumption of non-domestic buildings exceeded 1 billion tonnes of coal equivalent (TCE) in 2009 which accounted for 11.4% of total energy consumption in that year [11]. The DOE reported that 46% of energy was consumed in non-domestic buildings in the USA in 2012 [10]. A similar situation has been identified in the UK by the Department of Communities and Local Government (DCLG). According to a survey conducted by the DCLG, non-domestic buildings are responsible for approximately 20% of the UK’s energy consumption and carbon emissions [12]. Separate research conducted by Chaudhary shows that energy consumptions in non-domestic buildings is more dominant in urban areas than in other areas in the UK [13]. The energy consumption of non-domestic buildings is also a major contributor to total energy use in other European countries. According Eurostat data published in 2016, the energy consumption from domestic buildings in the EU reduced by 6.51% in 2012 in comparison with 1996 levels, while the energy demand from non-domestic buildings increased by 15.7% over the same period.
Among non-domestic buildings, office buildings and retail buildings were the most energy intensive building types and these accounted for over 50% of the total energy consumption of non-domestic buildings in USA, Spain and the UK in 2003 [6]. In the USA, the floor area of office buildings was 17% of the total area of non-domestic buildings and the energy consumption of office buildings was approximately 18% of the overall energy use in non-domestic buildings in 2003. The energy consumption in office buildings accounted for 3.2% of the total consumption in the USA in 2003 [6]. The proportion of energy consumption in office buildings in Spain was notably higher than in the USA, with office buildings accounting for approximately 33% of overall energy use in non-domestic buildings. However, this was 2.7% of the total energy consumption in Spain which is broadly similar to the proportion in the USA. In the UK, the energy consumption of office buildings was about 17% of the energy use in non-domestic buildings and this accounted for 2% of the total consumption in 2003 [6].
The European Union is focused on limiting building environmental impact and advocates the technology innovation towards nearly zero energy buildings (NZEB). Specific policy actions including the Energy Performance of Buildings (EPBD) Directive, the Energy Efficiency Directive (EED) and the Renewable Energy Directive (RED) are issued. Researchers also continue to promote the development of NZEB. Delia et al. made research on how to best achieve the NZEB design at the lowest cost in 14 locations across Europe. Their results revealed that how the cost-optimal measures varied with climate and pointed out that a source energy reduction of 90% and beyond was feasible for new constructions in all locations [14]. Panagiotis et al. studied the Embodied energy in residential buildings-towards the NZEB and pointed out that the share of embodied energy dominated, mainly in low energy and nearly zero energy buildings, with a share of 26–57% and 74–100% respectively [15]. Jamie et al. focused on the lifecycle environmental and economic performance of NZEB in Ireland and pointed out that high thermal and air tightness were crucial technologies to achieve a NZEB standard [16]. Hamdy et al. put forward a computational method with six comparison criteria that compared performance of seven commonly-used multi-objective evolutionary optimization algorithms in solving the design problem of the nearly zero energy building [17].

1.2. Energy Consumption of Building Industries in China

In 2009, China became the largest energy consumer in the world [13]. One of the most significant contributors to this energy consumption was the urbanization process in China. The total built area in China increased from 35.2 billion m2 in 2000 to 63.6 billion m2 in 2015, representing an increase in the urban area of both residential and commercial buildings of over 200% in this period. This rapid process of urbanization in China resulting in similar growth in the energy demands of the building industry [18]. The energy consumption of the building industry was 27.5% of total energy consumption in China in 2009 [19]. In 2015, the operational energy of buildings exceeded 857 million tons of coal equivalent (TCE) which represents 20% of the total energy consumption in China in that year [1]. Building energy consumption increased by a factor of 1.7 in 2014 from the level in China in 2000 [20] and this energy consumption is estimated to increase further and to reach 35% of the total energy consumption in China by 2020 [21].
In China, energy consumption from public buildings is 341 TCE, accounting for 40% of the energy consumption of civil buildings although these buildings occupy just 18% of the total built area. This presents a great opportunity for energy conservation to improve the energy performance of existing buildings, particularly public buildings [1]. In 2014, the Building Energy Research Centre in Tsinghua University (THUBERC) reported that the energy use of China’s public and commercial (P&C) buildings accounted for 28.7% of total building energy use. The increase in floor area and energy demand by large-scale buildings results in substantial growth of energy consumption by P&C buildings [18]. Minda indicates that the energy intensity of commercial buildings in China increased by approximately four times more than that of residential buildings from 2000 to 2015 [19].
THUBERC also reported that the energy consumption in office buildings is approximately 25% of that of the non-domestic building sector in China which is notably higher than ratio for office buildings in the UK and the USA [20]. This is due to the rapid urbanization in China accompanied by a rapid increase in the area of office buildings due to the economic growth. The floor area ratio of office buildings to other building types in China is different from that in the UK and the USA.
THUBERC states that office developments have grown rapidly, with a total area of 890 million m2 at the end of 2007, accounting for 17.1% of the total area of public buildings and 24.1% of the total electricity consumption in public buildings. From 2001 to 2015, the area of new buildings is over 15 billion m2 every year. The area of new residential buildings accounts for 64% of new buildings and commercial buildings account for 36%, with office buildings taking the largest proportion of the latter [21]. Until 2016, the number of new office buildings was increasing constantly. In addition, air-condition installations and the utilization ratio in office buildings are much higher than in residential buildings because of the higher thermal comfort levels required and the increasing demand for environmental comfort [22]. In 2009, the existing stock of Chinese urban office buildings was 6.1 billion m2, an increase of 38.64% over 1994 [23]. As the energy consumption in office buildings is a major component of building energy consumption, the MOHURD has focused on this issue since 2009 and promulgated the Energy Conservation Law and Civil Building Energy Conservation Regulations in that year [24]. The regulation is committed to improve the energy efficiency levels of office buildings by 50% over the level in 2000 [24].

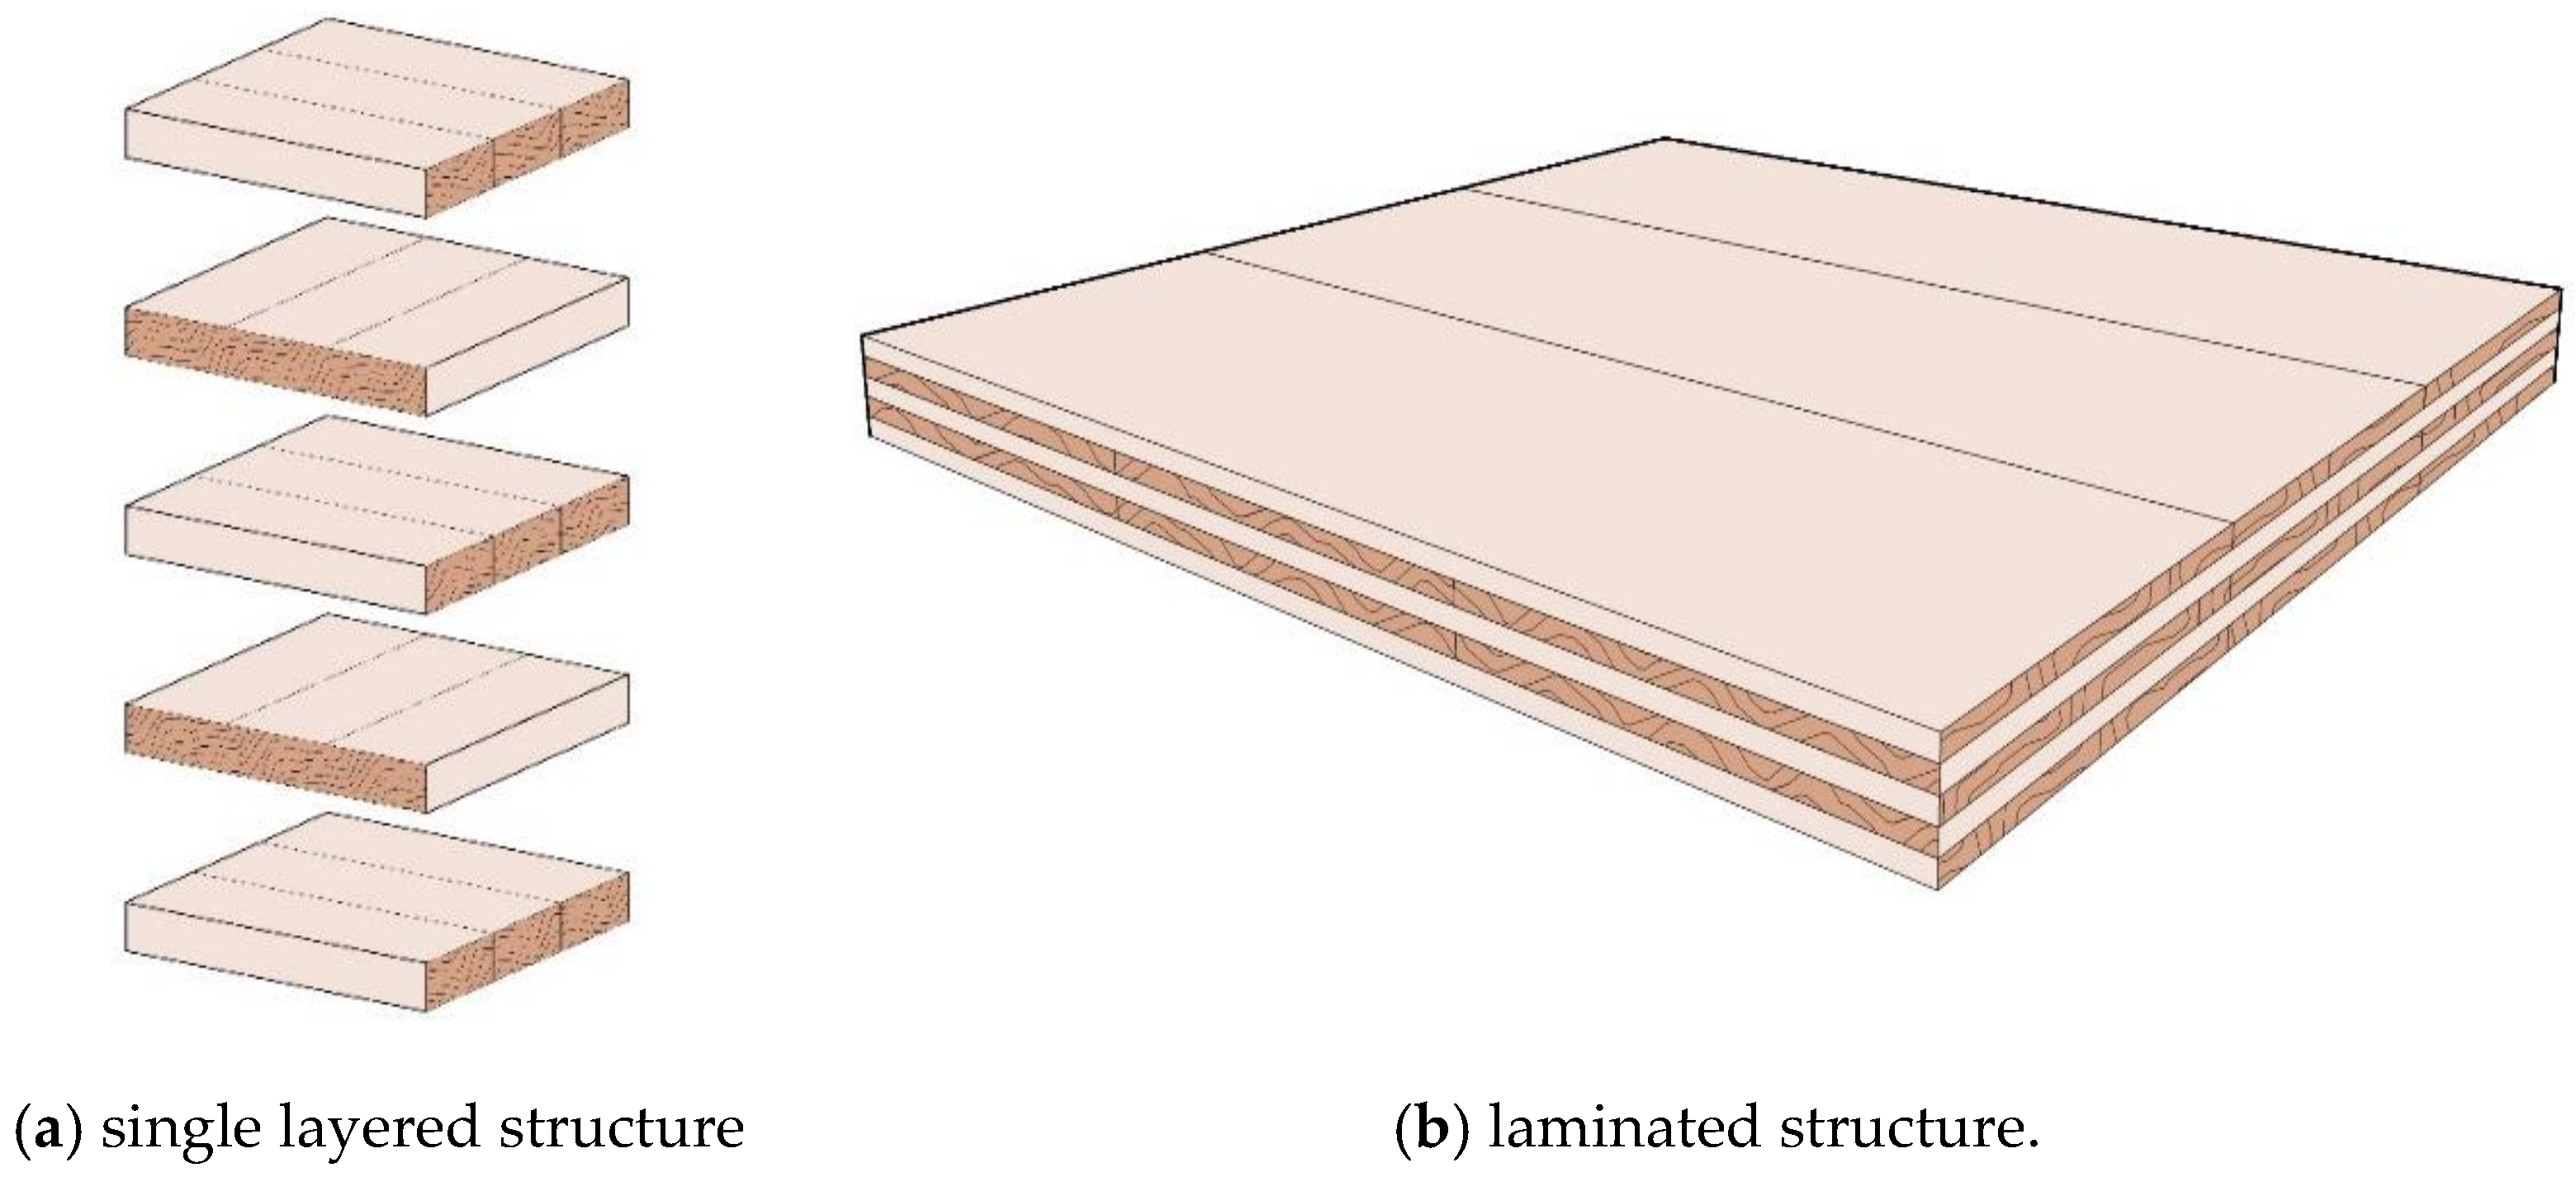
1.3. Cross Laminated Timber (CLT) and Its Development as a Sustainable Material

With increasing global concern about energy consumption in the building industry, timber-based buildings are becoming more sought after as a type of sustainable building. Unlike most conventional building materials, timber has four major advantages that make it a superior building material: First, of all, since wood is a sustainable and renewable material, timber products generate less pollution [25]. Secondly, timber is a natural material which absorbs CO2 as trees grew. When timber is used in building construction, the absorbed CO2 is sequestered from the environment. This carbon sequestration property enables this building material to have a lower environmental impact in Life Cycle Assessment (LCA) [26]. Thirdly, most modern timber buildings consist of prefabricated building components that are manufactured in factories [27]. This prefabrication process has shorter on-site construction periods and better control of energy consumption during the construction phase [27]. Fourthly, timber buildings are more lightweight and flexible than steel, concrete and masonry buildings [28,29,30]. Timber buildings weigh 50% less than concrete constructions [31]. As timber has a high strength-to-weight ratio [25], the use of timber can reduce the structural weight of buildings and therefore reduce the structural expense of buildings in seismic-prone areas [32].

1.3.1. History and Basic Information of CLT

As a novel material on the building market, cross-laminated timber (CLT) was first produced in Central Europe in the 1900s [33]. The CLT patent was first registered in 1985 in France, and was propagated widely in the 1990s in Germany and Austria [34], but other European countries did not appear to take it up [25]. Although lacking detailed regulation, the material was utilized in several new applications in architecture and structural engineering with the development of CLT structural technology [35]. Following the widespread use of CLT in the building industry over the last decade, the European Cooperation in Science and Technology (COST) published design codes for buildings with CLT structures in 2018 [33].
CLT is composed of odd number staggered wood layers (usually three, five or seven layers) (Figure 1), for the purpose of achieving structural stability by resisting out of plane loads, with different layers of timber boards are placed in different directions [36]. Due to a lack of unified product standards, CLT panels are produced in various dimensions by different manufacturers. The thickness of a CLT panel can be up to 500 mm. Typical widths are 600, 1200, 2400, and 3000 mm and lengths are typically 18,000 mm or even longer depending on the building project [37]. Due to their high mechanical performance, CLT panels can be used as structural elements in buildings such as load bearing walls, floors, and roofs, and non-load bearing partitions [38]. As the majority of the CLT panels are prefabricated in factories, onsite construction can be completed within 3 to 4 days in some cases [39].

1.3.2. CLT as a Sustainable Building Material

The capital advantage of the CLT construction system is the low environmental impact of the material. In comparison with conventional building materials, CLT is a less energy-intensive construction material. Selamawit et al indicates that the increased usage of multi-layer timber construction may significantly reduce the environmental impact of buildings during their life cycle [40]. Separate research in New Zealand shows that the environment impact of a residential building with a light wooden structure is much less than one with concrete structures. Over the life cycle of the building the total cost of the house with the light wooden construction is 11% [41]. At the end of 20th century, Suzuki et al revealed that the energy consumption of a multi-family house with a concrete structure is around 8–10 GJ/m2 in comparison with approximately 3 GJ/m2 for a wooden structure and 4.5 GJ/m2 for a light-weight steel structure. Research also shows great potential for CO2 reduction achievable by wood structure buildings. The CO2 emissions of houses with a concrete structure are 850 kg/m2, compared with 250 kg/m2 for wooden structures and 450 kg/m2 for light-weight steel structures [42]. Zabalza Bribián shows that one cubic meter laminated wood can absorb 582 kg CO2 in consideration of the reuse of the material. The absorbed atmospheric CO2 is locked in the body of the timber structure. This data can be compared with the CO2 emissions by concrete (458 kg/m3) and steel (12.087 kg/m3) [43]. Upton et al reveal that in the US, the energy consumption of wooden construction is 15–16% less than that of steel or concrete construction, without taking into account heating or cooling energy. The GHG emission of a wood structure is 20 to 50% lower than that of steel or concrete construction over a 100-year life cycle [44]. Hildebrandt et al analyze the future development of timber constructions and related GHG effects in the EU [45]. Their research shows that residential buildings with CLT structures have better material efficiency than conventional building types [45]. The increased use of CLT can lower GHG emissions and increase carbon storage in the building stock [45]. Research by Guo et al. compares the operational energy use of a reference residential building with structures in reinforced concrete and CLT in 31 cities in China. By replacing the concrete by CLT, the energy consumption of the reference building becomes 29.4% lower than that of the conventional structure. A 24.6% reduction in carbon emissions during the operational stage can be achieved when all concrete structures are replaced by CLT [46].
However, CLT construction also has some disadvantages as an energy efficient building material. Due to is low thermal mass and low U values, there is a higher possibility of summer overheating when used instead of conventional materials [47]. Dodoo’s research in Sweden found a higher overheating risk from timber-frame buildings than from concrete-frame buildings in the same climate conditions. This overheating in the building could not be remedied by solar shading or ventilation [48]. Lightweight timber construction is more suitable for regions with milder summer temperatures rather than hot climates. It should be encouraged that the material of the lightweight construction is characterized by high thermal mass, high thermal effectivity [49]. In addition, compared to the lightweight wood construction, CLT system is not efficient enough to carry the lateral forces and to dissipate in seismic activity due to its heavier weight. Specific systems need to be set up when designing the CLT constructions. Simone et al. made a study on the static and dynamic seismic elastic analysis of light timber-frame and CLT multi-story buildings with UNITN model and put forward three methods (VTM, VNA and CAN) for the designers to promote the structure design [50]. Fragiacomo et al. studied on seismic analysis of multi-story CLT buildings and revealed the importance of modeling the flexibility of the connections between the upper and lower panels, which is often neglected by designers and would lead to underestimation of the building vibration period [51].

1.3.3. Applications of CLT in China

The Ministry of Housing and Urban–Rural Development of China (MOHURD) announced the promotion of the application of energy-saving materials in newly built buildings in 2009 [24]. This included strengthening of the quality controls of the materials, increasing the total quantity of the production and process of reuse of the materials [24]. The state of art of building construction is the concrete based frame structure which is not suitable for this governmental policy. Even though the widespread application of CLT as an energy saving material would meet unexpected issues in China, the potential for and interest in the development of CLT has grown significantly over the past decades. Buildings with CLT structures have been produced in some factories and have been adopted in several demonstration projects. Following these demonstration projects, the MOHURD proposed a series of improvements to promote the development of CLT at a national level. In 2017, MOHURD revised the regulations for timber structure buildings (GB/T 51226-2017). The regulations remove the restriction that timber buildings could only be built up to three stories high, which previous limited the application of CLT buildings in China. The revision of this regulation shows the favorable government attitude towards the development of timber buildings in China.

1.4. Study Objective

Due to limited research into the applications of CLT in China, the energy saving potential of the CLT system is not well understood. This research evaluates the energy performance of a reference office building with CLT system and compares the operational energy consumption of the CLT office building with a concrete structure. The evaluations and comparisons mainly focus on the operational heating energy use and the cooling energy use in five different climatic regions in China.

2. Simulation Environment and Studied Buildings

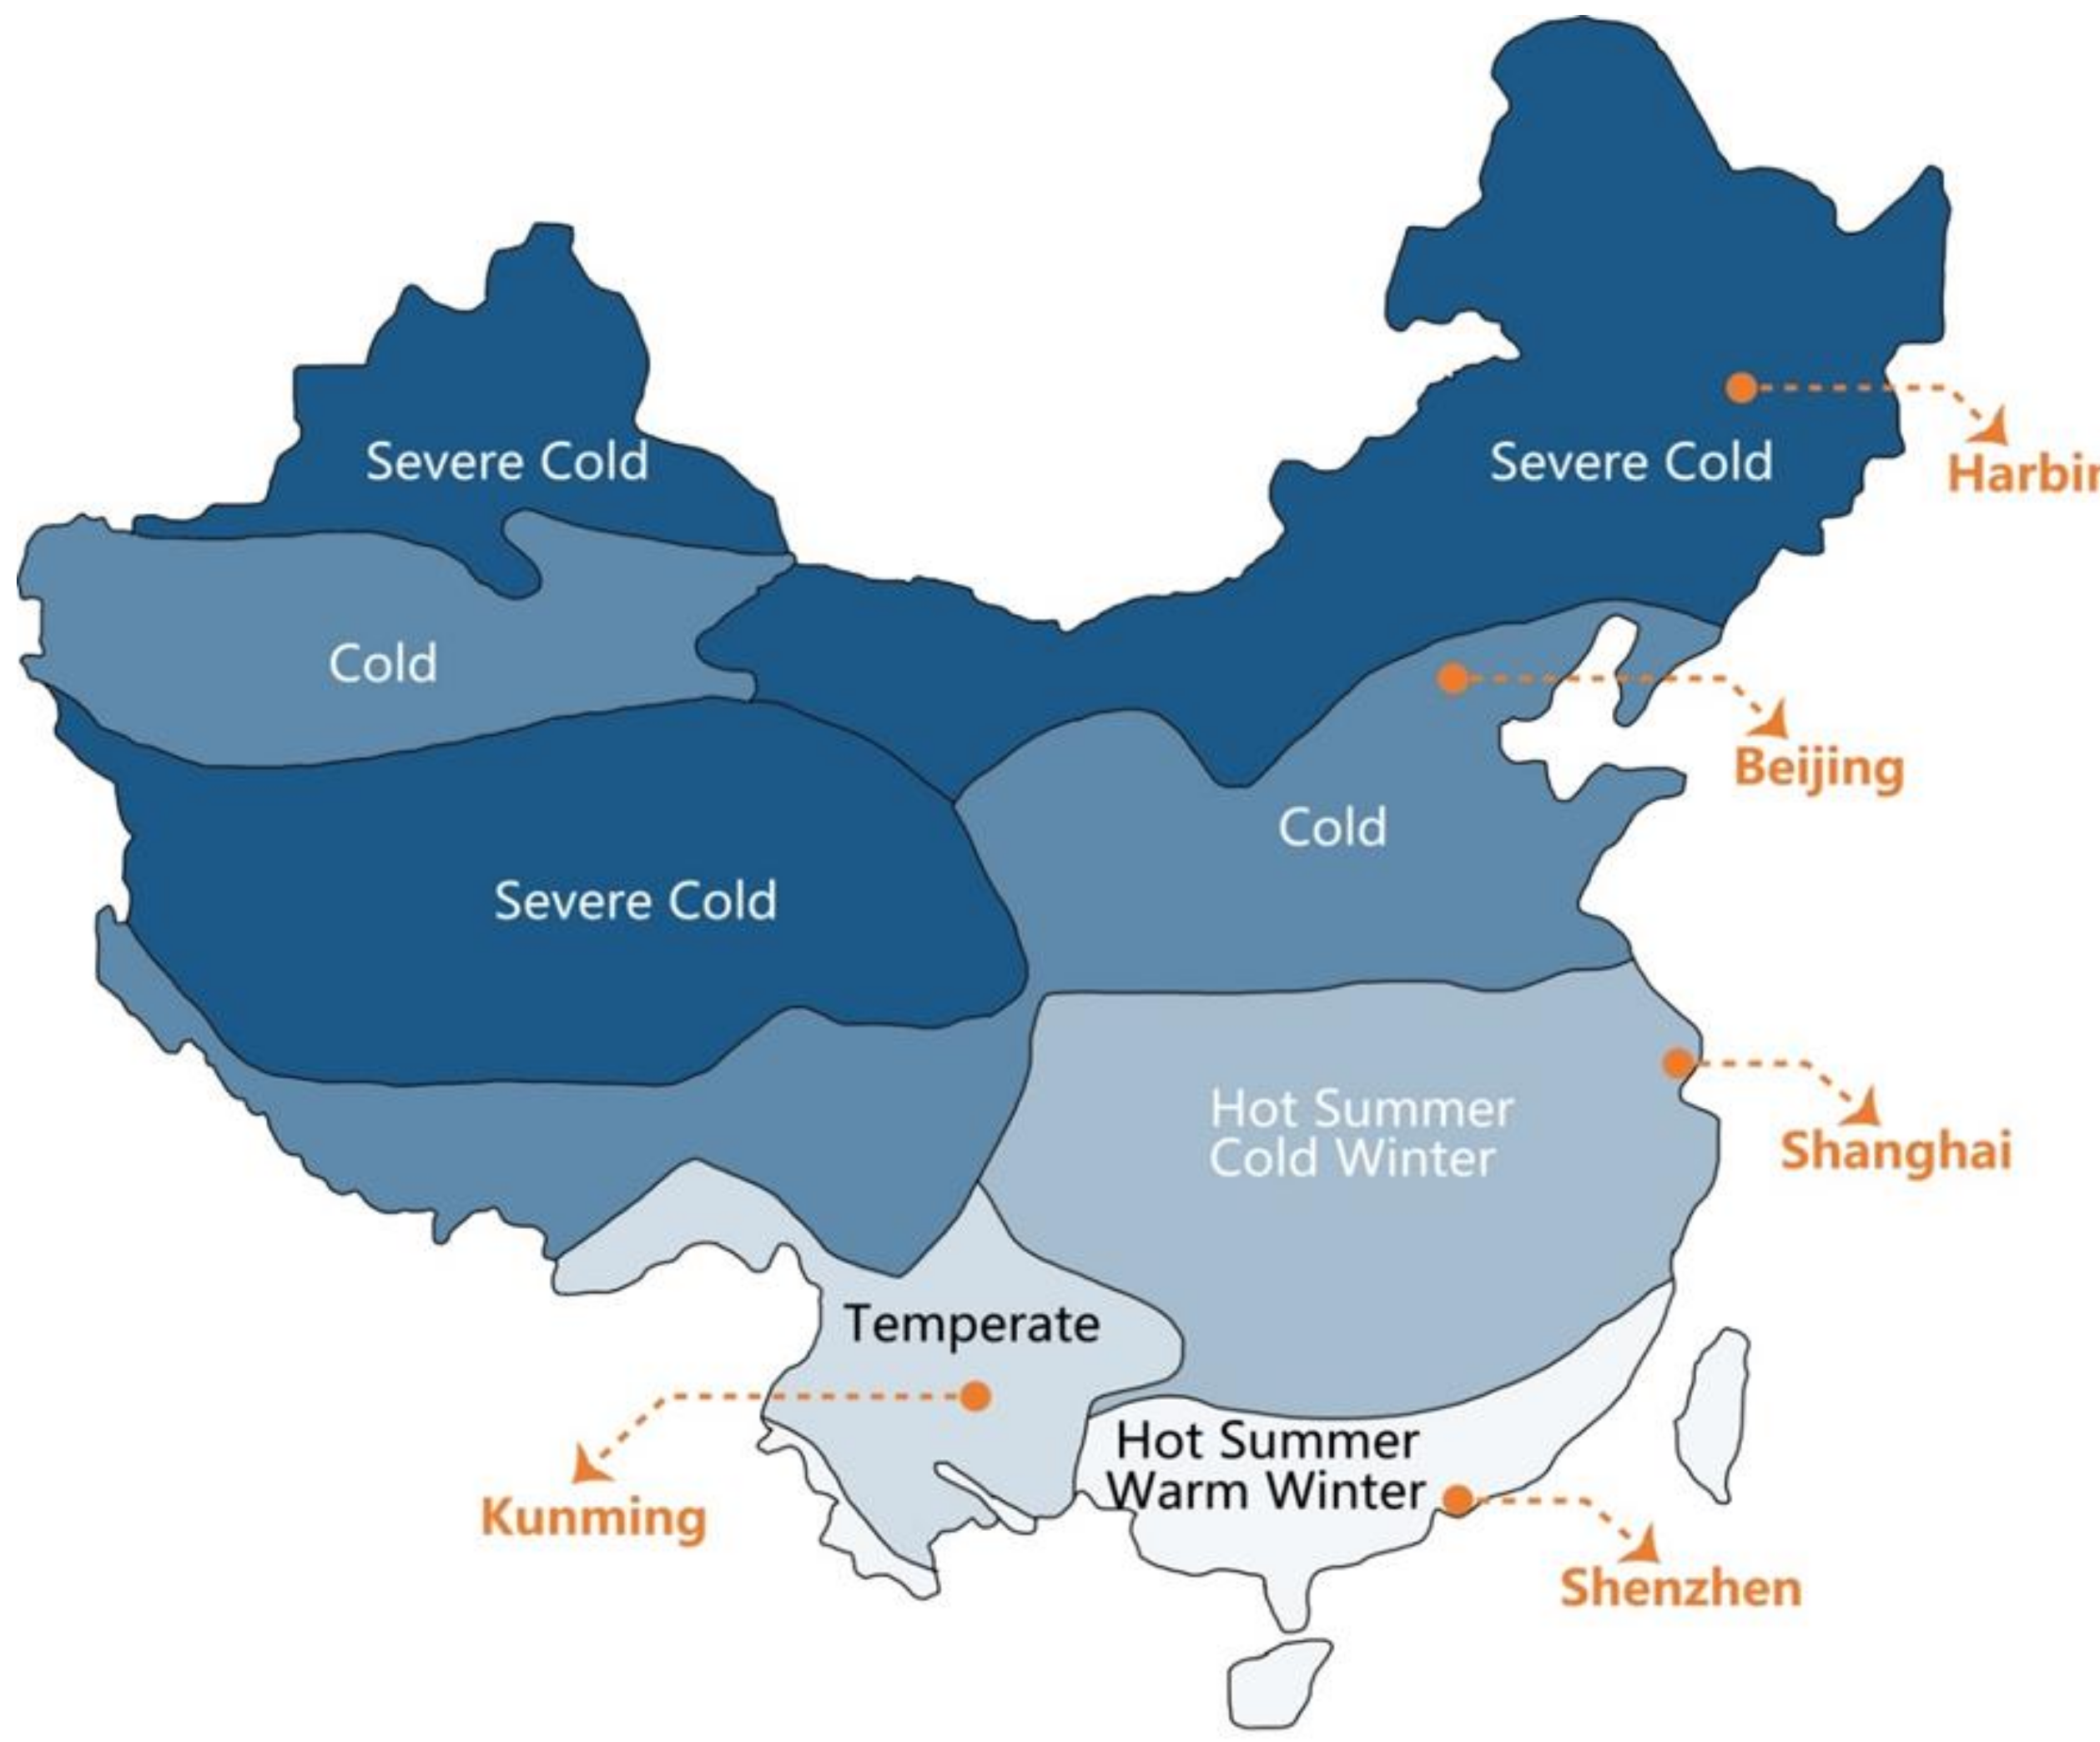
2.1. Climate Zones in China

According to the Code for Design of Civil Buildings (GB 50352-2005), there are five different climate zones in China, namely the Severe Cold Region, Cold Region, Hot-Summer Cold-Winter Region, Hot-Summer Warm-Winter Region, and Temperate Region. The standard also provides for further categorization into A, B, C, and D sub-regions according to the specific geographical location. Buildings in different climate zones have to follow the local regulations which define the structural criteria, the insulation properties for opaque walls floors and roofs, and the thermal and optical performance of windows and skylights. In order to evaluate the energy saving comparison between RC and CLT buildings, five major cities in China are selected as the building simulation environment, each located in different climate zones (Figure 2). The basic climatic data for these cities is presented in Table 1.

2.2. Details of Reinforced Concrete Buildings

For this exercise, an actual office building that has already been constructed in Harbin is selected as the case study building. In order to reflect the actual situation in each climate zone, the structure of the original building is redesigned as necessary to meet the local building regulations. The RC structure designs strictly follow the local Code for Seismic Design of Buildings (GB50011-2010). However, the load-bearing structure and functional organization of the building remains unchanged.
The original building has a total floor area 27529.67 m2 and is a 15-story office building designed for government use as an office. Figure 3 presents the floor plans of the building. It is mainly made up of offices, meeting rooms and related auxiliary space. The total height of the building is 67.8 m and the standard height of each story is 4.2 m. The building has a RC framed structure, RC slabs (full weight) and brick infill walls. An example of the RC external wall, roof and window design details in Beijing are resented in Table 2, Table 3 and Table 4. Figure 4 illustrates the design of the external envelope for the five studied cities.

2.3. Details of the CLT Building

CLT construction is still not widespread in China and there are no local design standards available that can be adopted for timber office building design. Therefore, this study applies the Eurocode 5 and relevant documents [52,53] for the CLT structure design. According to the references above, 3-layer CLT panels with the total thickness of 150 mm and 5-layer CLT panels with the total thickness of 180 mm are used for external wall design and roof design respectively. The width and length of a single panel are set to be 1200 and 18,000 mm, which satisfies the current construction module in China. When compared with the RC building, the basic dimensions of the CLT building, such as floor height, building orientation, ground areas and major functions, are the same as for the reference concrete buildings. However, the load-bearing structure and external envelope are redesigned to meet the building regulations of the different climate zones. The related design parameters for the CLT buildings in the five studied cities are presented in Table 5, Table 6 and Table 7 and Figure 5.

3. Methodologies

3.1. Study Scope

In relation to the building Life-Cycle Assessment (LCA) method, the building energy consumption is divided into three phases which are the materialization phase, the operation phase, and the end of life phase (Figure 6). Existing references indicate that the ratio of energy consumption between the three stages is of the order of 20%, 65%, 15% [54,55,56]. It is clear that building energy consumption during the operation phase is the dominant component. In this phase, energy consumption includes lighting, space cooling, space heating, ventilation, appliances, and water heating.
This simulation is focused on the building energy consumed during the operation phase. This energy can be further divided into six categories, namely lighting, space heating, space cooling, ventilation, appliance and water heating. It should be emphasized that the energy required for space heating and space cooling is directly related to the building structure and materials, while the energy used for water heating, appliances and lighting is related to the behavior and habits of the building users.

3.2. Integrated Environmental Solution (IES)—Virtual Environment (VE) Simulation of the Operation Stage

This study simulates the building energy consumption during the operation stage using the commercial software IES (Integrated Environmental Solution)-VE. This software allows the user to establish building models with different construction materials and set up the basic environmental simulation parameters. The simulation steps can be divided into two parts which are modeling building and parameter setup.

3.2.1. Modeling Building

In this study, the initial architectural model is established by using software Sketch Up 10.0, and then imported to IES platform. The basic building information such as environmental conditions, enclosure structures, and architectural dimensions of case study buildings have already been presented in Section 2 and Section 3. The established model in IES software platform is presented in Figure 7.

3.2.2. Parameters Setup

All the parameters setup in the simulation strictly follow the specification Design Standard for Energy Efficiency of Public Buildings (GB 50015), which is issued by the Ministry of Housing and Urban–Rural Development of China. The simulation parameters for the internal gains are tabulated in Table 8. As mentioned above, six categories of energy on operation phase, namely lighting, space heating, space cooling, ventilation, appliance and water heating are simulated.
(1) Lighting
The lighting power density is set to be 2–9 W/m2 according to the different user demand. The calculation time and lighting hourly rate are tabulated in Table 9.
(2) Space Cooling and Space Heating
According to the local regulations in China, the indoor temperature is assumed to be controlled between 20 and 26 °C. The cooling and heating systems are operated automatically when the temperature is not in this range. The energy consumption on holidays is not taken into the consideration. In the Severe Cold Region and Cold Region, the minimum indoor temperature is set to be not lower than 5 °C on winter holidays to prevent the water pipes from freezing. Taking Beijing as an example, the simulation parameters of space cooling and space heating conditions are tabulated in Table 10 and Table 11.
(3) Ventilation
Both mechanical ventilation and infiltration are considered in the simulation. The mechanical ventilation operation time is set to be from 07:00–18:00; and infiltration occurs over 24 hours. The mechanical ventilation rate is 5 ach/h and infiltration rate is set at 0.25 ach/h. Taking Beijing as an example, the simulation parameters of ventilation are tabulated in Table 12.
(4) Appliances
The lighting power density is set to be 15 W/m2. The calculation time and lighting hourly rate are tabulated in Table 13.
(5) Water Heating
In the office buildings, the water consumption quota is set to be 10 L for each person every working day. The water heating energy consumption in holidays is not taken into consideration.

4. Results and Analysis

The comparative energy consumption simulation for the RC and CLT office buildings in the five climate zones are presented in Table 14 and Table 15. The results indicate that in the Severe Cold Region, the Cold Region and the Hot-Summer Cold-Winter Region, the energy use of the RC framed buildings is approximately 2–4% more than that of the CLT buildings during the operation phase, while in the Temperate and the Hot Summer Warm Winter regions, the energy use for the two structures is similar. The results from Table 15 indicate that the CLT system consumes much less heating energy than the RC buildings in any climate zone. It shows that CLT as an innovative building material has great potential for reducing heating energy. On the contrary, CLT system consumes more energy for cooling than for RC buildings. This result indicates that overheating may occur in CLT buildings due to the lower U values and thermal mass.
The results show that the average office building energy consumption increased gradually from South to North in China. The average energy consumption in Severe Cold Region is 201.59 KWh/m2, which is about 200% more than that in Temperate Regions. In the Severer Cold Region and Cold Region, heating energy, which account for approximately 36.8% and 24.5% of the total energy consumption respectively, is the major energy consumption. In the Temperate Region, Hot-Summer Cold-Winter Region and Hot-Summer Warm-Winter Region, cooling energy dominate the majority of the total energy consumption. Cooling energy account for 31.9%, 35.2% and 62.4% of the total energy consumption respectively. The result show that the total energy consumption in the office building with a RC frame and CLT are approximately 201.59 kWh/m2 and 194.73 kWh/m2 per annum respectively during the operation phase in the Severe Cold region. These figures reduced to 156.00 kWh/m2 and 149.67 kWh/m2 for the Cold region.
The calculation results echo the outcomes from existing research. Trabucco pointed out that the building of 30 St Mary Axe, designed by Foster, was expected to consume 140 kWh/m2 per annum for building’s operation [57]. Ma et al. evaluated a large public building in Tianjin, which is located in Cold Region of China, and pointed out that the building consumed 345.0 kWh/m2 per annum on operation phase [58]. The Australian national average for commercial building energy consumption was 272 ± 17 kWh/m², with a standard deviation of 128 kWh/m² per year [59]. This figure is close to the values of Shenzhen and Shanghai. Wan et al. made simulations to evaluate the cooling load intensity of office buildings in Malaysia. The results showed that the cooling energy consumption was 193 kWh/m2 per annum [60].

5. Discussions

5.1. Adaptability of CLT System

The results of the simulation clearly show that the CLT system has great potential for the reduction of heating energy, which indicates that timber is an ideal building material for regions with considerable heating requirements. Previous research has found that space heating energy accounts for approximately 30% to 40% of total energy consumption in North China [61]. When taking the total amount of energy consumption into consideration, buildings in the Severe Cold, Cold, and Hot-Summer Cold-Winter regions consumed more heating energy than those in other regions. However, in the Hot Summer Warm Winter region and the Temperate region, the energy consumption of the CLT system is nearly identical to that of the building with a RC structures. Policy makers in China could reduce office building energy requirements by encouraging the application of the CLT system in the Cold, Severe Cold, and Hot Summer Cold Winter regions.
The results also indicate that the CLT system may cause overheating in comparison with RC structures. This would mean that CLT buildings would require additional cooling energy in the summer. Previous research has also highlighted that some bio-based materials such as wood may cause overheating due to their lower values of thermal mass [47,48,49,62]. Thermal mass is a property of the mass of a building which enables it to store heat, providing inertia against temperature fluctuations. Higher amounts of thermal mass at the inner side of the thermal insulation appear to be beneficial with regard to improving thermal comfort [63,64]. Hence, from an energy conservation viewpoint, CLT may not be such a good alternative building material for regions without considerable heating requirements, but this aspect should be verified by further studies.

5.2. Economic Benefits

The initial investment on construction of the CLT buildings may be a crucial factor that affects the development and adoption of this material. In comparison with conventional building materials, the initial cost of CLT system may not be an obstacle. Existing data from the US and Europe demonstrates that the initial construction cost of 10 to 18 story CLT buildings is approximately the same as that of conventional buildings built in concrete, bricks and steel. Sellen showed that in the Pacific Northwest, the cost of a CLT design option can be as cost-effective as reinforced concrete. The costs of a 26-meter-high CLT building (8 story) and 38-meter-high CLT building (14 story) are approximately 32.5 US dollars and 31 US dollars per square foot, which is slightly higher than the cost of the same buildings in RC [65]. Mahlum Architects et al. also indicated that the use of CLT as the construction material for a 10-story building may result in a slightly lower cost than the concrete alternative (4%) [66]. Pei et al. highlighted that equivalent or better performance than current code and existing concrete and steel structures is expected from tall CLT buildings. The cost of tall CLT buildings is comparable or less expensive than concrete and steel options in the US [66]. Tall residential buildings are often believed to be high energy consumers, mainly due to the large amount of materials required for the structure during construction [9]. However, the total energy consumed by the building during its lifespan is not limited to the amount of material used, but also includes the energy consumed during the operational stage. This simulation uses 150 mm thick CLT panels for the external walls, which satisfies the local energy saving codes. That means that the CLT external walls are 50 mm thinner than the RC walls. This additional interior floor area is attractive to developers and is another positive factor to encourage the development of CLT system.

5.3. Embodied Energy of CLT

As illustrated in Figure 6, in this paper, the evaluation of energy saving effects of the CLT systems on the manufacture phase and end-of-life phase are not included. However, according to the existing references, if taking the embodied energy on the manufacture phase and end-of-life phase into consideration, wood may save much more energy than those of conventional building materials. Borjesson et al. highlighted that compared to wood construction, RC framed buildings consume approximately 80% more energy on the building material production stages and release about 100–200% more net GHG emissions [67]. Gong et al. made simulations and pointed out that concrete frames consume approximately 30% more energy than timber frames in Beijing, China [68]. Darby et al. demonstrated that a CLT solution for a multi-story residential building, in comparison with a conventional RC solution, may result in approximately 60.6% carbon reductions in view of all building life span [69]. As a building material, CLT is more energy efficient than conventional building constructions in view of life cycle assessment.

5.4. Future Development

The Chinese government has put forward a series of policies to encourage the development of timber buildings. In 2017, the Ministry of Housing and Urban–Rural Development of China (MOHURD) issued a new building code (GB/T 51226-2017), which extended the height of timber buildings from 3 floors to 56 meters or no more than 18 stories in non-seismic regions. Action Plan for Promoting the Production and Application of Green Building Materials, which was promulgated by Ministry of Industry and Information Technology of China in 2017, clearly presented the policies of developing wood-structure buildings. Furthermore, the increasing rate of forest cover is the solid fundamentals for wood industry. Due to the unremitting efforts, in 2018, the forest coverage percentage is 21.66% in China and this figure is expected to be 26% in 2035. It can be expected that the timber buildings in China will expand rapidly over the next few decades.

6. Conclusions

This paper compares the CLT system for office buildings to similar buildings with RC structures in order to study the energy saving potential for China’s five different climate zones. The simulation method, IES analysis, is an effective approach to analyze energy consumption related to office buildings. The simulation makes it possible to evaluate embodied energy on operation phase of buildings and to examine the contribution of different types of energy consumption. Based on the simulation results, the following conclusions can be drawn:
  • In terms of embodied energy and embodied GHG, CLT has been observed to be better than conventional materials. The CLT system is more energy efficient in winter with reduced heating energy requirements in comparison with RC structures. Overall, the calculated heating energy saving ratio for Harbin, Beijing, Shanghai and Kunming is 11.97%, 22.11%, 30.94%, and 23.30% respectively. Furthermore, more energy could be saved by increasing the thickness of the CLT panels.
  • In comparison with those conventional materials, such as reinforced concrete, brick and steel, CLT has been proved to be a good candidate as alternative material for construction. In view of the potential for the reduction of heating energy requirements by using the CLT system, it is recommended that policy makers encourage the application of CLT in the construction industry in the Severe Cold Region and Cold Regions in China.
  • Inversely, in terms of thermal mass and thermal comfort in the summer, CLT is found to be less attractive than concrete. The CLT system also increases the cooling energy requirements in summer, with an increased possibility of the occurrence of overheating in CLT office buildings. As a result, CLT may not be such a good alternative building material for regions, namely the Temperate Region and Hot-Summer Warm-Winter Region without considerable heating requirements.

Author Contributions

Conceptualization, H.G. and Y.D.; methodology, H.G.; software, X.C.; validation, X.C. and X.Y.; formal analysis, X.Y.; investigation, X.C.; resources, H.G.; data curation, X.C.; writing—original draft preparation, Y.D.; writing—review and editing, H.G. and X.Y.; visualization, Y.D.; supervision, H.G.; project administration, H.G.; funding acquisition, H.G.

Funding

This research was funded by National Natural Science Foundation of China, grant number 51608144.

Conflicts of Interest

The authors declare no conflict of interest.

References

  1. Wei, Z.; Xu, W.; Wang, D.; Li, L.; Niu, L.; Wang, W.; Wang, B.; Song, Y. A study of city-level building energy efficiency benchmarking system for China. Energ. Buildings 2018, 179, 1–14. [Google Scholar] [CrossRef]
  2. Urge-Vorsatz, D.; Petrichenko, K.; Staniec, M.; Eom, J. Energy use in buildings in a long-term perspective. Curr. Opin. Electrochem. 2013, 5, 141–151. [Google Scholar]
  3. Ürge-Vorsatz, D.; Cabeza, L.F.; Serrano, S.; Barreneche, C. Heating and cooling energy trends and drivers in buildings. Renew. Sust. Energ. Rev. 2015, 41, 85–98. [Google Scholar] [CrossRef] [Green Version]
  4. International Energy Agency. Transition to sustainable buildings: Strategies and opportunities to 2050. Available online: https://www.iea.org/publications/freepublications/publication/Building2013_free.pdf (accessed on 29 November 2018).
  5. United Nations Environment Programme. Energy efficiency for buildings. Available online: http://www.studiocollantin.eu/pdf/UNEP%20Info%20sheet%20-%20EE%20Buildings.pdf (accessed on 28 November 2018).
  6. Pérez-Lombard, L.; Ortiz, J.; Pout, C. A review on buildings energy consumption information. Energ. Buildings 2008, 40, 394–398. [Google Scholar] [CrossRef]
  7. D’Agostino, D. Assessment of the progress towards the establishment of definitions of Nearly Zero Energy Buildings (nZEBs) in European Member States. J. Build. Eng. 2015, 1, 20–32. [Google Scholar] [CrossRef]
  8. Bundesamt, D.S. Statistisches Jahrbuch: Deutschland und Internationales, Wiesbaden. Available online: https://www.destatis.de/DE/Publikationen/StatistischesJahrbuch/StatistischesJahrbuch.html (accessed on 28 November 2018).
  9. Foraboschi, P.; Mercanzin, M.; Trabucco, D. Sustainable structural design of tall buildings based on embodied energy. Energ. Buildings 2014, 68, 254–269. [Google Scholar] [CrossRef]
  10. USA Department of Energy. 2011 Buildings Energy Data Book; USA Department of Energy: Washington, DC, USA, 2012.
  11. USA Energy Information Administration. International Energy Outlook 2010. USA Energy Information Administration: Washington, DC, USA, 2010. Available online: http://www.eia.gov/oiaf/ieo/index.html (accessed on 26 November 2018).
  12. Department for Communities and Local Government. Definition of zero carbon homes: Impact assessment. Available online: www.communities.gov.uk/publications/planningandbuilding/impactzerocarbon (accessed on 27 November 2018).
  13. Choudhary, R. Energy analysis of the non-domestic building stock of Greater London. Build. Environ. 2012, 51, 243–254. [Google Scholar] [CrossRef]
  14. D’Agostino, D.; Parker, D. A framework for the cost-optimal design of nearly zero energy buildings (NZEBs) in representative climates across Europe. Energy 2018, 149, 814–829. [Google Scholar] [CrossRef]
  15. Chastas, P.; Theodosiou, T.; Bikas, D.; Kontoleon, K. Embodied energy in residential buildings-towards the nearly zero energy building: A literature review. Build. Environ. 2016, 105, 267–282. [Google Scholar] [CrossRef]
  16. Goggins, J.; Moran, P.; Armstrong, A.; Hajdukiewicz, M. Lifecycle environmental and economic performance of nearly zero energy buildings (NZEB) in Ireland. Energ. Buildings 2016, 116, 622–637. [Google Scholar] [CrossRef]
  17. Hamdy, M.; Nguyen, A.T.; Hensen, J.L. A performance comparison of multi-objective optimization algorithms for solving nearly-zero-energy-building design problems. Energ. Buildings 2016, 121, 57–71. [Google Scholar] [CrossRef] [Green Version]
  18. Yan, D. China Building Energy Use 2016; Building energy conservation research center, Tsinghua University, Beijing. China Architecture & Building Press: Beijing, China, 2016. [Google Scholar]
  19. Ma, M.; Cai, W.; Wu, Y. China Act on the Energy Efficiency of Civil Buildings (2008): A decade review. Sci. Total Environ. 2019, 651, 42–60. [Google Scholar] [CrossRef] [PubMed]
  20. Elias-Ozkan, S.T.; Summers, F. Thermal Performance of Three Different Strawbale Buildings at the Kerkenes Eco-Center. J. Green Build. 2013, 8, 110–126. [Google Scholar] [CrossRef]
  21. Energy Conservation Research Center of Tsinghua University. Annual Report on China Building Energy Efficiency. China Architecture & Building Press: Beijing, China, 2007. [Google Scholar]
  22. Lu, S.; Zheng, S.; Kong, X. The performance and analysis of office building energy consumption in the west of Inner Mongolia Autonomous Region, China. Energ. Buildings 2016, 127, 499–511. [Google Scholar] [CrossRef]
  23. Xiao, H. Study on Distribution Features and Influencing Factors on Energy Use in Office Buildings by Statistical Method and Survey. Master’s Thesis, Tsinghua University, Beijing, China, 2011; pp. 107–119. [Google Scholar]
  24. Ministry of Housing and Urban-Rural Development. Six ways to promote building energy efficiency of China. Available online: http://www.gov.cn/jrzg/2009-03/06/content_1252485.htm (accessed on 28 November 2018).
  25. Izzi, M.; Casagrande, D.; Bezzi, S.; Pasca, D.; Follesa, M.; Tomasi, R. Seismic behaviour of Cross-Laminated Timber structures: A state-of-the-art review. Eng. Struct. 2018, 170, 42–52. [Google Scholar] [CrossRef] [Green Version]
  26. Cabrero, J.M.; Iraola, B.; Yurrita, M. Failure of timber constructions. In Handbook of Materials Failure Analysis; Makhlouf, A.S.H., Aliofkhazraei, M., Eds.; Butterworth-Heinemann: Oxford, UK, 2018; pp. 123–152. [Google Scholar]
  27. Ramage, M.H.; Burridge, H.; Busse-Wicher, M.; Fereday, G.; Reynolds, T.; Shah, D.U.; Wu, G.; Yu, L.; Fleming, P.; Densley-Tingley, D.; et al. The wood from the trees: The use of timber in construction. Renew. Sust. Energ. Rev. 2017, 68, 333–359. [Google Scholar] [CrossRef] [Green Version]
  28. Bezabeh, M.A.; Gairola, A.; Bitsuamlak, G.T.; Popovski, M. Structural performance of multi-story mass-timber buildings under tornado-like wind field. Eng. Struct. 2018, 177, 519–539. [Google Scholar] [CrossRef]
  29. Foraboschi, P. The central role played by structural design in enabling the construction of buildings that advanced and revolutionized architecture. Constr. Build. Mater. 2016, 114, 956–976. [Google Scholar] [CrossRef]
  30. Foraboschi, P. Specific structural mechanics that underpinned the construction of Venice and dictated Venetian architecture. Eng. Fail. Anal. 2017, 78, 169–195. [Google Scholar] [CrossRef]
  31. Skidmore, O.A.M. Timber tower research project. Available online: http://www.som.com/ideas/research/timber_tower_research_project (accessed on 28 November 2018).
  32. Zhang, X.; Popovski, M.; Tannert, T. High-capacity hold-down for mass-timber buildings. Constr. Build. Mater. 2018, 164, 688–703. [Google Scholar] [CrossRef]
  33. Fink, G.; Kohler, J.; Brandner, R. Application of European design principles to cross laminated timber. Eng. Struct. 2018, 171, 934–943. [Google Scholar] [CrossRef]
  34. Stewart, L.; Valkenburg, A.; Gentry, T.R.; Conley, C.; Sanborn, K.; Koch, Z. Ballistic Performance of Cross-Laminated Timber (CLT). Int. J. Impact. Eng. [CrossRef]
  35. Jiang, Y.; Crocetti, R. CLT-concrete composite floors with notched shear connectors. Constr. Build. Mater. 2019, 195, 127–139. [Google Scholar] [CrossRef]
  36. Liu, Y.; Guo, H.; Sun, C.; Chang, W.S. Assessing Cross Laminated Timber (CLT) as an Alternative Material for Mid-Rise Residential Buildings in Cold Regions in China—A Life-Cycle Assessment Approach. Sustainability 2016, 8, 1047. [Google Scholar] [CrossRef]
  37. Laguarda Mallo, M.F.; Espinoza, O. Awareness, perceptions and willingness to adopt Cross-Laminated Timber by the architecture community in the United States. J. Clean. Prod. 2015, 94, 198–210. [Google Scholar] [CrossRef]
  38. Liao, Y.; Tu, D.; Zhou, J.; Zhou, H. Feasibility of manufacturing cross-laminated timber using fast-grown small diameter eucalyptus lumbers. Constr. Build. Mater. 2017, 132, 508–515. [Google Scholar] [CrossRef]
  39. WoodWorks. Introducing Cross-laminated Timber. New Opportunities for Timber Construction. Available online: http://www.woodworks.org/wp-content/uploads/2013-14-Q4-Introducing-CLT.pdf (accessed on 27 November 2018).
  40. Fufa, S.M.; Skaar, C.; Gradeci, K.; Labonnote, N. Assessment of greenhouse gas emissions of ventilated timber wall constructions based on parametric LCA. J. Clean. Prod. 2018, 197, 34–46. [Google Scholar] [CrossRef]
  41. Mithraratne, N.; Vale, B. Life cycle analysis model for New Zealand houses. Build. Environ. 2004, 39, 483–492. [Google Scholar] [CrossRef]
  42. Suzuki, M.; Oka, T.; Okada, K. The estimation of energy consumption and CO2 emission due to housing construction in Japan. Energ. Buildings 1995, 22, 165–169. [Google Scholar] [CrossRef]
  43. Zabalza Bribián, I.; Valero Capilla, A.; Aranda Usón, A. Life cycle assessment of building materials: Comparative analysis of energy and environmental impacts and evaluation of the eco-efficiency improvement potential. Build. Environ. 2011, 46, 1133–1140. [Google Scholar] [CrossRef]
  44. Upton, B.; Miner, R.; Spinney, M.; Heath, L.S. The greenhouse gas and energy impacts of using wood instead of alternatives in residential construction in the United States. Biomass Bioenerg. 2008, 32, 1–10. [Google Scholar] [CrossRef]
  45. Hildebrandt, J.; Hagemann, N.; Thrän, D. The contribution of wood-based construction materials for leveraging a low carbon building sector in europe. Sustain. Cities Soc. 2017, 34, 405–418. [Google Scholar] [CrossRef]
  46. Guo, H.B.; Liu, Y.; Chang, W.S.; Shao, Y.; Sun, C. Energy Saving and Carbon Reduction in the Operation Stage of Cross Laminated Timber Residential Buildings in China. Sustainability 2017, 9, 292. [Google Scholar] [CrossRef]
  47. Adekunle, T.O.; Nikolopoulou, M. Thermal comfort, summertime temperatures and overheating in prefabricated timber housing. Build. Environ. 2016, 103, 21–35. [Google Scholar] [CrossRef] [Green Version]
  48. Dodoo, A.; Gustavsson, L. Energy use and overheating risk of Swedish multi-storey residential buildings under different climate scenarios. Energy 2016, 97, 534–548. [Google Scholar] [CrossRef]
  49. Pajek, L.; Hudobivnik, B.; Kunič, R.; Košir, M. Improving thermal response of lightweight timber building envelopes during cooling season in three European locations. J. Clean. Prod. 2017, 156, 939–952. [Google Scholar] [CrossRef]
  50. Simone, R.; Casagrande, D.; Tomasi, R.; Piazza, M. Seismic elastic analysis of light timber-frame multi-storey buildings: Proposal of an iterative approach. Constr. Build. Mater. [CrossRef]
  51. Fragiacomo, M.; Dujic, B.; Sustersic, I. Elastic and ductile design of multi-storey crosslam massive wooden buildings under seismic actions. Eng. Struct. 2011, 33, 3043–3053. [Google Scholar] [CrossRef]
  52. European Committee for Standardization (CEN). Eurocode 5: Design of timber structures—Part 1–1: General-Common rules and rules for buildings; EN 1995-1-1; European Committee for Standardization: Brussels, Belgium, 2004. [Google Scholar]
  53. TRADA. GD10 Cross-laminated timber (Eurocode 5) design guide for project feasibility; TRADA Technology Ltd: High Wycombe, UK, 2009. [Google Scholar]
  54. Blengini, G.A.; di Carlo, T. The changing role of life cycle phases, subsystems and materials in the LCA of low energy buildings. Energ. Buildings 2010, 42, 869–880. [Google Scholar] [CrossRef]
  55. Ramesh, T.; Prakash, R.; Shukla, K.K. Life cycle energy analysis of buildings: An overview. Energ. Buildings 2010, 42, 1592–1600. [Google Scholar] [CrossRef]
  56. Evangelista, P.P.A.; Kiperstok, A.; Torres, E.A.; Gonçalves, J.P. Environmental performance analysis of residential buildings in Brazil using life cycle assessment (LCA). Constr. Build. Mater. 2018, 169, 748–761. [Google Scholar] [CrossRef]
  57. Trabucco, D. An analysis of the relationship between service cores and the embodied/running energy of tall buildings. Struct. Des. Tall. Spec. 2008, 17, 941–952. [Google Scholar] [CrossRef] [Green Version]
  58. Ma, J.-J.; Du, G.; Zhang, Z.-K.; Wang, P.-X.; Xie, B.-C. Life cycle analysis of energy consumption and CO2 emissions from a typical large office building in Tianjin, China. Build. Environ. 2017, 117, 36–48. [Google Scholar] [CrossRef]
  59. Robati, M.; Kokogiannakis, G.; McCarthy, T.J. Impact of structural design solutions on the energy and thermal performance of an Australian office building. Build. Environ. 2017, 124, 258–282. [Google Scholar] [CrossRef]
  60. Wan Mohd Nazi, W.I.; Royapoor, M.; Wang, Y.; Roskilly, A.P. Office building cooling load reduction using thermal analysis method—A case study. Appl. Energy 2017, 185, 1574–1584. [Google Scholar] [CrossRef]
  61. International Energy Agency. Energy Climate and Change, World Energy Outlook Special Report; International Energy Agency: Paris, France, 2015. [Google Scholar]
  62. Stazi, F.; Ulpiani, G.; Pergolini, M.; di Perna, C. The role of areal heat capacity and decrement factor in case of hyper insulated buildings: An experimental study. Energ. Buildings 2018, 176, 310–324. [Google Scholar] [CrossRef]
  63. Jeanjean, A.; Olives, R.; Py, X. Selection criteria of thermal mass materials for low-energy building construction applied to conventional and alternative materials. Energ. Buildings 2013, 63, 36–48. [Google Scholar] [CrossRef]
  64. Verbeke, S.; Audenaert, A. Thermal inertia in buildings: A review of impacts across climate and building use. Renew. Sust. Energ. Rev. 2018, 82, 2300–2318. [Google Scholar] [CrossRef]
  65. Construction, S. CLT modular construction: Residential opportunities; Lake Union Partners: Seattle, WA, USA, 2013. [Google Scholar]
  66. Pei, S.; van de Lindt, J.W.; Popovski, M.; Berman, J.W.; Dolan, J.D.; Ricles, J.; Sause, R.; Blomgren, H.; Rammer, D.R. Cross-Laminated Timber for Seismic Regions: Progress and Challenges for Research and Implementation. J. Struct. Eng. 2016, 142, 1. [Google Scholar] [CrossRef]
  67. Borjesson, P.; Gustavsson, L. Greenhouse gas balances in building construction: Wood versus concrete from life-cycle and forest land-use perspectives. Energ. Policy 2000, 28, 575–588. [Google Scholar] [CrossRef]
  68. Gong, X.; Nie, Z.; Wang, Z.; Cui, S.; Gao, F.; Zuo, T. Life Cycle Energy Consumption and Carbon Dioxide Emission of Residential Building Designs in Beijing. J. Ind. Ecol. 2012, 16, 576–587. [Google Scholar] [CrossRef]
  69. Darby, H.; Elmualim, A.A.; Kelly, F. A case study to investigate the life cycle carbon emissions and carbon storage capacity of a cross laminated timber, multi-storey residential building. In Proceedings of the Sustainable Building Conference, Munich, Germany, 23–25 April 2013; pp. 23–25.
Figure 1. Cross-laminated timber (CLT) construction in five layers.
Applsci 09 00858 g001
Figure 2. Location of the five case study cities.
Applsci 09 00858 g002
Figure 3. Floor plan and section of the case study building.
Applsci 09 00858 g003
Figure 4. External wall and roof designs of the RC building in the five cities.
Applsci 09 00858 g004
Figure 5. External wall and roof designs of the CLT building in the five cities.
Applsci 09 00858 g005
Figure 6. A Flowchart of the life-cycle assessment and the study scope.
Applsci 09 00858 g006
Figure 7. Established model in integrated environmental solution (IES) software platform.
Applsci 09 00858 g007
Table 1. Five studied cities by climate zones.
Climate RegionsTemperatureSub-regionRepresenting CityU-Value (Local Regulations)
HottestColdest
Severe Cold≤25 °C≤−10 °CI (B)HarbinRoof: ≤0.28
Wall: ≤0.38
Window: ≤2.5
Cold Region18–28 °C−10–0 °CII (B)BeijingRoof: ≤0.45
Wall: ≤0.5
Window: ≤2.7
Hot-Summer Cool-Winter25–30 °C0–10 °CIII (B)ShanghaiRoof: ≤0.5
Wall: ≤0.8
Window: ≤3
Hot-Summer Warm-Winter25–29 °C>10 °CIV (B)ShenzhenRoof: ≤0.8
Wall: ≤1.5
Window: ≤4
Temperate18–25 °C0–13 °CV (B)KunmingRoof: ≤0.8
Wall: ≤1.5
Window: ≤4
Data Source: Code for Design of Civil Buildings (GB 50352-2005).
Table 2. Details of reinforced concrete (RC) external wall design in Beijing.
Thickness (mm)Conductivity (W/(mK))Density (kg/m3)Specific Heat Capacity (J/(kgK))Resistance (m2K/W)
Cement fiber200.08235013000.2439
EPS insulation500.0352514001.4286
Concrete block (heavyweight)2001.63230010000.1227
Cement plaster200.7218608000.0278
Table 3. Details of RC roof design in Beijing
Thickness (mm)Conductivity (W/(mK))Density (kg/m3)Specific Heat Capacity (J/(kgK))Resistance (m2K/W)
Granolithic Render60.8720858370.0069
Concrete Undried Aggregate401.7322438370.0231
Membrane0.41110010000.0004
Felt/Bitumen Layers1.50.5170010000.003
Cement Plaster300.7218608000.0417
Vermiculite Aggregate650.174508370.3824
EPS Insulation550.0352514001.5714
Reinforced Concrete1002.3230010000.0435
Table 4. Details of RC external window design in Beijing
Thickness (mm)Conductivity (W/(mK))GasConvection Coefficient (W/m2K)Resistance (m2K/W)
Outer pane81.06--0.0075
Cavity6-Air4.53820.1795
Inner Pane81.06--0.0075
Table 5. Details of CLT external wall design in Beijing.
Thickness (mm)Conductivity (W/(mK))Density (kg/m3)Specific Heat Capacity (J/(kgK))Resistance (m2K/W)
Cement fiber200.08235013000.2439
EPS insulation500.0352514001.4286
CLT1500.1350015001.1538
Cement plaster200.7218608000.0278
Table 6. Details of CLT roof design in Beijing.
Thickness (mm)Conductivity (W/(mK))Density (kg/m3)Specific Heat Capacity (J/(kgK))Resistance (m2K/W)
Granolithic render60.8720858370.0069
Concrete undried aggregate401.7322438370.0231
Membrane0.41110010000.0004
Felt/Bitumen layers1.50.5170010000.003
Cement plaster300.7218608000.0417
Vermiculite aggregate650.174508370.3824
EPS insulation550.0352514001.5714
CLT panel1800.1350015001.3846
Table 7. Details of CLT external window design in Beijing.
Thickness (mm)Conductivity (W/(mK))GasConvection Coefficient (W/m2K)Resistance (m2K/W)
Outer pane81.06--0.0075
Cavity6-Air4.53820.1795
Inner pane81.06--0.0075
Table 8. Simulation parameters of internal gains.
SpaceNumber of PeoplePer capita Area (P/m2)Lighting Power Density (W/m2)Appliances Power Density (W/m2)
Aisle-040
Big/Middle office-10915
Small office2-915
Meeting room-5–10915
Tea room-5–10415
Toilet-040
Stair-020
Garbage room-040
Table 9. Calculation time (h) and lighting hourly rate (%).
Time123456789101112
Rate000000105095959580
Time131415161718192021222324
Rate8095959595303000000
Table 10. Simulation parameters of space cooling conditions in Beijing.
RoomCooling TimeCooling Set PointCooling Month
Working DayMeeting room09:00–10:0026 °CFrom 16 March to 14 November
15:00–16:00
Other rooms07:00–18:00
HolidayAll Rooms--
Table 11. Simulation parameters of space heating conditions in Beijing.
RoomHeating TimeHeating Set PointHeating Month
Working DayMeeting room24 h20 °CFrom 15 November to 15 March
Other rooms
HolidayAll Rooms
Table 12. Simulation parameters of ventilation in Beijing.
Natural Ventilation Set PointNatural Ventilation TimeNatural Ventilation ConditionNatural Ventilation MonthInfiltrate Ventilation Set PointInfiltrate Ventilation TimeInfiltrate Ventilation Month
Working Day5 ach/h07:00–18:00Room Temp. >26 °C and Outdoor Temp. >15 °C and Room Temp. > Outdoor Temp.16 March to 14 November0.25 ach/h24 h15 November to 15 March
Holiday---
Table 13. Calculate time and appliance hourly rate (%).
Time123456789101112
Rate000000105095959550
Time131415161718192021222324
Rate5095959595303000000
Table 14. Simulation results of building energy consumption during operation stage per annum.
BuildingsLocationTotal Energy Consumption (MWh)Heating Energy Consumption (MWh)Cooling Energy Consumption (MWh)Average Value (kWh/m2)
RC BuildingsHarbin5549.832041.58875.80201.59
Beijing4294.631051.211213.26156.00
Shanghai3417.84490.571202.02124.15
Shenzhen3690.87No Heating2302.42134.07
Kunming2692.25225.36860.1597.80
CLT BuildingsHarbin5360.801797.28904.72194.73
Beijing4120.12818.821249.29149.67
Shanghai3334.63338.771228.79121.13
Shenzhen3708.69No Heating2317.02134.72
Kunming2748.16172.85954.5299.82
Table 15. Heating and cooling energy saving ratio comparisons between RC and CLT buildings.
HeatingCooling
Harbin11.97%−3.30%
Beijing22.11%−2.97%
Shanghai30.94%−2.23%
ShenzhenNo Heating−0.63%
Kunming23.30%−10.97%

