Analysis of Early Performance of Cement Paste by Low Field NMR


1
Key Laboratory of Advanced Civil Engineering Materials of Ministry of Education, Tongji University, Shanghai 201804, China
2
State Key Laboratory of Disaster Reduction in Civil Engineering, Shanghai 200092, China
*
Author to whom correspondence should be addressed.
Appl. Sci. 2019, 9(5), 896; https://doi.org/10.3390/app9050896
Submission received: 29 January 2019
/
Revised: 26 February 2019
/
Accepted: 27 February 2019
/
Published: 2 March 2019
(This article belongs to the Special Issue Applications of Low Field Magnetic Resonance)
Abstract
:The change of the evaporable water content in the early hydration process of cement paste with different water-to-cement ratios was monitored by low field nuclear magnetic resonance (LF-NMR) relaxometry. The hydration degree and gel/space ratio were accordingly calculated and analyzed. The test results show that the first derivative curves of the transverse magnetization are in good agreement with the known five stages of cement hydration process at an early age. The initial and final setting times of the cement paste are closely related to the times the gel/space ratio reaches a fixed value. The early compressive strength of the hardened cement paste exhibits a power function relationship with the gel/space ratio.
1. Introduction
The hydration of cement takes place as soon as the cement particles meet water. A time-consuming transition of the cement paste, the so-called ‘setting process’, from a liquid state to a porous and hardened solid occurs. However, it can still be conveniently divided into five stages in common based on the results of heat release tests during the early age, where the heat flow is proportional to the rate of reaction. The early hydration reaction process and microstructure of cement-based materials have definite impacts on the later macroscopic mechanical properties and durability. Cement paste is an important component of cement-based materials, and it is also a complex multi-phase heterogeneous composite. The chemical and physical changes of cement paste affect the setting and hardening of cement-based materials. Investigation of the rule of hydration, hardening process and strength growth of cement paste is helpful for better understanding the early performance of cement-based materials. Using original pore water as probes, the hydration and pore structure of cement-based materials can be in situ measured through the LF-NMR technique with advantages that have been shown to be non-invasive, non-destructive and fully quantitative. The first systematic analysis of cement pastes by 1H NMR was by Blinc et al. [1]. They followed the evolution of T1 and T2 relaxation times of the main liquid volume from 10 minutes after mixing up to 28 days of hydration. Halperin et al. [2] presented for the first time an inversion of the CPMG (Carr–Purcell–Meiboom–Gill) decay into a pore volume distribution function with the help of the fast exchange model [3]. They reported two principal pore populations of mobile water that are interpreted as “open gel” pores and capillary pores. Since then there have been very many further studies yielding a wealth of results [4,5,6,7,8,9,10,11,12,13,14,15,16,17]. Over the years, 1H NMR has managed to successfully provide valuable information about the hydration kinetics, porosity, and pore-size distributions. Especially, with the measurements of transverse magnetic relaxation being applied for hydration of cement, the amount of water consumed during the hydration process can be determined independently from the amplitude of the NMR echo signal extrapolated to the beginning of the pulse sequence. As 1H from liquid water present within the cement microstructure is used as the active NMR probe, it can accurately reflect the information inside the cement-based samples, and no need to require additional processing such as drying or injecting. Therefore, by studying the nuclear magnetic signal, the change of evaporable water content can be qualitative or quantitatively obtain [8,9,11,17].
Although there have been many studies involving the relationship between LF-NMR results and cement hydration, there are very few studies on the transverse magnetization and its derivative being physically related to the different stages of cement hydration, and it is not very clear that there is some inherent relationship between the gel/space ratio and the setting time or very early strength of cement. The purpose of this work is to monitor the evolution of evaporable water throughout the early hydration process of cement paste at different water-to-cement ratios (ratios of mass of water to mass of cement) by LF-NMR technique. The degree of hydration and gel/space ratio (in volume) according to the Powers model [18] were obtained by analyzing and calculating the evolution of transverse magnetization through the CPMG pulse sequence. The results were correlated to the setting process and early compressive strength growth, which were obtained by conventional Vicat needle method and mechanical test.
2. Materials and Methods
White cement of low concentration of Fe2O3 (≤0.25%, w/w) is used to facilitate the LF-NMR testing. This cement is selected instead of ordinary (gray) Portland cement because of low paramagnetic phases content in the hardened paste; which can distort the magnetic field and worsen the NMR signal. Cement paste samples were uniformly mixed according to water-to-cement ratios of 0.3, 0.4, and 0.5. Cement pastes were then poured into 2 mL autosampler vials, vibrated to remove entrapped air before sealing and then rotated horizontally to reduce water bleeding. Each cement paste was weighed and the initial water content was calculated based on the water-to-cement ratio. Samples were continuously measured in a LF-NMR analyzer for 100 h. 1H NMR measurements were made on Model NMRC12-010V analyzer with a fixed magnetic field of 0.30 T and a frequency field of 20 MHz manufactured by Niumag Co., Ltd., Suzhou, Jiangsu, China, CPMG pulse sequence is applied to capture the transverse relaxation behavior of proton in water.
Various forms of water such as chemically bound water, adsorbed water, and pore water are present in the cement paste. Protons from these forms of water are characterized by different T2. Thus, the total transverse magnetization M(t) at time t is multi-exponentially decayed
where M0 denotes the initial magnetization at time t = 0 before resonance frequency (RF) pulse. The fraction fi is proportional to the volume of fluid relaxing at a rate 1/T2i and is constrained to be nonnegative. Due to the extremely short relaxation time (about 10 μs) of the proton in chemically bound water such as Ca(OH)2, the signals produced by which were decayed rapidly after π/2 pulse. Thus, the signals obtained practically in the experiments were indeed regarded as being from the adsorbed water and pore water, which is called evaporable water.
It is well known that chemical reactions between cement and water transform cement pastes from fluids to rigid bodies. The materials remain workable within the induction period because further hydration is retarded by hydration products that form around the cement grains early. When these coatings are ruptured by osmotic pressure, hydration is resumed and the setting process takes place. The term ‘setting’ has been used to describe the onset of rigidity in fresh cement paste. The setting time for the cement paste was conducted according to Vicat needle tests. The method is based on measuring the depth of penetration of a needle into the cement paste. The time between starting time and the time at which the distance between the needle and the base plate is 4 ± 1 mm, measured to the nearest minute, is defined as the initial setting time (IST). Replace the needle of the Vicat apparatus with a needle with an annular ring, record the period elapsed between the time of adding water to the cement and the time when the annular ring fails to make the impression on the cement paste mold as the final setting time (FST).
The early compressive strength was tested by the conventional mechanical method every 12 h. The cement pastes at different water-to-cement ratios were cast into 20 mm × 20 mm × 20 mm cubic samples, and cured in a standard curing environment (temperature 20 ± 1 °C, RH ≥ 95%). Strength measured from 12 h to 96 h after mixing.
3. Results and Discussion
3.1. The Evolution of NMR Transverse Magnetization During Hydration
Considering it is linearly proportional to proton number and thus water content, the first peak amplitude of the transverse relaxation, which is approximately regarded as fitted magnetization M0 of the samples under the CPMG pulse sequence was collected. For convenience, the measured signal quantity at different times is divided by the initial water content in the sample to obtain the change of the transverse magnetization of the evaporable water during hydration, as shown in Figure 1. The samples with different water-to-cement ratios have similar evolution trends. The first-order derivative curves of the magnetization under different water-to-cement ratios were obtained by fitting the signal data. It is shown that the characteristic changes of the curves agree well with the known five stages of cement hydration process in the early stages of setting: initial reaction (stage 1), induction period (stage 2), acceleration period (stage 3), deceleration period (stage 4), and slow hydration reaction (stage 5). This is because the rate of water consumption in the cement paste is consistent with the rate of chemical reaction, i.e., the rate of heat release. At the same time, the higher water-to-cement ratio in the sample results in the greater magnetization for the remaining evaporable water, indicating that the amount of water consumed by the hydration reaction is less compared to that with low w/c ratio.
For the samples with w/c = 0.3, 0.4 and 0.5, the initial setting times conducted according to Vicat needle tests are 1.6 h, 2.2 h, and 2.5 h, respectively. The corresponding final setting times are 2.6 h, 2.9 h, and 3.7 h, respectively. Thermodynamically, the initial set is marked by a rapid temperature rise, which corresponds roughly to the beginning of the main chemical reactions. This temperature rise will reach a maximum rate after the final set. The first-order differential curves of the NMR signal intensity in Figure 1 show that the actual measured initial setting times of the cement pastes occur shortly after the start of the acceleration period; while the measured final setting times appear before the end of the acceleration period. During the acceleration period, the chemical reactions were controlled by nucleation to by chemical process. The Ca(OH)2 began to crystalline after achieving supersaturating concentration. The tricalcium silicate C3S (C = CaO, S = SiO2, according to the cement chemistry notation) that the main component of the cement clinker, began to hydrolyze acceleratively and produced C-S-H (C = CaO, S = SiO2, H = H2O, according to the cement chemistry notation). As a result of these reactions, the pastes hardened and formed strength. The water in the pastes became relatively immovable, where more and more water was constrained in the micropores of the calcium silicate hydrates gels. A lower water-to-cement ratio results in a shorter initial and final setting times, and the valley and peak positions at the first derivative curve of the corresponding NMR signal intensity are shifted to the left.
3.2. Quantitative Characterization of Hydration Degree of Cement Paste
Commonly used methods for determining hydration degree of cement paste include quantitative X-ray diffraction analysis (QXRD), magic angle spinning nuclear magnetic resonance spectra (MAS NMR), and the non-evaporable water method. In our previous research, all three methods were tried, and the results suggest that the non-evaporable water method is the most appropriate way to determine hydration degree in discussions of hydration process monitored by NMR.
As the transverse magnetization of LF-NMR of cement paste is proportional to the content of evaporable water [8,17], the amount of evaporable water at the time t can be derived from the sample mass, water-to-cement ratio, and transverse magnetization. The hydration degree of the cement paste at the corresponding time can be obtained. The specific calculation is as follows:
where m(t) represents the amount of evaporable water at hydration time t; M0(t) represents the transverse magnetization at hydration time t; M0i represents the transverse magnetization at the first time after mixing; m0 is the initial water content of the sample, w/c is water-to-cement ratio; αC(t) is the reaction degree of cement paste at the moment t; mC is the amount of cement; γ is the minimum water-to-cement ratio required for complete hydration of the cement. According to the Powers model [18], γ is 0.42. The non-evaporated water, also known as chemically bound water, can be obtained by subtracting the initial amount of water m0 from the amount of evaporable water m(t).
It can be seen from Figure 2 that the hydration degree of the cement paste grows slowly from the beginning to 2 h. During the hydration process from 2 to 10 h, the degree of hydration increased sharply. After 10 h, the growth rate of the hydration degree slowed down. Although the growth of hydration degree for different pastes in Figure 2 presents a similar trend, the values of hydration degree are still different from each other at a given time. The samples with larger water-to-cement ratio show a higher degree of hydration.
3.3. Gel/Space Ratio and Compressive Strength
Although the literature [19] presents a series of models for cement strength prediction, such as empirical relations between compressive strength and porosity, relations between strength and microstructure or pore size distribution, the much simplified and suitable model adopted in this work follows closely that of Powers [18]. The compressive strength of cement paste is related to the gel/space ratio, defined as the degree to which the saturated gel (hydration products) fills the available space. In the pure cement paste, the available space is the total volume of the system (water + cement) minus the room occupied by the unhydrated cement particles. The saturated gel volume can be calculated by the degree of hydration and the specific volume of saturated gel. The pure cement paste gel/space ratio X is calculated as follows:
where νsg and νc are the specific volumes of saturated gel and cement, respectively; νsg = 0.67 and νc = 0.32, according to the literature [20,21]; w/c is the water-to-cement ratio; αc is the reaction degree of the cement. Therefore, the relationship between gel/space ratio X of cement paste and the hydration degree of cement can be expressed as:
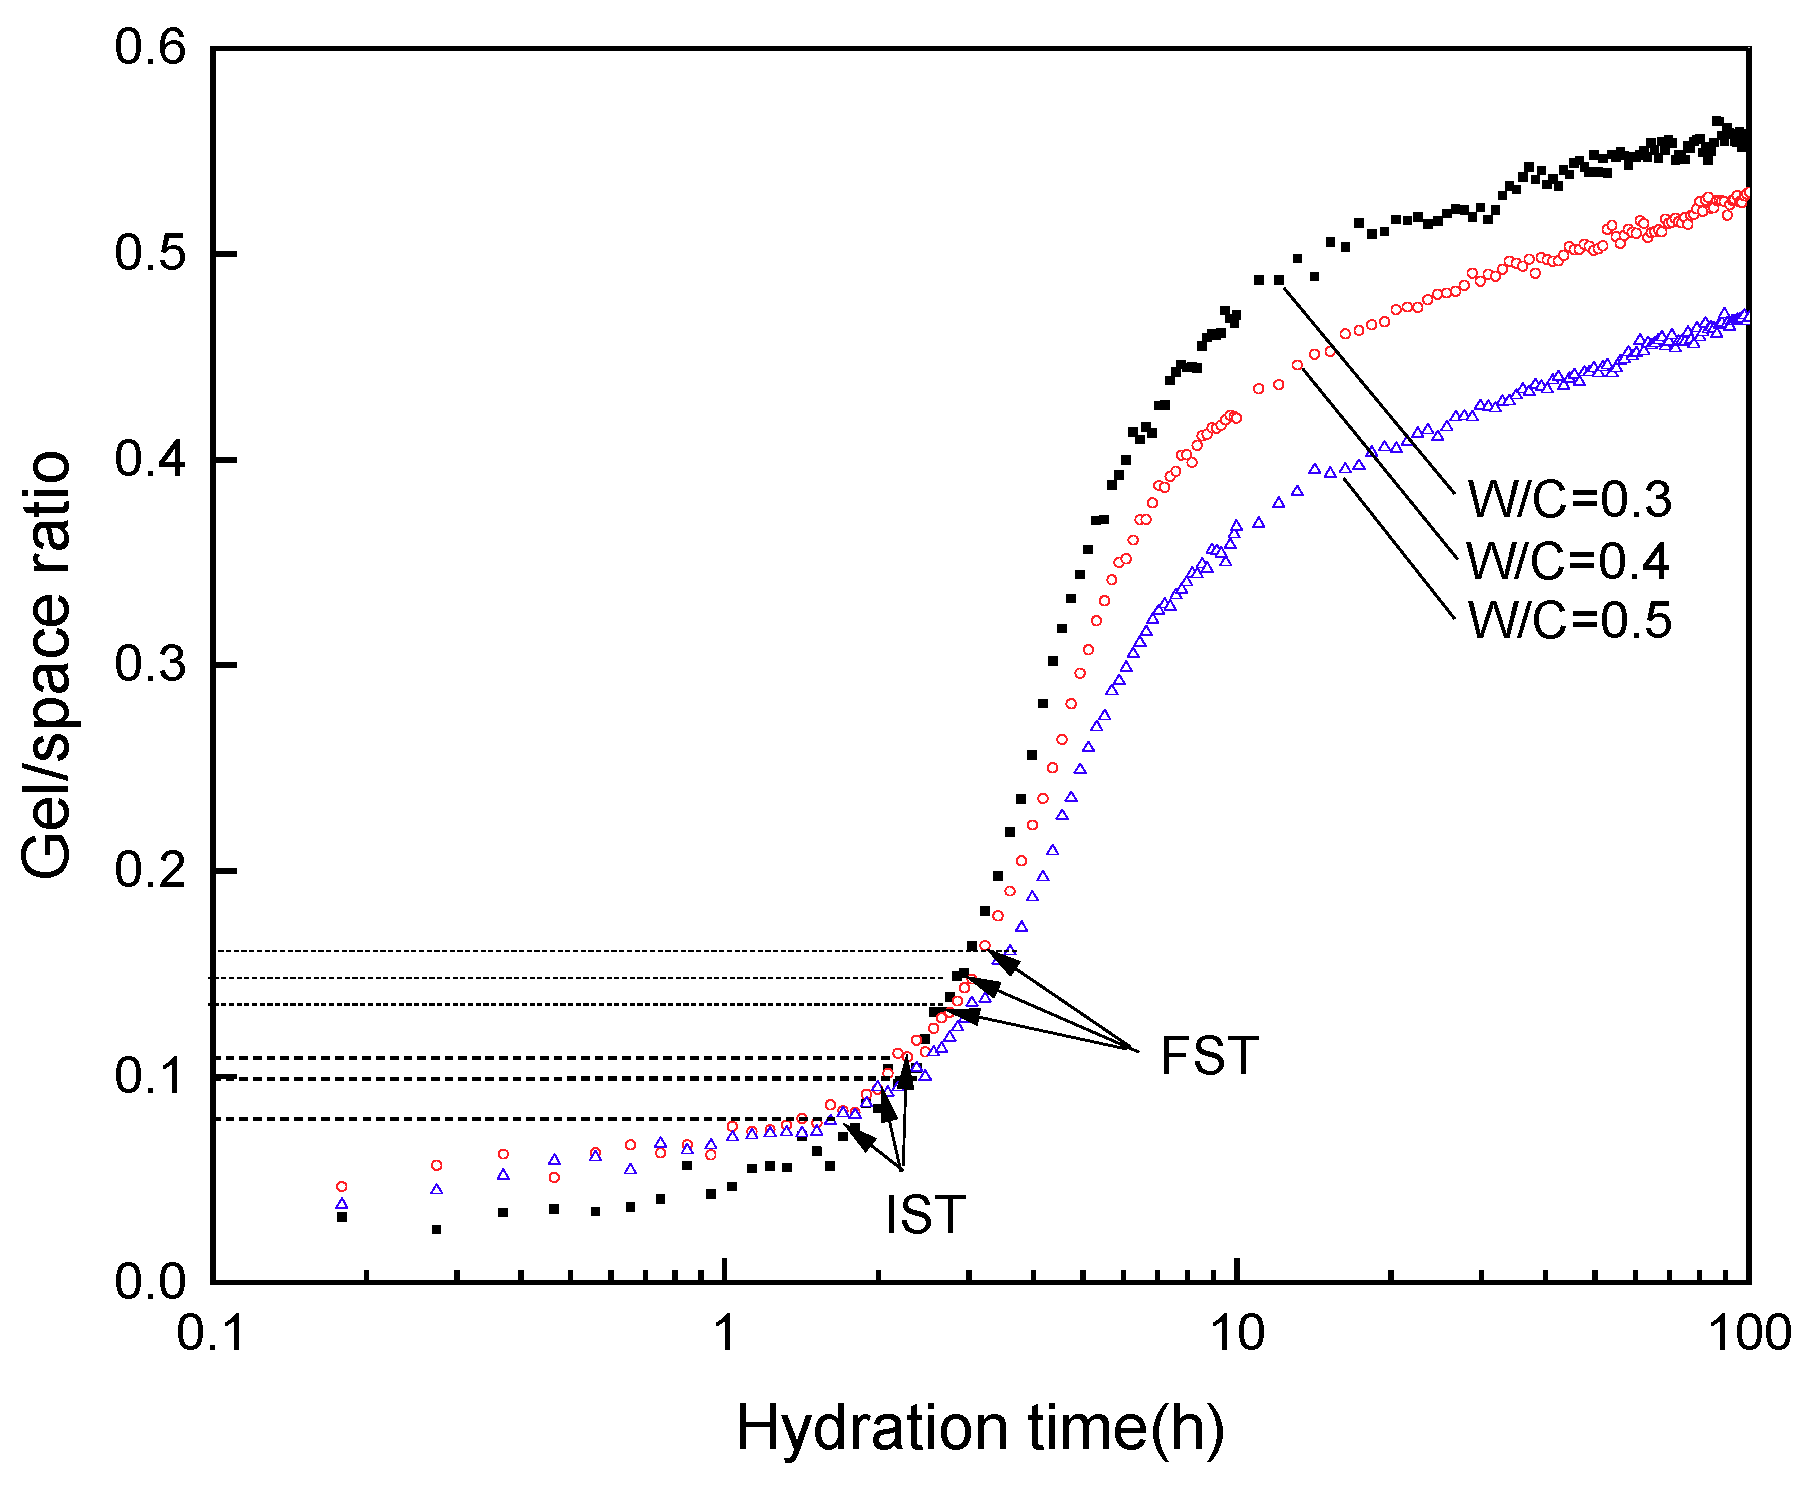
It can be seen from Figure 3 that the initial setting time of the cement paste occurs when the gel/space ratio is 0.09 ± 0.02, and the final setting time appears when the gel/space ratio is 0.15 ± 0.02. Referring to the results of the previous first-order derivative of the NMR signal intensity in Figure 1, it is known that the initial and final setting takes place during the acceleration stage. At this stage, the hydration rate is accelerated, a large amount of hydration products is formed, and the gel/space ratio is also rapidly increased. The results indicate that the initial and final setting is precisely attributed to the gel/space ratio reaching a certain threshold.
Powers [18] proposed the concept of the gel/space ratio, and a typical relationship was then identified between the gel/space ratio and the compressive strength, making it possible to connect the microscopic evolution and the macroscopic properties of cement pastes. It is worth mentioning that Powers’ law was obtained by fitting the compressive strength vs. gel/space ratio for cement-sand mortars. Since the strength of sand is constant, the gel/space ratio is the dominant variable, the increase in strength is mainly due to the cement paste of the increased gel/space ratio. Therefore, Powers model is more sensible for describing the relationship between compressive strength and the gel/space ratio for cement paste, which can be expressed by the following formula:
where σc is the compressive strength; A is a constant, indicating the intrinsic strength of the gel, approximately the theoretical strength of the gel when the gel/space ratio X = 1; n is a fitting parameter. It can be seen from Figure 4 that the measured compressive strength of the cement paste of the three water-to-cement ratios has a good correlation with the calculated gel/space ratio based on the nuclear magnetic signal intensity. It is in a power function relationship and conforms to the Powers model. In this experiment, the value of A is 425 MPa, the value of n ranges between 2.97 and 3.12. Lower water-to-cement ratio results in a larger value of n.
Standard Vicat needle method is time-consuming, discontinuous, while the conventional strength test is destructive, and difficult to test at a very early age due to low rigidity. In contrast, LF-NMR is a fast, non-invasive technique, allowing the study of the cement hydration in real-time. Thus, according to the continuous monitoring of the LF-NMR signal of the evaporable water of the cement paste, the degree of hydration and the gel/space ratio can be accordingly calculated to further determine the initial and final setting times and to predicate the development of the early compressive strength.
4. Conclusions
(1) Based on the LF-NMR technique, the evolution of the evaporable water content of the cement paste during the hydration process can be continuously and non-destructively monitored. The first derivative curve characteristics of the measured transverse magnetization agree well with the known five stages of cement hydration process in the early stages of setting.
(2) According to the change of continuously measured nuclear magnetic signal quantity, the degree of hydration and the gel/space ratio of the cement paste can be accordingly calculated. The initial and final setting of the cement paste in this test appeared when the gel/space ratio are 0.09 ± 0.02 and 0.15 ± 0.02, respectively. It is verified that the early compressive strength of the hardened cement paste exhibits a power function relationship with the calculated gel/space ratio.
(3) By establishing the internal relations between the nuclear magnetic intensity of cement paste and the hydration process, it is possible to provide a new efficient and quick technical way for the determination of the initial and final setting times and prediction of the growth of early compressive strength.
Author Contributions
Conceptualization, W.Y.; formal analysis, D.J.; investigation, Z.L.; methodology, W.Y.; supervision, W.Y.; writing—original draft, D.J.; writing—review and editing, Z.L. and W.Y.
Funding
This research was supported by the Open Fund of State Key Laboratory of Disaster Reduction in Civil Engineering (Grant no. SLDRCE18-05), the Fundamental Research Funds for the Central Universities (22120170261), and sponsored by the International Science and Technology Cooperation Projects of Shanghai (Contract no. 12230708700).
Acknowledgments
Wu Yao, Dan Jin, and Zejun Lang gratefully acknowledge the financial support from the Open Fund of State Key Laboratory of Disaster Reduction in Civil Engineering (Grant no. SLDRCE18-05), the Fundamental Research Funds for the Central Universities (22120170261), and the International Science and Technology Cooperation Projects of Shanghai (Contract no. 12230708700).
Conflicts of Interest
The authors declare no conflict of interest.
References
- Blinc, R.; Burgar, M.; Lahajnar, G.; Rožmarin, M.; Rutar, V.; Kocuvan, I.; Uršič, J. NMR relaxation study of adsorbed water in cement and C3S pastes. J. Am. Ceram. Soc. 1978, 61, 35–37. [Google Scholar] [CrossRef]
- Halperin, W.; Jehng, J.; Song, Y. Application of spin-spin relaxation to measurement of surface area and pore size distributions in a hydrating cement paste. Magn. Reson. Imaging 1994, 12, 169–173. [Google Scholar] [CrossRef]
- Brownstein, K.; Tarr, C. Importance of classical diffusion in NMR studies of water in biological cells. Phys. Rev. A 1979, 19, 2446–2453. [Google Scholar] [CrossRef]
- Jehng, J.; Sprague, D.; Halperin, W. Pore structure of hydrating cement paste by magnetic resonance relaxation analysis and freezing. Magn. Reson. Imaging 1996, 14, 785–791. [Google Scholar] [CrossRef]
- Plassais, A.; Pomies, M.; Lequeux, N. Micropore size analysis in hydrated cement paste by NMR. Magn. Reson. Imaging 2001, 19, 493–495. [Google Scholar] [CrossRef]
- Lam, L.; Wong, Y.; Poon, C. Degree of hydration and gel/space ratio of high-volume fly ash/cement systems. Cem. Concr. Res. 2000, 30, 747–756. [Google Scholar] [CrossRef]
- Barberon, F.; Korb, J.; Petit, D.; Morin, V.; Bermejo, E. Probing the surface area of a cement-based material by nuclear magnetic relaxation dispersion. Phys. Rev. Lett. 2003, 90, 116103. [Google Scholar] [CrossRef] [PubMed]
- Faure, P.; Rodts, S. Proton NMR relaxation as a probe for setting cement pastes. Magn. Reson. Imaging 2008, 26, 1183–1196. [Google Scholar] [CrossRef] [PubMed]
- Yao, W.; She, A.; Yang, P. 1H-NMR relaxation and state evolvement of evaporable water in cement pastes. J. Chin. Ceram. Soc. 2009, 37, 1602–1606. [Google Scholar]
- Valori, A.; McDonald, P.; Scrivener, K. The morphology of C–S–H: Lessons from 1H nuclear magnetic resonance relaxometry. Cem. Concr. Res. 2013, 49, 65–81. [Google Scholar] [CrossRef]
- Mcdonald, P.; Rodin, V.; Valori, A. Characterization of intra- and inter-C–S–H gel pore water in white cement based on an analysis of NMR signal amplitudes as a function of water content. Cem. Concr. Res. 2010, 40, 1656–1663. [Google Scholar] [CrossRef]
- She, A.; Yao, W. Characterization of microstructure and specific surface area of pores in cement paste by low field nuclear magnetic resonance technique. J. Wuhan Univ. Technol. 2013, 28, 11–15. [Google Scholar]
- She, A.; Yao, W. Probing the hydration of composite cement pastes containing fly ash and silica fume by proton NMR spin-lattice relaxation. Sci. Chin. Technol. Sci. 2010, 53, 1471–1476. [Google Scholar] [CrossRef]
- Mitchell, J.; Gladden, L.; Chandrasekera, T. Low-field permanent magnets for industrial process and quality control. Prog. Nucl. Magn. Reson. Spectrosc. 2014, 76, 1–60. [Google Scholar] [CrossRef] [PubMed]
- Pop, A.; Badea, C.; Ardelean, I. The Effects of different superplasticizers and water-to-cement ratios on the hydration of gray cement using T-2-NMR. Appl. Magn. Reson. 2013, 44, 1223–1234. [Google Scholar] [CrossRef]
- Zhao, H.; Qin, X.; Liu, J. Pore structure characterization of early-age cement pastes blended with high-volume fly ash. Constr. Build. Mater. 2018, 189, 934–946. [Google Scholar] [CrossRef]
- Zhou, C.; Ren, F.; Zeng, Q. Pore-size resolved water vapor adsorption kinetics of white cement mortars as viewed from proton NMR relaxation. Cem. Concr. Res. 2018, 105, 31–43. [Google Scholar] [CrossRef]
- Powers, T.C. Structure and physical properties of hardened portland cement paste. J. Am. Ceram. Soc. 1958, 41, 1–6. [Google Scholar] [CrossRef]
- Taylor, H.F.W. Cement Chemistry, 2nd ed.; Thomas Telford: London, UK, 1997; pp. 252–255. [Google Scholar]
- Hobbs, S.V. A Study of Non-Evaporable Water Content in Cement-Based Mixtures with and without Pozzolanic Materials. Ph.D. Thesis, Cornell University, Ithaca, NY, USA, 2000. [Google Scholar]
- Wu, M.; Li, C.; Yao, W. Gel/space ratio evolution in ternary composite system consisting of portland cement, silica fume, and fly ash. Materials 2017, 10, 59. [Google Scholar] [CrossRef] [PubMed]
Figure 1.
The evolution of transverse magnetization during the hydration process.

Figure 2.
Hydration degree during the hydration process.

Figure 3.
Gel/space ratio during the hydration process.

Figure 4.
Relationship between the measured compressive strength and gel/space ratio.

© 2019 by the authors. Licensee MDPI, Basel, Switzerland. This article is an open access article distributed under the terms and conditions of the Creative Commons Attribution (CC BY) license (http://creativecommons.org/licenses/by/4.0/).
Share and Cite
MDPI and ACS Style
Jin, D.; Lang, Z.; Yao, W. Analysis of Early Performance of Cement Paste by Low Field NMR. Appl. Sci. 2019, 9, 896. https://doi.org/10.3390/app9050896
AMA Style
Jin D, Lang Z, Yao W. Analysis of Early Performance of Cement Paste by Low Field NMR. Applied Sciences. 2019; 9(5):896. https://doi.org/10.3390/app9050896
Chicago/Turabian StyleJin, Dan, Zejun Lang, and Wu Yao. 2019. "Analysis of Early Performance of Cement Paste by Low Field NMR" Applied Sciences 9, no. 5: 896. https://doi.org/10.3390/app9050896
Note that from the first issue of 2016, this journal uses article numbers instead of page numbers. See further details here.