In Situ SEM Observation of Structured Si/C Anodes Reactions in an Ionic-Liquid-Based Lithium-Ion Battery


 and
and 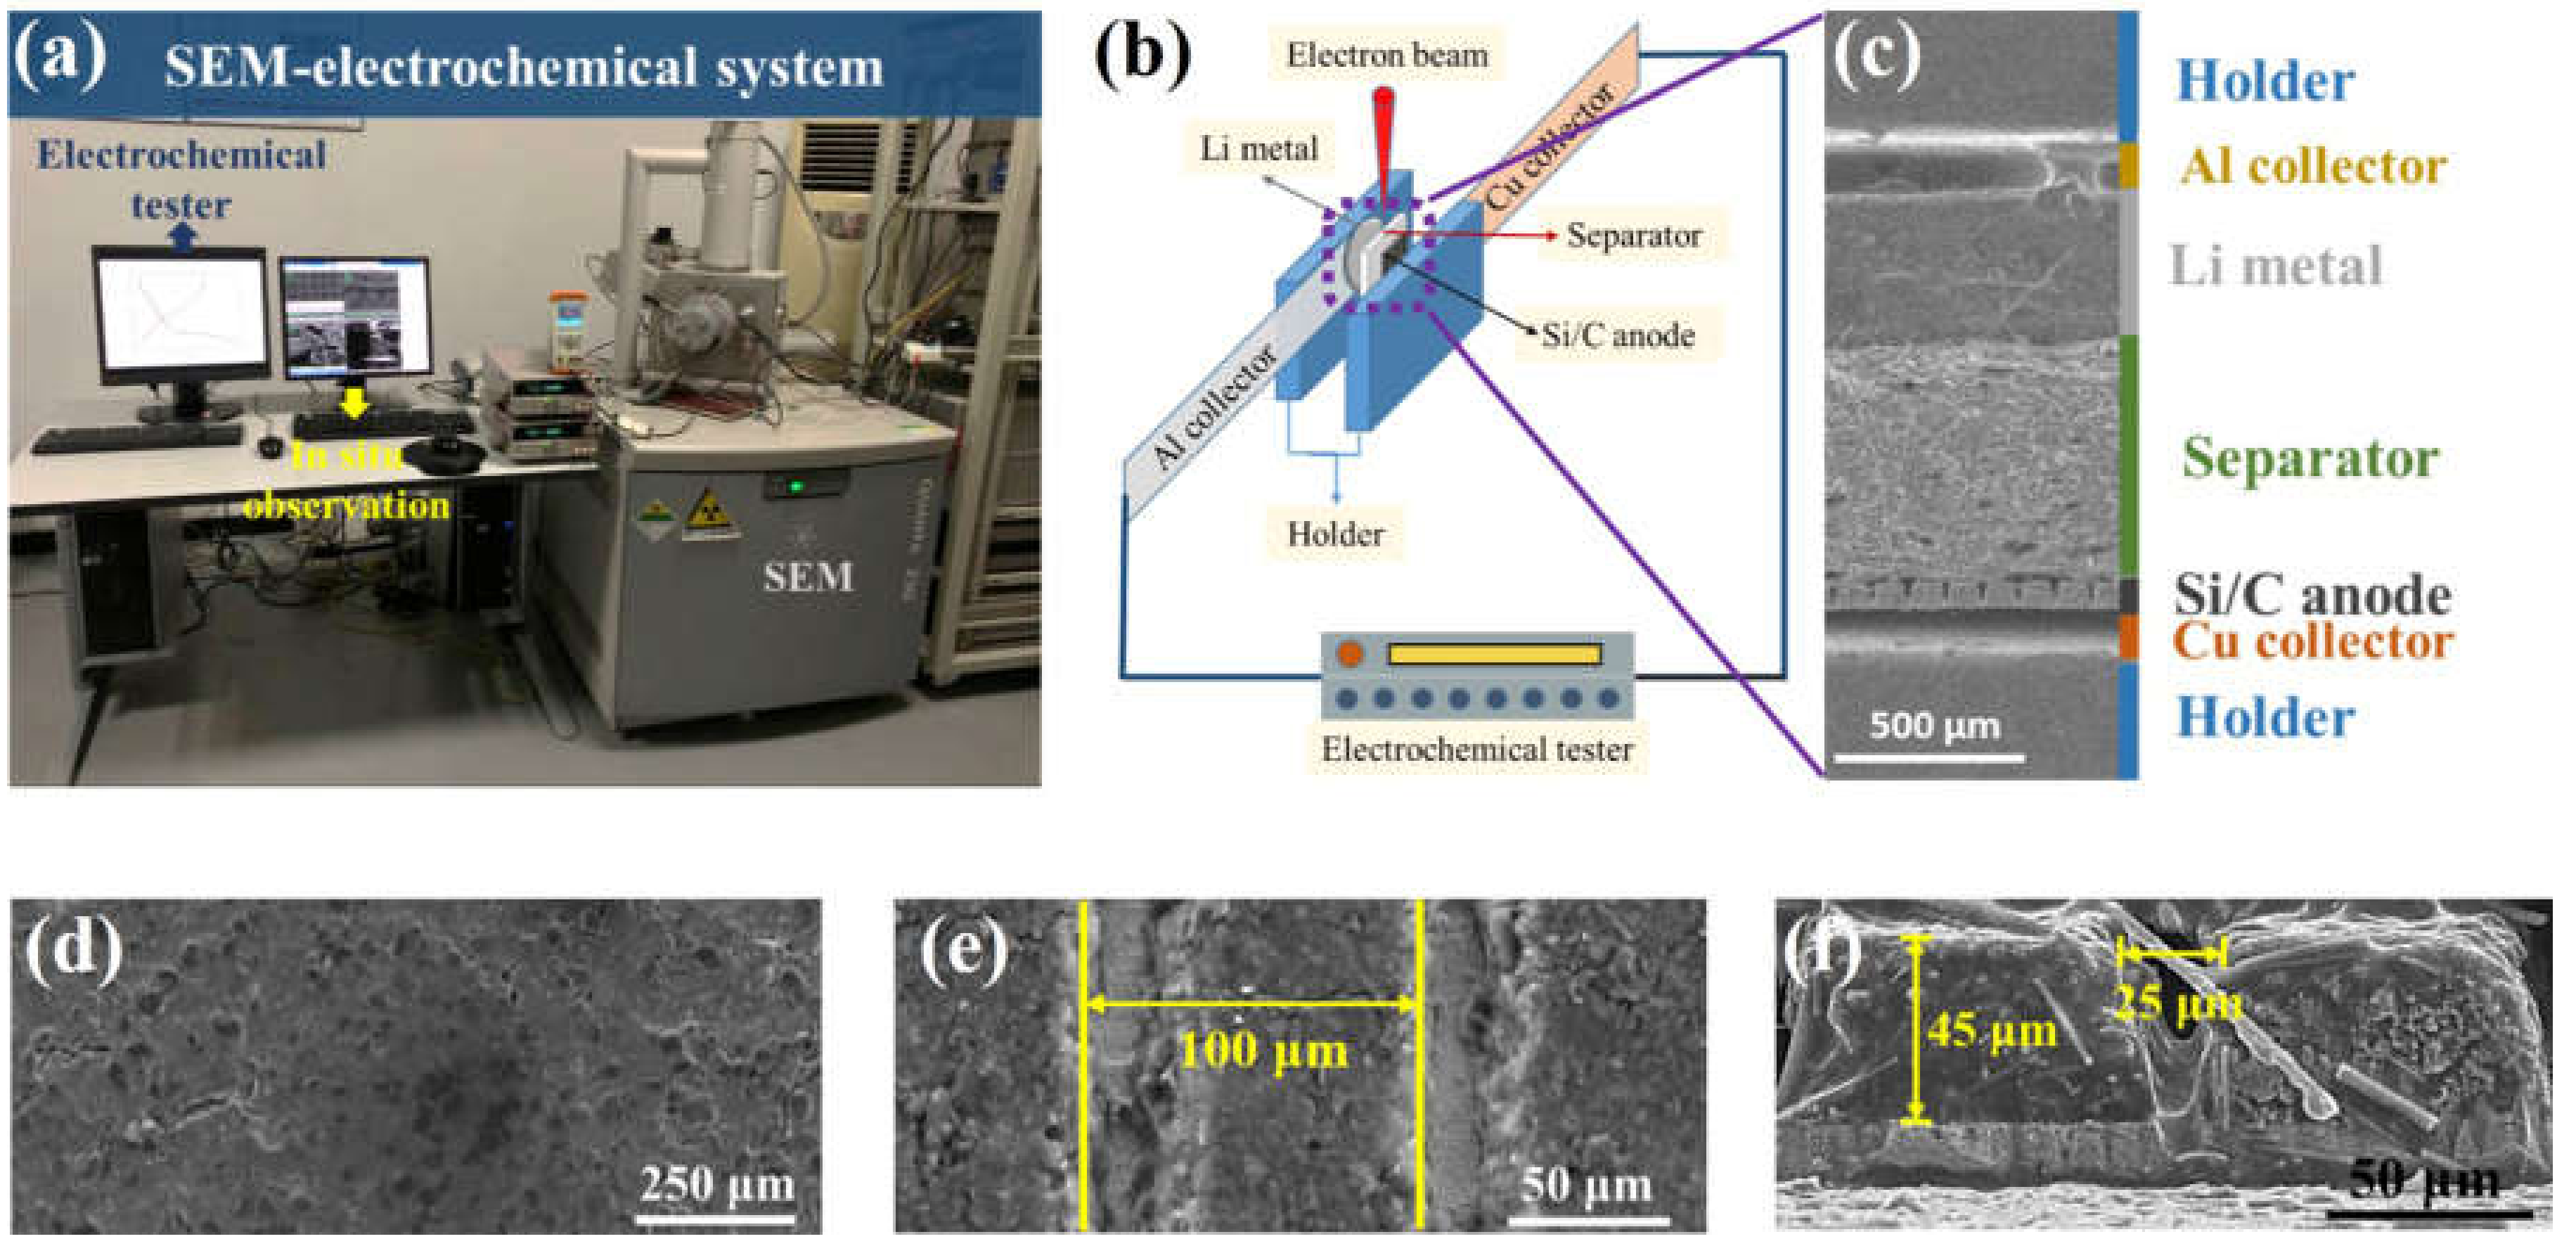
Abstract
:1. Introduction
2. Materials and Methods
2.1. Materials and Preparation
2.2. In Situ SEM Experiments
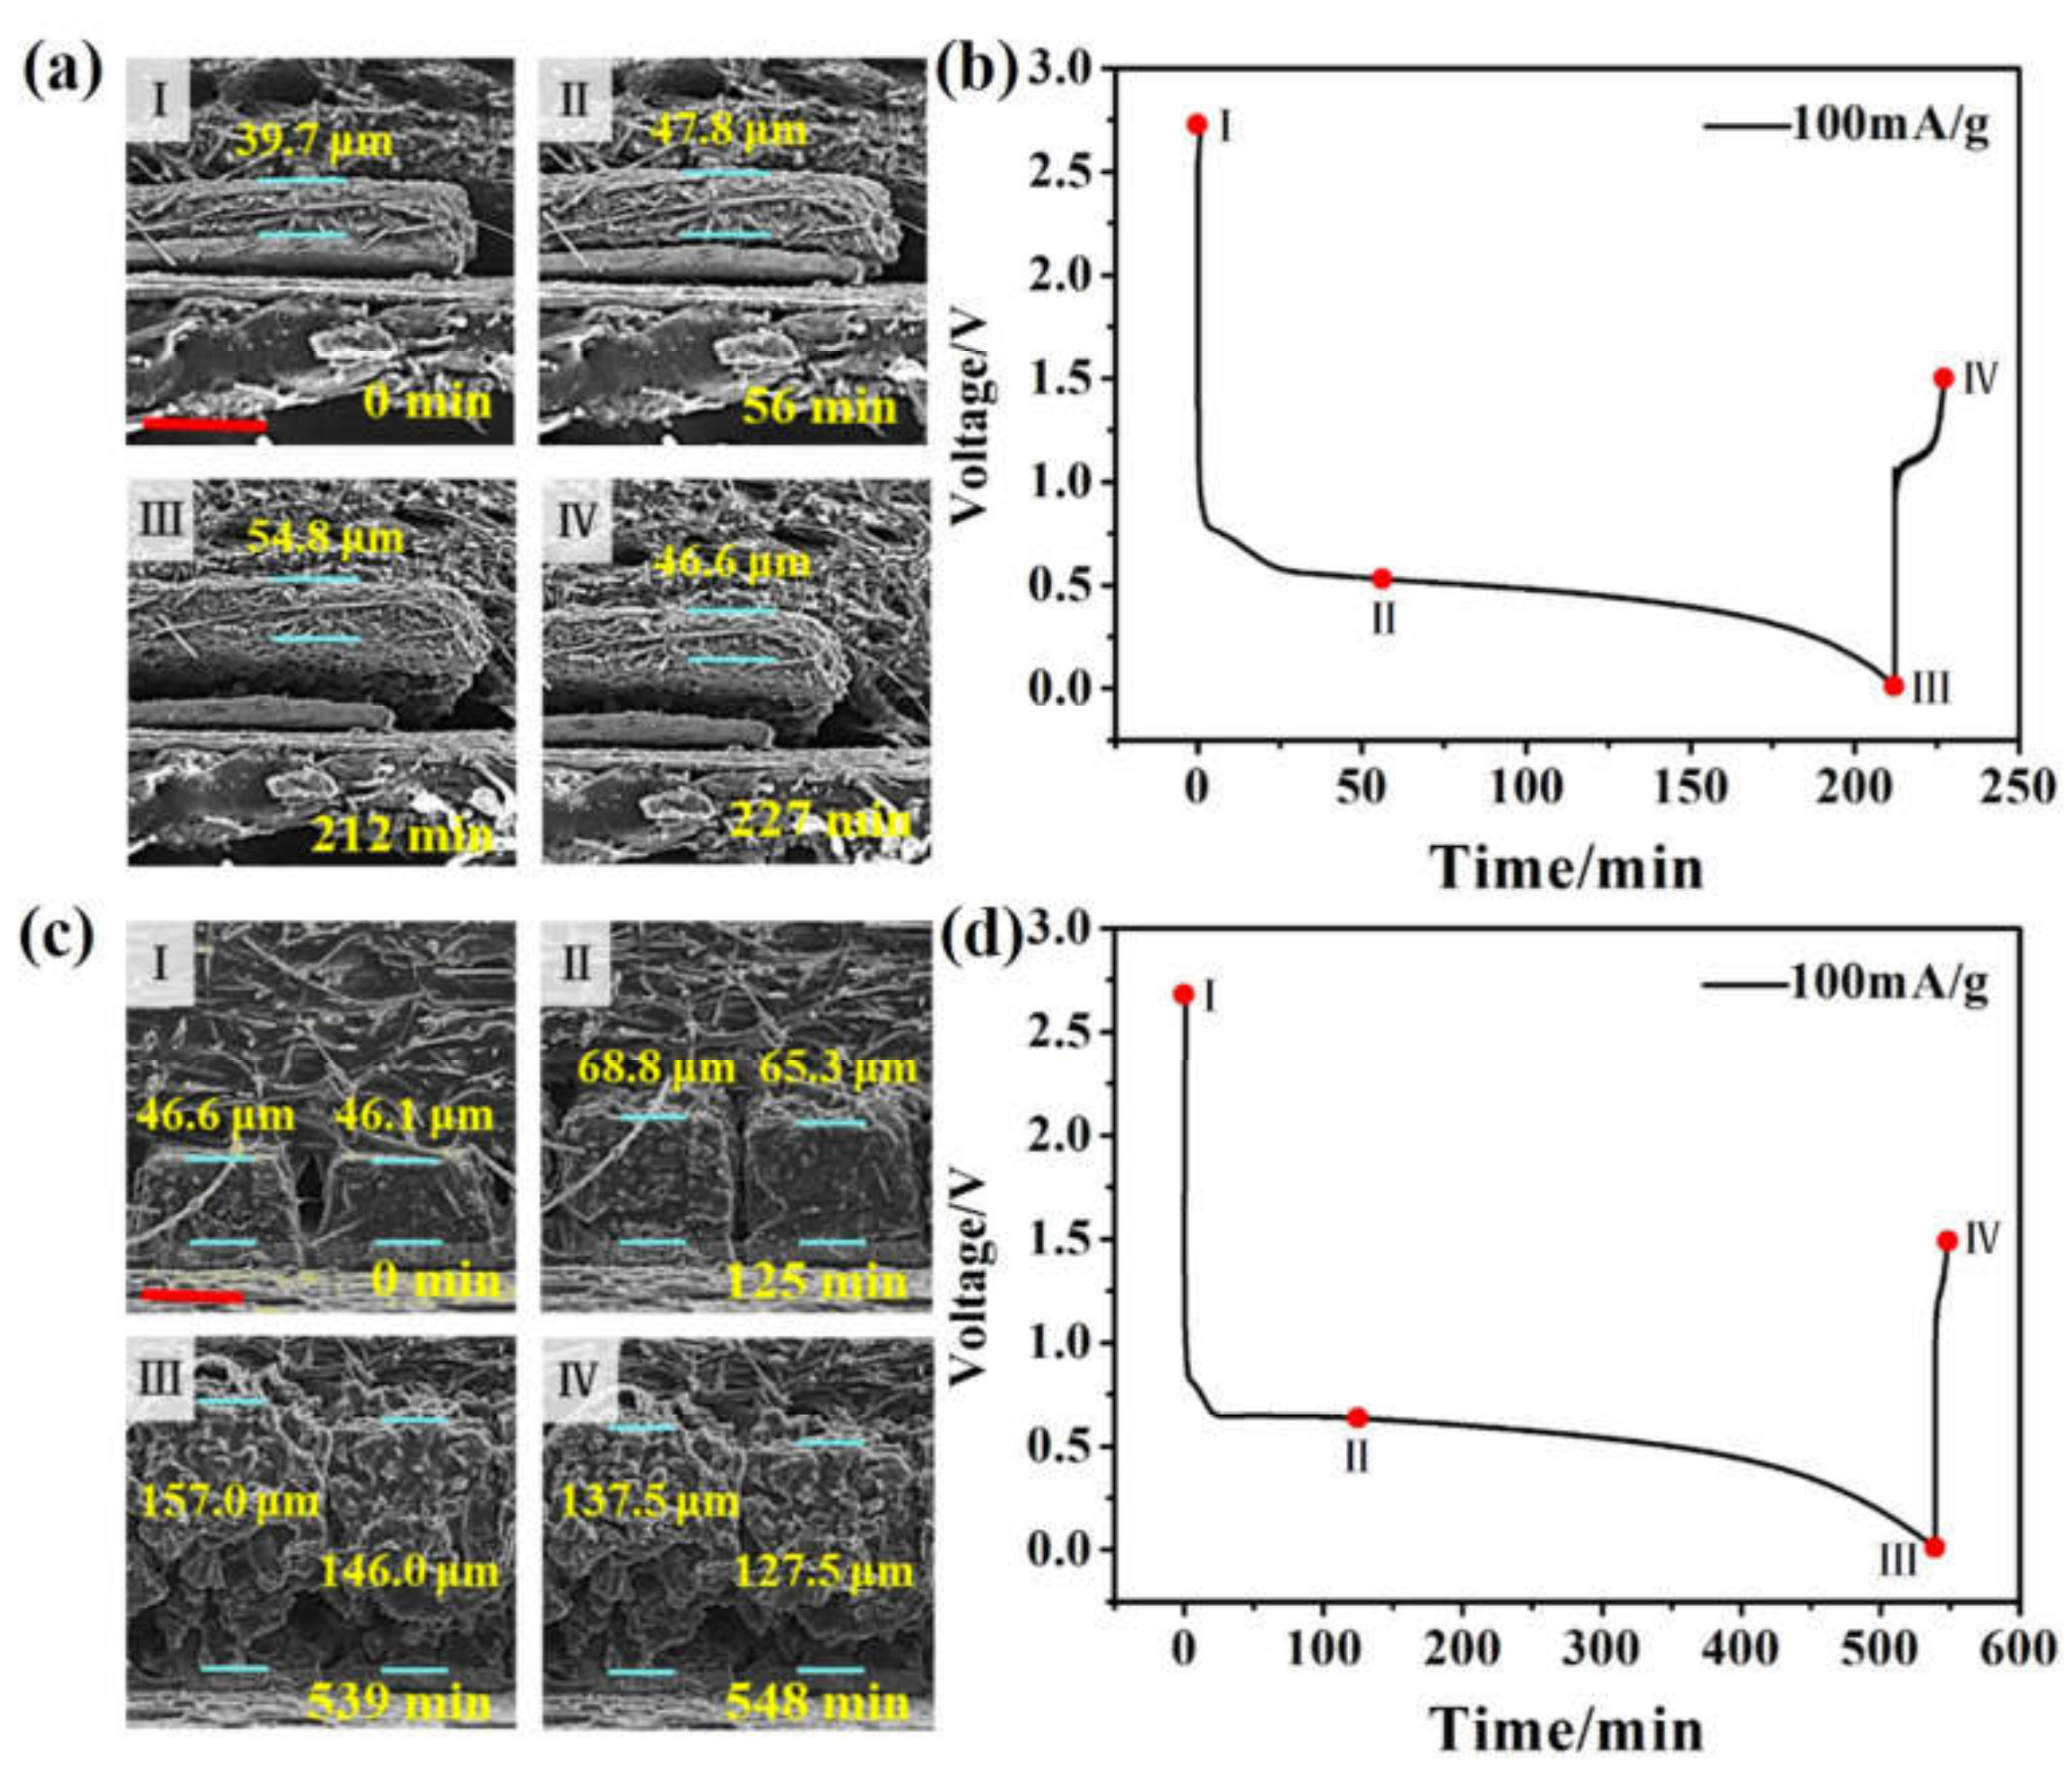
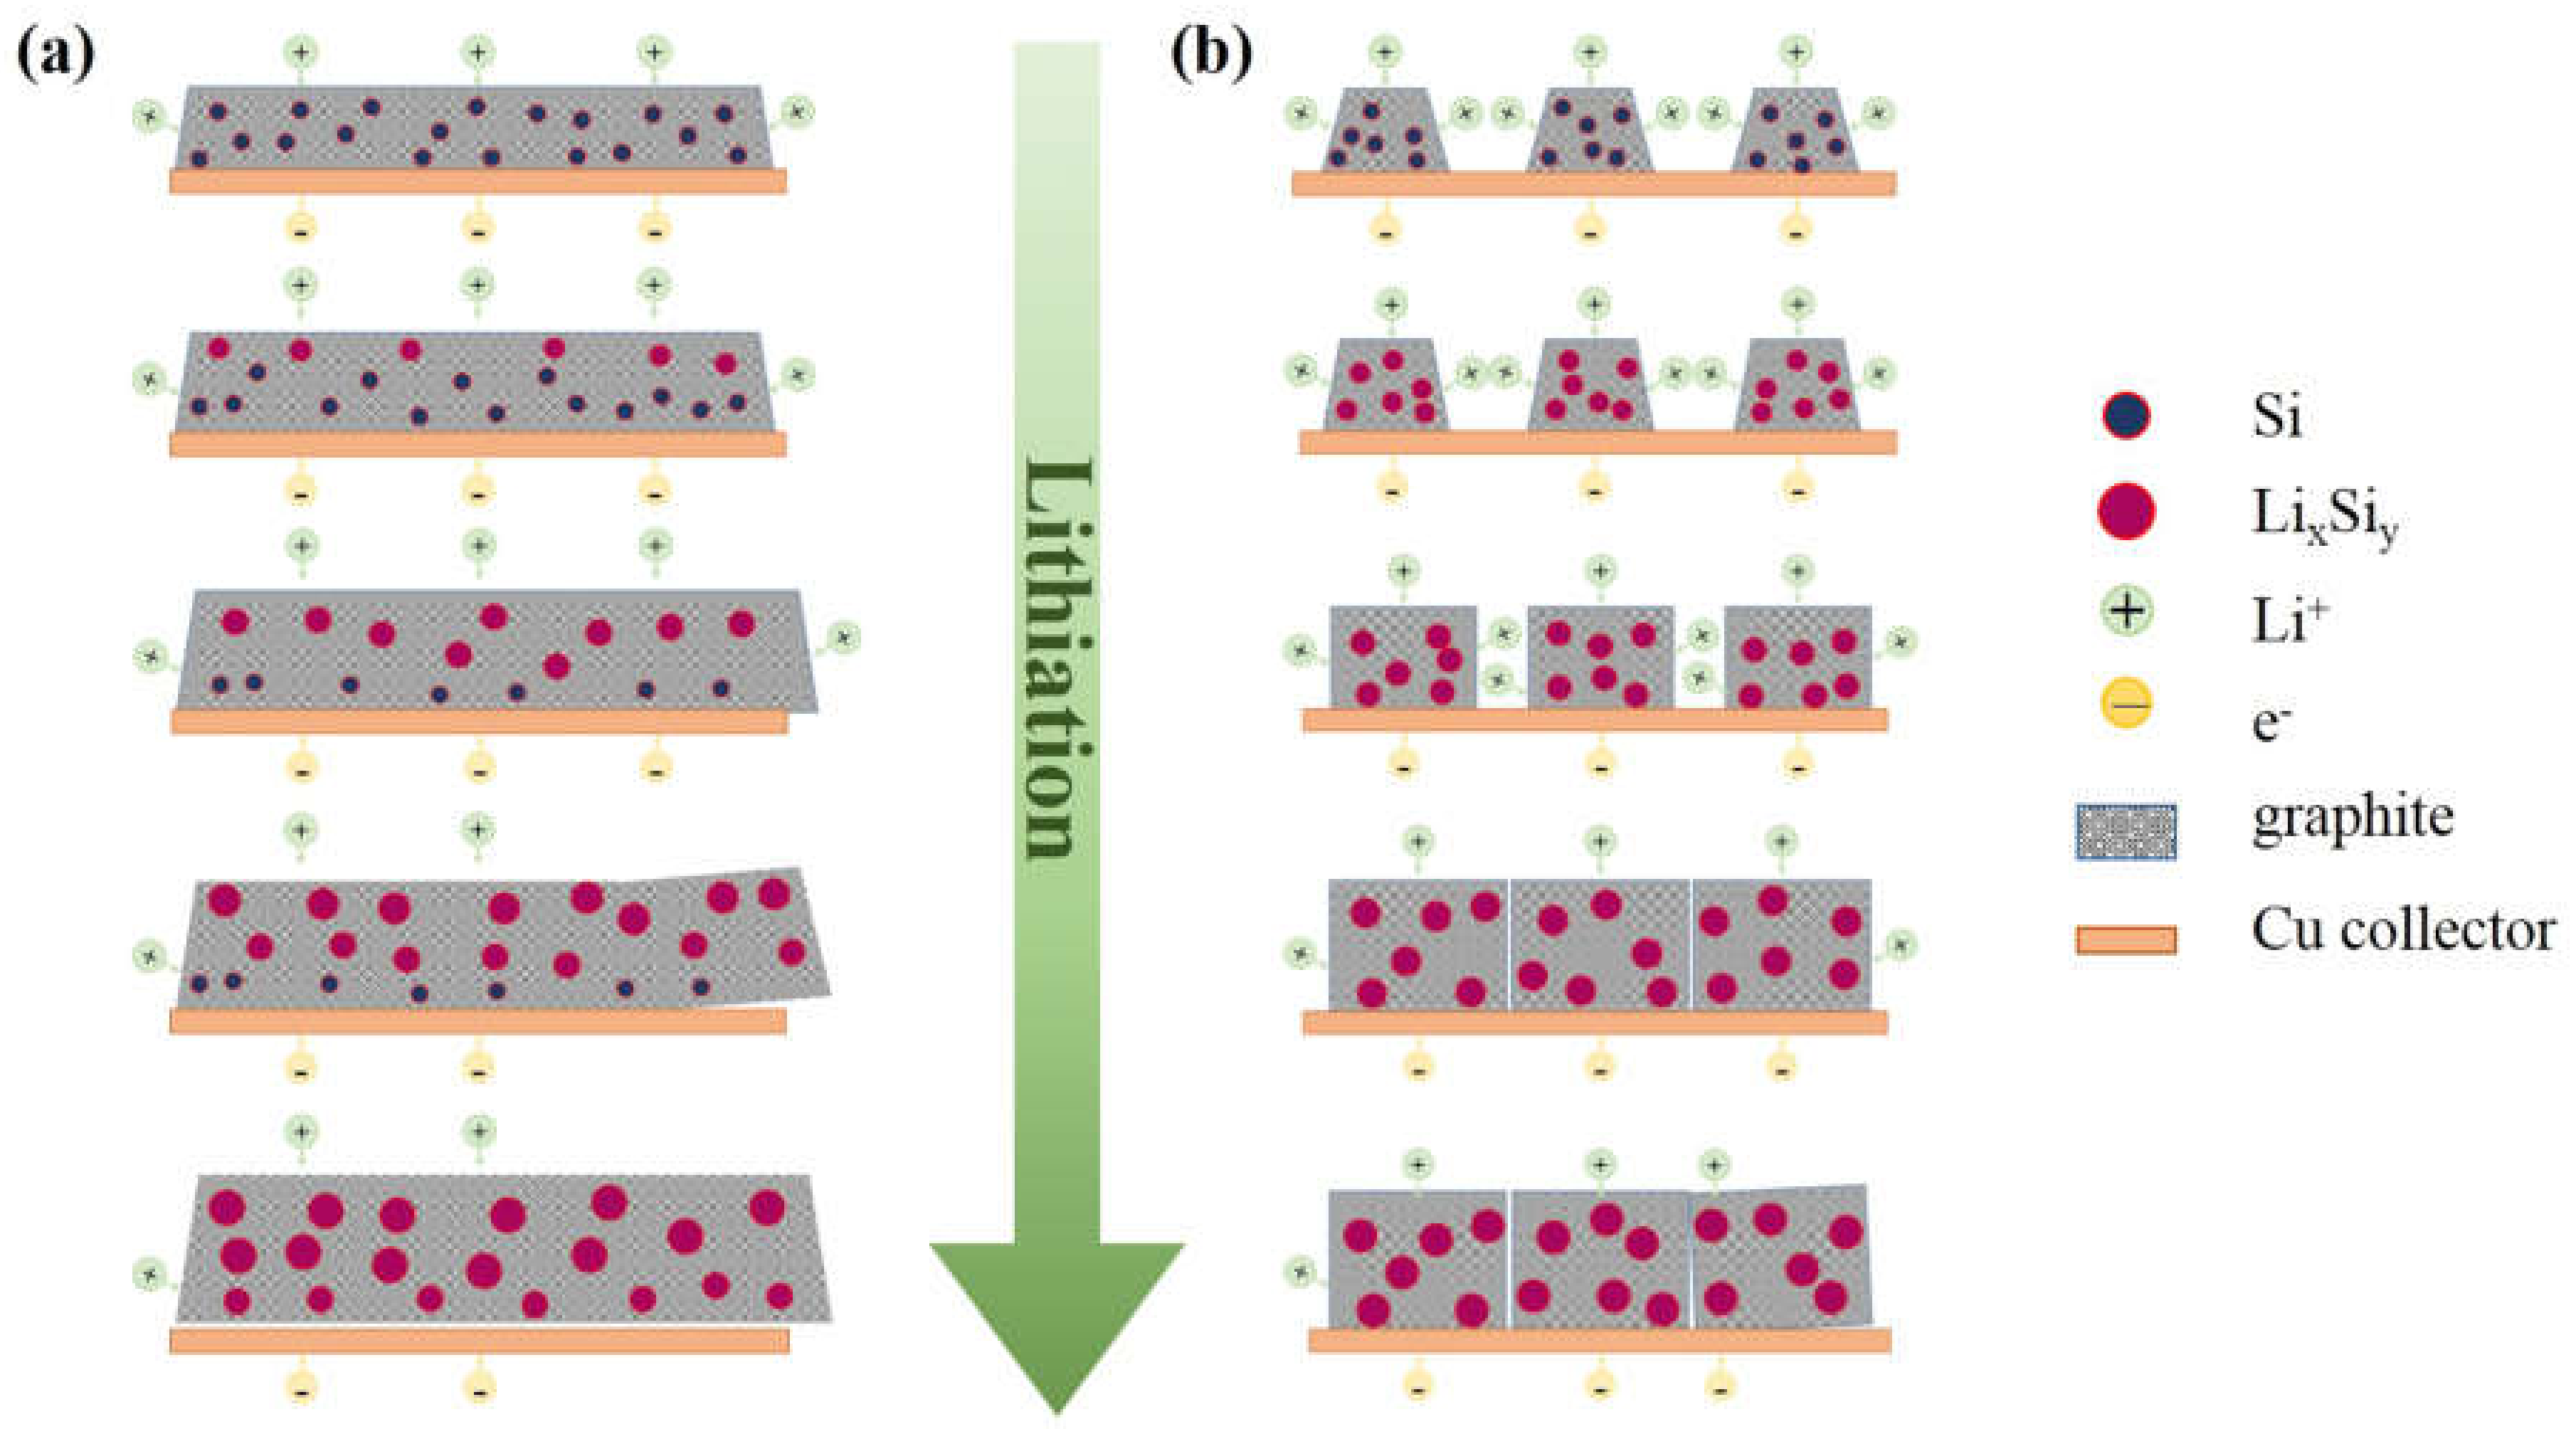
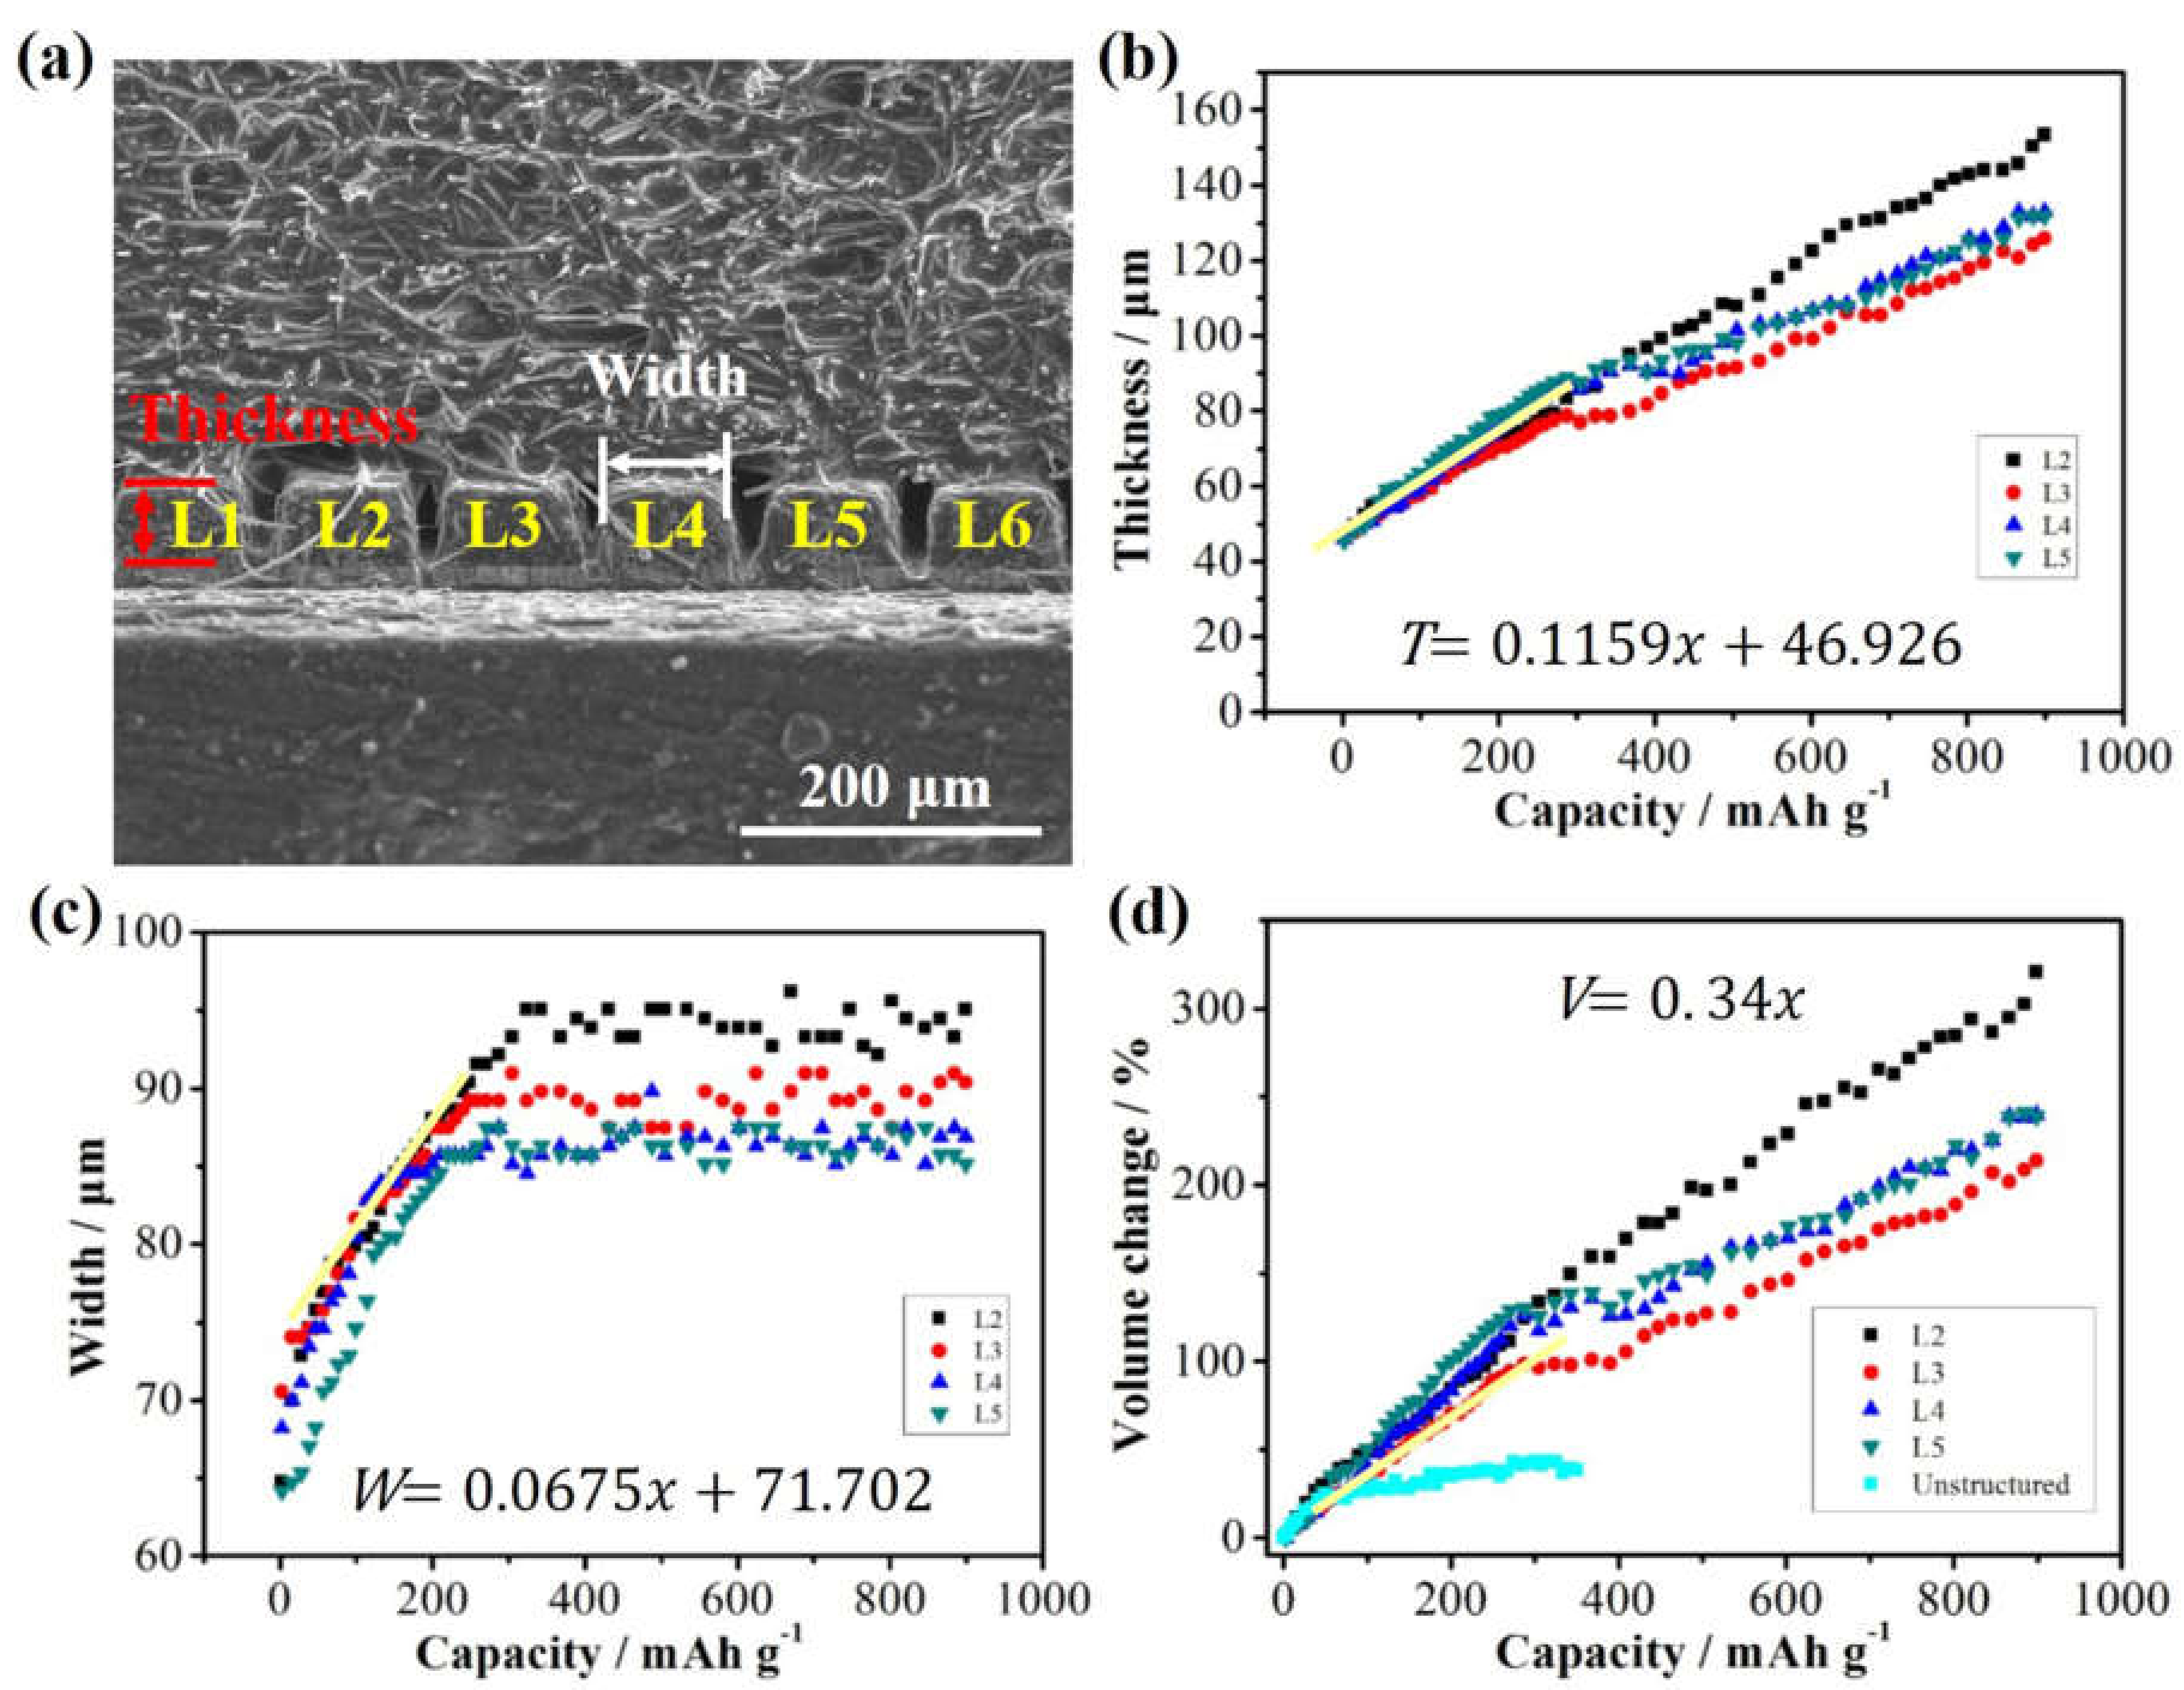
3. Results
4. Conclusions
Supplementary Materials
Author Contributions
Funding
Acknowledgments
Conflicts of Interest
References
- Dunn, B.; Kamath, H.; Tarascon, J.M. Electrical energy storage for the grid: A battery of choices. Science 2011, 334, 928–935. [Google Scholar] [CrossRef] [PubMed]
- Xin, S.; Gu, L.; Zhao, N.H.; Yin, Y.X.; Zhou, L.J.; Guo, Y.G.; Wan, L.J. Smaller sulfur molecules promise better lithium–sulfur batteries. J. Am. Chem. Soc. 2012, 134, 18510–18513. [Google Scholar] [CrossRef] [PubMed]
- Zhang, C.; Wu, H.B.; Yuan, C.; Guo, Z.; Lou, X.W. Confining sulfur in double-shelled hollow carbon spheres for lithium–sulfur batteries. Angew. Chem. 2012, 124, 9730–9733. [Google Scholar] [CrossRef]
- Qie, L.; Chen, W.M.; Wang, Z.H.; Shao, Q.G.; Li, X.; Yuan, L.X.; Hu, X.L.; Zhang, W.X.; Huang, Y.H. Nitrogen-doped porous carbon nanofiber webs as anodes for lithium ion batteries with a superhigh capacity and rate capability. Adv. Mater. 2012, 24, 2047–2050. [Google Scholar] [CrossRef] [PubMed]
- Gao, H.; Goodenough, J.B. An aqueous symmetric sodium-ion battery with NASICON-structured Na3MnTi (PO4) 3. Angew. Chem. 2016, 128, 12960–12964. [Google Scholar] [CrossRef]
- Chan, C.K.; Peng, H.; Liu, G.; McIlwrath, K.; Zhang, X.F.; Huggins, R.A.; Cui, Y. High-performance lithium battery anodes using silicon nanowires. Nat. Nanotechnol. 2008, 3, 31–35. [Google Scholar] [CrossRef] [PubMed]
- Teki, R.; Datta, M.K.; Krishnan, R.; Parker, T.C.; Lu, T.M.; Kumta, P.N.; Koratkar, N. Nanostructured silicon anodes for lithium ion rechargeable batteries. Small 2009, 5, 2236–2242. [Google Scholar] [CrossRef] [PubMed]
- Szczech, J.R.; Jin, S. Nanostructured silicon for high capacity lithium battery anodes. Energy Environ. Sci. 2011, 4, 56–72. [Google Scholar] [CrossRef]
- Luo, F.; Liu, B.; Zheng, J.; Chu, G.; Zhong, K.; Li, H.; Huang, X.; Chen, L. Nano-silicon/carbon composite anode materials towards practical application for next generation Li-ion batteries. J. Electron. Soc. 2015, 162, A2509–A2528. [Google Scholar] [CrossRef]
- Pasta, M.; Wessells, C.D.; Liu, N.; Nelson, J.; McDowell, M.T.; Huggins, R.A.; Toney, M.F.; Cui, Y. Full open-framework batteries for stationary energy storage. Nat. Commun. 2014, 5, 3007. [Google Scholar] [CrossRef] [PubMed]
- Lim, D.G.; Chung, D.W.; Kohler, R.; Proell, J.; Scherr, C.; Pfleging, W.; García, R.E. Designing 3D conical-shaped lithium-ion microelectrodes. J. Electron. Soc. 2014, 161, A302–A307. [Google Scholar] [CrossRef]
- Pikul, J.H.; Zhang, H.G.; Cho, J.; Braun, P.V.; King, W.P. High-power lithium ion microbatteries from interdigitated three-dimensional bicontinuous nanoporous electrodes. Nat. Commun. 2013, 4, 1732. [Google Scholar] [CrossRef] [PubMed]
- Zhang, H.; Yu, X.; Braun, P.V. Three-dimensional bicontinuous ultrafast-charge and-discharge bulk battery electrodes. Nat. Nanotechnol. 2011, 6, 277. [Google Scholar] [CrossRef] [PubMed]
- Kim, J.S.; Pfleging, W.; Kohler, R.; Seifert, H.J.; Kim, T.Y.; Byun, D.; Jung, H.; Choi, W.; Lee, J.K. Three-dimensional silicon/carbon core–shell electrode as an anode material for lithium-ion batteries. J. Power Sources 2015, 279, 13–20. [Google Scholar] [CrossRef]
- Mangang, M.; Seifert, H.J.; Pfleging, W. Influence of laser pulse duration on the electrochemical performance of laser structured LiFePO4 composite electrodes. J. Power Sources 2016, 304, 24–32. [Google Scholar] [CrossRef]
- Zhang, G.; Xiong, T.; He, L.; Yan, M.; Zhao, K.; Xu, X.; Mai, L. Electrochemical in situ X-ray probing in lithium-ion and sodium-ion batteries. J. Mater. Sci. 2017, 52, 3697–3718. [Google Scholar] [CrossRef]
- Yamamoto, K.; Minato, T.; Mori, S.; Takamatsu, D.; Orikasa, Y.; Tanida, H.; Nakanishi, K.; Murayama, H.; Masese, T.; Mori, T.; Arai, H.; Koyama, Y.; Ogumi, Z.; Arai, H. Improved cyclic performance of lithium-ion batteries: an investigation of cathode/electrolyte interface via in situ total-reflection fluorescence x-ray absorption spectroscopy. J. Phys. Chem. C 2014, 118, 9538–9543. [Google Scholar] [CrossRef]
- Dolotko, O.; Senyshyn, A.; Mühlbauer, M.J.; Nikolowski, K.; Ehrenberg, H. Understanding structural changes in NMC Li-ion cells by in situ neutron diffraction. J. Power Sources 2014, 255, 197–203. [Google Scholar] [CrossRef]
- Pecher, O.; Carretero-González, J.; Griffith, K.J.; Grey, C.P. Materials’ methods: NMR in battery research. Chem. Mater. 2016, 29, 213–242. [Google Scholar] [CrossRef]
- Zheng, Y.; Smyrek, P.; Rakebrandt, J.H.; Kübel, C.; Seifert, H.J.; Pfleging, W. Fabrication and characterization of silicon-based 3D electrodes for high-energy lithium-ion batteries. In Laser-Based Micro-and Nanoprocessing XI; International Society for Optics and Photonics: Bellingham WA, USA, 2014; Volume 10092, p. 100920L. [Google Scholar]
- Ishikawa, M.; Sugimoto, T.; Kikuta, M.; Ishiko, E.; Kono, M. Pure ionic liquid electrolytes compatible with a graphitized carbon negative electrode in rechargeable lithium-ion batteries. J. Power Sources 2006, 162, 658–662. [Google Scholar] [CrossRef]
- Sugimoto, T.; Kikuta, M.; Ishiko, E.; Kono, M.; Ishikawa, M. Ionic liquid electrolytes compatible with graphitized carbon negative without additive and their effects on interfacial properties. J. Power Sources 2008, 183, 436–440. [Google Scholar] [CrossRef]


© 2019 by the authors. Licensee MDPI, Basel, Switzerland. This article is an open access article distributed under the terms and conditions of the Creative Commons Attribution (CC BY) license (http://creativecommons.org/licenses/by/4.0/).
Share and Cite
Shi, H.; Liu, X.; Wu, R.; Zheng, Y.; Li, Y.; Cheng, X.; Pfleging, W.; Zhang, Y. In Situ SEM Observation of Structured Si/C Anodes Reactions in an Ionic-Liquid-Based Lithium-Ion Battery. Appl. Sci. 2019, 9, 956. https://doi.org/10.3390/app9050956
Shi H, Liu X, Wu R, Zheng Y, Li Y, Cheng X, Pfleging W, Zhang Y. In Situ SEM Observation of Structured Si/C Anodes Reactions in an Ionic-Liquid-Based Lithium-Ion Battery. Applied Sciences. 2019; 9(5):956. https://doi.org/10.3390/app9050956
Chicago/Turabian StyleShi, Huifeng, Xianqiang Liu, Rui Wu, Yijing Zheng, Yonghe Li, Xiaopeng Cheng, Wilhelm Pfleging, and Yuefei Zhang. 2019. "In Situ SEM Observation of Structured Si/C Anodes Reactions in an Ionic-Liquid-Based Lithium-Ion Battery" Applied Sciences 9, no. 5: 956. https://doi.org/10.3390/app9050956