A Multi–Level Approach for Simulation of Storage and Respiration of Produce


Department of Mechanical & Materials Engineering, Western University, London, ON N6A 5B9, Canada
*
Author to whom correspondence should be addressed.
Appl. Sci. 2019, 9(6), 1052; https://doi.org/10.3390/app9061052
Submission received: 24 January 2019
/
Revised: 19 February 2019
/
Accepted: 6 March 2019
/
Published: 13 March 2019
(This article belongs to the Special Issue Engineering Methods for Packaging Design of Perishable Products)
Abstract
:Featured Application
Design of produce storage facilities.
Abstract
A produce gas respiration model and fruit-stack geometric digital generation approach is used with commercial CFD software (ANSYS CFXTM) to conduct shape-level simulations of the fluid flow, heat and respiration processes that occur during the storage of produce, with the ultimate purpose of providing detailed information that can be used to develop closure coefficients for volume-averaged simulations. A digital generation procedure is used to develop an accurate representation of the shapes of the different produce. The produce shapes are then implemented into a discrete element modelling tool to generate a randomly-distributed stack of produce in a generic container, which is then utilized as a representative elementary volume (REV) for simulations of airflow and respiration. Simulations are first conducted on single pieces of produce and compared to a recently published experimental data for tomatoes and avocadoes to generate coefficients for the respiration model required for the shape-level simulations on the REV. The results of the shape-level simulation are then processed to produce coefficients that can be used for volume-averaged (porous-continuum-level) calculations, which are much more practical for simulations of large areas of storage comprised of hundreds or thousands of boxes of different commodities. The results show that the multi-level approach is a viable means for developing the simulation parameters required to study refrigeration, ripening and storage/transport of produce.
1. Introduction
Research continues to be directed towards food processing, refrigeration and storage. Phenomena of moisture loss and food respiration, and metabolic processes like ripening and transpiration are generally the focus with interest in maximizing the efficiency of transportation and increasing the shelf life of produce, meat, and other products. Computational fluid dynamics (CFD) is a design tool that is used to simulate airflow and heat/mass transfers and can be used to provide information related to the study and optimization of such processes. The present work describes a CFD approach for studying respiration and ventilation in the bulk storage of produce. The approach includes parameterization of produce shape, introduction of a model to generate packing arrangements, development of a respiration model for produce-level simulations on single commodities, simulation of full crates at the produce-level (the representative elemental volume REV), and an extension to porous continuum modelling, which facilitates the modelling of large quantities of packed produce. The approach is used to simulate arrangements of tomatoes and avocadoes, given the availability of experimental data for validation.
As alluded to above, CFD modelling can be used to study details of individual pieces of produce, a packing arrangement of produce pieces, or an entire region of packed produce by consideration of it as a so-called porous continuum. While the porous continuum approach enables simulation of large regions for design and processing purposes, it requires that the regions containing the packed goods or produce be relegated to simple volumes with interstitial properties that characterize the influence of the packed structure on flow. Studies at the shape-level (or produce-level) are classified as “microscopic”, whereas studies conducted at the porous-continuum level are classified as “macroscopic”. For microscopic simulations of one or more pieces, the point equations for mass, momentum and energy conservation coupled with turbulence must be solved on a computational mesh that is fine enough to resolve all details of the flow and mass/energy exchanges between the produce and the surrounding air. For macroscopic calculations, the transport equations are volume-averaged and the influence of the detailed shape and packing arrangement are characterized by drag and exchange models, which require closure coefficients. The closure process can be either physically based, which depends on selection of a representative elementary volume (REV) of the porous media [1,2], or empirical in that it depends on experimental verification and sensitivity analysis of closure parameters [3,4].
An REV is defined as a small volume that is representative of the internal structure of a larger domain. REVs can be comprised of hundreds (e.g., produce crates), thousands or millions (e.g., pores inside metal foams) of like shapes packed in some arrangement that may or may not have a repeating pattern. The choice of an REV is not always an easy task since it needs to be representative of the geometry in question. In the present study, we consider a packed crate (or box) of irregularly shaped produce as the REV, since this is a “repeating” pattern in a storage facility. For simulated results of such a REV to be accurate, the shapes of the produce in the REV must be representative of the produce considered. While a spherical shape may be adopted to characterize produce like apples [3,4], the deviation from sphericity is significant in cases of strawberries [5], avocadoes [6] and for certain types of tomatoes and many other fruits and vegetables. Within the general area of porous media characterization and modelling, there has been significant effort directed over the past decades towards development of idealized shape models. The basic unit cube model [7] is possibly the simplest three-dimensional geometric idealization of a porous material comprised of spheres and is created by placing a sphere inside a cube, and then increasing its diameter until the desired porosity is achieved. The geometry is extremely simple and can be used for either spherical void materials or for packed spheres (if the sphere diameter is set equal to the cube side length and the sphere is assumed solid). The model makes it easy to analytically calculate parameters such as porosity and interstitial surface area, but Yu et al. [7] found that estimates of the permeability led to pressure drops that were unrealistically low, mainly due to the ordered orientation that the model produces. Other authors also used simple cubic packing to build a channel containing a large number of particles to study heat transfer and pressure drop [8,9]. Moving away from ordered geometric idealizations, a study undertaken by Soulaine [10] computed the flow and heat transfer in a saturated REV micromodel, which was obtained from a 3D micro-CT image following the procedure described in [11]. Dyck and Straatman [1] developed a model that creates a region of variable-sized spheres randomly arranged to produce a foam structure with a specified pore-size and porosity. This model incorporates YADE (Yet Another Development Engine) [12] and produces geometric models that yield far superior simulated results in terms of pressure drop and convective heat transfer compared to prior work [12]. YADE is an open source discrete element modelling (DEM) framework, which is commonly used to study solid particle packing problems. The particles may deform or interact together based on kinematics and force analysis. Herein, and similar to the work of Dyck and Straatman [1], it is used to create packing of objects that results in a porous media representative elemental volume. Because of the generic nature of the model by Dyck and Straatman [1], it is also possible to incorporate porosity gradient and shape effects, which makes it an attractive tool for the present study. To this end, the digital geometry generation model developed by Dyck and Straatman [1] is extended herein to generate packing arrangements suitable for produce modelling.
To simulate metabolic processes that occur under storage conditions, consideration of the produce-to-air interaction is also required. In essence, this requires that an inner-produce model be implemented to characterize gas respiration processes; i.e., CO2/O2 gas exchange and heat exchanges that occur between the produce and surrounding air during respiration and transpiration [13,14,15,16]. It is also important to characterize other gas exchanges like ethylene (C2H4) due to its major role in the ripening of some fruits and vegetables [17,18]. The metabolic process of respiration and gas emission in fruits and vegetables is a function of many factors, including the nature of the crop itself—i.e., whether it is climacteric (ripens after harvest) or non-climacteric fruits (does not ripen further after harvest) [17,18,19,20]—however, it is mainly dependent upon the composition of the atmosphere around the fruit in terms of concentrations of oxygen and carbon dioxide (mainly) and the temperature of storage [21,22,23]. Predictions of ethylene emission from fruits and vegetables is important and affects the process of ripening and shelf-life significantly [18,19,24].
This article presents an approach to model respiration and transpiration processes for stored produce. The work is considered an application/extension of porous media modelling tools; however, it is specifically directed towards produce, which necessitates revisiting of shape idealization and packing to achieve a proper REV and exchange process modelling. The following sections will focus on the digital characterization of produce, development of a simple inner-produce gas respiration model validated by a study of single pieces of produce (tomato and avocado), the development and simulation of a REV of packed produce (which includes a generic crate geometry), and processing to establish coefficients from the shape-level results for use in porous continuum simulations of stored produce.
2. Digital Characterization of Produce Shape
Digital representations of tomatoes and avocadoes are introduced in this section. The assumption of spherical fruits has been often used in the literature; for example, for apples [3,4] and oranges [25]. Semi-symmetrical fruits have also been mathematically described using Fourier series approximations of the boundaries. This family of approaches was utilized for tomatoes [26], apples and pears [27]. While these approaches are mathematically accurate, they provide a high degree of complexity and they were not utilized for simulations where the numbers of produce were large because of the difficulty of CFD discretization. Strawberries have been represented as well [5] using profile blending techniques for different cross sections, but they were very few in numbers per individual stacks, making the CFD discretization process tolerable.
In the present work, a procedure has been developed that uses profile blending with a discrete element technique to provide a produce shape that is representative of the produce, and that can be used with the YADE discrete modelling tool [12] to produce REVs with many pieces for CFD discretization and simulation. The procedure for shape generation is based on the following steps:
- Photographs of the fruit of interest were acquired for different random shapes. From these photographs, the outer edges were extracted as a series of points using graph digitization (see Figure 1 showing extracted points from tomatoes and avocadoes).
- Each profile was scaled uniformly such that the centerline height of each fruit was a reference length of 1 and then divided along the centerline (the axis connecting the stalk and stamen) to produce two half profiles.
- Each half profile was fitted to an appropriate spline curve using the Scipy function splprep in the python module Scipy.interpolate [28] to obtain a suitable smooth representation of the half profile, as shown in Figure 1. The spline representations were stored to be used to generate 3D geometric models.
Each fruit template was generated as follows:
- A random permutation of four half-profiles was selected from the set of half profiles produced in the above procedure. This was achieved by shuffling the elements of the array of assigned profile indices in the python script so that a number of unique shapes for tomatoes and avocadoes is created by selecting a different set of half-profiles each time a sample of produce is made. Four half profiles were needed to produce realistic shapes for each commodity considered.
- A macro was used to sketch the selected spline profiles in SolidworksTM [29]; the sketches were spaced evenly around a common axis, which contained the centerline of each sketch.
- The profile sketches were revolved about the common axis and blended together using the loft feature. The resulting digital representations of the fruits are smooth so that CFD meshing is carried out with acceptable quality. The smoothness of the surface was achieved while still exhibiting the asymmetry characteristic of real fruits, as shown in Figure 2. Each unique shape of produce was also statistically varied in size, as elaborated later, to produce a larger set of unique shapes and sizes of produce.
- A surface mesh for each fruit template was generated using the ANSYS meshing tool [30], in preparation for modelling the interaction of the piece of fruit with other fruits.
The above process was repeated to generate several fruit templates such that a “bank” of variable shapes was available from which to construct a REV. As noted in the Introduction, an appropriate REV for large quantities of stacked produce is simply a crate (or box) of the specific produce in question, since a large storage volume is simply made up of several packed crates. This is where there is a departure from the modelling of packed particles or sand, since these are generally considered as vast regions without any other sub-arrangements like boxes. In general, produce is stored in crates/boxes that contain a small quantity such that the produce itself is not damaged under the weight of the stack.
To account for this packing arrangement and to facilitate development of an accurate produce REV, a generic box of 40 × 30 × 18 cm3 with a design that is of widespread use in grocery stores in Ontario, Canada, has been selected in the present work (see Figure 3). Note that the process given below could be used for any size or style of box/crate; however, since this article focuses mainly on the approach, a suitable generic box was considered. Further to this, there is no specific number of produce pieces that are contained in a box, as this is generally dictated by box size and weight. Thus, for the purpose of this study, we simply choose that a box of this size contains 50 pieces of either tomatoes or avocadoes. The box is approximated digitally so that when stacked it forms a repeating pattern that is representative of a stack of produce boxes, and can be extended to a porous-continuum of stacked produce. Referring to Figure 3, the box has circular openings for ventilation positioned such that the domain boundaries in all three principal directions are translationally periodic. The long sides of the box contain three holes, 10 cm apart, while the smaller sides contain two holes, each located 7.5 cm from the edge. All side-holes are placed at mid-height. Six other holes are positioned in the base 10 cm apart and 7.5 cm from the shorter side edges. All the holes are 2.5 cm in diameter. Rectangular slots for ventilation are also added at the top part of the box, positioned directly above the centers of the closest hole to the sides. These slots are 18 mm in height. The thickness of the card box is taken as 7 mm. Finally, in the simulation, the base of the box was repeated as a box top to facilitate translational periodicity in the vertical direction.
To generate the produce REV, we first ignore all but the overall dimensions of the box. Thus, in this first step, we consider the space occupied by the generic box and generate a packing of 50 individual pieces of the produce shown above in Figure 2, which we then add to the box in a subsequent step. The following procedure is used to generate the packing:
- Fifty digital pieces of fruit are generated by randomly selecting from the set of templates, and pairing them with a suitable size. For simplicity, the shape of each piece of fruit was fixed, and only the scale (in all directions) was adjusted to match the desired size. The size of each piece of fruit was selected from a uniform distribution with upper and lower bounds chosen from a suitable reference. The USDA size standards for tomatoes (Solanum lycopersicum L.) [31] were utilized where the dimension range was 5.4–7 cm. For avocadoes, based on an Ontario grocery store purchase of Hass avocadoes, the larger dimension was 7–12 cm in size and the smaller size was 5–7 cm in size.
- Using the Discrete Element Method (DEM) open source tool YADE [12], each piece of fruit was modelled as a rigid clump (union) of spheres. The spheres in each clump were placed near the nodes of the surface mesh, such that the surface of the clump yields a visually acceptable approximation of the surface mesh. Refer to Figure 4 for a depiction of the clump-of-spheres approximation of the fruits, and an illustration of the surface mesh used to smooth the shapes.
- The digitally-generated pieces of fruit were placed at random locations within a short rectangular column of the same cross-sectional dimensions as the box, but taller to accommodate the initial locations of the produce. Initial placement of the fruit ensures that they are not overlapping. The shapes are then allowed to fall and interact naturally under the influence of gravity. As such, the digitally-generated pieces were able to change both position and orientation within the rectangular column as the simulated packing algorithm progressed. Interactions between pieces of fruit, and between the fruit and column walls, were governed by the Cundall-Strack contact law [32]. The simulation was halted when the total kinetic energy fell below a specified threshold such that the velocity of each piece of fruit was sufficiently small. Snapshots of a simulation at two different instants in time are shown in Figure 5.
The resting positions and orientations of each piece of fruit were written to a text file that was later read by a SolidworksTM macro, which recreates the packed geometry using the fruit templates generated previously. The box geometry shown in Figure 3 was also added in this step. The complete geometry files were then exported for the CFD setup. Figure 6 depicts the simulation setup for REVs of tomatoes and avocadoes, wherein 50 packed fruits are added to the box. The right side of the figure shows the complete REV after discretization of the space occupied by air. Note that in simulation, the presence of the fruit is characterized by its shape and by the conditions set at the surfaces of the fruit, which is delineated in the next section.
3. The Inner-Produce Gas Respiration Model
Produce gas respiration processes have gained their importance from applications where the storage atmosphere needs to be controlled. For climacteric fruits and vegetables, it is desirable to prolong the shelf life and since there is a correlation between higher respiration rate and shorter shelf life, a lower rate of respiration needs to be achieved; i.e., less CO2 production and less O2 consumption. Hence, the predictability of the respiration processes is very important. Ideally, it would be preferable to model the process both inside and outside the produce and solve the gas equations in a conjugate air/produce framework [33]; however, this is very complicated and is further hindered by the lack of general and reliable inside-produce models. Different approaches for prediction of respiration have been reported in the literature. Empirical fits for experimental data to construct the shape of the respiration curve have been carried out [34,35] by taking into account the initial dilution effect and the state of equilibrium in which the respired gases are balanced with the convected gases to form a nearly fixed concentration. Although this approach achieves the slow decay of respiration due to the metabolic inside-fruit activity, which is difficult to predict with other approaches, it is not suitable for CFD simulations, because it is case specific and does not physically link the respiration process to the local species concentrations or the temperature. Another approach depends on Michelis-Menten enzyme kinetics expressions to represent source/sink of gases like O2/CO2 [22,36,37,38]. While these expressions are still not based on the detailed activity inside the fruit, they represent the temperature and the effect of CO2 and O2 concentrations and hence, they provide local variation that is suitable for CFD. In the present work, source term expressions are utilized from the work of Castellanos et al. [6,38] for avocadoes and tomatoes, which are based on the UMM (Uncompetitive Michelis-Menten) enzyme kinetics. This model is based on maximum rates, dissociation and inhibition constants that are of the Arrhenius type providing complete dependence on species concentrations around the fruit and on temperature.
In order to implement respiration expressions into the CFD simulations, the volume-of-produce dependence that the models are based on need to be reformulated into an interfacial area dependence such that the source terms are converted into boundary fluxes that enter the CFD domain through the surface area of the produce. The technique depends on estimating the inside-fruit density and utilizing the fruit volume-to-surface area ratio as a means for transforming the expressions by Castellanos et al. [6,38] for O2, CO2 and C2H4 that were utilized in modified atmosphere packaging 0-D models into the boundary flux expressions. Equations (1)–(3) provide the enzyme kinetic models by Castellanos et al. [6,38] for O2, CO2 and C2H4:
The equations provide volume sources with units of (cm3 of gas constituent i/kg of fruit/day) with concentrations of gases in terms of mole fractions. The different constants present in the expressions are Arrhenius constants taking the form . The constants are available from Castellanos et al. [6,38]. Equations (1)–(3) were changed to the form:
where is in (kg of i/m2s). To validate the boundary source implementation in a discretized CFD framework, the technique was utilized to reproduce the 0-D data obtained by Castellanos et al. [6,38] for experimental data on the respiration of a tomato (of 130 g) and an avocado (of 200 g) inside a 2020 cm3 closed container. Based on these weights and the volumes of the produce utilized in [6,38], produce densities were estimated as 1400 kg/m3 and 790 kg/m3 for tomatoes and avocadoes, respectively, while the volume-to-surface area ratio is calculated from SolidWorksTM [29] as 0.00945 m and 0.01248 m, respectively. Figure 7 shows the CFD validation setup for an individual tomato and an individual avocado produced using the digital generation approach described in Section 2. In each case, the produce is centered on the base of a cylindrical container of diameter 137 mm and height 137 mm (i.e., total volume of 2020 cm3) and the space between the produce and the container is discretized using 432,911 and 386,183 tetrahedral elements for the case of tomato and avocado, respectively. The container contains still air and the change in composition was assumed to not affect the pressure inside the container, which is compatible with the work of Castellanos et al. [6,38] since only 10 cm3 was withdrawn for measurements from the container every hour for the six days of simulation time. In terms of boundary conditions, the walls of the container and the surface of the fruit were all considered walls. The CFD simulations were carried out using ANSYS CFXTM [39], wherein the conservation of mass, momentum and species were solved to simulate the transient gas exchanges and the laminar, incompressible, Newtonian motion of air in the space between the container walls and the fruit. The expressions given in Equations (1)–(4) were implemented using CFX expression language (CEL) to create boundary sources at the fruit surfaces. Solutions were obtained in less than 30 minutes of real time on a CoreTM i7 processor and 16 GB of RAM, using a time-step size of 30 minutes to simulate six days of storage time. Smaller time steps did not have a significant impact on the results. Convergence was obtained to a maximum level below 10−4 for all transport equations. Figure 8 shows the results of the validation for different produce temperatures for tomatoes and avocadoes, respectively. In both cases, the transient CFD predictions are in excellent agreement with the experimental results of Castellanos et al. [6,38] indicating that the boundary approach to modelling inner-produce respiration is sufficient to obtain results of the air-side species concentrations and, inherently, volume-averaged results for the fluid-surrounding of produce.
It is also of interest to model the accompanying amount of heat transfer in the gas respiration processes. Based on the work of Becker and Fricke [40], an estimated average of 2667 kJ of energy is released for burning glucose within the produce, which accompanies the consumption of six moles of O2, and production of six moles of CO2 [40]. This information was used to develop a correlation between the expression of energy release accompanying respiration, that is, transpiration and the O2/CO2 respiration rate expressions. For the REV simulations, a heat flux is also added as a boundary source using a CEL expression and based on this information.
4. CFD Simulation of the REV
4.1. Computational Setup
As described in Section 2, the representative elemental volume (REV) for the produce stacks is considered to be a box containing 50 pieces of produce. The box shape/size was estimated from a cardboard box that is generic to grocery store boxes in ON, Canada (for small produce). The box is approximated digitally so that when stacked it forms a repeating pattern that is representative of a stack of produce boxes, and can be extended to a porous-continuum of stacked produce. Figure 6 depicts the simulation setup, wherein 50 fruits are packed in a box of 40 × 30 × 18 cm3 using YADE by the approach described in Section 2.
The space between the box and the produce was discretized using tetrahedral volumes leading to mesh sizes of 3,095,185 nodes for a single box of tomatoes and 3,474,088 for a single box of avocadoes (see the right-side images in Figure 6). The results on these meshes were grid-independent to within 3% based on the pressure drop in the flow direction for a Reynolds number of 1. In addition to the translational conditions imposed on the pairs of box surfaces, a mass flow condition is imposed in one flow direction as a means for specifying hydrodynamics. The produce surface is considered to be a no-slip wall with a fixed temperature; however, a boundary source is activated based on Equations (1)–(4). The box walls are also considered adiabatic and no-slip. As in Section 3, the same approach was utilized to solve the equations of hydrodynamics, energy and species for airflow and heat/gas exchange in the REV model. Though there is gas exchange, no source term was included in the mass conservation equation due to the negligibility of the change in the mixture composition. A mixture molecular weight of 29 was assumed and fixed for air. While the phenomenon of mass transfer is unsteady in nature, hydrodynamics is not in this case and hence to save computational time a steady hydrodynamic solution was considered for the unsteady heat and mass transfer solution. An upstream mass transfer condition of 0.233 O2 mass fraction with a negligible CO2 fraction is considered. The steady hydrodynamic solution was obtained first for each case, solving only the continuity and momentum equations. Afterwards, heat and mass transfer are solved using a transient solver in CFX without updating the steady hydrodynamic solution. This was achieved using the expert parameters’ options in CFX. A time step of 20 min and a final simulation time of 80 h were specified. Smaller values of the time-step size did not cause any significant change on simulation results of different test cases.
4.2. Results and Discussion
A parametric study has been conducted to test the applicability of the present technique. The Reynolds number has been used to enforce a mass flow rate in the periodic direction of interest and all three principal directions have been tested. It is important that all directions be considered since proper specification of permeability/inertial coefficients and heat/gas exchange coefficients for a porous-continuum model of the same domain requires knowledge of anisotropy of all processes. The Reynolds number has been calculated based on the average fruit diameter and the extrinsic velocity [1,2], and ranges from 0.1 to 200 covering most of the laminar flow regime. The Reynolds numbers correspond to a range of extrinsic velocities of 10−5 to 0.05. This range was guided by the work of Ambaw et al. [3,4].
Figure 9 shows the flow obstruction in terms of pressure drop per unit length across the range of Reynolds numbers considered. For the lateral flow cases in the x or z directions, the pressure drop is low because the airflow is not forced to flow through the produce. In these cases, the airflow takes the path of least resistance and most of it passes through the region between the produce stack and the box top.
The vertical flow direction (y) has the highest drag because the airflow is forced directly through the produce stack. A higher pressure drop is predicted for airflow through packed tomatoes owing to the fact that avocadoes are more “streamlined”.
It is also of interest to look into the heat transfer characteristics. Figure 10 displays the variation of Nusselt number with Reynolds number on the assumption of established flow in the direction of interest. The cases for tomatoes were based on a fixed surface temperature of 12 °C and an upstream temperature of 7 °C, while for avocadoes, the surface temperature was 5 °C with a 2 °C upstream value. These surface temperatures were specified based on the ASHRAE best storage recommendations [41] for different produce. In this manner, the simulations represent the near steady-state storage condition under which the produce can remain for a long period of time. In addition, the fixed-temperature condition enables use a log-mean-temperature-difference (LMTD) approach, similar to that used in [1,2], for calculating the convective heat transfer coefficient, which can then be applied in porous continuum simulations. It is noticed here that heat transfer is highest for vertical-direction (y) flow, owing once again to the fact that flow in this direction is forced to pass throughout the stacked produce, while in the x or z directions, much of the air can pass over the stack. In this case, the key difference is between the vertical direction heat transfer and the lateral direction heat transfer (i.e., x or z directions or general lateral flow). Vertical flow happens if the airflow is forced in that direction. In some cases when a uniform flow through the stacks is important, sealing (e.g., plastic wrap) may be placed around vertical stacking of produce and hence the only flow that can occur is vertical. In spite of this heat transfer dependence on flow direction, an averaged Nusselt number over x, y and z is reported in Figure 10, as a means for characterizing a collective effect of heat exchange between produce and surrounding air. This averaged characterization may be used in porous continuum modelling, as shown shortly, for general application purposes, when there is no unique orthogonal direction of flow throughout the domain, or when there is presence of both regions of vertical and lateral flow.
Figure 11 and Figure 12 show contours of mass fractions of CO2, O2 and temperature for tomatoes; and CO2, ethylene and temperature for avocadoes, respectively, for Reynolds numbers of 0.1, 1 and 50. The diffusive nature of the flow at low Reynolds numbers allows for higher rates of mass transfer as can be seen from the temperature and species plots at Reynolds number of 0.1.
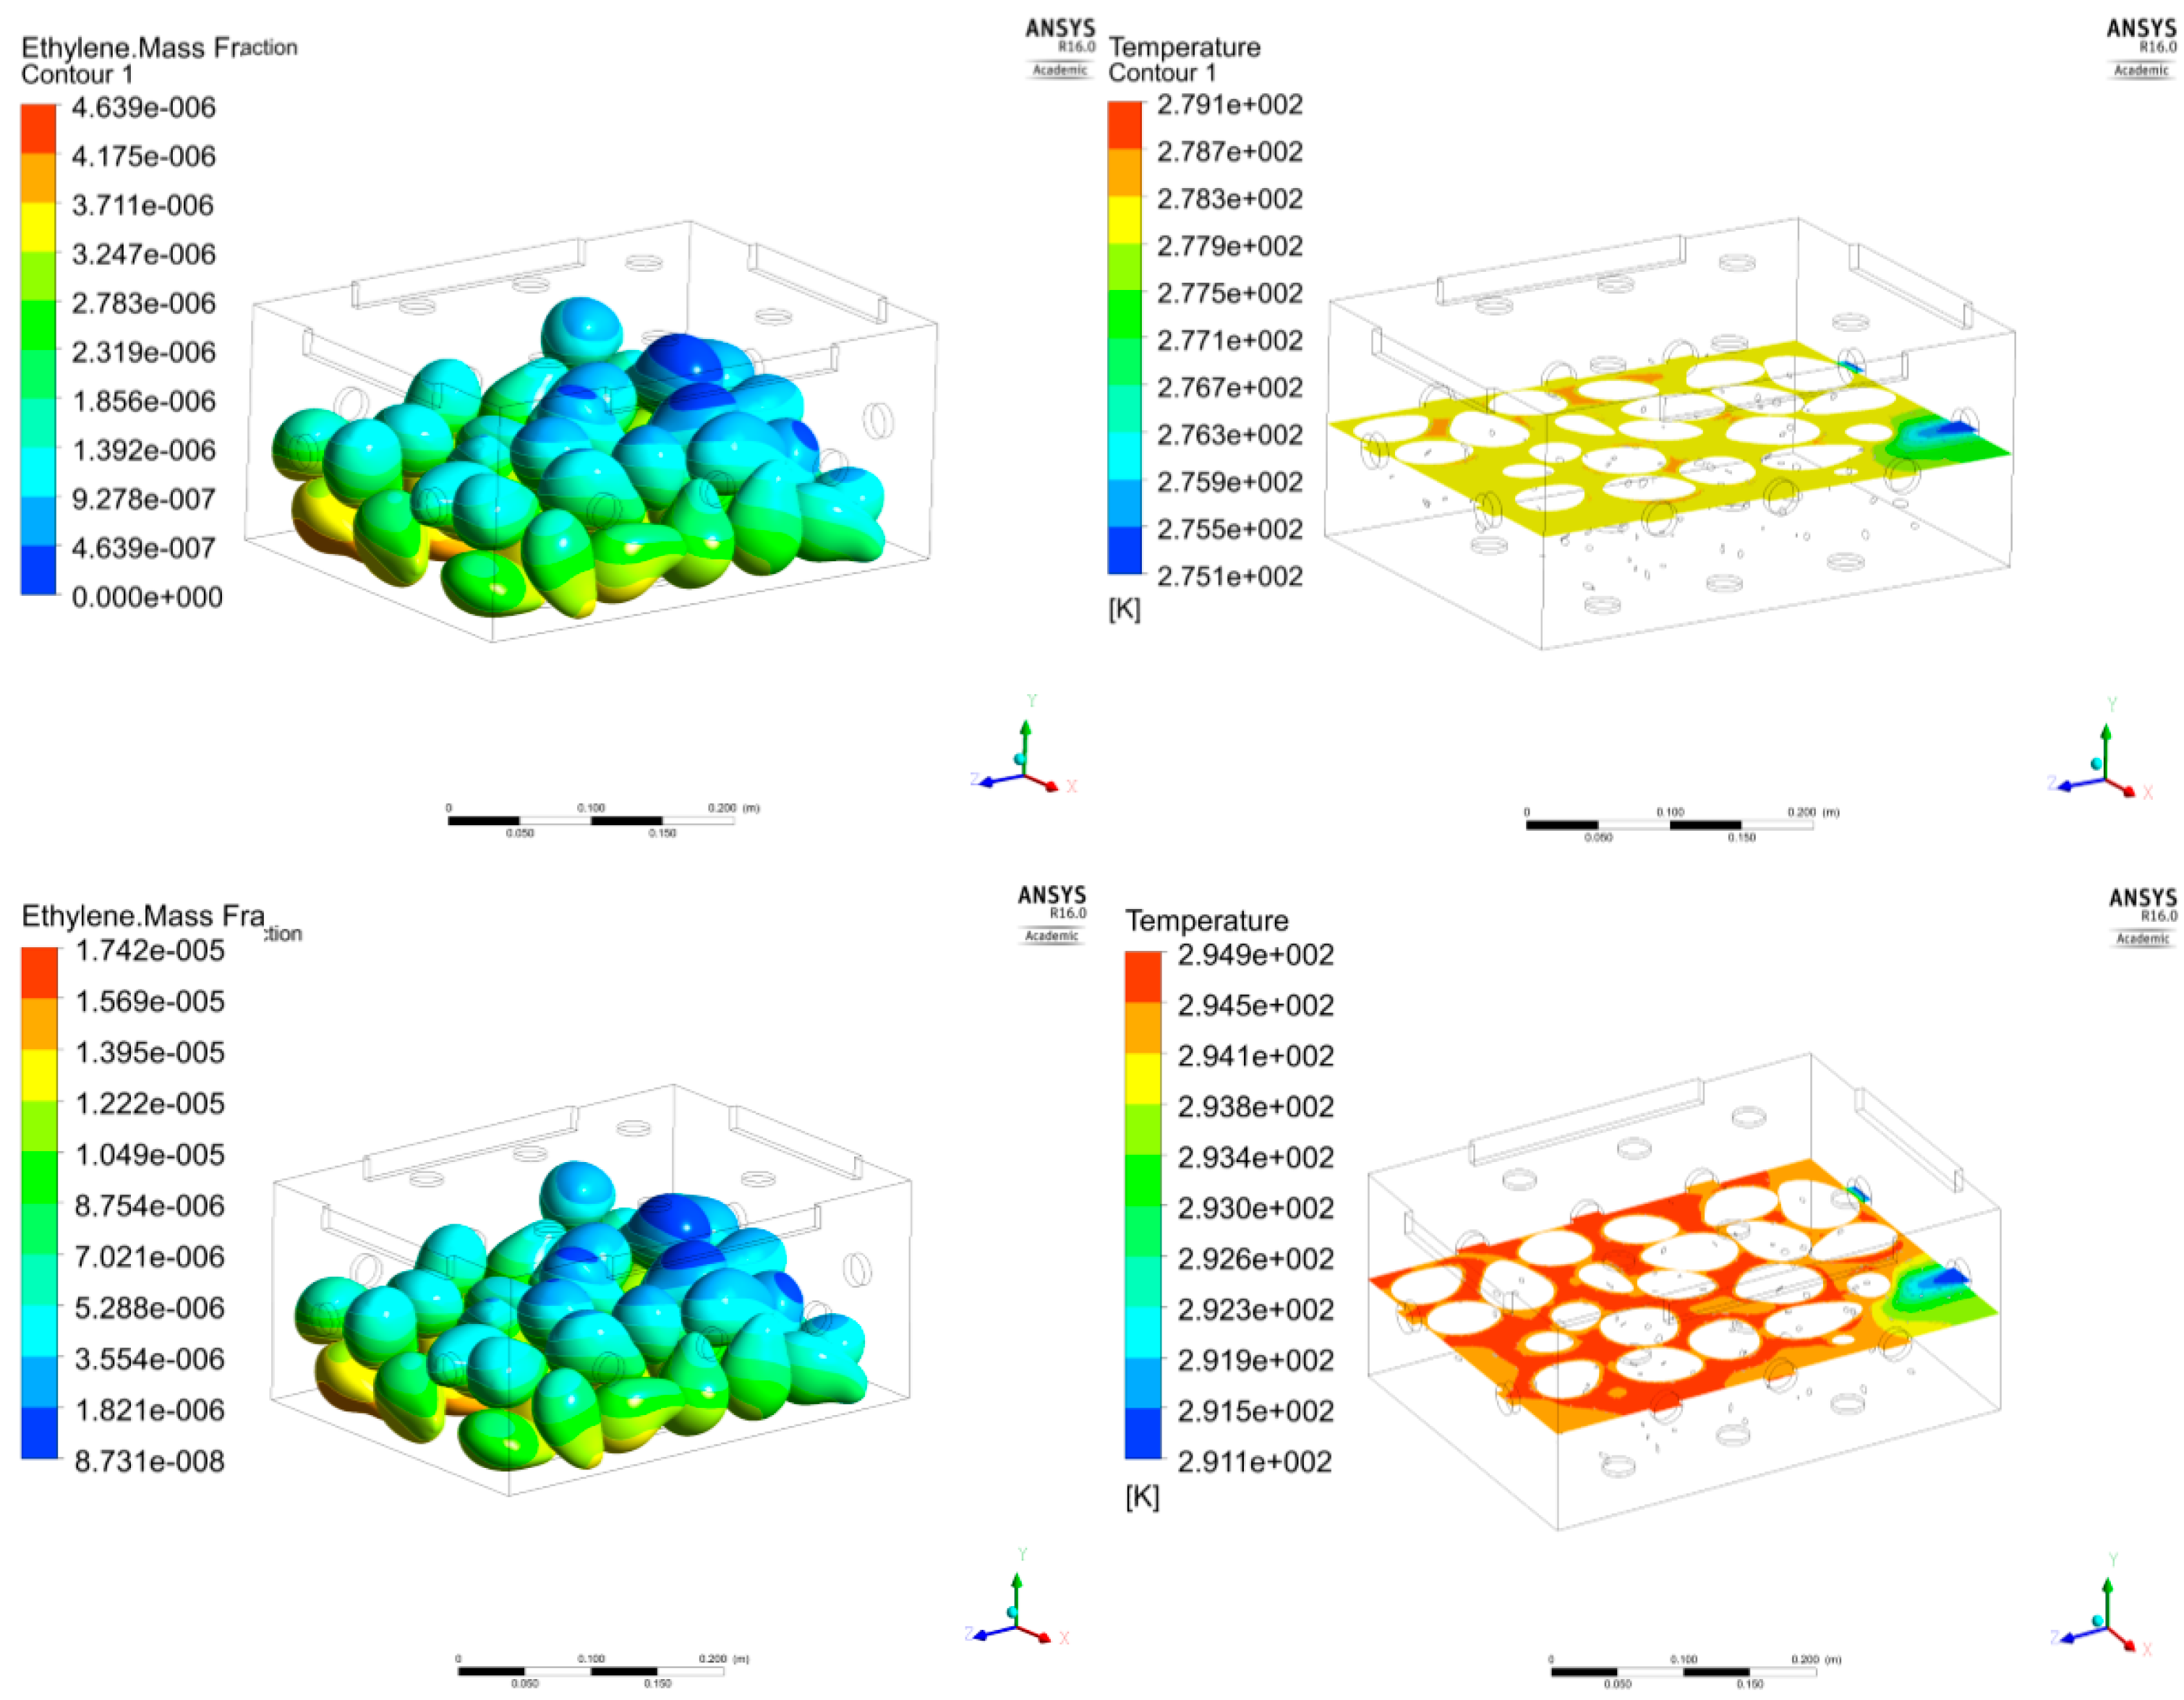
Once the convection phenomenon dominates, the produced species fractions become much lower in value. In regards to ethylene fractions, a fraction of the order of 10−5 (i.e., ~tens of particles per million) is observed for avocadoes at low Reynolds number and is shown to drop one order of magnitude at higher flow rates. It is also worth mentioning that the transient change in mass fractions noticeable in Figure 8a for stagnant cases is limited to few hours for forced flow cases. For a low Reynolds number (e.g., at Re = 0.1 for avocadoes), the time to equilibrium is predicted to be 10.3 h. At higher Reynolds number, the time to equilibrium reduces significantly (e.g., to 5 h for avocadoes with Re = 50) and it is almost on the order of minutes at Reynolds numbers of 100 and above. The effect of temperature on the respiration processes is also significant and in the case of avocadoes, the rates are much higher at ambient temperatures as compared to the storage temperature as evidenced from Figure 8b. Figure 13 depicts contour plots of ethylene and temperature for avocadoes with Re = 5 flow in the z-direction for ambient and storage temperatures, respectively. It is observed that the ethylene fraction is higher by one order of magnitude, which indicates how important a controlled atmosphere—and especially ethylene prediction—is for the storage of avocadoes and similar climacteric commodities. The most important aspect in this study is that the approach presented enables the proper prediction of such trends in produce storage.
5. The Porous Continuum Model
As described in the introduction of this article, and made clear through the approach presented in Section 2, Section 3 and Section 4, simulation at the shape-level of the produce is computationally expensive and simply not practical for considering large storage regions. The more practical approach is to use information from shape-level simulations as well as experiments to provide closure models that can be used to relegate large regions of stacked produce to a porous-continuum. By the porous-continuum approach, the conservation equations are volume-averaged, which leads to additional terms that can be expressed in terms of known quantities (constitutive models) and closure coefficients. In the present study, the establishment of a representative produce shape, the characterization of a REV (produce-filled box) and the simulation of flow and heat/gas transfers in the REV yields information about pressure drop, heat and mass transfer that is now used to generate closure coefficients. To illustrate the required closure coefficients, the volume-averaged equations of mass, momentum, heat transfer and species (in the absence of external sources) are given, respectively, by [33,42]:
where represents the volumetric porosity (calculated herein as 0.6687 and 0.622 for tomatoes and avocadoes, respectively) and is a species counter, which stands for O2, CO2, etc. is the fluid density, = (u, v, w) is the velocity vector, is local temperature and is the species mass fraction (note that is the species mole fraction). The 〈 〉 brackets represent an extrinsic volume averaged quantity that is averaged over a multiphase porous media volume, while represents an intrinsic volume average over only the fluid volume inside the porous region. The hydrodynamic equations (Equations (5) and (6)) are cast in their steady form. It is also noted that the momentum equation herein is cast in its extrinsic form unlike the heat and mass transfer equations (Equations (7) and (8)), which are cast in their intrinsic forms.
While these equations look similar to the point mass, momentum and energy equations, a direct comparison shows additional terms that characterize the presence of the solid structure on the flow and these terms contain the closure coefficients that must be derived from the shape-level simulations (or from suitable experiments). The last two terms on the RHS of the momentum equation (Equation (6)) represent the additional resistance or drag on the fluid flow due to presence of the bodies of produce and card box material. Here is the Darcy permeability tensor, which characterizes the linear (or viscous) drag, and is the Forchheimer drag tensor, which characterizes form drag, which is more prevalent at higher flow velocities. In the energy equation (Equation (7)), the exchange term characterizes convective exchange between the produce and surrounding air, and this coefficient can be obtained from an appropriate Nusselt number correlation [33]. The second closure term in Equation (7), , characterizes the energy accompanying respiration (i.e., transpiration) and it is reasonable based on the work of Becker and Fricke [40] to cast it as , where is an exchange constant calculated as (Watts) = 1.01e + 7 . For the species equations (Equation (8)), is a gas respiration exchange term between the produce and surrounding air. This term, unlike the cases of moisture transport [33], is not based on adsorption/desorption or on a diffusive transport flux at the microscopic fluid/solid interface, but is represented herein as a chemical reaction term. It is simplified as , noting that is a surface average of the local produce-air gas respiration mass flux for species . From Equation (1)–(4), may be obtained in terms of the local intrinsic averages of the species mole fractions, , because based on the work of Castellanos et al. [6,38], the respired gas amount is a function of the concentration of the respiration gases in the head space above the produce. This form of the result comes directly from volume-averaging the respiration source term in its point form as shown in Equation (1)–(4). Note that in its discrete form, this source term is multiplied by the volume of the CFD cell. In regards to diffusion coefficients, represents the effective fluid-side conductivity while represents effective species fluid-side diffusivity. In cases of weak tortuosity and dispersion effects, both may be represented in terms of the point-form constants, i.e., and , respectively [2,33,42]. It is noted that unlike the work of Elhalwagy and Straatman [33], the specific heats are based on absolute temperature herein and not referenced at 0 °C.
As elaborated above, there is no need for closure coefficients for the respiration source terms and hence, closure is only needed for , and . In regards to the permeability and Forchheimer tensors, reviewing the works of Whitaker [43] and DeGroot and Straatman [44,45], a permeability tensor may be regarded as diagonal and symmetric for a REV that has a symmetric ‘pore geometry’ for all three directions. Herein, the characteristic microscopic length l of the averaging process is based on the average diameter of produce and may define the ‘pore geometry’ to be 3D symmetric as variation of this average length may be neglected between different directions. Also, as long as l << L, where L here is the characteristic macroscopic length taken as the smallest side length of the box, ~ , where is the local microscopic deviation-from-average for velocity, and the average porosity is nearly fixed throughout the box (i.e., , the findings of Whitaker [43] based on closure mathematics in regards to the permeability and Forchheimer tensors are valid. Relaxing the definition of the Forchheimer tensor to diagonal as well and using a linear correlation to velocity [44], the classic definitions of the coefficients for directional closure—i.e., for x, y and z—may be utilised for each Cartesian equation of momentum. Also, one may reduce the flow equation based on translational periodicity on the three directions to essentially the Darcy-Forchheimer equation, given by:
where here may be x, y or z and may be u, v or w. Now the task turns to using Equation (9) to fit the data from Figure 9, in order to obtain and for the three directions. Dropping the , the data presented in the figure is fitted to an equation of the form:
where and . The average produce diameters are taken as 6.2 cm and 7.75 cm for tomatoes and avocadoes, respectively. Table 1 lists the curve fitting information and the values of and for each commodity and direction. The introduction of this anisotropy was necessary as mentioned earlier in Section 4 due to the difference in resistance between the resting direction of the produce (y) and other directions.
It is noted that the resistance to the flow here may be characterized collectively by both coefficients of permeability and Forchheimer as the fit was developed for both the linear range, Re < 1 and the inertial range, Re up to 200. Also, although collectively the tomatoes have generally higher pressure drops as stated earlier, the avocadoes have larger average diameter, and hence this finding does not necessarily reflect on the individual coefficient values.
Now we close the heat transfer equations by curve fitting the Nusselt number data in Figure 10. The correlation of choice is given as:
In the case of general averaged Nusselt number, for tomatoes, c = 0.1861 and m = 0.6777 while for avocadoes, c = 0.2425 and m = 0.5739 with goodness of fit given by R2 of 0.9947 and 0.9964, respectively. It is also useful to obtain correlations for purely vertical (i.e., using y-direction data) and purely lateral flow (using an average Nusselt number over x and z directions). For purely vertical flow, c = 0.5644 and 0.632, m = 0.6141 and 0.5383 with R2 = 0.9963 and 0.9968 for tomatoes and avocadoes, respectively. As for purely lateral flow, and with much weaker heat transfer as observed, the constants exhibit different order of values. For tomatoes, c = 0.02342, m = 0.906 and R2 = 0.9865 while for avocadoes, c = 0.05341, m = 0.6977 and R2 = 0.9855. It is also worth mentioning that a velocity-weighted representation of the Nusselt number may be used for porous continuum modeling as well (i.e., with evaluated by Equation (11)).
Using the closure coefficients derived from the shape-level calculations, equivalent calculations on the same REV discretized using a small number of hexahedral volumes (on the order of 1000′s instead of millions) can be made using the porous-continuum approach achieving similar overall results, but without the shape-level detail. This makes the porous continuum approach much more practical for large storage areas that contain hundreds or thousands of crates of like-produce, or mixed stacks of produce where all different commodities are placed in the same region.
As mentioned in other sections of the article, the important outcome of the article is the successful application of the multi-level approach for studying storage and ventilation of packaged commodities. The approach was demonstrated by considering a generic crate with 50 pieces of either tomatoes or avocadoes, and considered the shape, the packing, the simulation of airflow, heat transfer and respiration at the shape-level of this packed produce. The process could be redone for any different crate geometry or number of pieces under any airflow condition within the range that the respiration model is valid. Similarly, this could be done for any other produce where appropriate information is provided. The information obtained from the simulations can be used to model the ventilation, and respiration of all different types of produce to understand the arrangements that should be considered in storage and transport.
6. Summary
An approach has been presented to simulate individual and boxed produce such that results can be used to up-scale the representative elemental volume (REV) to a large region of stored produce. The study presents an approach to create a representative digital produce shape, a mathematical technique to generate realistic packing of numbers of digitally-generated produce into a REV, a model for area-based estimates of respiration/transpiration, and CFD simulations of the airflow and heat/gas exchanges in the REV under a range of flow directions and Reynolds numbers. The discrete element method based on the open-source software (YADE) was instrumental in producing the packing arrangement of produce in a generic box, which constitutes the REV. The simulations utilize Uncompetitive Michelis-Menten (UMM) enzyme kinetics to represent the respiration processes; i.e., to provide O2, CO2 and Ethylene C2H4 information. ANSYS CFX was utilized to perform the CFD simulations with the use of CEL to impose boundary sources for heat and mass transfer. The results show the expected trends with respect to the hydrodynamics, heat and mass transfer based on current literature on food storage and processing. The overall results of the model show that the approach presented is promising with regards to providing information necessary to close constitutive models for porous-continuum simulations. Such a strategy can be used to rapidly conduct parametric studies that consider different crate sizes/styles with different packing arrangements, different air properties and conditions, and different storage and transport arrangements and can considerably reduce the number of required physical experiments.
Author Contributions
Conceptualization, M.E., N.D. and A.G.S.; Methodology, M.E. and N.D.; Validation, M.E.; Software, N.D. and M.E.; Investigation, M.E.; Data curation, M.E.; Resources, A.G.S.; Supervision, A.G.S.; Writing-original draft preparation, M.E. and A.G.S.; Writing-Review and editing, A.G.S.; Project administration, A.G.S.
Funding
The authors would like to acknowledge the financial support from Natural Sciences and Engineering Council of Canada (NSERC).
Conflicts of Interest
The authors declare no conflict of interest.
Nomenclature
| Arrhenius pre-exponential factor (takes the same unit for each individual constant it represents e.g., | |
| Interfacial specific surface area of porous media, m-1 | |
| a, b, c and m | Curve fitting constants |
| Forchheimer tensor representing inertia effects of porous media | |
| specific heat at constant pressure, J/kg·K | |
| binary diffusivion coefficient, m2/s | |
| Pore diameter, m (herein as average produce dimension) | |
| Activation energy, kJ/mol. | |
| Energy accompanying respiration (Transpiration), W | |
| Hill coefficient representing degree of cooperativity | |
| interfacial heat transfer coefficient in porous media, W/m2·K | |
| Species counter | |
| j | A counter that signify coordiantes x,y,z |
| thermal conductivity, W/m·K | |
| Darcy permeability tensor of porous media | |
| dissociation constants of the enzyme-substrate complex | |
| constants of uncompetitive inhibition for consumption of O2 and generation of CO2, respectively | |
| Molecular weight of gas component i, kg/kmol | |
| mass flow rate, kg/s | |
| Respiration mass flux of gas i, kg of i/m2s | |
| Nusselt number | |
| pressure, Pa | |
| Prandtl number | |
| Universal gas constant, kJ/mol·K | |
| Respiration rate of gas i, cm3 of i/kg·day | |
| Reynolds number | |
| temperature, K | |
| time, s | |
| fluid velocity [=()], m/s | |
| Fruit volume to surface area ratio, m | |
| mass fraction | |
| Mole fraction | |
| dynamic viscosity, N·s/m2 | |
| density of fluid mixture, kg/m3 | |
| density of individual produce (ratio between its weight and volume), kg/m3 | |
| porosity | |
| 〈 〉 | extrinsic volume-average |
| Intrinsic volume-average of phase x | |
| Subscripts and Superscripts | |
| effective property in porous media | |
| fluid | |
| at fluid/solid interface (microscopic interface) | |
| solid | |
References
- Dyck, N.J.; Straatman, A.G. A new approach to digital generation of spherical void phase porous media microstructures. Int. J. Heat Mass Trans. 2015, 81, 470–477. [Google Scholar] [CrossRef]
- Khan, F.A.; Straatman, A.G. Closure of a macroscopic turbulence and non-equilibrium turbulent heat and mass transfer model for a porous media comprised of randomly packed spheres. Int. J. Heat Mass Trans. 2016, 101, 1003–1015. [Google Scholar] [CrossRef]
- Ambaw, A.; Verboven, P.; Defraeye, T.; Tijskens, E.; Schenk, A.; Opara, U.L.; Nicolai, B.M. Porous medium modeling and parameter sensitivity analysis of 1-MCP distribution in boxes with apple fruit. J. Food Eng. 2013, 119, 13–21. [Google Scholar] [CrossRef] [Green Version]
- Ambaw, A.; Verboven, P.; Delele, M.A.; Defraeye, T.; Tijskens, E.; Schenk, A.; Nicolai, B.M. CFD-based analysis of 1-MCP distribution in commercial cool store rooms: Porous medium model application. Food Bioprocess Technol. 2014, 7, 1903–1916. [Google Scholar] [CrossRef]
- Ferrua, M.J.; Singh, R.P. Modeling the forced-air cooling process of fresh strawberry packages, Part I: Numerical model. Int. J. Refrig. 2009, 32, 335–348. [Google Scholar] [CrossRef]
- Castellanos, D.A.; Mendoza, R.; Gavara, R.; Herrera, A.O. Respiration and Ethylene Generation Modeling of “Hass” Avocado and Feijoa Fruits and Application in Modified Atmosphere Packaging. Int. J. Food Prop. 2017, 20, 1–17. [Google Scholar] [CrossRef]
- Yu, Q.; Thompson, B.E.; Straatman, A.G. A unit cube-based model for heat transfer and fluid flow in porous carbon foam. J. Heat Trans. 2006, 128, 352–360. [Google Scholar] [CrossRef]
- Yang, J.; Wang, Q.; Zeng, M.; Nakayama, A. Computational Study of Forced Convective Heat Transfer in Structured Packed Beds with Spherical or Ellipsoidal Particles. Chem. Eng. Sci. 2010, 65, 726–738. [Google Scholar] [CrossRef]
- Yang, J.; Wang, J.; Bu, S.; Zeng, M.; Wang, Q.; Nakayama, A. Experimental Analysis of Forced Convective Heat Transfer in Novel Structured Packed Beds of Particles. Chem. Eng. Sci. 2012, 71, 126–137. [Google Scholar] [CrossRef]
- Soulaine, C. Direct Numerical Simulation in Fully Saturated Porous Media. Available online: https://web.stanford.edu/~csoulain/PORE_SCALE/Chap2.pdf (accessed on 10 December 2017).
- Buchgraber, M.; Al-Dossary, M.; Ross, C.M.; Kovscek, A.R. Creation of a Dual-Porosity Micromodel for Pore-Level Visualization of Multiphase Flow. J. Pet. Sci. Eng. 2012, 86, 27–38. [Google Scholar] [CrossRef]
- Smilauer, V.; Chareyre, B. Yade dem Formulation. Smilauer, V., Ed.; Yade Documentation. 2010. Available online: www.yade-dem.org (accessed on 3 November 2016).
- Lencki, R.W.; Zhu, M.; Chu, C.L. Comparison of unsteady-and steady-state methods for produce respiration rate determination: 1. Model development and validation. Postharvest Biol. Technol. 2004, 31, 229–238. [Google Scholar] [CrossRef]
- Waghmare, R.B.; Mahajan, P.V.; Annapure, U.S. Modelling the effect of time and temperature on respiration rate of selected fresh-cut produce. Postharvest Biol. Technol. 2013, 80, 25–30. [Google Scholar] [CrossRef]
- Kang, J.S.; Lee, D.S. A kinetic model for transpiration of fresh produce in a controlled atmosphere. J. Food Eng. 1998, 35, 65–74. [Google Scholar] [CrossRef]
- Sousa-Gallagher, M.J.; Mahajan, P.V.; Mezdad, T. Engineering packaging design accounting for transpiration rate: Model development and validation with strawberries. J. Food Eng. 2013, 119, 370–376. [Google Scholar] [CrossRef]
- Reid, M.S.; Rhodes, M.J.C.; Hulme, A.C. Changes in ethylene and CO2 during the ripening of apples. J. Sci. Food Agric. 1973, 24, 971–979. [Google Scholar] [CrossRef]
- Shewfelt, R.L.; Thai, C.N.; Davis, J.W. Prediction of changes in color of tomatoes during ripening at different constant temperatures. J. Food Sci. 1988, 53, 1433–1437. [Google Scholar] [CrossRef]
- Tripathi, K.; Pandey, S.; Malik, M.; Kaul, T. Fruit Ripening of Climacteric and Nonclimacteric Fruit. J. Environ. Appl. Biores. 2016, 4, 27–34. [Google Scholar]
- Klee, H.J.; Clark, D.G. Ethylene signal transduction in fruits and flowers. In Plant Hormones; Springer: Dordrecht, The Netherlands, 2010; pp. 377–398. [Google Scholar]
- Iqbal, T.; Rodrigues, F.A.; Mahajan, P.V.; Kerry, J.P. Mathematical modeling of the influence of temperature and gas composition on the respiration rate of shredded carrots. J. Food Eng. 2009, 91, 325–332. [Google Scholar] [CrossRef]
- Fonseca, S.C.; Oliveira, F.A.; Brecht, J.K. Modelling respiration rate of fresh fruits and vegetables for modified atmosphere packages: A review. J. Food Eng. 2002, 52, 99–119. [Google Scholar] [CrossRef]
- Finnegan, E.; Mahajan, P.V.; O’Connell, M.; Francis, G.A.; O’Beirne, D. Modelling respiration in fresh-cut pineapple and prediction of gas permeability needs for optimal modified atmosphere packaging. Postharvest Biol. Technol. 2013, 79, 47–53. [Google Scholar] [CrossRef]
- Paull, R.E.; Chen, N.J. Heat treatment and fruit ripening. Postharvest Bioll. Technol. 2000, 21, 21–37. [Google Scholar] [CrossRef]
- Defraeye, T.; Cronjé, P.; Verboven, P.; Opara, U.L.; Nicolai, B. Exploring ambient loading of citrus fruit into reefer containers for cooling during marine transport using computational fluid dynamics. Postharvest Biol. Technol. 2015, 108, 91–101. [Google Scholar] [CrossRef] [Green Version]
- Mebatsion, H.K.; Boudon, F.; Godin, C.; Pradal, C.; Génard, M.; Goz-Bac, C.; Bertin, N. A novel profile based model for virtual representation of quasi-symmetric plant organs. Comput. Electron. Agric. 2011, 75, 113–124. [Google Scholar] [CrossRef]
- Rogge, S.; Beyene, S.D.; Herremans, E.; Hertog, M.L.; Defraeye, T.; Verboven, P.; Nicolai, B.M. A geometrical model generator for quasi-axisymmetric biological products. Food Bioprocess Technol. 2014, 7, 1783–1792. [Google Scholar] [CrossRef]
- Jones, E.; Oliphant, T.; Peterson, P. {SciPy}: Open Source Scientific Tools for {Python}. 2014. Available online: www.scipy.org (accessed on 20 November 2016).
- Dassault Systemes. Solidworks Educational Version 2012–2013; Dassault Systemes: Vélizy-Villacoublay, France, 2013. [Google Scholar]
- ANSYS. Workbench Meshing Tool, Volume 16.0; ANSYS: Canonsburg, PA, USA, 2015. [Google Scholar]
- United States Department of Agriculture (USDA). US Standards for Grades of Greenhouse Tomatoes; USDA, Agricultural Marketing Service: Washington, DC, USA, 2007.
- Cundall, P.A.; Strack, O.D. A discrete numerical model for granular assemblies. Geotechnique 1979, 29, 47–65. [Google Scholar] [CrossRef]
- Elhalwagy, M.M.; Straatman, A.G. Dynamic coupling of phase-heat and mass transfer in porous media and conjugate fluid/porous domains. Int. J. Heat Mass Trans. 2017, 106, 1270–1286. [Google Scholar] [CrossRef]
- Goyette, B.; Vigneault, C.; Raghavan, V.; Charles, M.T. Hyperbaric treatment on respiration rate and respiratory quotient of tomato. Food Bioprocess Technol. 2012, 5, 3066–3074. [Google Scholar] [CrossRef]
- Liplap, P.; Vigneault, C.; Rennie, T.J.; Boutin, J.; Raghavan, G.V. Method for determining the respiration rate of horticultural produce under hyperbaric treatment. Food Bioprocess Technol. 2014, 7, 2461–2471. [Google Scholar] [CrossRef]
- Bhande, S.D.; Ravindra, M.R.; Goswami, T.K. Respiration rate of banana fruit under aerobic conditions at different storage temperatures. J. Food Eng. 2008, 87, 116–123. [Google Scholar] [CrossRef]
- Ho, Q.T.; Verboven, P.; Fanta, S.W.; Abera, M.K.; Retta, M.A.; Herremans, E.; Nicolaï, B.M. A multiphase pore scale network model of gas exchange in apple fruit. Food Bioprocess Technol. 2014, 7, 482–495. [Google Scholar] [CrossRef]
- Castellanos, D.A.; Cerisuelo, J.P.; Hernandez-Muñoz, P.; Herrera, A.O.; Gavara, R. Modelling the evolution of O2 and CO2 concentrations in MAP of a fresh product: Application to tomato. J. Food Eng. 2016, 168, 84–95. [Google Scholar] [CrossRef]
- Ansys CFX-Solver Theory Guide. ANSYS CFX Release 16.0; Ansys Inc.: Canonsburg, PA, USA, 2015. [Google Scholar]
- Becker, B.R.; Fricke, B.A. Simulation of moisture loss and heat loads in refrigerated storage of fruits and vegetables. New Dev. Refrig. Food Saf. Qual. 1996, 210–221. [Google Scholar]
- A. S. H. R. A. E. Handbook—Refrigeration, Chapter 21; Commodity storage requirements; Knovel: New York, NY, USA, 2010.
- Whitaker, S. Volume averaging of transport equations. Int. Ser. Adv. Fluid Mech. 1997, 13, 1–60. [Google Scholar]
- Whitaker, S. The Forchheimer equation: A theoretical development. Trans. Porous Med. 1996, 25, 27–61. [Google Scholar] [CrossRef]
- DeGroot, C.T.; Straatman, A.G. Numerical results for the effective flow and thermal properties of idealized graphite foam. J. Heat Trans. 2012, 134, 042603. [Google Scholar] [CrossRef]
- DeGroot, C.T.; Straatman, A.G. A Porous media model of Alveolar duct flow in the human lung. J. Porous Med. 2018, 21, 405–422. [Google Scholar] [CrossRef]
Figure 1.
Depiction of the different cross sections for tomatoes (left) and avocadoes (right) showing the spline representations of the outer edges.
Figure 1.
Depiction of the different cross sections for tomatoes (left) and avocadoes (right) showing the spline representations of the outer edges.
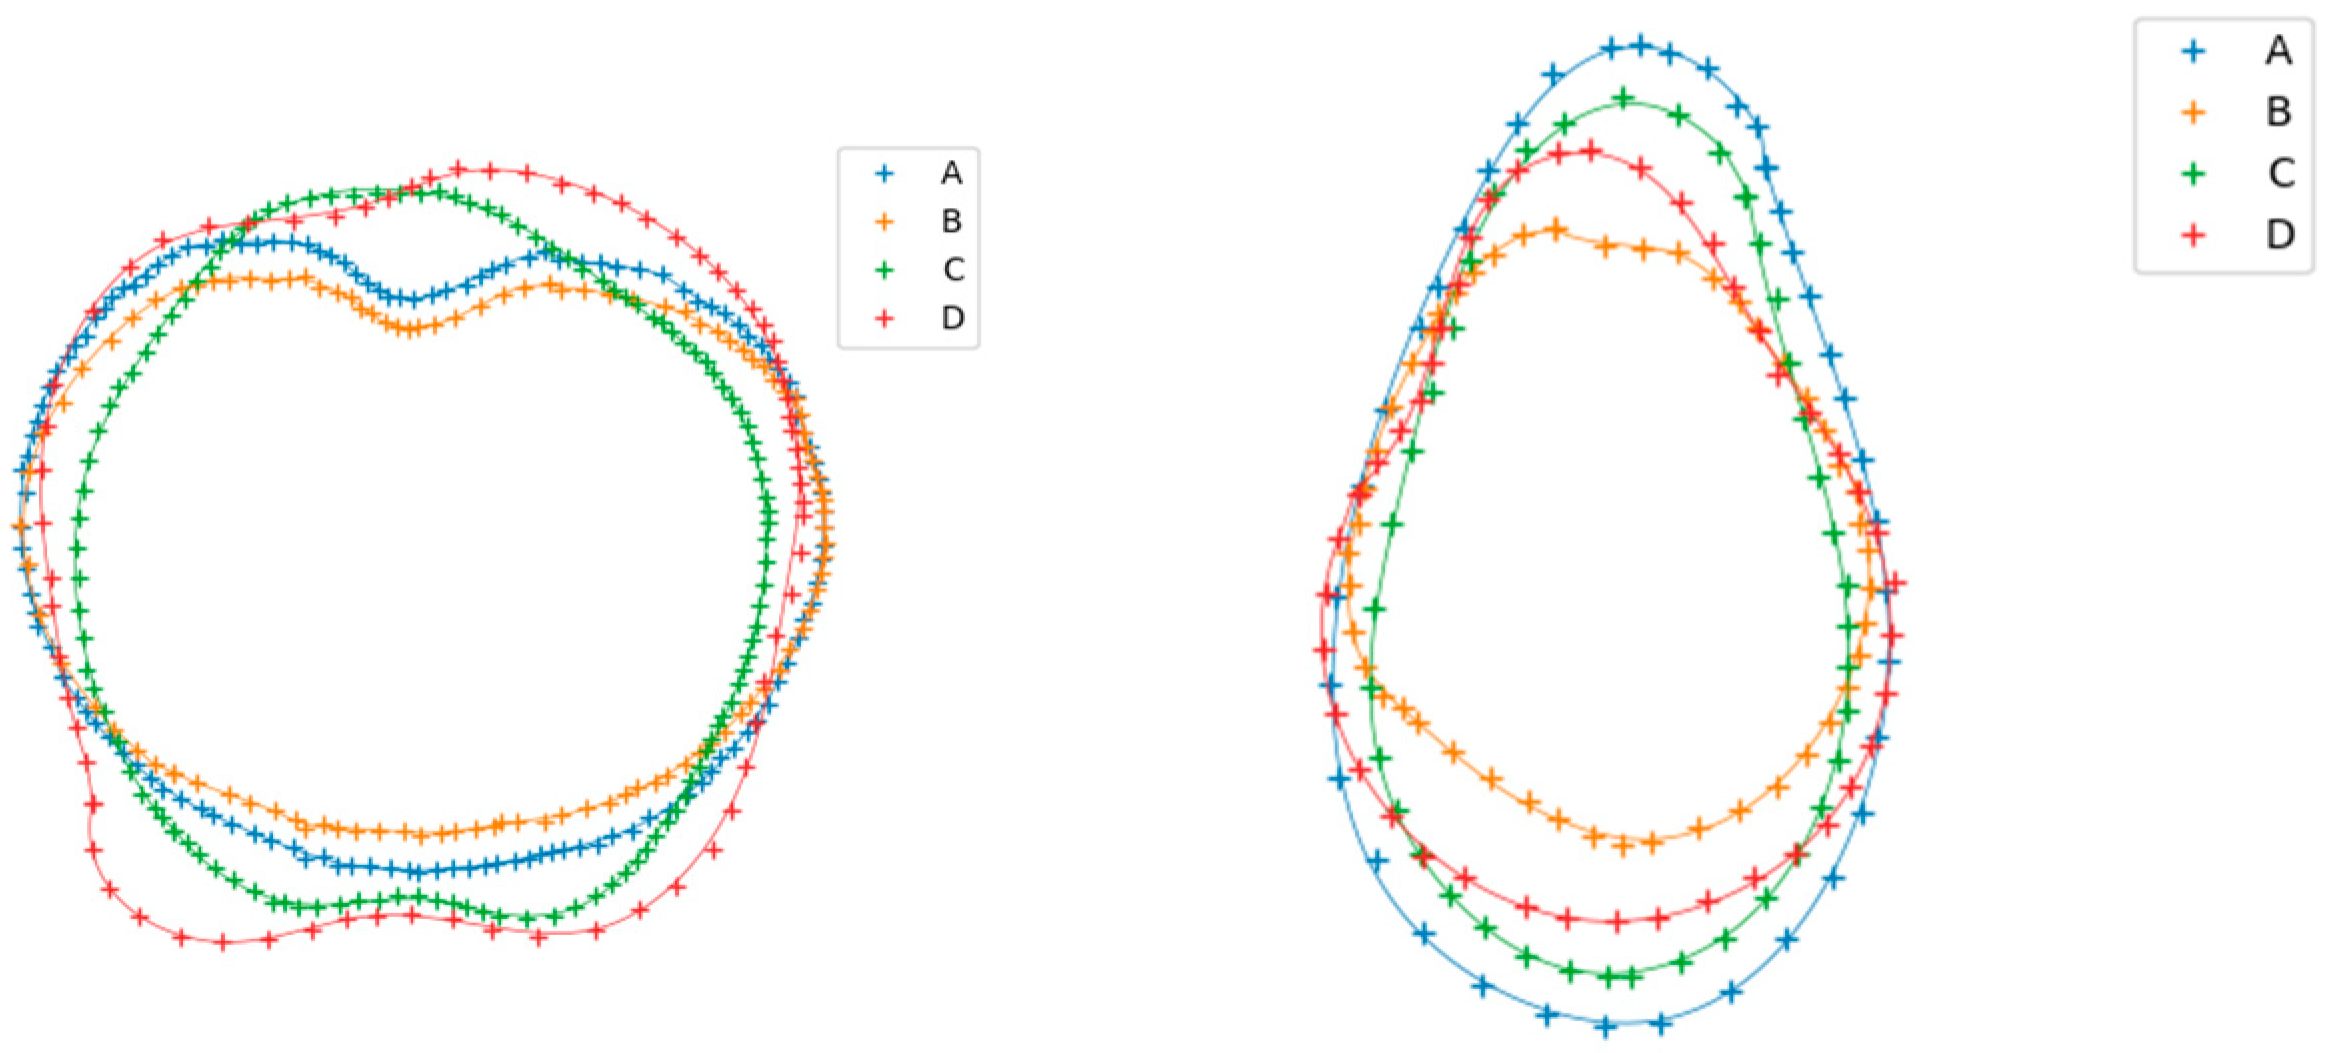
Figure 2.
Digital representations for five of the profiles of tomatoes and avocadoes that were produced using the templates given in Figure 1 and SolidworksTM.
Figure 2.
Digital representations for five of the profiles of tomatoes and avocadoes that were produced using the templates given in Figure 1 and SolidworksTM.
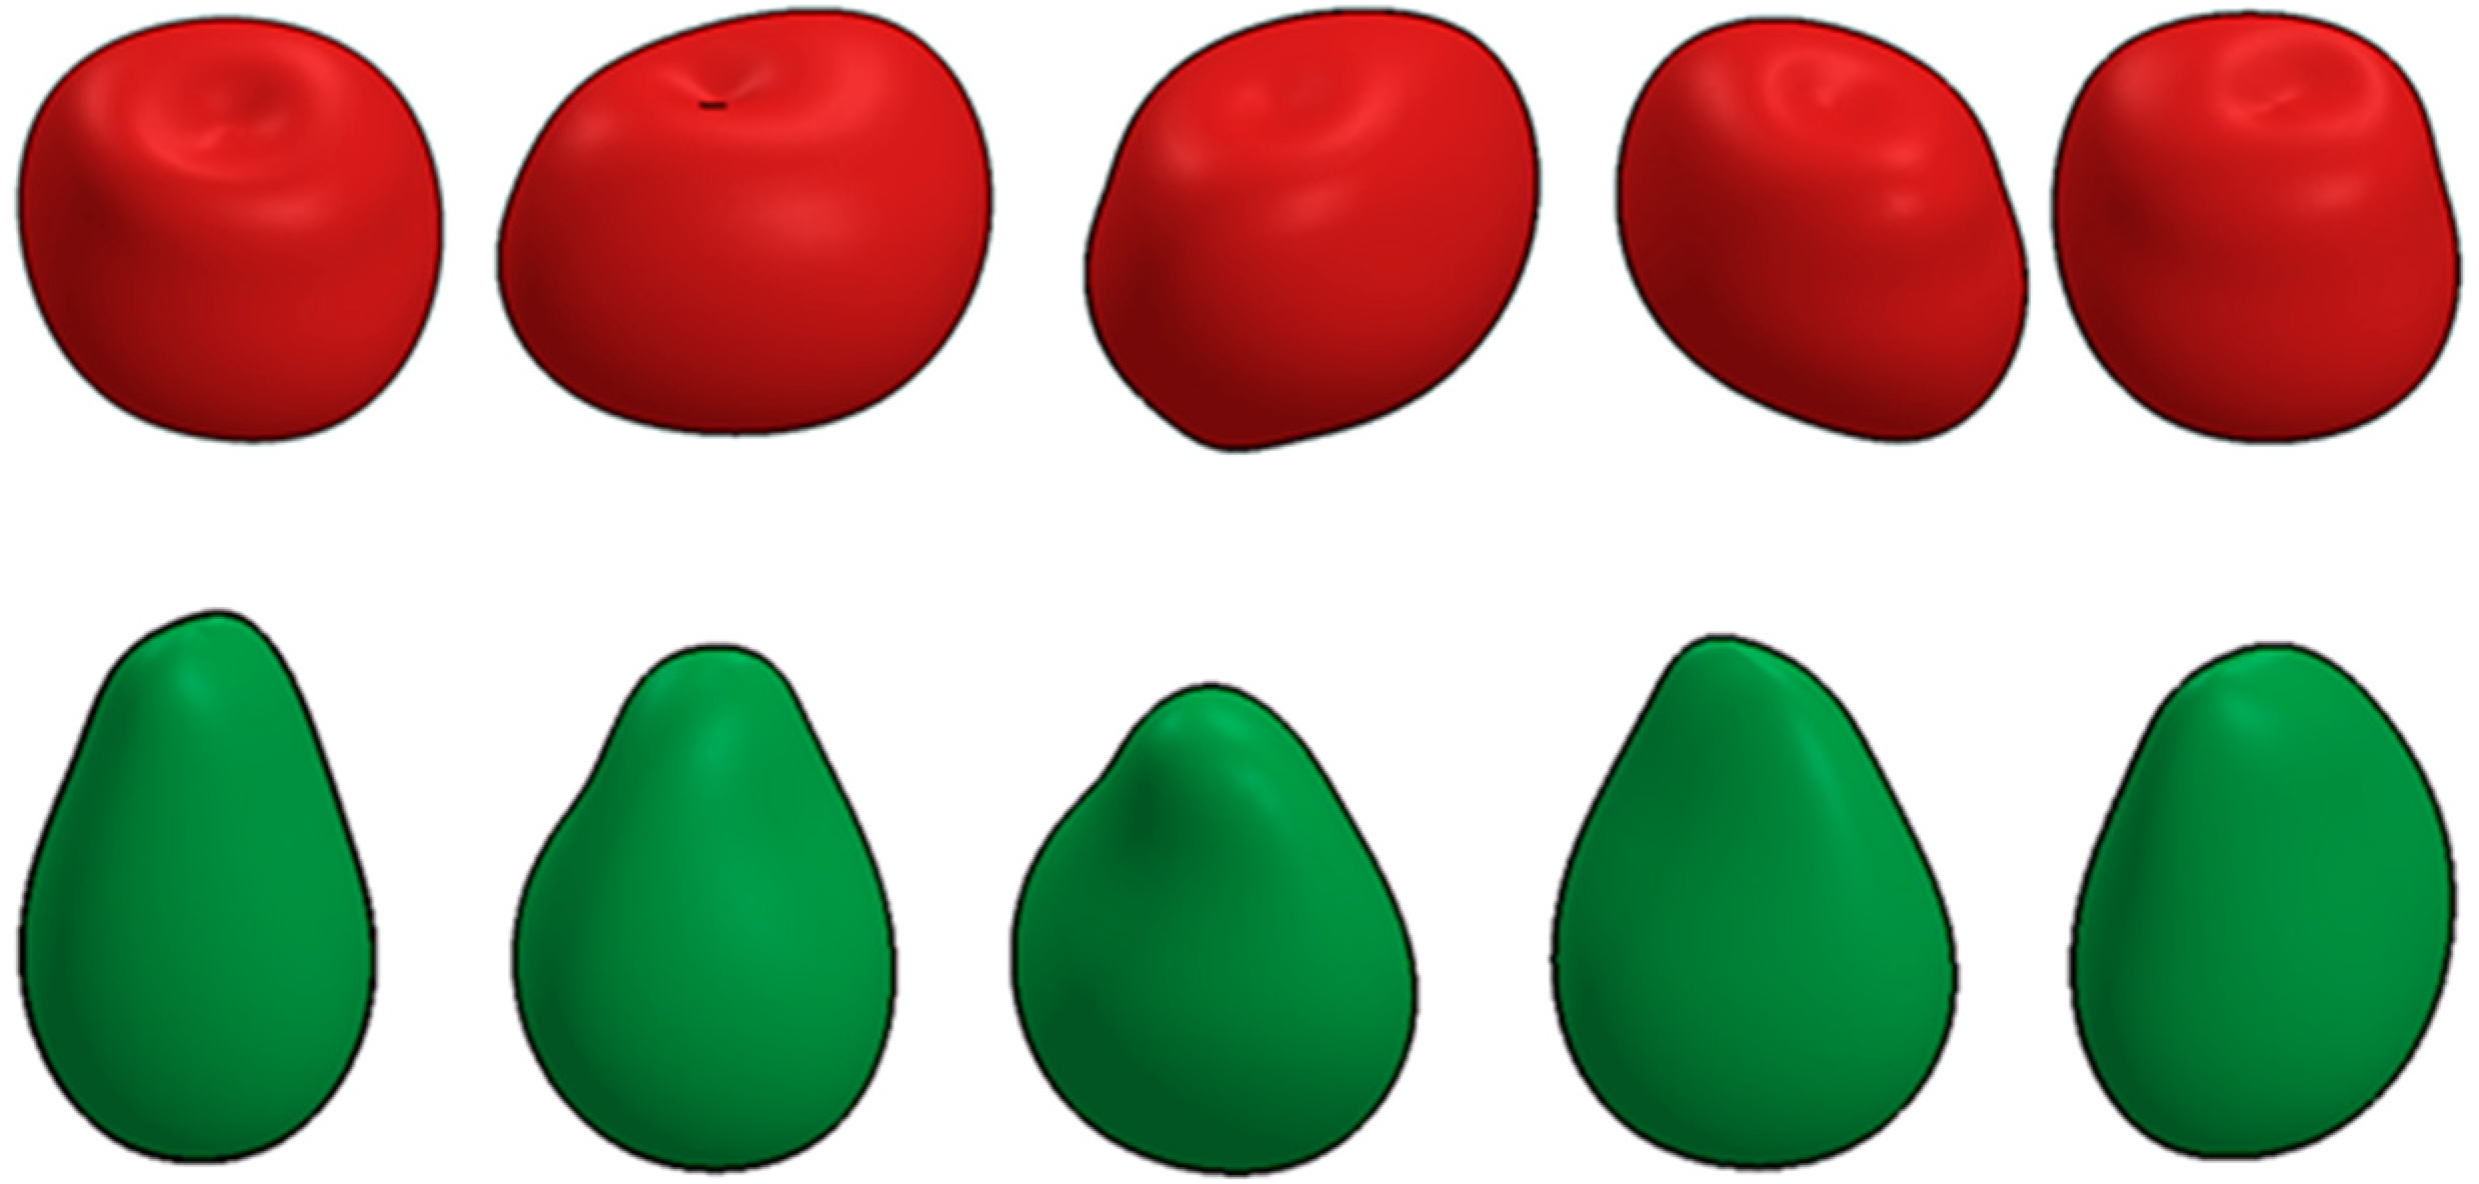
Figure 3.
Illustration of the generic box geometry used to define the spatial extent of the representative elemental volume (REV) of produce. All units are in centimeters (cm). Fifty pieces of produce are packed inside the box to develop the REV.
Figure 3.
Illustration of the generic box geometry used to define the spatial extent of the representative elemental volume (REV) of produce. All units are in centimeters (cm). Fifty pieces of produce are packed inside the box to develop the REV.
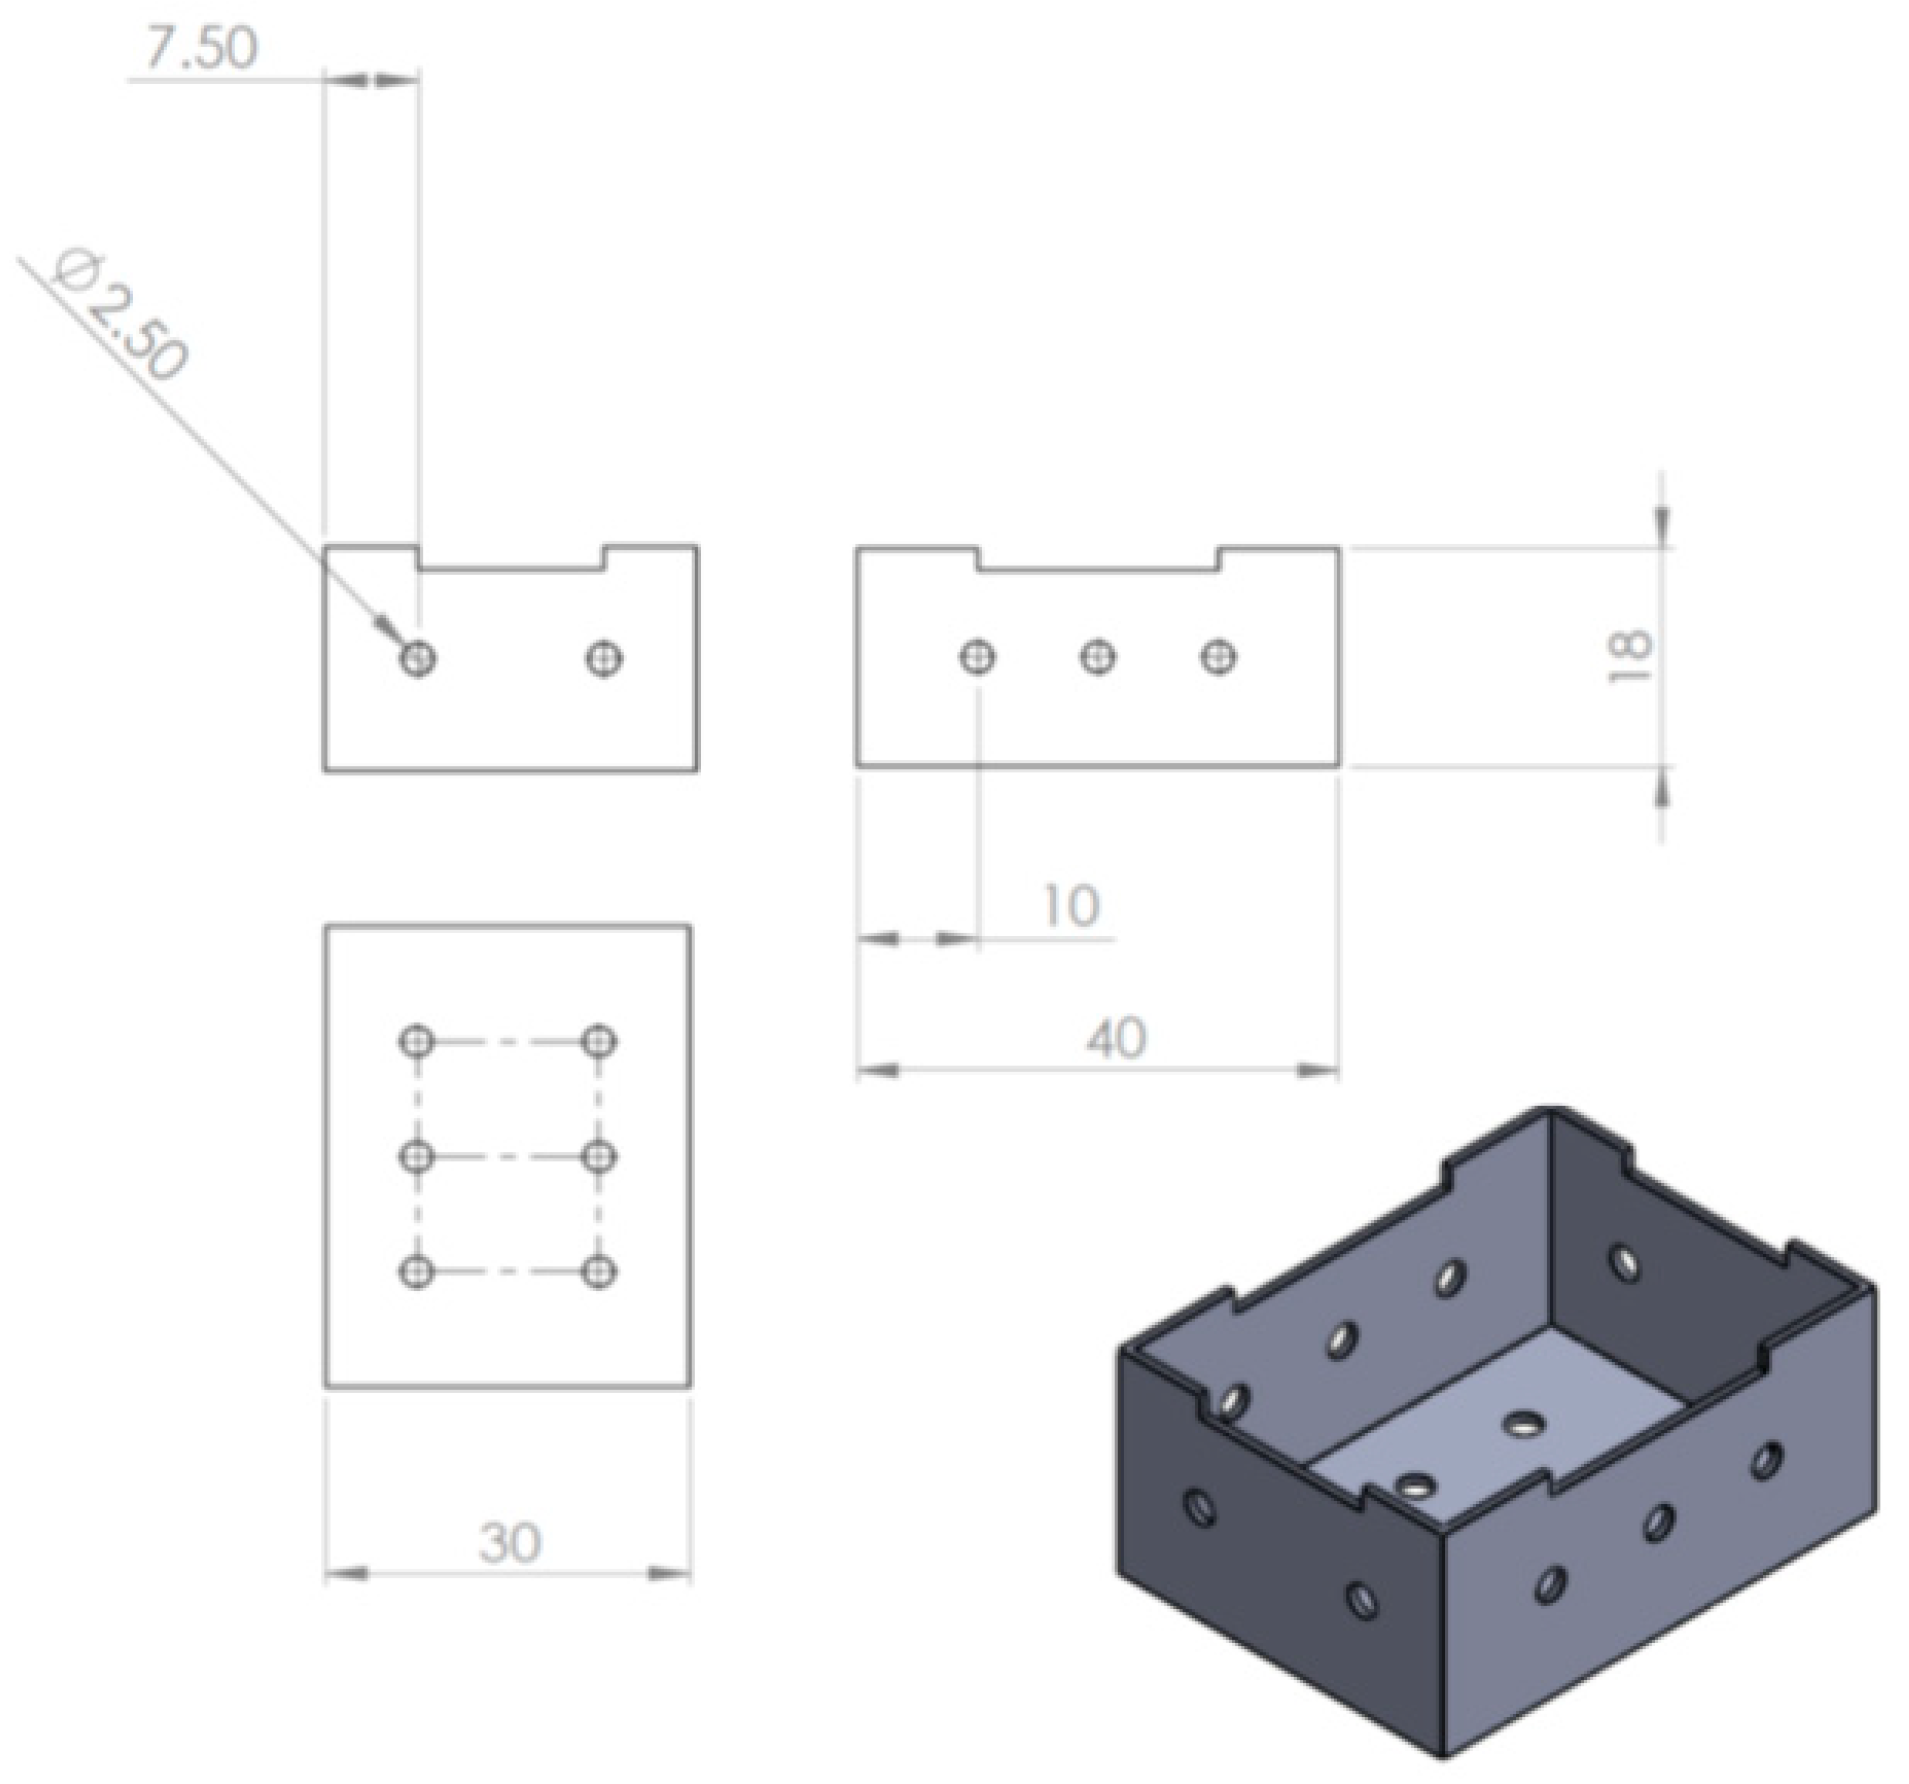
Figure 4.
Illustration of the surface mesh and the clump-of-spheres approach used in YADE to approximate the shape of the tomato (top) and avocado (bottom). The images also show the surface mesh indicated by lines joining the centers of the spherical clumps adjacent to the surface.
Figure 4.
Illustration of the surface mesh and the clump-of-spheres approach used in YADE to approximate the shape of the tomato (top) and avocado (bottom). The images also show the surface mesh indicated by lines joining the centers of the spherical clumps adjacent to the surface.
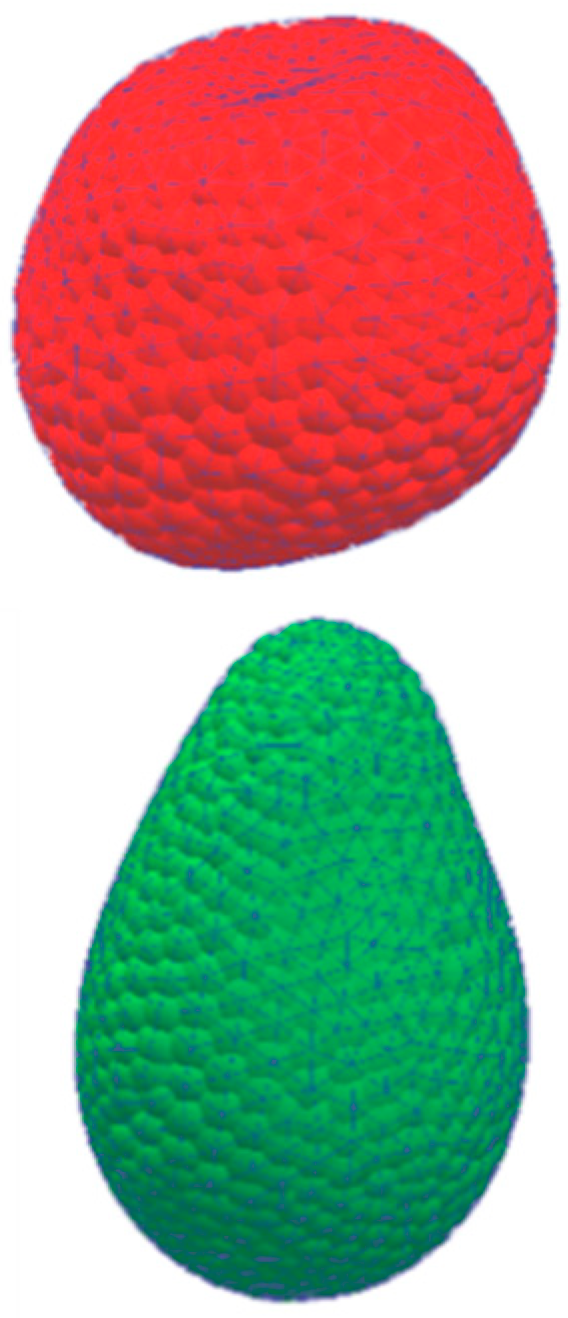
Figure 5.
Two snapshots showing how the random packing of shapes occurs in the Discrete Element Modelling approach YADE. Progress in the model occurs until the shapes can no longer “settle”, which means that no shape will move further under the influence of gravity alone.
Figure 5.
Two snapshots showing how the random packing of shapes occurs in the Discrete Element Modelling approach YADE. Progress in the model occurs until the shapes can no longer “settle”, which means that no shape will move further under the influence of gravity alone.
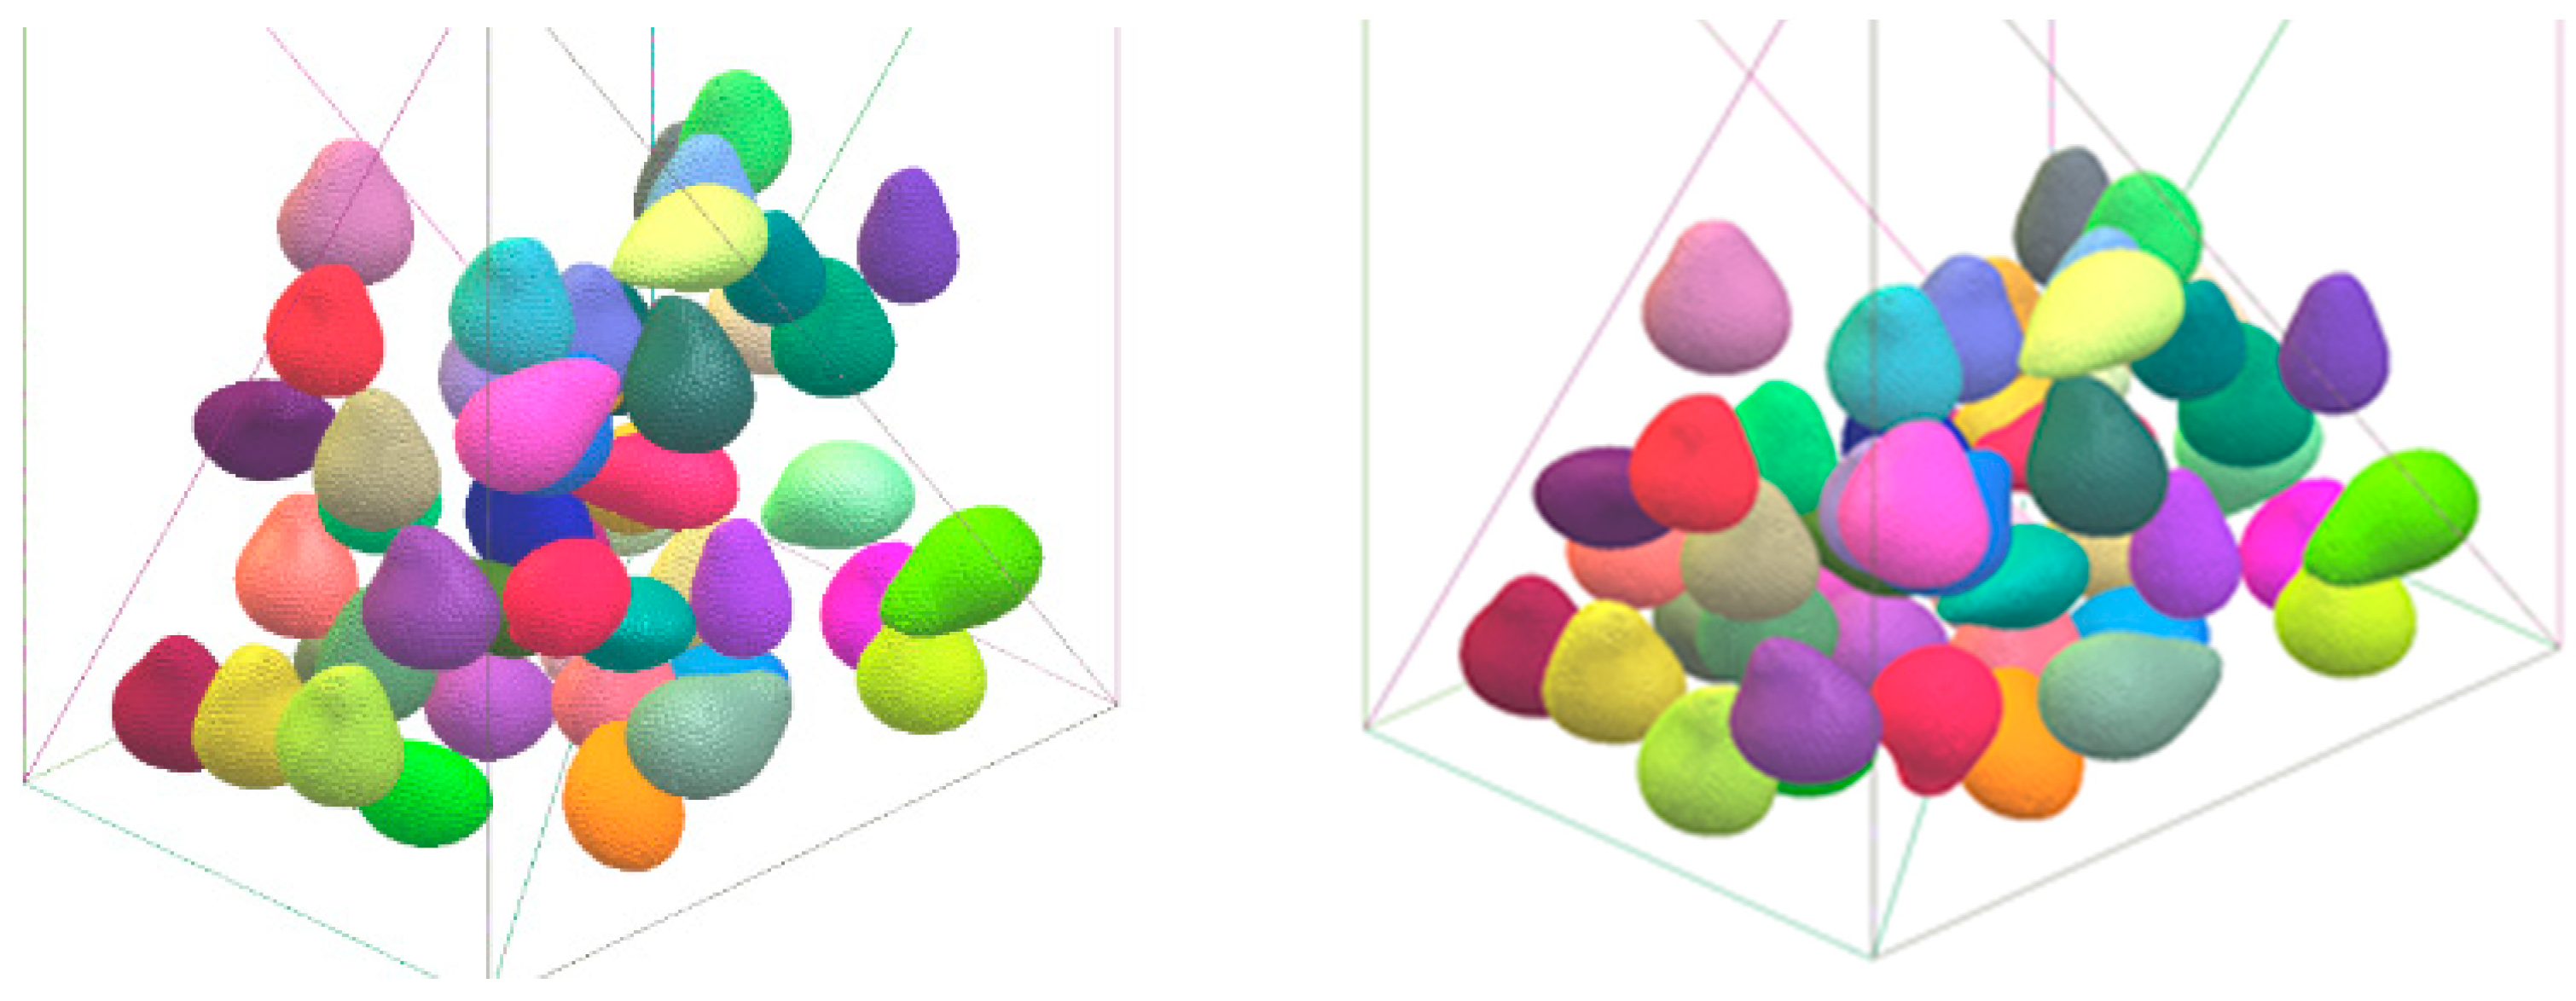
Figure 6.
Representative elemental volumes (REVs) of tomatoes (top) and avocadoes (bottom) generated using YADE. The generic box contains 50 pieces of produce and can serve as a single unit in a much larger stack of produce. The images on the right for each case show the discretized version of the REV.
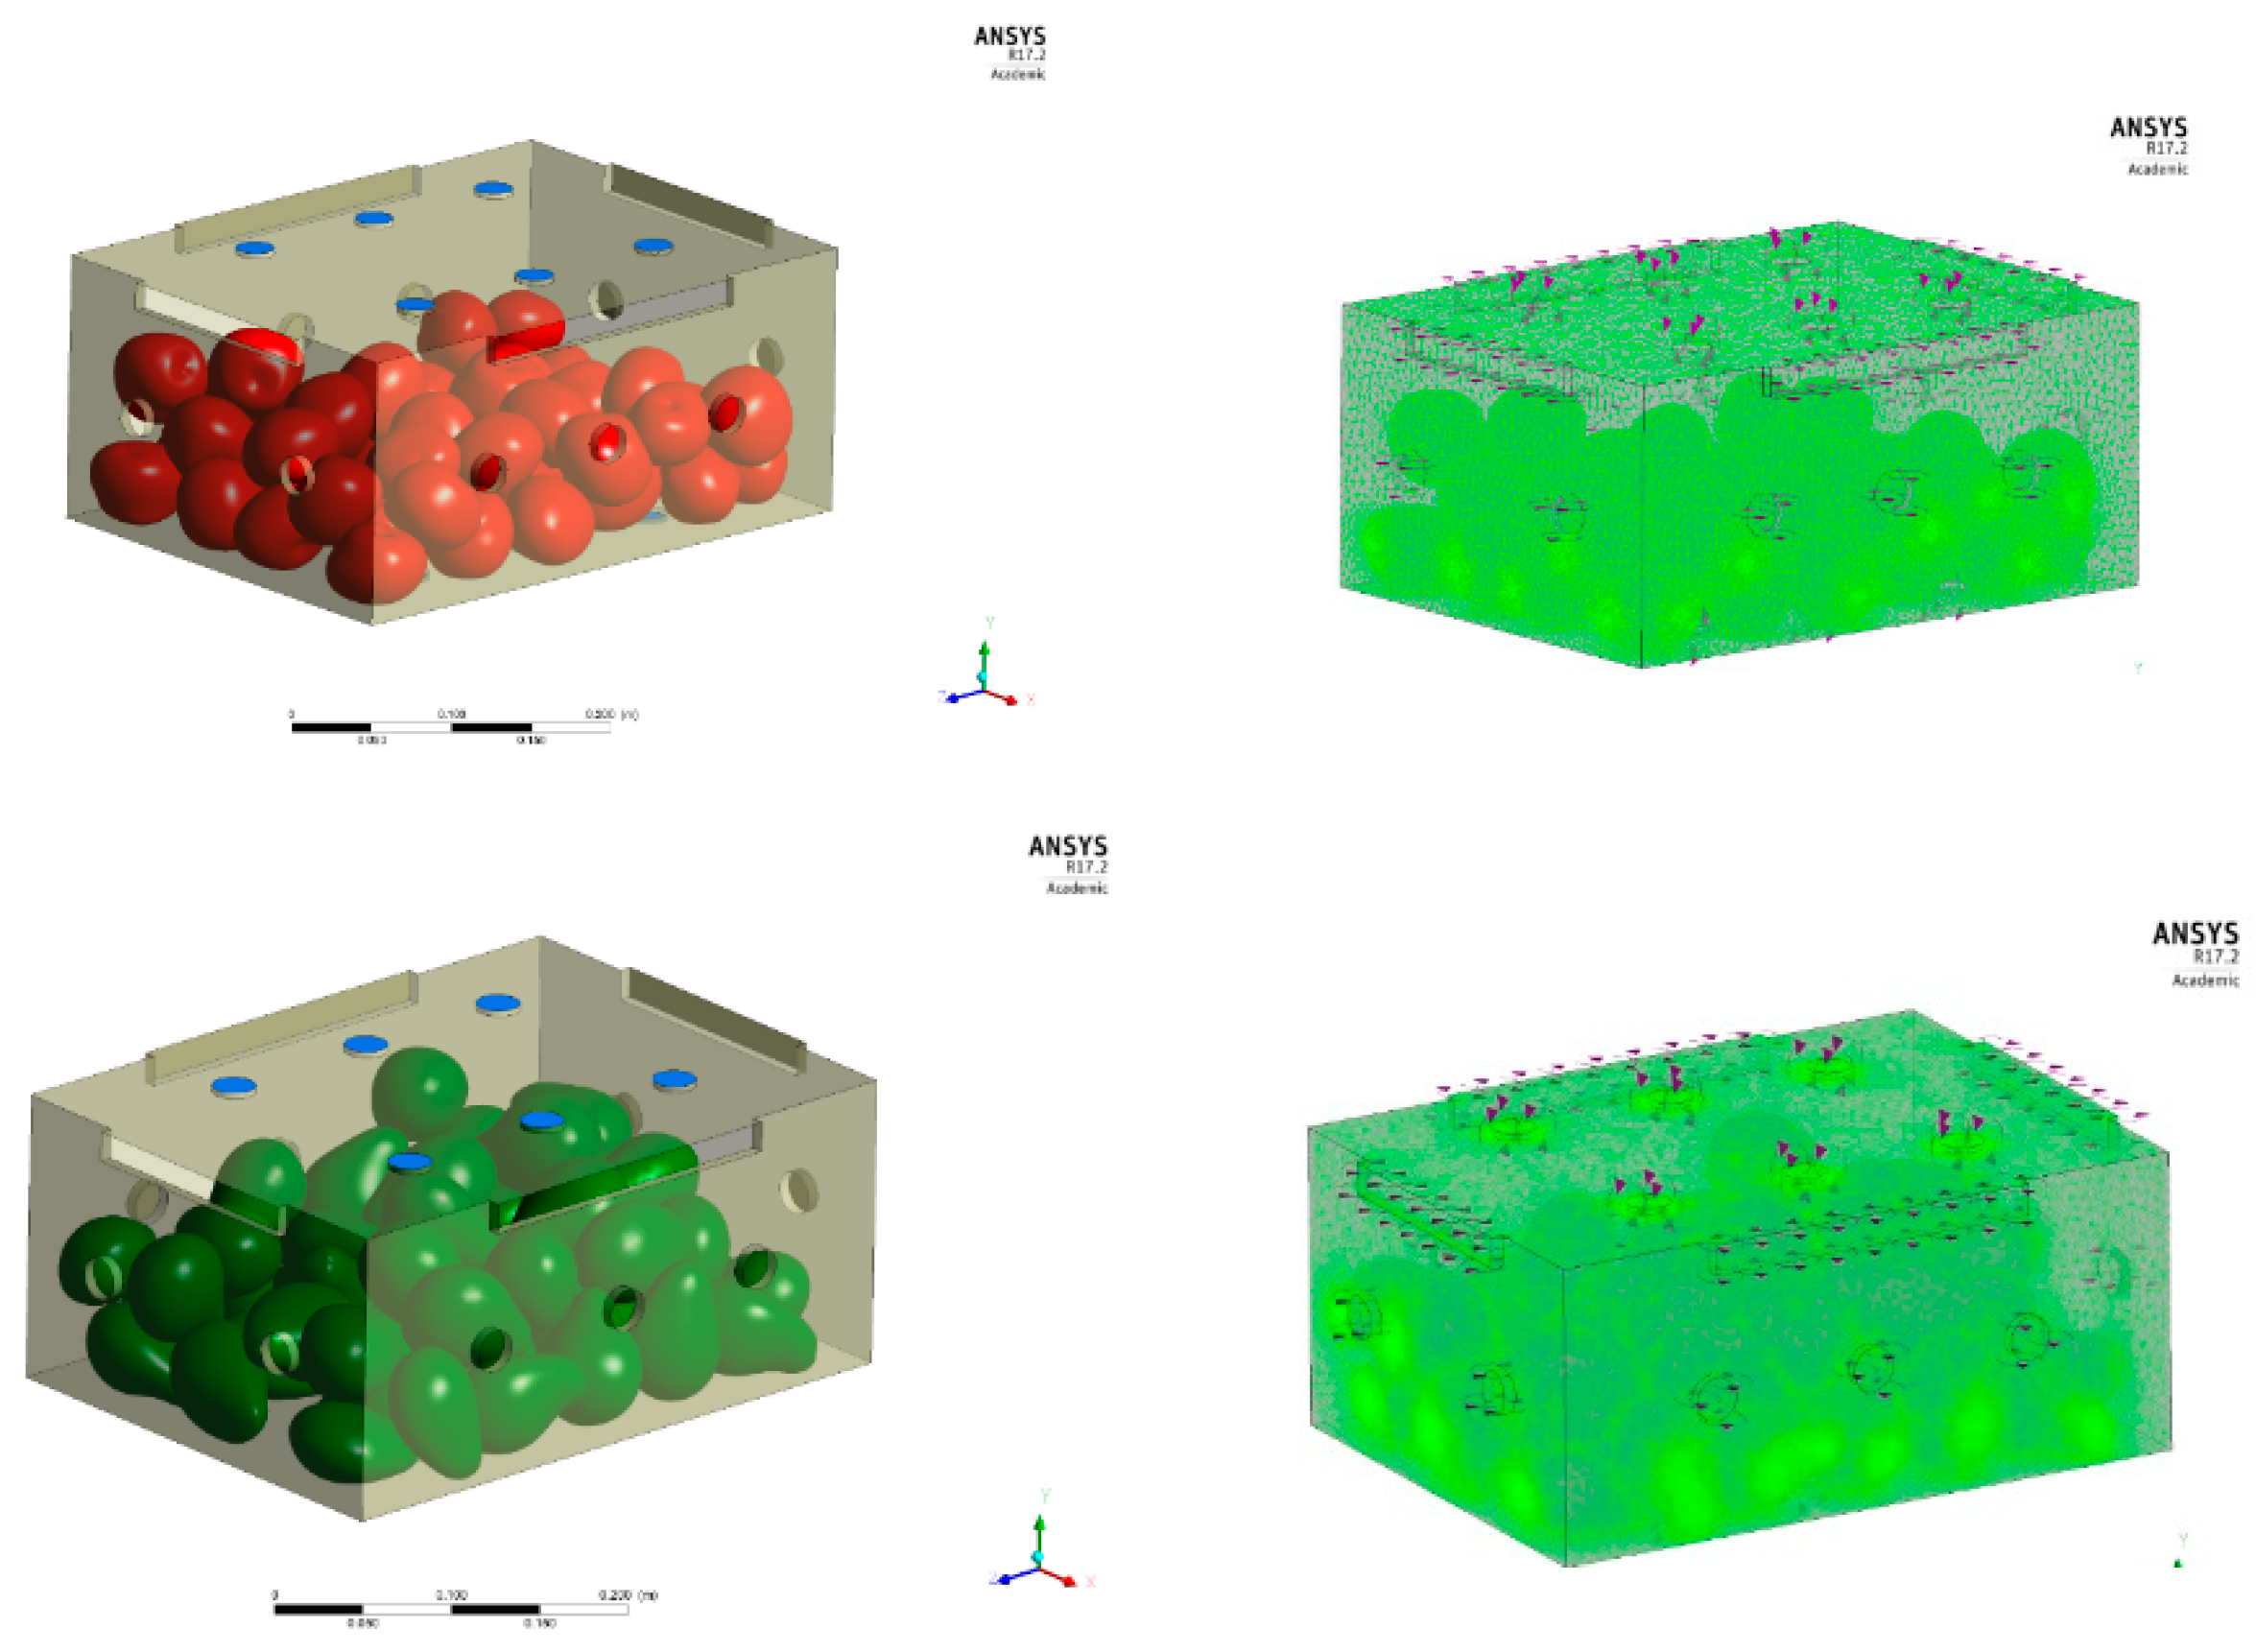
Figure 7.
CFD setup for the 0-D validation cases. Single units of tomato (left) and avocado (right) are placed in cylindrical containers and simulated for six days of storage time to establish respiration coefficients required for the REV simulations.
Figure 7.
CFD setup for the 0-D validation cases. Single units of tomato (left) and avocado (right) are placed in cylindrical containers and simulated for six days of storage time to establish respiration coefficients required for the REV simulations.
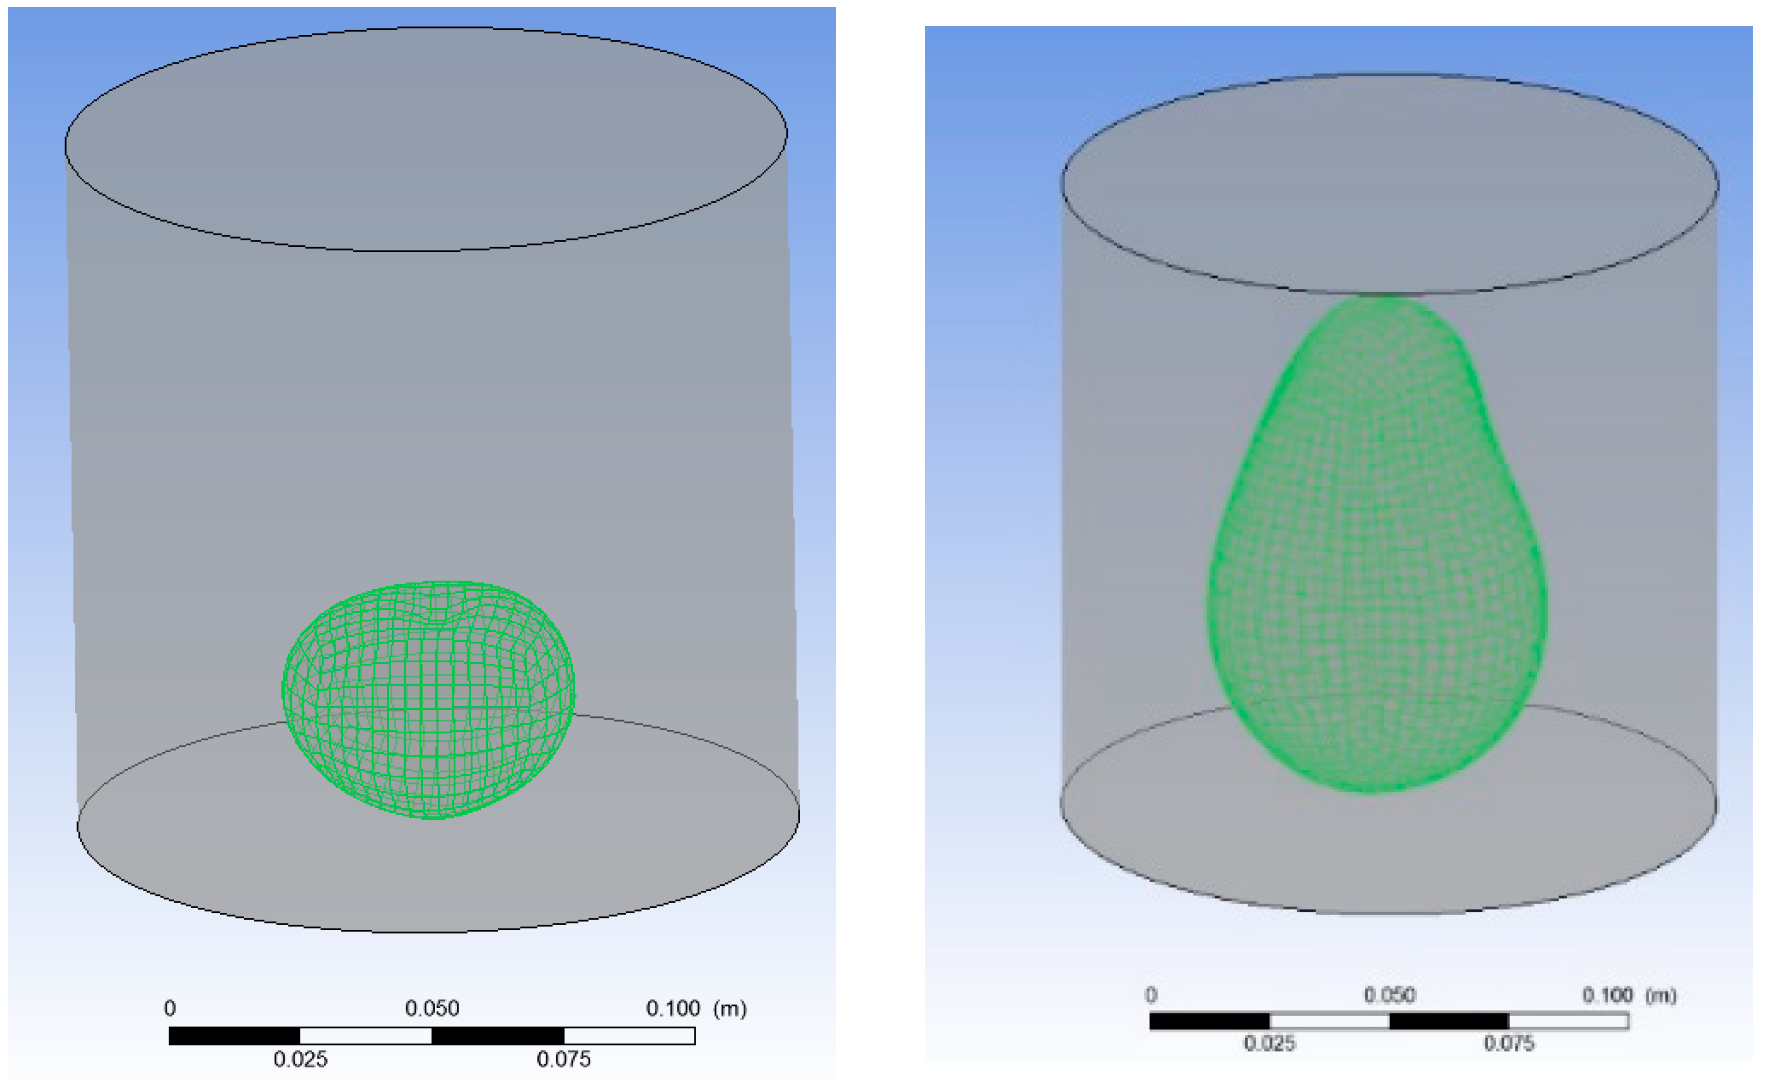
Figure 8.
Validation of the enzyme kinetics implementation to the CFD model for tomatoes and avocadoes. Experimental data are obtained from Castellanos et al. [7,26]. (a) Tomatoes, (b) Avocadoes.
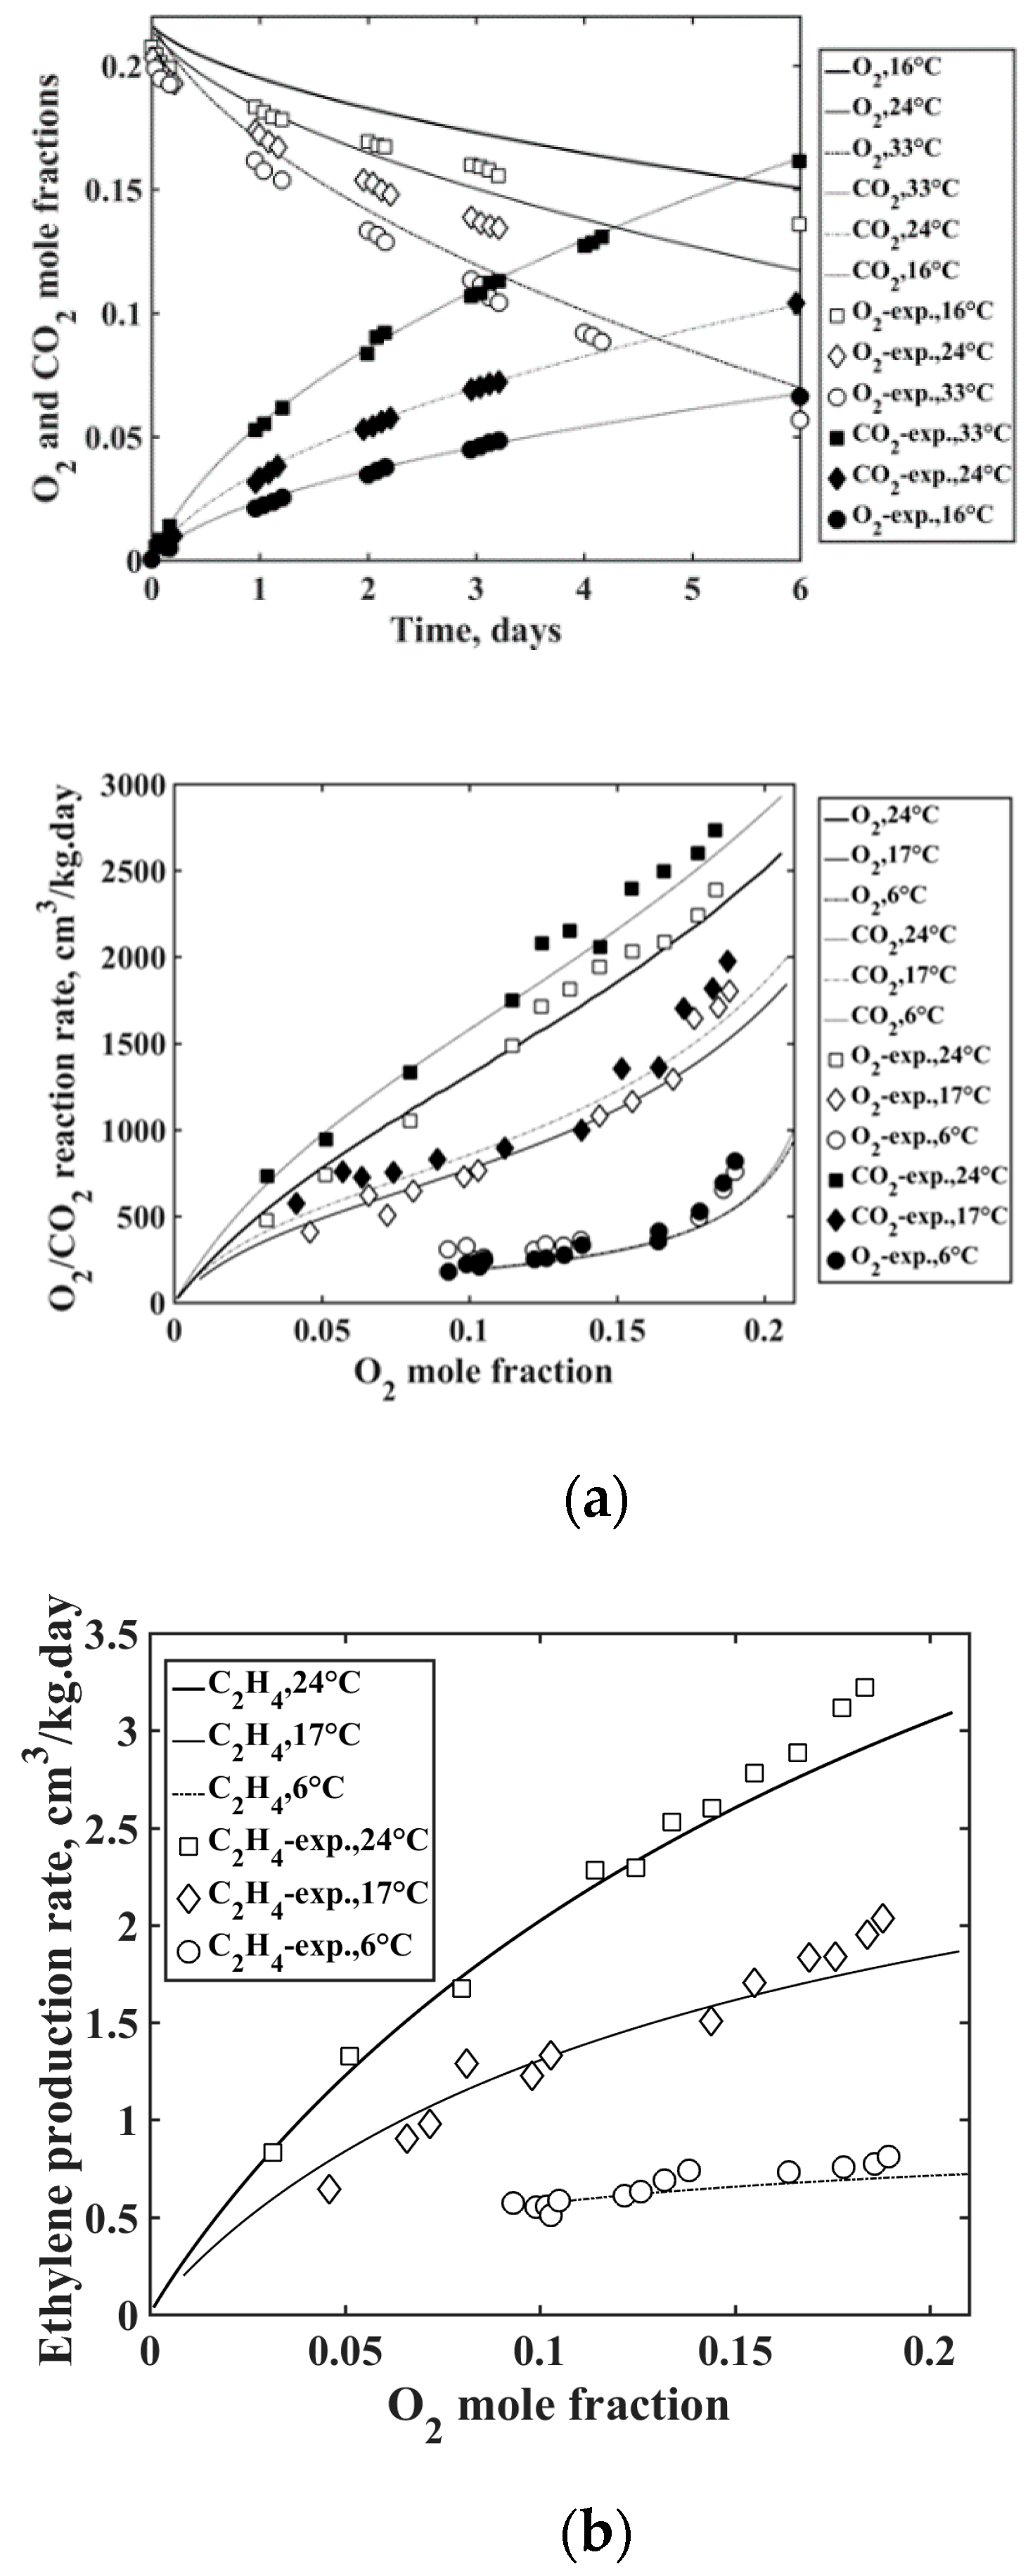
Figure 9.
Plot of pressure drop as a function of the Reynolds number over the range of Reynolds numbers considered.
Figure 9.
Plot of pressure drop as a function of the Reynolds number over the range of Reynolds numbers considered.
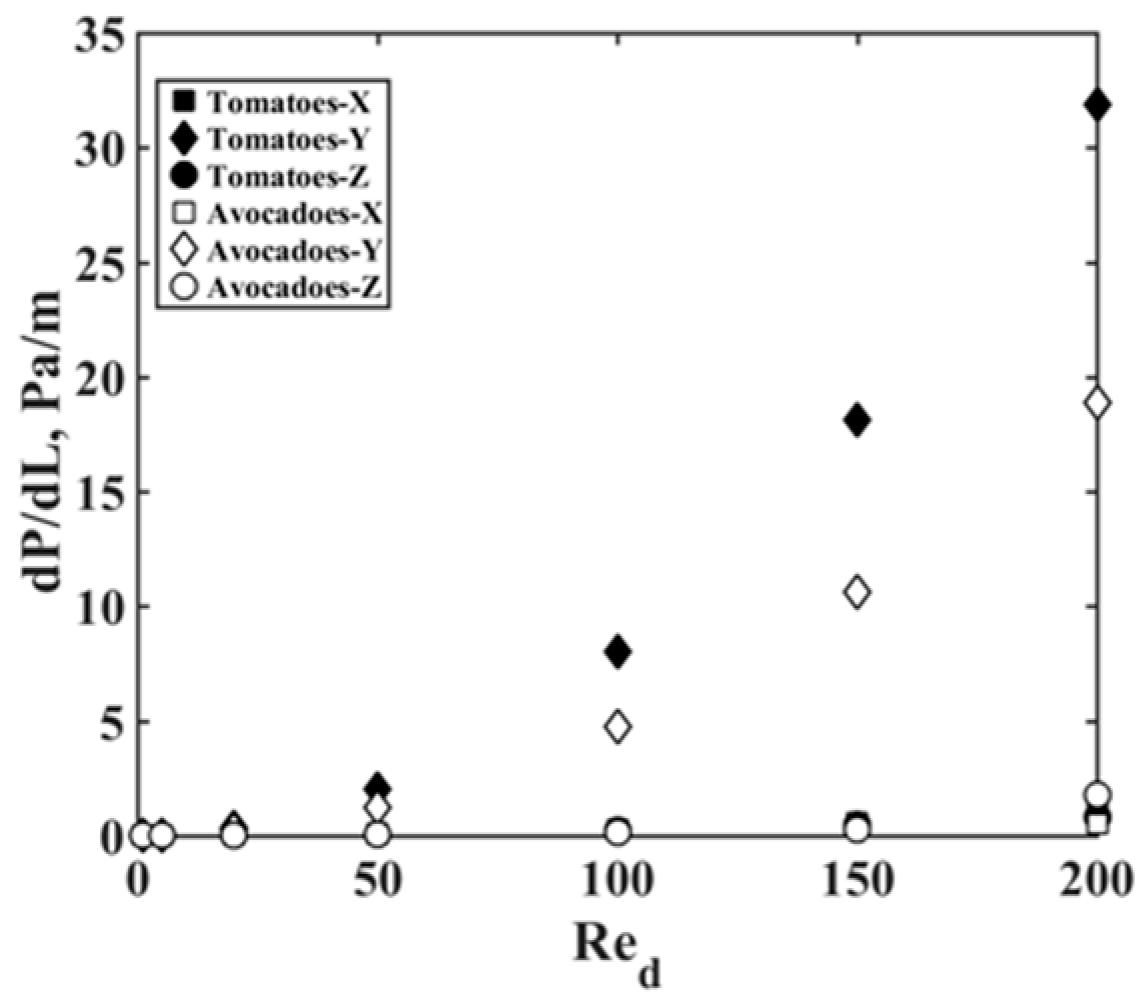
Figure 10.
Nusselt number as a function of Reynolds number for tomatoes and avocadoes over the range of conditions considered.
Figure 10.
Nusselt number as a function of Reynolds number for tomatoes and avocadoes over the range of conditions considered.
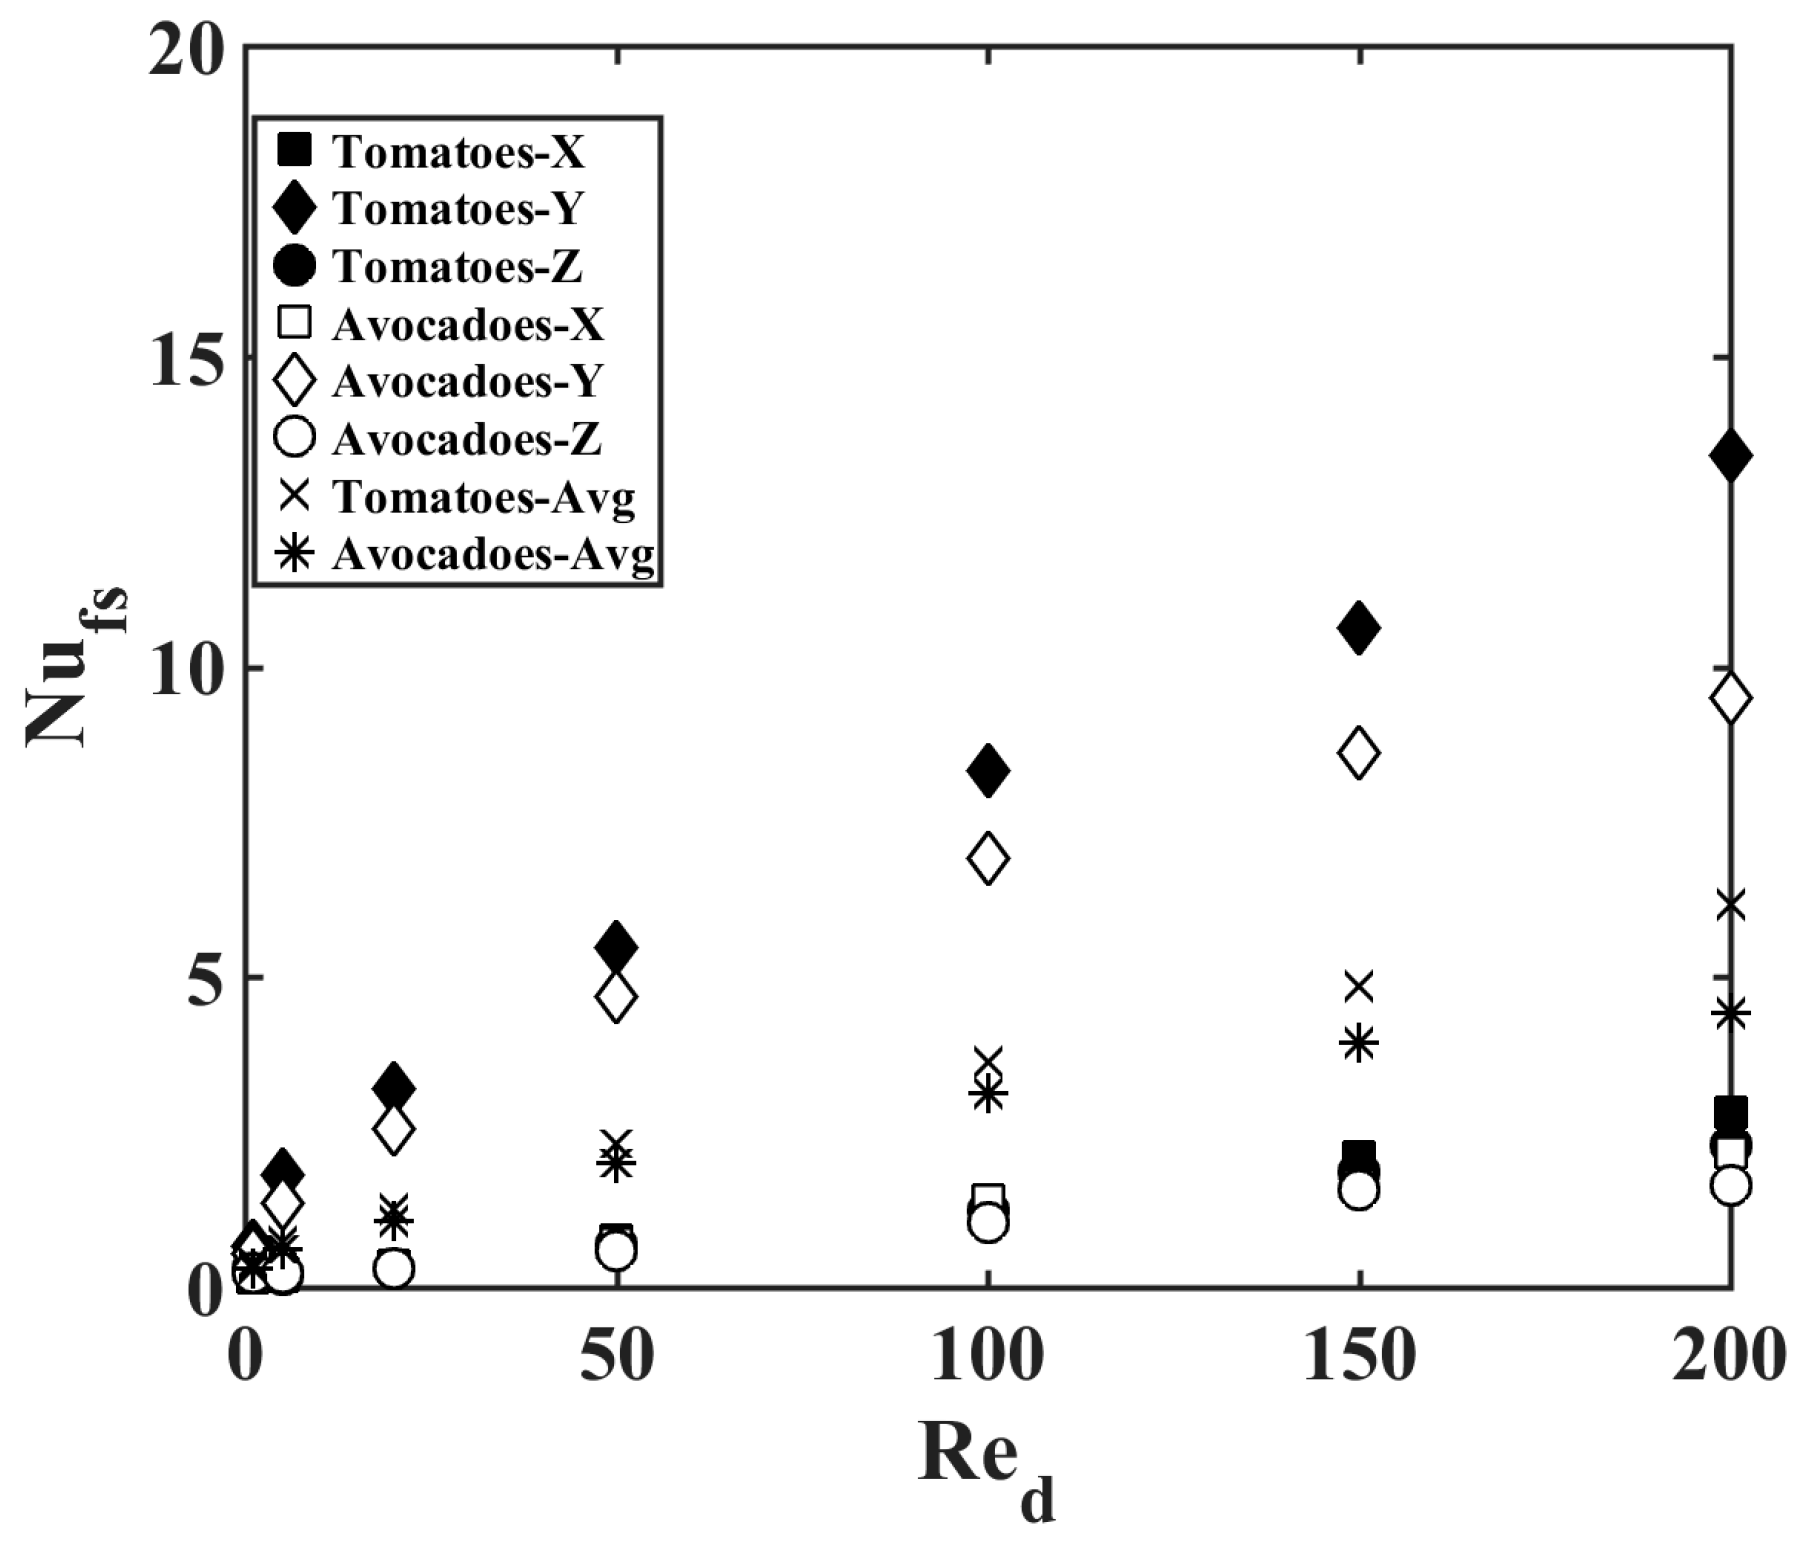
Figure 11.
Contours of mass fractions and temperatures for tomatoes after 52 h of simulated storage time. The top row is for Re = 0.1; the middle row for Re = 1; and the bottom row for Re = 50 with flow in the z direction.
Figure 11.
Contours of mass fractions and temperatures for tomatoes after 52 h of simulated storage time. The top row is for Re = 0.1; the middle row for Re = 1; and the bottom row for Re = 50 with flow in the z direction.
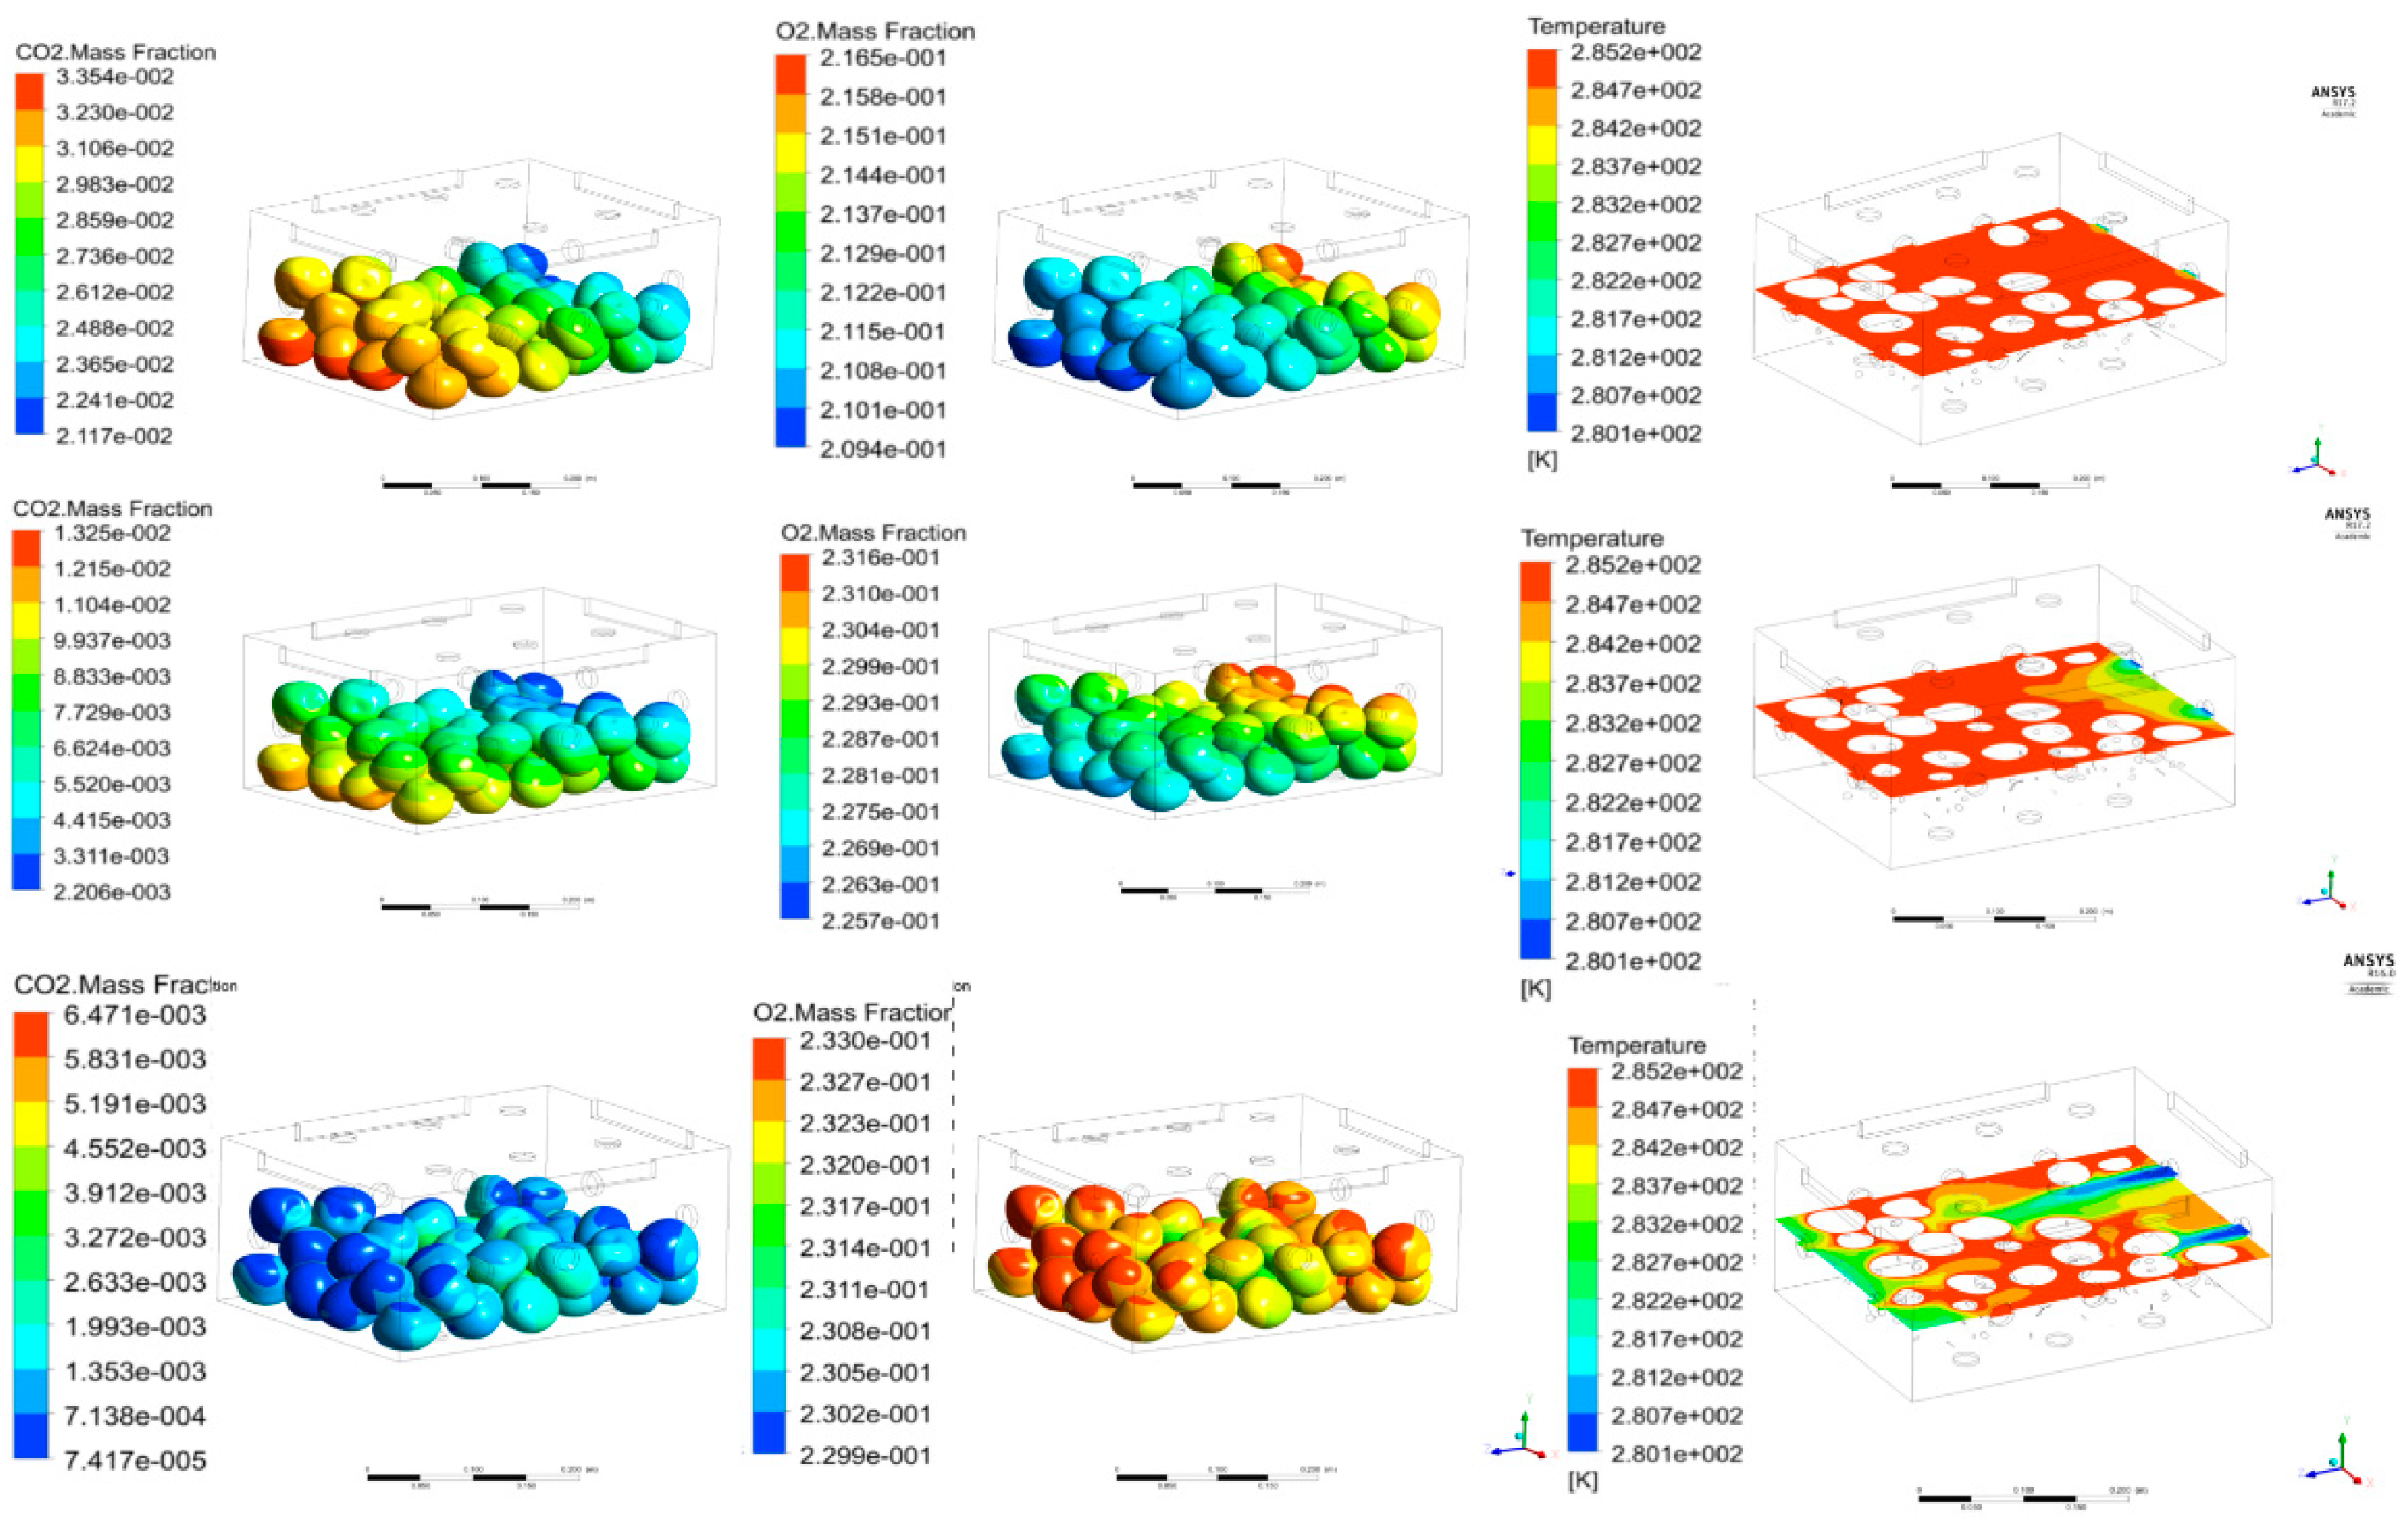
Figure 12.
Contours of mass fractions and temperatures for avocadoes after 52 h of simulated storage time. The top row is for Re = 0.1, the middle row for Re = 1, and the bottom row for Re = 50, with airflow in the z direction.
Figure 12.
Contours of mass fractions and temperatures for avocadoes after 52 h of simulated storage time. The top row is for Re = 0.1, the middle row for Re = 1, and the bottom row for Re = 50, with airflow in the z direction.
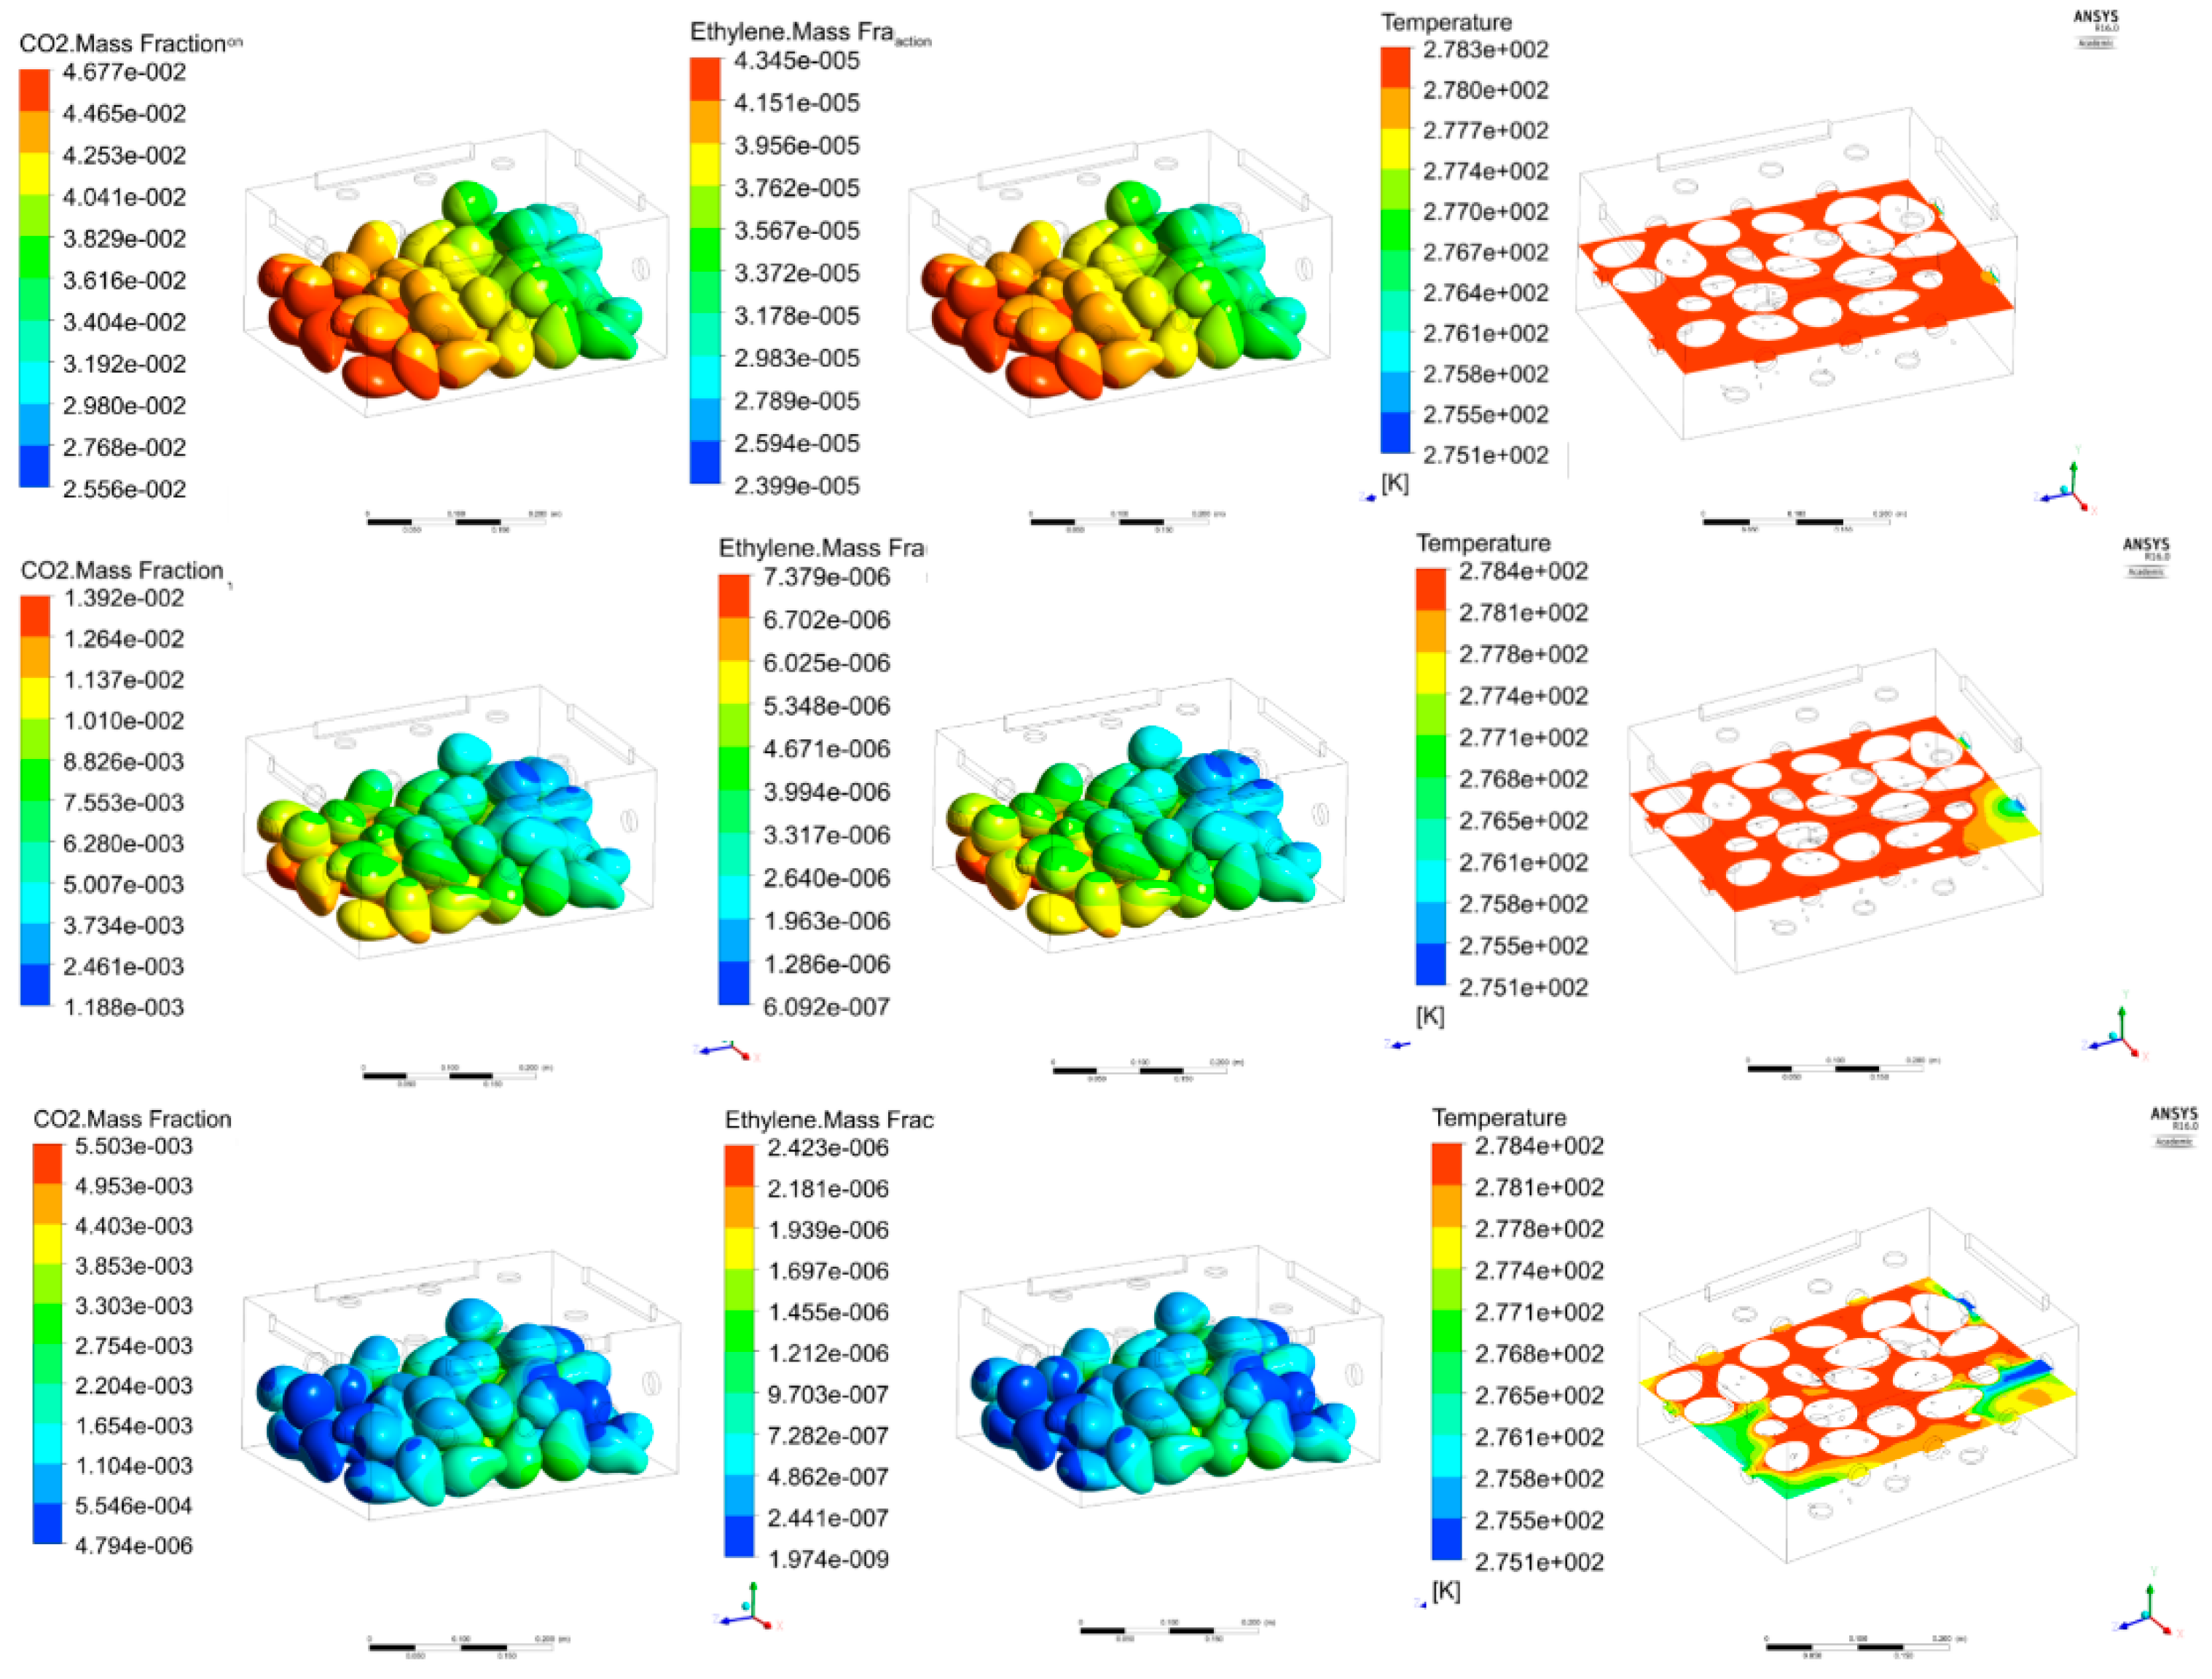
Figure 13.
Contours of ethylene fraction and temperature for avocadoes at Re = 5 after 54 h of simulated storage time with airflow in the z direction. The top row is for storage temperature and bottom row for ambient temperature.
Figure 13.
Contours of ethylene fraction and temperature for avocadoes at Re = 5 after 54 h of simulated storage time with airflow in the z direction. The top row is for storage temperature and bottom row for ambient temperature.

Table 1.
Curve fits to the REV pressure drop data and calculated values of and .
| Tomatoes, x-Dir. | Tomatoes, y-Dir. | Tomatoes, z-Dir. | Avocadoes, x-Dir. | Avocadoes, y-Dir. | Avocadoes, z-Dir. | |
|---|---|---|---|---|---|---|
| 7.403 × 10⁻⁴ | 1.940 × 10⁻³ | 7.091 × 10⁻⁴ | 9.631 × 10⁻⁴ | 3.804 × 10⁻⁴ | 1.00 × 10⁻⁴ | |
| 2.060 × 10⁻⁵ | 7.885 × 10⁻⁴ | 1.670 × 10⁻⁵ | 8.656 × 10⁻⁶ | 4.702 × 10⁻⁴ | 4.252 × 10⁻⁵ | |
| R2-fit | 9.9998 × 10⁻¹ | 9.9998 × 10⁻¹ | 9.9990 × 10⁻¹ | 9.929 × 10⁻¹ | 9.99994 × 10⁻¹ | 9.666 × 10⁻¹ |
| , m2 | 6.080 × 10⁻⁶ | 2.325 × 10⁻⁶ | 6.348 × 10⁻⁶ | 3.739 × 10⁻⁶ | 9.466 × 10⁻⁶ | 3.600 × 10⁻⁵ |
| , m3 | 0.699 | 16.56 | 0.579 | 0.360 | 31.14 | 5.49 |
© 2019 by the authors. Licensee MDPI, Basel, Switzerland. This article is an open access article distributed under the terms and conditions of the Creative Commons Attribution (CC BY) license (http://creativecommons.org/licenses/by/4.0/).
Share and Cite
MDPI and ACS Style
Elhalwagy, M.; Dyck, N.; Straatman, A.G. A Multi–Level Approach for Simulation of Storage and Respiration of Produce. Appl. Sci. 2019, 9, 1052. https://doi.org/10.3390/app9061052
AMA Style
Elhalwagy M, Dyck N, Straatman AG. A Multi–Level Approach for Simulation of Storage and Respiration of Produce. Applied Sciences. 2019; 9(6):1052. https://doi.org/10.3390/app9061052
Chicago/Turabian StyleElhalwagy, Mahmoud, Nolan Dyck, and Anthony G. Straatman. 2019. "A Multi–Level Approach for Simulation of Storage and Respiration of Produce" Applied Sciences 9, no. 6: 1052. https://doi.org/10.3390/app9061052
Note that from the first issue of 2016, this journal uses article numbers instead of page numbers. See further details here.